new york harbor water quality · pdf filepling stations throughout the year that measure four...
TRANSCRIPT

2011NEW YORK HARBORWATER QUALITY REPORT
Michael R. Bloomberg, MayorCarter H. Strickland, Jr., Commissioner

i
Dear Friends,
The New York City Department of Environmental Protection (DEP) is proud to release the 2011 Harbor Water Quality Report. Since 1909, DEP has routinely collected samples from dozens of harbor water sam-pling stations throughout the year that measure four basic parameters: fecal coliform, dissolved oxygen, chlorophyll ‘a’, and secchi transparency. Taken together, these four metrics give a clear indication that the overall health of the city’s surrounding waterways continues to improve to levels not witnessed in more than a century.
Under Mayor Bloomberg’s leadership, the city has invested more than $10 billion to improve the quality VM�V\Y�OHYIVY�^H[LYZ��+LWP[L�H�MV\Y�HSHYT�ÄYL�H[�[OL�5VY[O�9P]LY�>HZ[L^H[LY�;YLH[TLU[�7SHU[�PU�1\S`�������Hurricane Irene in August 2011, and the wettest summer on record, harbor water quality continued to im-prove in 2011.
Keeping our harbor waters as pristine as possible is not just a matter of aesthetics; it directly impacts New Yorkers’ quality of life, and is a key factor in the continued growth and prosperity of the City. A clean, healthy harbor is a place where people want to work, play, and raise a family. A waterfront that is safe and inviting will attract the new investments that have been made possible by Mayor Bloomberg’s visionary re-zonings of large parts of the city, including Greenpoint/Williamsburg in Brooklyn and Hunters Point South in Queens. That’s why we will continue to make the investments necessary to sustain and extend this prog-ress, and why improving the quality of New York Harbor is a major component of Strategy 2011-2014, our MHY�YLHJOPUN�Z[YH[LNPJ�WSHU�[V�THRL�+,7�[OL�ZHMLZ[��TVZ[�LMMLJ[P]L��JVZ[�LMÄJPLU[��HUK�[YHUZWHYLU[�^H[LY�utility in the nation.
I hope you will take the time to learn more about what we do by visiting www.nyc.gov/dep.
All the best,
Carter H. Strickland, Jr. Commissioner

iii
Table of Contents
Introduction ..............................................................................................................................................................6
Harbor-Wide Improvements ...................................................................................................................................7
Four Major Indicators of Environmental Change .................................................................................................9
Common Water Use and Standards for Fresh and Saline Waters ......................................................................9
The Inner Harbor ...................................................................................................................................................10
Fecal Coliform .........................................................................................................................................................10
Dissolved Oxygen ...................................................................................................................................................11
Chlorophyll ‘a’ .........................................................................................................................................................12
Secchi Transparency ...............................................................................................................................................12
The Upper East River–Western Long Island Sound ...........................................................................................14
Fecal Coliform .........................................................................................................................................................14
Dissolved Oxygen ...................................................................................................................................................15
Chlorophyll ‘a’ .........................................................................................................................................................16
Secchi Transparency ...............................................................................................................................................17
Jamaica Bay ...........................................................................................................................................................18
Fecal Coliform .........................................................................................................................................................18
Dissolved Oxygen ...................................................................................................................................................19
Chlorophyll ‘a’ .........................................................................................................................................................20
Secchi Transparency ...............................................................................................................................................21
The Lower NY Bay–Raritan Bay ...........................................................................................................................22
Fecal Coliform .........................................................................................................................................................22
Dissolved Oxygen ...................................................................................................................................................23
Chlorophyll ‘a’ .........................................................................................................................................................24
Secchi Transparency ...............................................................................................................................................24
2011 Harbor Water Monitoring Sites ...................................................................................................................25

1
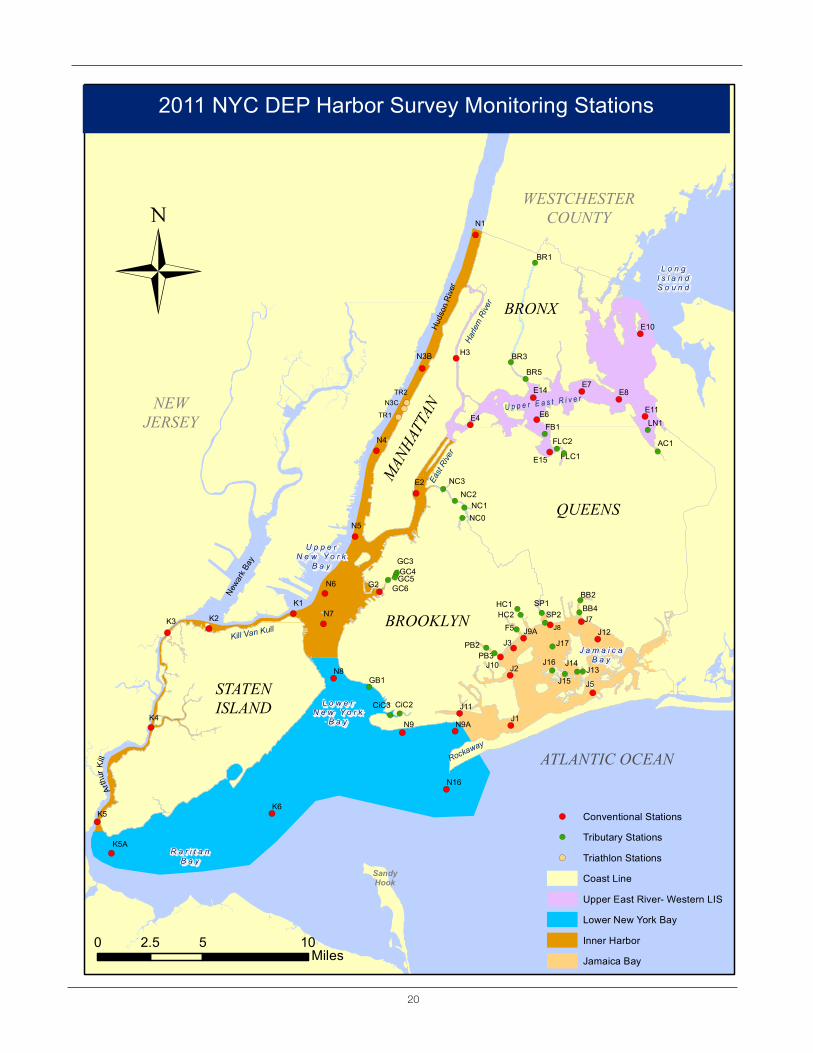
The New York City Harbor Survey has been reporting on the condition of the City’s waterways since 1909. The survey was initiated by the Metropolitan Sewerage Commission in response to public outcry about fouled waterways, at a time when most of the sewage generated in the city was released without any treatment. Since then, the survey has grown, both in the number of sites monitored (from 20 in 1909 to 71 in 2011) and the types of parameters that are monitored. In 2011, DEP began posting water quality sampling data on our website.
DEP collects harbor samples at stations weekly from June through September, and every other week from October through May. In addition, the New York City Department of Health and Mental Hygiene conducts water quality monitor-ing at all New York City beaches on a daily basis during the summer.
The information presented in the Harbor Water Survey is used by municipal planners, regulatory agencies, academic institutions, and local citizens to develop sound public poli-cies. Over the past decade, the City has invested more than
$10 billion in wastewater treatment and control, and harbor water quality is on average the highest it has been since the monitoring program began.
To further improve and protect New York City’s waterways, +,7�OHZ�PU]LZ[LK�PU�Z\Z[HPUHISL�WYHJ[PJLZ�[V�HKKYLZZ�ÅVVK-PUN�� JVUK\J[LK� WYVNYHTZ� [V� YLTV]L� ÅVH[HISLZ� HUK� KLIYPZ�from the waterways, and organized beach clean-up and protection programs. These include the Floatable Action and Boom and Skim programs, Shoreline Survey/Sentinel Monitoring, and Enhanced Beach Protection.
This annual New York Harbor Water Quality Report pro-vides data collected by the New York City Department of Environmental Protection (DEP) during 2011. It is presented in four sections, each delineating a geographic region within the harbor. Four water quality parameters, used as key indi-cators, are evaluated: fecal coliform bacteria, chlorophyll ‘a,’ dissolved oxygen, and Secchi transparency. A discussion of enterococci bacteria, which the US Environmental Protection Agency is now using as a water quality indicator, is also in-cluded in this year’s report.
Introduction

2
According to Central Park precipitation records, 2011 was the wettest year (72.81”) in Central Park with a record rainfall of 25.3” between June and August; and August was the wettest calendar month ever with 18.95” of rain. The excessive pre-cipitation during the summer caused short-term spikes in fecal coliform levels, which is typical af-ter heavy rains cause the wastewater system to KPZJOHYNL�JVTIPULK�ZL^LY�V]LYÅV^��*:6���-LJHS�Coliform counts were elevated throughout the New York harbor area after record rainfalls on August 14 (5.81”) and after Hurricane Irene on August 27-28 (6.87”). The regional average fecal coliform count was 181 cells/100mL in 2011, compared to 31 cells/100mL in 2010.
To meet the sampling schedule for Long Term Control Plans, DEP added six tributary stations the Harbor Survey to bring the total number of sam-pling stations to 71 in 2011.
In 2011, average summer surface temperature reached 22.94 °C, the second highest average since 1968. The record was set in 1991 when the average temperature reached 22.96 °C.
In comparison to 2010, the summer geometric means increased to 96 cells/100mL for fecal coli-form and 5 cells/100mL for Enterococci. However, both remained well below the New York State Department of Environmental Conservation (DEC) standards for bathing and recreational use.
In summer 2011, harbor-wide average dissolved oxygen for both surface and bottom waters re-mained high: 6.6 mg/L and 5.8 mg/L, respectively.
Harbor-wide, chlorophyll ‘a’ averaged 11 µg/L in surface water in the summer of 2011, a decrease MYVT�����N�3�PU��������;OL�TVZ[�ZPNUPÄJHU[�JOSV-rophyll ‘a’ reductions can be found in Jamaica Bay as a result of upgrades to wastewater treatment plants.
Secchi transparency continued to decline in 2011. Total Suspended Solids (TSS) have increased slightly, from an average of 8 mg/L in surface wa-ters and 11 mg/L in bottom waters in 2010 to 12 mg/L and 19 mg/L in 2011, respectively. Average Secchi depth decreased from 4.0 ft in 2010 to 3.7 ft in 2011. An increased in wet sampling days were the primary cause of increased turbidity in New York Harbor. In the summer of 2011 there were 16 wet weather sampling days, compared to 10 in 2010. Another contributing factor was the massive PUÅV^�VM�ZLKPTLU[Z�MYVT�\WYP]LY�ZV\YJLZ�[OYV\NO-out the Hudson and Mohawk Valleys.
Harbor-Wide Improvements
5
6
7
35
40
45
50ft
)/L)
a (u
g/L)
Chl a SurfaceTSS TopTSS BottomSecchi Depth
0
1
2
3
4
0
5
10
15
20
25
30
Sec
chi D
epth
(f
TSS
(mg/
Chl
orop
hyll
a
Year
Harbor-Wide Fecal Coliform and Enterococci
Harbor-Wide Dissolved Oxygen
Harbor-Wide Chlorphyll ‘a’ and Secchi Depth
)LJXUH��
)LJXUH��
)LJXUH��
8
10
(mg/
L)
DO Surface
DO Bottom
0
2
4
6
Dis
solv
ed O
xyge
n
Year
Fishing Class Standard
Bathing Class Standard
1000
10000
ls/1
00m
L)
Fecal Coliform Fishing Standard
1
10
100
Bac
teria
l Cou
nts
(Cel
l
Year
Fecal Coliform
Enterococci
Fecal Coliform Bathing Standard
Enterococci Bathing Standard

3
New York Harbor is the cleanest it has been in more than 100 years of testing. In September 2010, Mayor Bloomberg unveiled the NYC Green Infrastructure Plan, which will improve harbor water quality even further by capturing and retaining stormwater runoff before it enters the sewer system. New York City, like other older urban centers, is largely serviced by a combined sewer system where stormwater and wastewater are carried through a single pipe. During heavy storms, the system often reaches capacity and must discharge a mix VM�Z[VYT^H[LY�HUK�^HZ[L^H[LY·JHSSLK�H�JVTIPULK�ZL^LY�V]LYÅV �̂�VY�*:6·into New York Harbor. The plan, which includes $2.4 billion in public and pri-]H[L�ZWLUKPUN�MVY�NYLLU�PUMYHZ[Y\J[\YL��^PSS�YLK\JL�[OLZL�ZL^LY�V]LYÅV^Z�I`�40% by 2030. This approach will also save billions over the next 20 years because it will reduce more costly investments in traditional sewage retention projects, like tanks and tunnels. Green infrastructure uses vegetation, soils, and other structural elements to absorb and evaporate water and to mimic natural areas and hydrologic cycles. These types of projects are a key com-ponent of PlaNYC’s sustainability effort because they also shade and cool the city, improve air quality, and increase property values. These characteristics, the minimal energy and manpower required for operation, and the relatively quick installation mean that green infrastructure can be cost-effective and WYV]PKL�PTTLKPH[L�ILULÄ[Z�
Strategy 2011-2014In February 2011, Mayor Michael R. Bloomberg and then Environmental Protection Commissioner Cas Holloway unveiled Strategy 2011-2014, a far-reaching strategic plan that lays out 100 distinct initiatives to make DEP [OL� ZHMLZ[��TVZ[� LMÄJPLU[�� JVZ[�LMMLJ[P]L�� HUK� [YHUZWHYLU[�^H[LY� \[PSP[`� PU� [OL�nation. Each initiative directly advances one of DEP’s core functions: serving nine million water customers; supplying and treating more than one billion gal-lons of water every day; making cost-effective infrastructure investments; and achieving a sustainable quality of life for all New Yorkers. The plan, the prod-uct of a year of analysis and outreach, builds on PlaNYC, Mayor Bloomberg’s sustainability blueprint for New York City. From improving harbor water quality to harnessing clean renewable energy, Strategy 2011-2014 includes bold and achievable initiatives that will improve New Yorkers’ quality of life—at a price they can afford. The plan will guide DEP’s investments and operations over the next four years, and DEP will publish an annual report card on the prog-ress of each initiative. For more information or to download the Strategy, visit www.nyc.gov/dep.
STRATEGY2011-2014
DEP_Strategy_PRESS.indd 1 1/28/11 11:52 AM
“Building on the successes of the past eight years, DEP has developed this exciting strategic plan that lays out the next generation of improvements to our water system, as well as ambitious strategies such as a Green Infrastructure Plan�[V�YLK\JL�JVTIPULK�ZL^LY�V]LYÅV^Z�[OH[�^PSS�[YHUZMVYT�[OL�*P[`�HUK�PTWYV]L�^H[LY�X\HSP[ �̀¹
·�4H`VY�4PJOHLS�9��)SVVTILYN
The NYC Green Infrastructure Plan
4
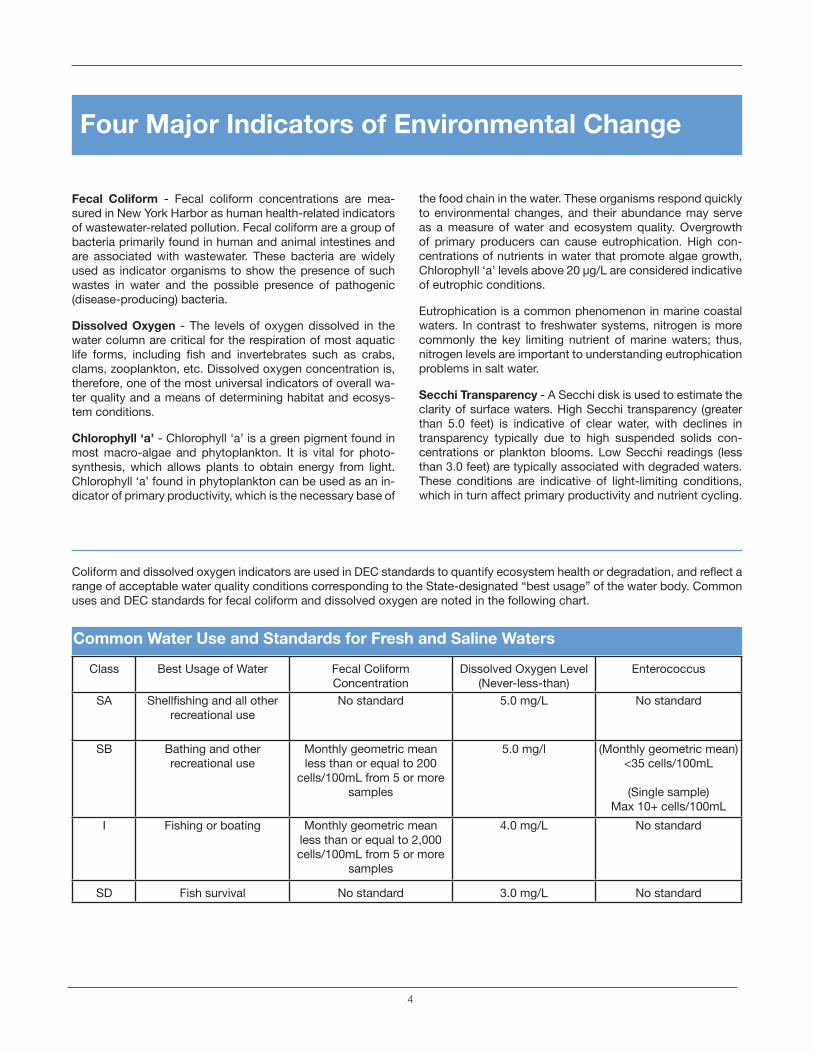
Fecal Coliform - Fecal coliform concentrations are mea-sured in New York Harbor as human health-related indicators of wastewater-related pollution. Fecal coliform are a group of bacteria primarily found in human and animal intestines and are associated with wastewater. These bacteria are widely used as indicator organisms to show the presence of such wastes in water and the possible presence of pathogenic (disease-producing) bacteria.
Dissolved Oxygen - The levels of oxygen dissolved in the water column are critical for the respiration of most aquatic SPML� MVYTZ�� PUJS\KPUN� ÄZO� HUK� PU]LY[LIYH[LZ� Z\JO� HZ� JYHIZ��clams, zooplankton, etc. Dissolved oxygen concentration is, therefore, one of the most universal indicators of overall wa-ter quality and a means of determining habitat and ecosys-tem conditions.
Chlorophyll ‘a’ - Chlorophyll ‘a’ is a green pigment found in most macro-algae and phytoplankton. It is vital for photo-synthesis, which allows plants to obtain energy from light. Chlorophyll ‘a’ found in phyto plankton can be used as an in-dicator of primary productivity, which is the necessary base of
the food chain in the water. These organisms respond quickly to environmental changes, and their abundance may serve as a measure of water and ecosystem quality. Overgrowth of primary producers can cause eutro phication. High con-centrations of nutrients in water that promote algae growth, Chlorophyll ‘a’ levels above 20 µg/L are considered indicative of eutrophic conditions.
Eutrophication is a common phenomenon in marine coastal waters. In contrast to freshwater systems, nitrogen is more commonly the key limiting nutrient of marine waters; thus, nitrogen levels are important to understanding eutrophication problems in salt water.
Secchi Transparency - A Secchi disk is used to estimate the clarity of surface waters. High Secchi transparency (greater than 5.0 feet) is indicative of clear water, with declines in transparency typically due to high suspended solids con-centrations or plankton blooms. Low Secchi readings (less than 3.0 feet) are typically associated with degraded waters. These conditions are indicative of light-limiting conditions, which in turn affect primary productivity and nutrient cycling.
Class Best Usage of Water Fecal Coliform Concentration
Dissolved Oxygen Level (Never-less-than)
Enterococcus
SA :OLSSÄZOPUN�HUK�HSS�V[OLY�recreational use
No standard 5.0 mg/L No standard
SB Bathing and other recreational use
Monthly geometric mean less than or equal to 200
cells/100mL from 5 or more samples
5.0 mg/l (Monthly geometric mean)<35 cells/100mL
(Single sample)Max 10+ cells/100mL
I Fishing or boating Monthly geometric mean less than or equal to 2,000 cells/100mL from 5 or more
samples
4.0 mg/L No standard
SD Fish survival No standard 3.0 mg/L No standard
Four Major Indicators of Environmental Change
*VSPMVYT�HUK�KPZZVS]LK�V_`NLU�PUKPJH[VYZ�HYL�\ZLK�PU�+,*�Z[HUKHYKZ�[V�X\HU[PM`�LJVZ`Z[LT�OLHS[O�VY�KLNYHKH[PVU��HUK�YLÅLJ[�H�range of acceptable water quality conditions corresponding to the State-designated “best usage” of the water body. Common uses and DEC standards for fecal coliform and dissolved oxygen are noted in the following chart.
Common Water Use and Standards for Fresh and Saline Waters

5
&-
&-
!(!(!(!(
&-
&-&-
&-
&-
&-
&-
&-
&-
&-
&-
!(
!(!(
!(
N7
N6
N5
N4
N1
K5
K4
K3K2
K1 G2
E2NC3
NC2NC1NC0
N3B
GC5GC4
GC3
R a r i t a nR a r i t a nB a yB a y
L o w e rL o w e rN e w Y o r kN e w Y o r k
B a yB a y
U p p e rU p p e rN e w Y o r kN e w Y o r k
B a yB a y
Rockaway
J a m a i c aJ a m a i c aB a yB a y
East
River
BRONX
QUEENS
MANHATTAN
BROOKLYN
STATENISLAND
NEWJERSEY
&- Open Water
!( Tributary
Water Classification
SB: Bathing
I: Fishing or Boating
SD: Fish Survival
i
0 3 61.5Miles
Kill Van Kull
Huds
on R
iver
Arthu
r Kill
N1 Mt. St. Vincent N3B West 125th StreetN4 West 42nd StreetN5 Pier A- The BatteryN6 Bell Buoy No. 31N7 Robbins Reef Buoy No. 28G2 Gowanus Channel
Hudson River & Upper NY Bay
East River
E2 East 23rd Street
Staten Island
K1 B& O Coal DoakK2 Shooters IslandK3 B & O Railraod BridgeK4 Fresh KillsK5 TottennivlleNewtown Creek
NC0 English KillNC1 Amoco Tank FarmNC2 Maspeth CreekNC3 Whale CreekGowanus Channel
GC3 Union Street BridgeGC4 Carrol Street BridgeGC5 3rd Street BridgeGC6 9th Street Bridge
Harlem
Rive
rGC6
ATLANTIC OCEAN
U p p e r E a s t R i v e rU p p e r E a s t R i v e r
;OL� 0UULY� /HYIVY� PZ� KLÄULK� HZ�the area including the Hudson River from the New York City-Westchester line through the Battery to the Verrazano Narrows; the Lower East River to the Battery; and the Kill Van Kull–Arthur Kill system. This area contains 13 Harbor Survey monitoring sta-tions that have been grouped to-gether because of common water uses and functions. Waters of the Inner Harbor are often continuous through connecting branches or straits and cover a large and di-verse geographic expanse.
Most of the Inner Harbor Area, ex-JS\KPUN� [OL� 2PSSZ�� PZ� JSHZZPÄLK� I`�+,*� MVY� \ZLZ� Z\JO� HZ� ÄZOPUN� VY�boating. Most of the area in the 2PSSZ� PZ� JSHZZPÄLK� MVY� ÄZO� Z\Y]P]HS�only, with the exception of the far southern reach of Arthur Kill, which PZ�KLZPNUH[LK�MVY�ÄZOPUN�HUK�IVH[-ing. The Hudson River, from North of Spuyten Duyvil to Westchester County, is designated for bathing.
The Inner Harbor
Fecal coliform summer monthly geometric means for the 13 stations in the Inner Harbor complied with DEC standards. Geometric mean concentrations were, however, higher than [OL�WHZ[�ML^�`LHYZ�K\L�[V�[OL�ZPNUPÄJHU[�WYLJPWP[H[PVU�K\YPUN�2011. Water quality as estimated by Enterococcus concen-tration, which EPA determined to be a better indicator than fecal coliform concentration, fared better during 2011. All monitoring stations had averages less than 15 cells/100mL, which complied with the bathing standard of 35 cells/100mL; only two out of 21 samples at Mt. St. Vincent (N1) and Hudson River had single Enterococci readings exceeding the bathing standard at 104 cells/100mL, the maximum single sample requirement for the areas. Both of these samples followed severe rain events.
FECAL COLIFORM

6
At the Inner Harbor’s 13 open water sampling stations DEP took a total of 235 dissolved oxygen (DO) samples from sur-face waters and 209 samples from bottom waters in the area during the summer (June—September); DO levels ranged from 3.40-11.50 mg/L and 3.01–9.51 mg/L, respectively.
In 2011, 232 (99%) surface sam-ples and 198 (95%) bottom sam-ples had DO levels greater than 4.0 mg/L, and 212 (90%) surface samples and 161 (77%) bottom samples had DO levels DOs greater than 5.0 mg/L. Most DO levels be-tween 3.0-4.0 mg/L and half of the DO levels between 4.0-5.0 mg/L were found in August. All monthly averages complied with applicable DEC standards, except 3.85 mg/L at Tottenville (K5) and 4.82 mg/L at Mt. St. Vincent (N1) in August.
TrendsAverage summer surface DO val-ues in the Inner Harbor have risen to levels above DEC standards for bathing and other recreational use
(5.0 mg/L) since 1989. The 2011 summer average DO levels for both surface (6.66 mg/L) and bottom (5.67 mg/L) waters remained near the past 10 years’ averages of 6.5 mg/L and 5.8 mg/L, respectively.
TrendsFecal coliform levels in the Inner Harbor have dramatically declined on average over the last three decades, with levels since 1997 well below the bathing standard. Average fecal coliform counts have declined from more than 2,000 cells/100mL in the early 1970s to less than 100 cells/100mL since the early 1990s. This improvement has allowed the City to open the Inner Harbor waters to most recreational activities. The progress is attributed to the cessation of raw sewage dumping through the full build-out of New York City’s Wastewater Treatment Plants (WWTPs), the elimination of illegal discharges, and a reduction of CSOs through increased capture and treatment. In 2011, extremely heavy rainfall resulted in an increase in combined ZL^HNL� V]LYÅV^Z�� WHY[PJ\SHYS`�during the summer, leading to an increase in fecal coliform counts within the Inner Harbor areas.
DEP has monitored Enterococcus levels in the Inner Harbor have been monitored since 2001. The averages for the past eleven years have varied between 4 to 12 cells/100mL which is well below the Bathing Standard of 35 cells/100mL.
1
10
100
1000
10000
1985 1988 1991 1994 1997 2000 2003 2006 2009 2012
Cou
nts/
100
mL
Year
Surface Water Fecal ColiformSurface Water Enterococci
Enterococci Standard
Fecal Coliform Bathing Standard
Fecal Coliform Fishing Standard
Fecal Coliform and Enterococci Summer Geometric Mean
DISSOLVED OXYGEN
0.00
2.00
4.00
6.00
8.00
10.00
Dis
solv
ed O
xyge
n (m
g/L)
YEAR
Surface Water Bottom Water
Fishing Standard
Bathing Standard
Dissolved Oxygen Summer Average
)LJXUH��
)LJXUH��

7
CHLOROPHYLL ‘a’
The average chlorophyll ‘a’ concentration in the Inner Harbor was 6.0 µg/L in the summer of 2011. The stations in the Staten Island Kills, East River, and Hudson River all had av-erage concentration under 8 µg/L, with the exception of K5, which had an average concentration of 14.1 µg/L.
The Newtown Creek stations (NC0-NC3), which are not in-cluded in the regional data, av-eraged between 28.2 µg/L at the mouth of the creek and 37.7 µg/L near the head. This is typical of the creek and is likely a result of nutri-ent-enriched waters from runoff and TPUPTHS�[PKHS�Å\ZOPUN�
The average chlorophyll ‘a’ concen-tration at the Gowanus Canal sta-tion (G2) decreased from last year (22.9 µg/L) with an average of 12.2 µg/L this summer. Some individual samples were as high as 48.9 µg/L indicating possible eutrophic condi-tions in early summer. A Gowanus tributary station (GC6) adjacent to G2 had an average of 59.5 µg/L.
TrendsOver the past 10 years, the average summer chlorophyll ‘a’ concentra-tion has been consistent and under
�����N�3��L_JLW[������^P[O�H�����N�3�H]LYHNL��ZLL�ÄN\YL����
4HZZP]L�̂ H[LY�ÅV^�PU[V�[OL�YLNPVU�MYVT�[OL�/\KZVU�9P]LY�OHZ�been thought to be the stabilizing factor, keeping chlorophyll ‘a’ averages steady over the years.
0
10
20
30
40
50
60
70
0
10
20
30
40
50
60
70
1986 1991 1996 2001 2006 2011
TS
S (m
g/L
)
Ch
loro
ph
yll '
a' (ȝg
/L)
Year
Chlorophyll 'a' TSS Top TSS Bottom
Chlorophyll ‘a’ and Total Suspended Solids Summer Average
SECCHI TRANSPARENCY
The Inner Harbor region encompasses many distinct sub-re-gions: an estuary, a fresh water river, the East River, and a narrow marine channel separating New Jersey and Staten Island that is fed into by several smaller rivers and tributaries. 0[�PZ�ILULÄJPHS�[V�JVUZPKLY�[OLZL�Z\I�YLNPVUZ�ZLWHYH[LS �̀
In summer 2011, the average Secchi reading was 3.1 ft in the entire Inner Harbor area. Stations in the Staten Island Kills and East River all averaged greater than 3.4 ft Secchi depth, while the Hudson River stations were all less than 3.6 ft, with lower values typical as one travels north up the river. The Hudson-Estuary area can be very turbid from freshwater in-Å\_��HUK�:LJJOP�KLW[OZ�VM�����M[�HYL�X\P[L�JVTTVU��5L^[V^U�Creek also has low averages (all stations less than 2.7 ft). A contributing factor seems to be the high algal content and non-point source runoff in these waters.
)LJXUH��

8
TrendsAverage summer Secchi values have remained relatively constant (>4.0 ft) in the Inner Harbor area since measurements began in 1986. However, four years marked Secchi depth averages of less than 4 ft: 1996, 1997, 2010, and 2011.
Generally there is little variation in this region over the years (see ÄN\YL��� ;OPZ� JHU�TVZ[� SPRLS`� IL� H[-[YPI\[LK�[V�[OL�UVYTHS�ÅV^�MYVT�[OL�Hudson River.
0
10
20
30
40
50
60
70
0
2
4
6
8
10
1986 1991 1996 2001 2006 2011
TS
S (
mg
/L)
Sec
chi D
epth
(ft)
Year
Secchi TSS Top TSS Bottom
Secchi Depth and Total Suspended Solids Summer Average
)LJXUH��

9
H3
E8E7
E6E4
LN1FB1
E15
E14
E11
E10
BR5
BR3
BR1
AC1FLC2
FLC1
BRONX
QUEENS
MANHATTAN
WESTCHESTERCOUNTY
Water ClassificationSB Fishing
I Fishing and Boating
SD Fish Survival
i
0 2 41Miles
Open Water
Tributary
East River - WLI SoundE4 Hell GateE6 Flushing BayE7 Whitestone BridgeE8 Throg's Neck BridgeE10 Hart IslandE11 Little Neck BayE14 Bronx River MouthE15 Flushing Creek MouthHarlem RiverH3 155th StreetFlushing BayFB1 Flushing Bay/CreekFLC1 Flushing CreekFLC2 Flushing Creek/MouthAlley Pond CreekLN1 Little Neck Bay SouthAC1 Northern Blvd. BridgeBronx RiverBR1 233rd Street & Bronx Blvd BR 3 Westchester Avenue & Bronx RiverBR 5 Bronx River Mouth
East R
iver
Long Island Sound
Eastchester Bay
Upper East River
Flushing Bay
Bro
nx R
iver
Little NeckBay
FlushingCreek
Har
lem
Riv
er
Hud
son
Riv
er
The Upper East River–Western Long Island Sound represents the northeastern portion of New York Harbor, from Hell Gate in the East River up into the Western Long Island Sound. The Harbor Survey Program pro-vides coverage of this area, including the Harlem River and the East River, from Roosevelt Island to Hart Island at the New York City–Westchester County boundary. This area contains nine Harbor Survey monitoring stations. Waters of this vicin-ity, though divergent in salinity and depth, share similarities in pollutant loadings and are targeted for intensive management efforts as part of the Long Island Sound National Estuary Program.
The majority of the Upper East River–>LZ[LYU�3VUN�0ZSHUK�:V\UK�PZ�JSHZZPÄLK�HZ�MVY� \ZLZ� Z\JO� HZ� ÄZOPUN� VY� IVH[PUN�� ^P[O�the area east of the Bronx-Whitestone Bridge designated for bathing.
The Upper East River–Western Long Island Sound
FECAL COLIFORM
In the summer of 2011, fecal coliform counts at all nine Z[H[PVUZ�^LYL� PU�JVTWSPHUJL�^P[O� [OLPY�ZWLJPÄLK�¸ILZ[�\ZL¹�JSHZZPÄJH[PVUZ� MVY� IH[OPUN� �SLZZ� [OHU� ���� JLSSZ����T3�� HUK�ÄZOPUN�HUK�IVH[PUN� �SLZZ� [OHU�������JLSSZ����T3�� PU�<WWLY�East River-Western Long Island Sound. New York City ex-perienced an abnormally wet year in 2011; it was both the wettest summer and the wettest August on record. The fe-cal coliform summer geometric mean was 103 cells/100mL, an increase from 43 cells/100 mL in 2010. Eight out of nine stations had averages below 200 cells/100 mL, the monthly average fecal coliform levels necessary for bathing and other recreational uses; the Flushing Creek (E15) monitoring site did not meet these standards.
10
Enterococcus in Upper East River-Western Long Island Sound had a summer geometric mean of 8 cells/100 mL. Each site average was 33% higher than in 2010, yet all TL[�[OLPY�YLX\PYLK�JSHZZPÄJH[PVU��6U�August 15, after a record high rainfall the previous day, Enterococcus ex-ceeded the standard 104 cells/100 mL throughout the region.
TrendsFecal coliform levels have generally declined, and the region’s sum-mer geometric means have stayed below 200 cells/100 mL, the DEC standard for bathing and other recreational use. In 2011, record high rain was one of the main rea-son fecal coliform levels increased to an average of 103 cells/100 mL from 43 cells/100 mL in 2010. The ongoing upgrades of wastewater [YLH[TLU[�MHJPSP[PLZ�HUK�JHW[\YL�VM�JVTIPULK�ZL^LY�V]LYÅV^Z�have reduced fecal coliform levels, kept water quality in com-pliance with the standards, and will continue to improve wa-ter quality.
DEP has monitored Enterococcus levels in the Upper East River-Western Long Island Sound since 2001. The aver-ages for the past eleven years have varied between 3 to 10 cells/100 mL which is well below the bathing standard of 200 cells/100 mL.
1
10
100
1000
10000
1985 1988 1991 1994 1997 2000 2003 2006 2009 2012
Coun
ts/1
00 m
L
Year
Surface Water Fecal ColiformSurface Water Enterococci
Enterococci Standard
Fecal Coliform Bathing Standard
Fecal Coliform Fishing Standard
DISSOLVED OXYGEN
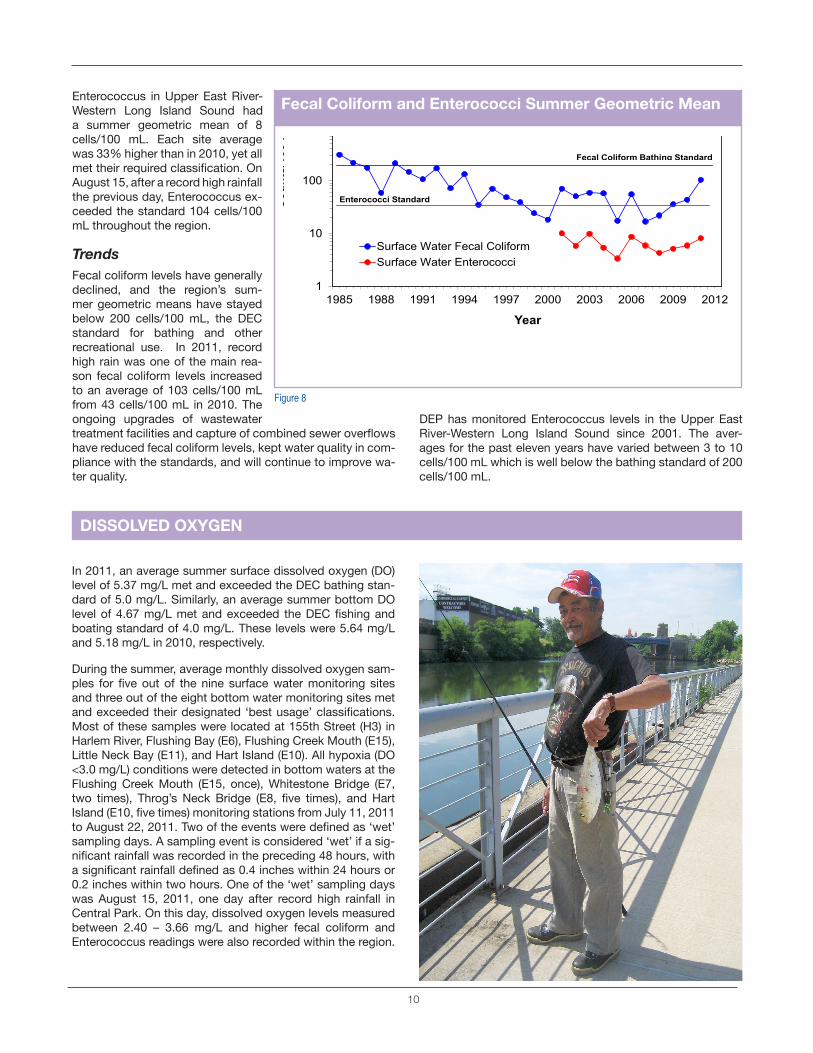
In 2011, an average summer surface dissolved oxygen (DO) level of 5.37 mg/L met and exceeded the DEC bathing stan-dard of 5.0 mg/L. Similarly, an average summer bottom DO SL]LS�VM������TN�3�TL[�HUK�L_JLLKLK� [OL�+,*�ÄZOPUN�HUK�boating standard of 4.0 mg/L. These levels were 5.64 mg/L and 5.18 mg/L in 2010, respectively.
During the summer, average monthly dissolved oxygen sam-WSLZ� MVY� Ä]L�V\[� VM� [OL�UPUL� Z\YMHJL�^H[LY�TVUP[VYPUN� ZP[LZ�and three out of the eight bottom water monitoring sites met HUK�L_JLLKLK�[OLPY�KLZPNUH[LK�ºILZ[�\ZHNL»�JSHZZPÄJH[PVUZ��Most of these samples were located at 155th Street (H3) in Harlem River, Flushing Bay (E6), Flushing Creek Mouth (E15), Little Neck Bay (E11), and Hart Island (E10). All hypoxia (DO <3.0 mg/L) conditions were detected in bottom waters at the Flushing Creek Mouth (E15, once), Whitestone Bridge (E7, [^V� [PTLZ��� ;OYVN»Z� 5LJR� )YPKNL� �,��� Ä]L� [PTLZ��� HUK�/HY[�0ZSHUK��,����Ä]L�[PTLZ��TVUP[VYPUN�Z[H[PVUZ�MYVT�1\S`����������[V�(\N\Z[�����������;̂ V�VM�[OL�L]LU[Z�^LYL�KLÄULK�HZ�º^L[»�sampling days. A sampling event is considered ‘wet’ if a sig-UPÄJHU[�YHPUMHSS�^HZ�YLJVYKLK�PU�[OL�WYLJLKPUN����OV\YZ��^P[O�H�ZPNUPÄJHU[�YHPUMHSS�KLÄULK�HZ�����PUJOLZ�^P[OPU����OV\YZ�VY�0.2 inches within two hours. One of the ‘wet’ sampling days was August 15, 2011, one day after record high rainfall in Central Park. On this day, dissolved oxygen levels measured between 2.40 – 3.66 mg/L and higher fecal coliform and Enterococcus readings were also recorded within the region.
)LJXUH��
Fecal Coliform and Enterococci Summer Geometric Mean
11
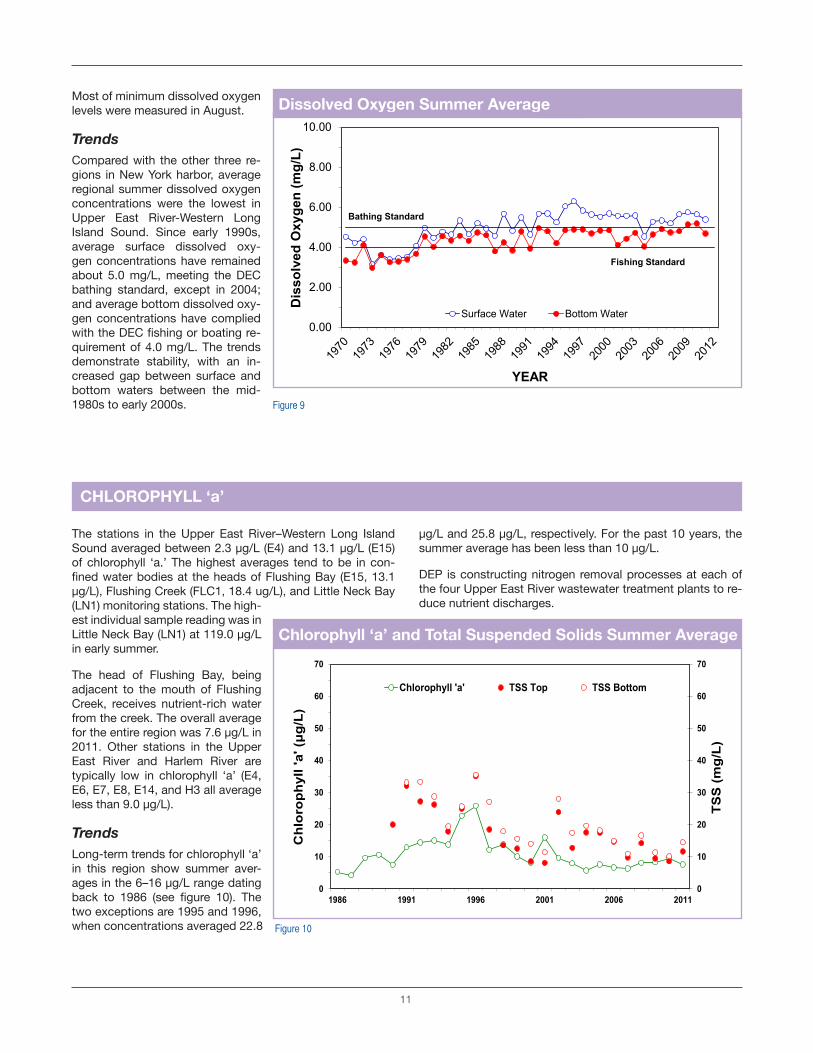
Most of minimum dissolved oxygen levels were measured in August.
TrendsCompared with the other three re-gions in New York harbor, average regional summer dissolved oxygen concentrations were the lowest in Upper East River-Western Long Island Sound. Since early 1990s, average surface dissolved oxy-gen concentrations have remained about 5.0 mg/L, meeting the DEC bathing standard, except in 2004; and average bottom dissolved oxy-gen concentrations have complied ^P[O�[OL�+,*�ÄZOPUN�VY�IVH[PUN�YL-quirement of 4.0 mg/L. The trends demonstrate stability, with an in-creased gap between surface and bottom waters between the mid-1980s to early 2000s.
0.00
2.00
4.00
6.00
8.00
10.00
Dis
solv
ed O
xyge
n (m
g/L)
YEAR
Surface Water Bottom Water
Fishing Standard
Bathing Standard
Dissolved Oxygen Summer Average
CHLOROPHYLL ‘a’
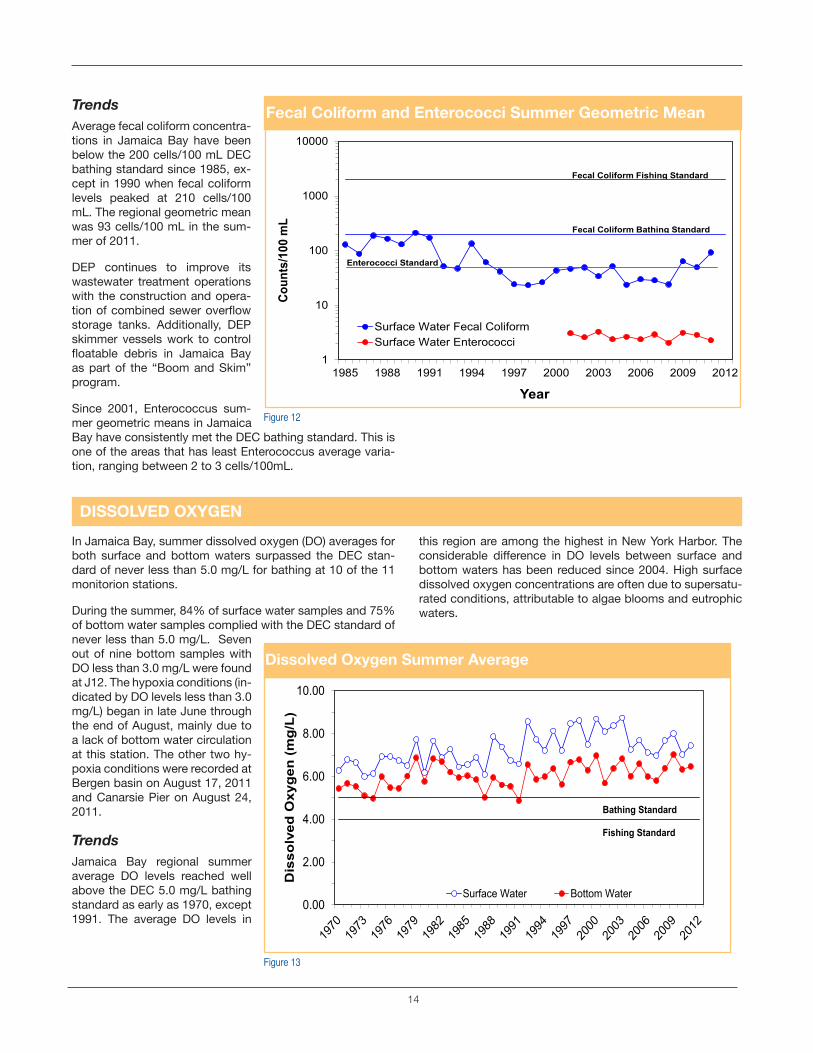
The stations in the Upper East River–Western Long Island Sound averaged between 2.3 µg/L (E4) and 13.1 µg/L (E15) of chlorophyll ‘a.’ The highest averages tend to be in con-ÄULK�^H[LY�IVKPLZ�H[� [OL�OLHKZ�VM�-S\ZOPUN�)H`��,���������µg/L), Flushing Creek (FLC1, 18.4 ug/L), and Little Neck Bay (LN1) monitoring stations. The high-est individual sample reading was in Little Neck Bay (LN1) at 119.0 µg/L in early summer.
The head of Flushing Bay, being adjacent to the mouth of Flushing Creek, receives nutrient-rich water from the creek. The overall average for the entire region was 7.6 µg/L in 2011. Other stations in the Upper East River and Harlem River are typically low in chlorophyll ‘a’ (E4, E6, E7, E8, E14, and H3 all average less than 9.0 µg/L).
TrendsLong-term trends for chlorophyll ‘a’ in this region show summer aver-ages in the 6–16 µg/L range dating IHJR� [V� � ��� �ZLL� ÄN\YL� ����� ;OL�two exceptions are 1995 and 1996, when concentrations averaged 22.8
µg/L and 25.8 µg/L, respectively. For the past 10 years, the summer average has been less than 10 µg/L.
DEP is constructing nitrogen removal processes at each of the four Upper East River wastewater treatment plants to re-duce nutrient discharges.
0
10
20
30
40
50
60
70
0
10
20
30
40
50
60
70
1986 1991 1996 2001 2006 2011
TS
S (
mg
/L)
Chl
oro
ph
yll '
a' (ȝg
/L)
Year
Chlorophyll 'a' TSS Top TSS Bottom
Chlorophyll ‘a’ and Total Suspended Solids Summer Average
)LJXUH���
)LJXUH��

12
SECCHI TRANSPARENCY
In the summer of 2011, the av-erage Secchi transparency for Upper East River–Western Long Island Sound was 3.6 ft. Stations in more constricted waterways, such as Flushing Creek and H3 in the Harlem River, displayed low averages of 3.0 ft or less. Runoff HM[LY� YHPUMHSS� HUK� MYLZO^H[LY� PUÅ\_�from the Hudson to the Harlem River can contribute to turbid wa-ters in these areas.
TrendsThe Upper East River-Western Long Island Sound regional aver-age has varied between 3.3 and 6.1 ft Secchi depth since 1986. The lowest average transparency of 3.3 feet in 1996 coincided with very high average chlorophyll ‘a’ and total suspended solids read-ings. Since 1996, improved Secchi transparency depths may coincide with a decrease in chloro-phyll ‘a’ or total suspended solids averages.
0
10
20
30
40
50
60
70
0
2
4
6
8
10
1986 1991 1996 2001 2006 2011
TS
S (m
g/L
)
Sec
chi D
epth
(ft
)
Year
Secchi TSS Top TSS Bottom
Secchi Depth and Total Suspended Solids Summer Average
)LJXUH���

13
J8
J7
J5
J3
J2
J1
F5
SP2
SP1
PB3
PB2
N9A
J9A
J17
J16
J15J14 J13
J12
J11
J10
HC2
HC1
BB4
BB2
Rockaway
QUEENS
ATLANTICOCEAN
Water ClassficationOpen Water Site
JB Special Site
Tributary Site
SB: Bathing
I: Fishing and Boating
0 2 41
Miles
RockawayInlet
Sheepshead Bay
Shell BankCreek
Mill Creek
MillBas
in
East Mill Basin
Paerdegat Basin
Fresh CreekHendrix Creek
Spring Creek
BergenBasin
Shell Bank B
asin
Hew
tree Basin
ThurstonBasin
JamaicaBay
BROOKLYN
i
Gerritsen Creek
Jamaica Bay SitesJ13
J14
J15
J16
J17
Jamaica BayJ1 Rockaway Inlet
J2 Mill Basin Inlet
J3 Canarsie Pier
J5 Railroad Trestle
J7 Bergen Basin
J8 Spring Creek
J9A Fresh Creek Buoy No. C21
J10 Paerdegat Basin
J11 Sheepshead Bay Mouth
J12 Grassy Bay
N9A Coney Island Outfall
PB2 Miday in Paerdegat Basin
PB3 Mouth of Paerdegat Basin
SP1 Spring Creek Under Belt PKWY Overpass
SP2 Spring Creek
HC1 Hendrix Creek
HC2 Hendrix Creek by 26th Ward WTP
BB2 Head of Bergen Basin
BB4 Mouth of Bergen Basin
Jamaica Bay
FECAL COLIFORM
Jamaica Bay is located at the south-western end of Long Island. This urban, estuarine embayment and national park consists primarily of tidal wetlands, up-land areas, and open waters. The bay and its drainage area are almost entirely within the boroughs of Brooklyn and Queens, except for a small area at the eastern end that lies within Nassau County. Jamaica Bay joins the New York Harbor to the west via the Rockaway Inlet at the tip of Breezy Point and includes the Rockaway Peninsula, which forms the southern limit of the Bay and separates it from the Atlantic Ocean. This estuarine water body, consisting of approximately 20 square miles of open water, is covered by eleven Harbor Survey monitoring stations.
Open waters of Jamaica Bay are classi-ÄLK�MVY�IH[OPUN�VY�V[OLY�YLJYLH[PVUHS�\ZL��Areas within the Bay’s tributaries and dead-end canals are prone to reduced water quality due to direct surface runoff HUK�WVVY�Å\ZOPUN��;OLZL�HYLHZ�HYL�KLZPN-nated for secondary contact use, such as ÄZOPUN�VY�IVH[PUN�
In the summer of 2011, eight out of eleven monitoring sites had fecal coliform monthly geometric means below 200 cells/100 mL and met the DEC bathing standard, not in-cluding the Grassy Bay (J12), Spring Creek (J8), and Bergen Basin (J7) monitoring sites. Fecal coliform geometric means PU�[OL�UVY[OLYU�WVY[PVU�VM�[OL�IH`��HSS�Ä]L�ZP[LZ��^LYL�OPNOLY�than the DEC swimming and bathing standard in August and September due to the wet weather.
Enterococcus readings were well below DEC standards in 2011. During the summer, all individual readings met DEC swimming and bathing standards (104 cells/100 mL, max-imum for a single sample), except on one of the wet days (September 8, 2011) at J2, J10, and J9A. The regional summer geometric mean was 2 cells/100mL; all site monthly means complied with the DEC bathing standard of 35 cells/100 mL.
14
TrendsAverage fecal coliform concentra-tions in Jamaica Bay have been below the 200 cells/100 mL DEC bathing standard since 1985, ex-cept in 1990 when fecal coliform levels peaked at 210 cells/100 mL. The regional geometric mean was 93 cells/100 mL in the sum-mer of 2011.
DEP continues to improve its wastewater treatment operations with the construction and opera-[PVU�VM�JVTIPULK�ZL^LY�V]LYÅV^�storage tanks. Additionally, DEP skimmer vessels work to control ÅVH[HISL� KLIYPZ� PU� 1HTHPJH� )H`�as part of the “Boom and Skim” program.
Since 2001, Enterococcus sum-mer geometric means in Jamaica Bay have consistently met the DEC bathing standard. This is one of the areas that has least Enterococcus average varia-tion, ranging between 2 to 3 cells/100mL.
1
10
100
1000
10000
1985 1988 1991 1994 1997 2000 2003 2006 2009 2012
Coun
ts/1
00 m
L
Year
Surface Water Fecal ColiformSurface Water Enterococci
Fecal Coliform Bathing Standard
Fecal Coliform Fishing Standard
Enterococci Standard
Fecal Coliform and Enterococci Summer Geometric Mean
DISSOLVED OXYGENIn Jamaica Bay, summer dissolved oxygen (DO) averages for both surface and bottom waters surpassed the DEC stan-dard of never less than 5.0 mg/L for bathing at 10 of the 11 monitorion stations.
During the summer, 84% of surface water samples and 75% of bottom water samples complied with the DEC standard of never less than 5.0 mg/L. Seven out of nine bottom samples with DO less than 3.0 mg/L were found at J12. The hypoxia conditions (in-dicated by DO levels less than 3.0 mg/L) began in late June through the end of August, mainly due to a lack of bottom water circulation at this station. The other two hy-poxia conditions were recorded at Bergen basin on August 17, 2011 and Canarsie Pier on August 24, 2011.
TrendsJamaica Bay regional summer average DO levels reached well above the DEC 5.0 mg/L bathing standard as early as 1970, except 1991. The average DO levels in
this region are among the highest in New York Harbor. The considerable difference in DO levels between surface and bottom waters has been reduced since 2004. High surface dissolved oxygen concentrations are often due to supersatu-rated conditions, attributable to algae blooms and eutrophic waters.
0.00
2.00
4.00
6.00
8.00
10.00
Dis
solv
ed O
xyg
en (
mg
/L)
YEAR
Surface Water Bottom Water
Fishing Standard
Bathing Standard
Dissolved Oxygen Summer Average
)LJXUH���
)LJXUH���

15
CHLOROPHYLL ‘a’
Jamaica Bay typically has the highest chlorophyll ‘a’ aver-ages in all of New York Harbor. In 2011, chlorophyll ‘a’ av-eraged 29.4 µg/L. Most stations in the region average fairly high (greater than 20 µg/L) with the highest occurring in the eastern half of the bay (J7; 61.5 µg/L and J12; 44.2 µg/L). J7 at the mouth of Bergen Basin recorded a season high con-centration of 200.3 µg/L on June 1, 2011. Several new shal-low water stations in the center of the bay all averaged more than 25 µg/L. Slow turnover of water within the bay and the nutrient-rich tributaries feeding it allow for development of large standing phytoplankton populations year round.
Concentrations at the western end of the bay are lower due to bet-ter mixing with ocean waters. In 2011, J1, J11, and N9A averaged 18.8 µg/L, 19.9 µg/L, and 8.1 µg/L, respectively.
DEP is installing equipment that will remove nitrogen from waste-water at the 26th Ward and Jamaica Wastewater Treatment Plants. Nitrogen, which humans excrete from protein metabolism, is a nutrient for microorganisms. Work thus far completed at 26th Ward has already reduced nitrogen dishcarges by more than 8,000 pounds per day into Jamaica Bay.
TrendsChlorophyll ‘a’ summer averages in Jamaica Bay were less than 25 µg/L before 1990. Chlorophyll ‘a’ summer averages increased to 38.3 µg/L in 1991 and have remained above 34 µg/L since, with the exception of the 2007 average of 23.7 µg/L, which seems to be an outlier. In 2010, summer aver-ages dropped to 28 µg/L and remain consistent with the 2011 average of 29 µg/L. Over the past 26 years chlorophyll ‘a’ JVUJLU[YH[PVUZ�OH]L�Å\J[\H[LK��WHY[PJ\SHYS`�PU�[OL�TPK�� �Z�
0
10
20
30
40
50
60
70
0
10
20
30
40
50
60
70
1986 1991 1996 2001 2006 2011
TS
S (
mg
/L)
Chl
oro
ph
yll '
a' (ȝg
/L)
Year
Chlorophyll 'a' TSS Top TSS Bottom
Chlorophyll ‘a’ and Total Suspended Solids Summer Average
)LJXUH���

16
SECCHI TRANSPARENCY
The average Secchi depth in Jamaica Bay was 3.8 ft in 2011. Most of the stations in the bay proper average between 3 and 4 ft Secchi depth except for J1 at the entrance of the bay (4.5 ft), J11 at the mouth of Sheepshead Bay (4.4 ft), and N9A at the Coney Island outfall (6.6 ft). Paerdegat Basin averaged 3 ft or less due to turbid conditions from runoff and algal content. The station with the low-est chlorophyll ‘a’ average, N9A (8.1 µg/L), also had the highest Secchi depths (6.6 ft). Conversely, the highest chlorophyll ‘a’ average in the bay at J7 (61.5 µg/L) was associated with the lowest Secchi average (2.9 ft).
TrendsAverage Secchi depths greater than 5.0 ft were typical before 1993, when chlorophyll ‘a’ averages where relatively low (see ÄN\YL������-VY�[OL�SHZ[�MV\Y�`LHYZ��H]LYHNL�:LJJOP�[YHUZWHY-
ency depths were between 3.5 to 3.8 ft.
0
10
20
30
40
50
60
70
0
2
4
6
8
10
1986 1991 1996 2001 2006 2011
TS
S (m
g/L
)
Sec
chi D
epth
(ft
)
Year
Secchi TSS Top TSS Bottom
Secchi Depth and Total Suspended Solids Summer Average
)LJXUH���
17
!(
!(
!(
!(
!(
!(!(
!(
N9
N8
K6
N16
K5A
GB1
CIC3 CIC2
BROOKLYN
STATENISLAND
MANHATTAN
Arth
ur K
ill
East
Rive
r
UpperNew York
Bay
LowerNew York
Bay
NEWJERSEY
Kill Van Kull
SandyHook
Water ClassificationI: Fishing and Boating
SB: Bathing
SB / SA0 2 4 61Miles
Ü
RaritanBay
ATLANTICOCEAN
Lower New York Bay
K5A Raritan RiverK6 Orchard LightN8 Verrazano NarrowsN9 Steeplechase PierN16 Rockaway Point
Coney Island Creek
CIC2 Coney Is CreekCIC3 Coney Is Creek MouthGB1 Gravesend Bay
Hudso
n Rive
r
The Lower NY Bay–Raritan Bay
FECAL COLIFORM
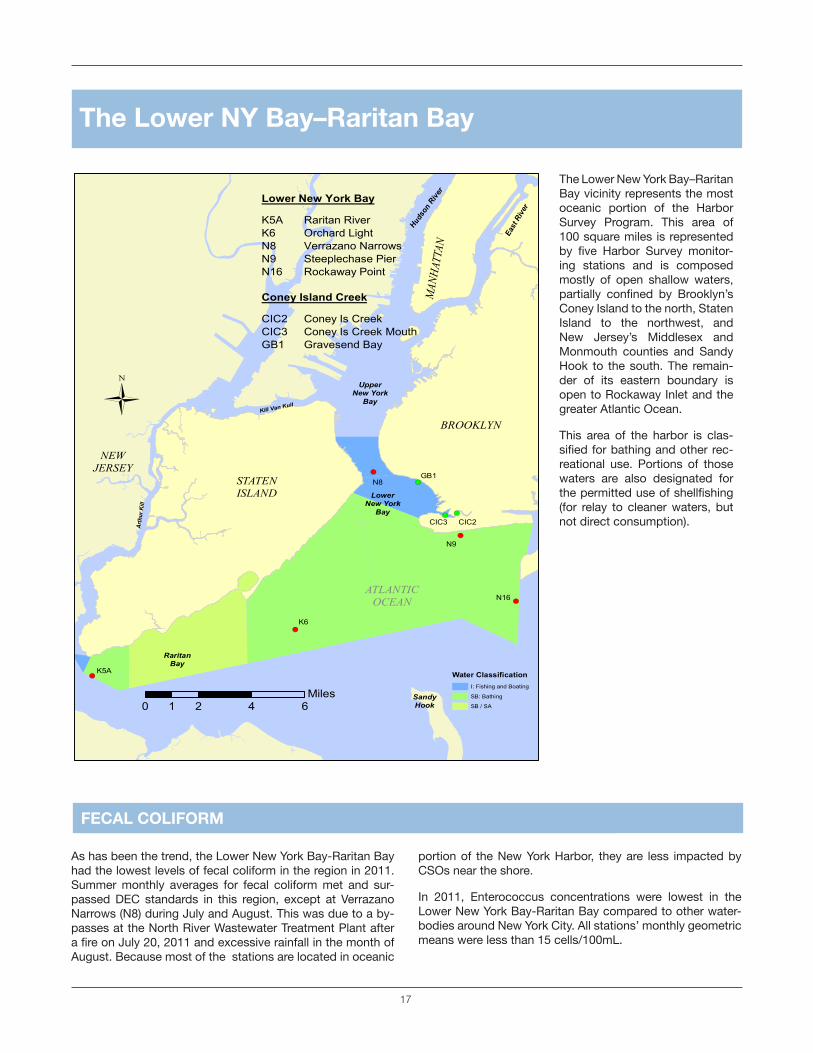
The Lower New York Bay–Raritan Bay vicinity represents the most oceanic portion of the Harbor Survey Program. This area of 100 square miles is represented I`� Ä]L� /HYIVY� :\Y]L`� TVUP[VY-ing stations and is composed mostly of open shallow waters, WHY[PHSS`� JVUÄULK� I`� )YVVRS`U»Z�Coney Island to the north, Staten Island to the north west, and New Jersey’s Middlesex and Monmouth counties and Sandy Hook to the south. The remain-der of its eastern boundary is open to Rockaway Inlet and the greater Atlantic Ocean.
This area of the harbor is clas-ZPÄLK�MVY�IH[OPUN�HUK�V[OLY�YLJ-reational use. Portions of those waters are also designated for [OL�WLYTP[[LK�\ZL�VM�ZOLSSÄZOPUN�(for relay to cleaner waters, but not direct consumption).
As has been the trend, the Lower New York Bay-Raritan Bay had the lowest levels of fecal coliform in the region in 2011. Summer monthly averages for fecal coliform met and sur-passed DEC standards in this region, except at Verrazano Narrows (N8) during July and August. This was due to a by-passes at the North River Wastewater Treatment Plant after H�ÄYL�VU�1\S`����������HUK�L_JLZZP]L�YHPUMHSS�PU�[OL�TVU[O�VM�August. Because most of the stations are located in oceanic
portion of the New York Harbor, they are less impacted by CSOs near the shore.
In 2011, Enterococcus concentrations were lowest in the Lower New York Bay-Raritan Bay compared to other water-bodies around New York City. All stations’ monthly geometric means were less than 15 cells/100mL.

18
1
10
100
1000
10000
1985 1988 1991 1994 1997 2000 2003 2006 2009 2012
Coun
ts/1
00 m
L
Year
Surface Water Fecal ColiformSurface Water Enterococci
Fecal Coliform Fishing Standard
Fecal Coliform Bathing Standard
Enterococci Standard
Fecal Coliform and Enterococci Summer Geometric MeanTrendsFecal coliform concentrations in Lower New York Bay-Raritan Bay OH]L� ZPNUPÄJHU[S`� KLJSPULK� ZPUJL�the early 1990s. Summer geomet-ric means for fecal coliform have stayed below 30 cells/100 mL since 1992. This region has the lowest bacteria concentrations in New York harbor.
Enterococcus levels in the Lower New York Bay-Raritan Bay have been consistently well below the DEC bathing standard. Ten out of eleven years’ summer averages had 2 cells/100 mL and there were only 3 cells/100 mL in 2010.
DISSOLVED OXYGEN
Most of dissolved oxygen (DO)val-ues for surface and bottom waters in Lower New York Bay–Raritan Bay complied with the DEC stan-dard of never less than 5.0 mg/L for bathing during the summer of 2011; 75 out of 79 (95%) surface water samples and 67 out of 73 (92%) bottom water samples met their required DO standards. The lower DOs (3.37-4.94 mg/L) were found in August 2011 at Raritan Bay (K5A).
Summer DO averages in Lower New York Bay-Raritan Bay have been the highest among New York City’s harbor water since 1970. The average DO measurements in summer 2011 were 7.1 mg/L in surface waters and 6.6 mg/L in bottom waters; they were 7.6 mg/L and 7.2 mg/L in the summer of 2010.
TrendsIn Lower New York Bay–Raritan Bay, DO levels have in-creased about 1 mg/L for both surface and bottom waters from 1970 to 1990 and remained between 7.0-8.5 mg/L in surface waters and 6.0-7.8 mg/L in bottom waters thereafter.
0.00
2.00
4.00
6.00
8.00
10.00
Dis
solv
ed O
xyge
n (m
g/L)
YEAR
Surface Water Bottom Water
Fishing Standard
Bathing Standard
Dissolved Oxygen Summer Average
)LJXUH���
)LJXUH���

19
Lower Bay waters are generally very clear. An average of 5.1 ft in �����YLÅLJ[Z�NVVK�[YHUZWHYLUJ`�H[�open water stations such as N16 at Rockaway Point (average of 7.2 ft) and N9 at Coney Island (6.2 ft). Levels above 5.0 ft indicate clean conditions and superior water clar-ity. Stations in Raritan Bay averaged lower (less than 4 ft) as there are often phytoplankton blooms in the area and turbid conditions on windy days due to the shallow waters out-side the main shipping channel.
TrendsAverage Secchi transparencies in the Lower New York Bay–Raritan Bay region have remained at or above 5.0 ft since 1986, with the exceptions of 1995 and 1996. The drop coincided with a large increase PU�JOSVYVWO`SS�ºH»�PU�� ���ZLL�ÄN\YL�19). Also within this time frame, the annual Secchi averages Å\J[\H[L�NYLH[S �̀�YHUNPUN�MYVT�����M[�[V�HSTVZ[���M[��0[�HWWLHYZ�the region is sensitive to annual variations that affect water
clarity. The highest Secchi depth average recorded in 1986 (8.5 ft) coincided with the second-lowest chlorophyll ‘a’ av-erage of 7.3 µg/L.
The Lower New York Bay–Raritan Bay varies in chlorophyll ‘a’ con-centrations, however the regional average dropped to 10.4 µg/L in 2011. Stations near Raritan Bay had higher concentrations, whereas the Verrazano Narrows (N8), Coney Island Beach (N9), and Rockaway Inlet (N16) were among the clear-est waters in the city (all less than 8 µg/L average). The K5A and K6 monitoring stations near Raritan Bay averaged 11.7 and 20.6 µg/L, respectively.
Raritan Bay appears to have a nat-\YHS�JVUÄN\YH[PVU�PKLHS�MVY�[OL�WYV-motion of phytoplankton blooms. The relatively shallow area’s main source of fresh water is the polluted Raritan River; it also receives waters from Arthur Kill and some smaller tributaries in New Jersey. Stations K5 and K4 in Arthur Kill had aver-ages of 14.1 and 5.1 µg/L, respectively. Flushing from the Hudson River is inhibited by surrounding shoals, such as Old Orchard Shoal. Tidal exchange with oceanic waters does oc-cur, but is inhibited somewhat by Sandy Hook.
TrendsGiven the propensity for algae blooms in Raritan Bay, this re-gion as a whole has a history of fairly low summer chlorophyll ‘a’ averages. Over the past 26 years, all but three years (1995, � ���� ���OHK�H]LYHNLZ�ILSV^�����N�3��ZLL�ÄN\YL���0U�������the chlorophyll ‘a’ average was 10.4 µg/L.
0
10
20
30
40
50
60
70
0
10
20
30
40
50
60
70
1986 1991 1996 2001 2006 2011
TS
S (
mg
/L)
Chl
oro
ph
yll '
a' (ȝg
/L)
Year
Chlorophyll 'a' TSS Top TSS Bottom
0
10
20
30
40
50
60
70
0
2
4
6
8
10
1986 1991 1996 2001 2006 2011
TS
S (
mg
/L)
Sec
chi D
epth
(ft)
Year
Secchi TSS Top TSS Bottom
CHLOROPHYLL ‘A’
SECCHI TRANSPARENCY
Chlorophyll ‘a’ and Total Suspended Solids Summer Average
Secchi Depth and Total Suspended Solids Summer Average
)LJXUH���
)LJXUH���
20
AC1
BB2
BB4
BR1
BR3
BR5
CiC2CiC3
E10
E11
E14
E15
E2
E4E6
E7
E8
FB1
FLC1
FLC2
G2
GB1
GC3
GC4GC5
GC6
H3
HC1
HC2
J1
J10
J11
J12
J13J14
J15
J16
J17
J2
J3
J5
J7
J8J9A
K1
K2K3
K4
K5
K5A
K6
LN1
N1
N16
N3B
N3C
N4
N5
N6
N7
N8
N9 N9A
NC0
NC1
NC2
NC3
PB2
PB3
SP1
SP2
TR1
TR2
F5
!(
!(
!(
!(
!(
!(
!(!(
!(
!(
!(
!(
!(
!(!(
!(!(
!(
!(!(
!(
!(
!(!(!(!(
!(
!(!(
!(
!(
!(
!(
!(!(!(!(
!(
!(
!(
!(
!(!(
!(
!(
!(!(
!(
!(
!(
!(
!(
!(
!(
!(
!(
!(
!(
!(
!(
!(
!( !(
!(
!(!(
!(
!(!(
!(
!(
!(
!(
!(
R a r i t a nR a r i t a nB a yB a y
L o w e rL o w e rN e w Y o r kN e w Y o r k
B a yB a y
U p p e rU p p e rN e w Y o r kN e w Y o r k
B a yB a y
U p p e r E a s t R i v e rU p p e r E a s t R i v e r
L o n gL o n gI s l a n dI s l a n dS o u n dS o u n d
Rockaway
J a m a i c aJ a m a i c aB a yB a y
East
Rive
r
Harle
m R
iver BRONX
QUEENS
MAN
HATT
AN
BROOKLYN
STATENISLAND
NEWJERSEY
WESTCHESTERCOUNTY
ATLANTIC OCEAN
2011 NYC DEP Harbor Survey Monitoring Stations
!( Conventional Stations
!( Tributary Stations
!( Triathlon Stations
Coast Line
Upper East River- Western LIS
Lower New York Bay
Inner Harbor
Jamaica Bay
i
0 5 102.5Miles
Kill Van Kull
SandyHook
New
ark
Bay
Hudson R
iver
Arthur
Kill


X