new york state gun involved violence elimination (give ... york state gun involved violence...
TRANSCRIPT
New York State Gun Involved Violence Elimination (GIVE) InitiativeCrime, Arrest, and Firearm Activity Report
Data Reported through March 31, 2018 Prepared by the:
Office of Justice Research and Performance
Issued Date: May 24, 2018
Data included in this report are preliminary and subject to change.Please visit the DCJS website – www.criminaljustice.ny.gov, click “Statistics” – for official data.
New York State Gun Involved Violence Elimination (GIVE) Initiative Crime, Arrest, and Firearm Activity Report
TABLE OF CONTENTS
PAGE SERIES
REGIONAL CRIME SUMMARY ............................................................................. 100
GIVE INITIATIVE CRIME, ARREST, AND FIREARM ACTIVITY GIVE JURISDICTIONS' CRIME TOTALS .............................................................. 200 ALBANY CITY POLICE DEPARTMENT (Albany County) ................................... 300 BINGHAMTON CITY POLICE DEPARTMENT (Broome County) ........................ 400 BUFFALO CITY POLICE DEPARTMENT (Erie County) ...................................... 500 HEMPSTEAD VILLAGE POLICE DEPARTMENT (Nassau County) ................... 600 JAMESTOWN CITY POLICE DEPARTMENT (Chautauqua County) .................. 700 KINGSTON CITY POLICE DEPARTMENT (Ulster County) ................................. 800 MIDDLETOWN CITY POLICE DEPARTMENT (Orange County) ....................... . 900 MOUNT VERNON CITY POLICE DEPARTMENT (Westchester County) ......... 1000 NASSAU COUNTY POLICE DEPARTMENT (Nassau County) ......................... 1100 NEWBURGH CITY POLICE DEPARTMENT (Orange County) .......................... 1200 NIAGARA FALLS CITY POLICE DEPARTMENT (Niagara County).................. 1300 POUGHKEEPSIE CITY POLICE DEPARTMENT (Dutchess County) ............... 1400 ROCHESTER CITY POLICE DEPARTMENT (Monroe County) ........................ 1500 SCHENECTADY CITY POLICE DEPARTMENT (Schenectady County)........... 1600
PAGE SERIES
SPRING VALLEY VILLAGE POLICE DEPARTMENT (Rockland County) ....... 1700 SUFFOLK COUNTY POLICE DEPARTMENT (Suffolk County) ........................ 1800 SYRACUSE CITY POLICE DEPARTMENT (Onondaga County) ...................... 1900 TROY CITY POLICE DEPARTMENT (Rensselaer County) ............................... 2000 UTICA CITY POLICE DEPARTMENT (Oneida County) ..................................... 2100 YONKERS CITY POLICE DEPARTMENT (Westchester County) ..................... 2200 HISTORICAL AND EXPANDED RAPE COUNTS .............................................. 2300
ANNUAL CRIME AND ARREST ACTIVITY STATEWIDE, NYC, NON-NYC: 2006-2015 REPORTED CRIME ........................ 3000 VIOLENT CRIME BY FIREARM ........................................................................... 3002 STATEWIDE, NYC, NON-NYC and GIVE ARRESTS ......................................... 3003 2016 GIVE CRIME COUNTS AND RATES ......................................................... 3007
New York State Gun Involved Violence Elimination (GIVE) Initiative Crime, Arrest, and Firearm Activity Report
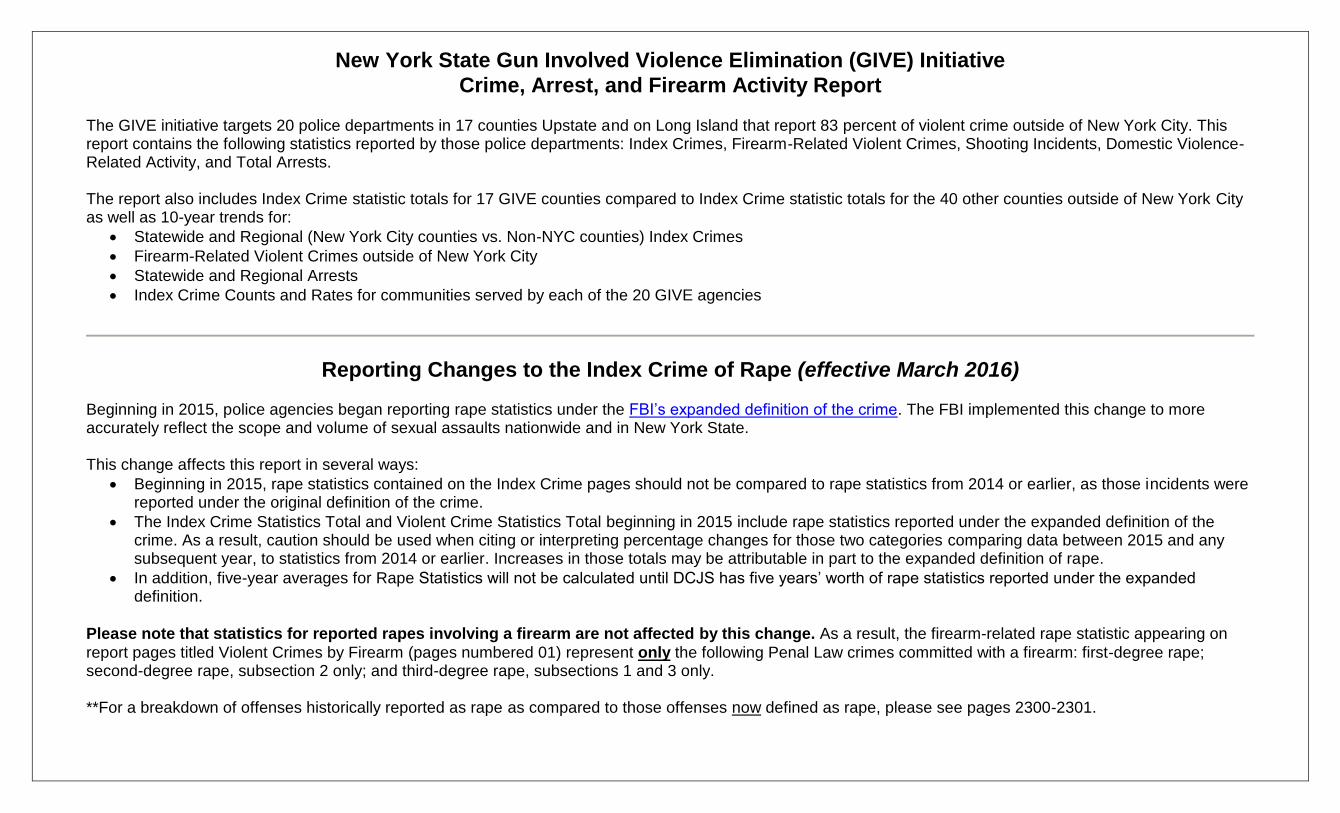
The GIVE initiative targets 20 police departments in 17 counties Upstate and on Long Island that report 83 percent of violent crime outside of New York City. This report contains the following statistics reported by those police departments: Index Crimes, Firearm-Related Violent Crimes, Shooting Incidents, Domestic Violence-Related Activity, and Total Arrests. The report also includes Index Crime statistic totals for 17 GIVE counties compared to Index Crime statistic totals for the 40 other counties outside of New York City as well as 10-year trends for:
• Statewide and Regional (New York City counties vs. Non-NYC counties) Index Crimes • Firearm-Related Violent Crimes outside of New York City • Statewide and Regional Arrests • Index Crime Counts and Rates for communities served by each of the 20 GIVE agencies
Reporting Changes to the Index Crime of Rape (effective March 2016) Beginning in 2015, police agencies began reporting rape statistics under the FBI’s expanded definition of the crime. The FBI implemented this change to more accurately reflect the scope and volume of sexual assaults nationwide and in New York State. This change affects this report in several ways:
• Beginning in 2015, rape statistics contained on the Index Crime pages should not be compared to rape statistics from 2014 or earlier, as those incidents were reported under the original definition of the crime.
• The Index Crime Statistics Total and Violent Crime Statistics Total beginning in 2015 include rape statistics reported under the expanded definition of the crime. As a result, caution should be used when citing or interpreting percentage changes for those two categories comparing data between 2015 and any subsequent year, to statistics from 2014 or earlier. Increases in those totals may be attributable in part to the expanded definition of rape.
• In addition, five-year averages for Rape Statistics will not be calculated until DCJS has five years’ worth of rape statistics reported under the expanded definition.
Please note that statistics for reported rapes involving a firearm are not affected by this change. As a result, the firearm-related rape statistic appearing on report pages titled Violent Crimes by Firearm (pages numbered 01) represent only the following Penal Law crimes committed with a firearm: first-degree rape; second-degree rape, subsection 2 only; and third-degree rape, subsections 1 and 3 only. **For a breakdown of offenses historically reported as rape as compared to those offenses now defined as rape, please see pages 2300-2301.

Firearm Activity Data Definitions
Shooting Incidents Involving Injury or Death – Number of shooting incidents during the month where one or more persons were injured or killed as a result of the shooting. Data is reported each month by GIVE jurisdictions.
Shooting Victims (Persons Hit) – Total number of victims shot in the shooting incidents reported, including individuals killed. Data is reported each month by GIVE jurisdictions.
Individuals Killed by Gun Violence – The number of murders resulting from firearm related injuries.
Domestic Violence Victim Definitions
DCJS collects information on victims of domestic violence reported through the Uniform Crime Reporting (UCR) program. Domestic violence victims are identified by their relationship to the offender and are categorized as:
Intimate Partner (Female/Male) – Includes spouse, ex-spouse, and those in an intimate relationship (including dating or formerly dating relationships, whether or not the intimate partners had ever lived together).
Other Family – Includes sibling, child, grandparent, grandchild, in-law, stepparent, stepsibling, and other blood and in-law relationships.
Arrest Data Definitions
DCJS maintains information on adult arrests and dispositions from the Computerized Criminal History System (CCH). CCH data is based on arrest fingerprint cards submitted to DCJS by law enforcement agencies in accordance with Section 160.20 of the Criminal Procedure Law. Fingerprints are submitted through either an automated system or by mailing in fingerprint cards.
Felony and Misdemeanor Arrests within Jurisdiction - The number of arrests reported on CCH for the reporting month or year within the GIVE jurisdiction.
Parolee Arrests within Jurisdiction - The number of arrests of parolees reported on CCH for the reporting month or year within the GIVE jurisdiction (May include multiple arrests for the same parolee during the reporting month or year). These counts are also included in the above felony and misdemeanor totals.
Probationer Arrests within Jurisdiction - The number of arrests of probationers reported on CCH for the reporting month or year within the GIVE jurisdiction (May include multiple arrests for the same probationers during the reporting month or year). These counts are also included in the above felony and misdemeanor totals.
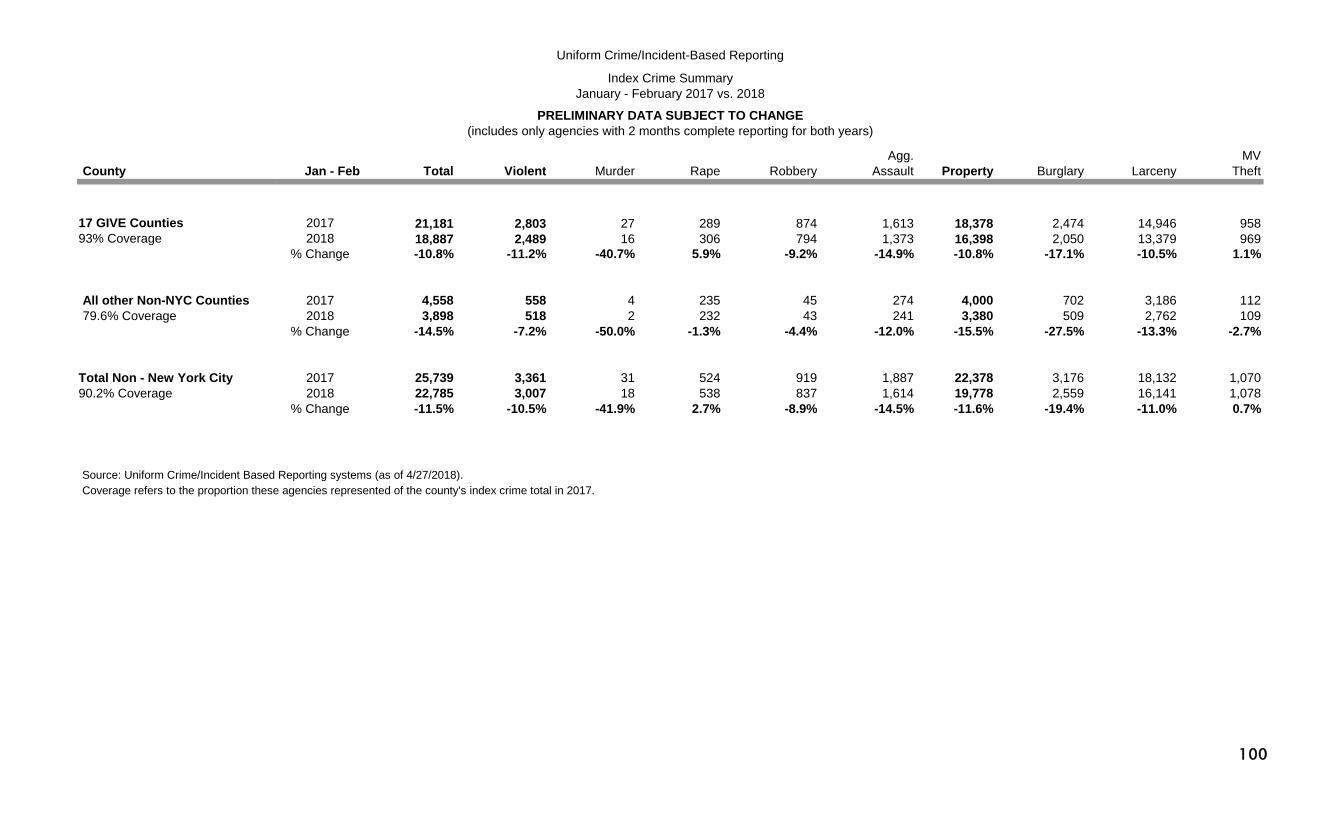
Agg. MVCounty Jan - Feb Total Violent Murder Rape Robbery Assault Property Burglary Larceny Theft
17 GIVE Counties 2017 21,181 2,803 27 289 874 1,613 18,378 2,474 14,946 95893% Coverage 2018 18,887 2,489 16 306 794 1,373 16,398 2,050 13,379 969
% Change -10.8% -11.2% -40.7% 5.9% -9.2% -14.9% -10.8% -17.1% -10.5% 1.1%
All other Non-NYC Counties 2017 4,558 558 4 235 45 274 4,000 702 3,186 11279.6% Coverage 2018 3,898 518 2 232 43 241 3,380 509 2,762 109
% Change -14.5% -7.2% -50.0% -1.3% -4.4% -12.0% -15.5% -27.5% -13.3% -2.7%
Total Non - New York City 2017 25,739 3,361 31 524 919 1,887 22,378 3,176 18,132 1,07090.2% Coverage 2018 22,785 3,007 18 538 837 1,614 19,778 2,559 16,141 1,078
% Change -11.5% -10.5% -41.9% 2.7% -8.9% -14.5% -11.6% -19.4% -11.0% 0.7%
Source: Uniform Crime/Incident Based Reporting systems (as of 4/27/2018). Coverage refers to the proportion these agencies represented of the county's index crime total in 2017.
Uniform Crime/Incident-Based Reporting
Index Crime SummaryJanuary - February 2017 vs. 2018
PRELIMINARY DATA SUBJECT TO CHANGE(includes only agencies with 2 months complete reporting for both years)
100

Current CurrentMonth Month
Apr 17 May 17 Jun 17 Jul 17 Aug 17 Sep 17 Oct 17 Nov 17 Dec 17 Jan 18 Feb 18 Mar 18 2017 2018 2013-17
Total Index Crimes 6,383 7,121 7,410 8,002 8,335 7,692 7,620 6,945 6,686 5,986 5,316 5,611 5,944 5,611 -5.6% 18,395 16,913 -8.1% 19,812 16,913 -14.6%
Violent Crimes 1,113 1,234 1,271 1,329 1,315 1,237 1,168 1,081 1,022 965 841 952 997 952 -4.5% 3,010 2,758 -8.4% 3,123 2,758 -11.7%Murder 21 15 13 17 12 9 18 12 21 7 6 15 15 15 0.0% 39 28 -28.2% 41 28 -31.4%Rape* 76 78 96 83 86 90 87 85 77 73 68 80 81 80 -1.2% 216 221 2.3% 192 221 N/ARobbery 344 359 355 349 415 424 358 384 365 355 307 276 297 276 -7.1% 986 938 -4.9% 1,141 938 -17.8%Aggravated Assault 672 782 807 880 802 714 705 600 559 530 460 581 604 581 -3.8% 1,769 1,571 -11.2% 1,749 1,571 -10.2%
Property Crimes 5,270 5,887 6,139 6,673 7,020 6,455 6,452 5,864 5,664 5,021 4,475 4,659 4,947 4,659 -5.8% 15,385 14,155 -8.0% 16,689 14,155 -15.2%Burglary 785 877 884 1,022 1,073 1,002 1,031 971 819 715 561 596 696 596 -14.4% 2,310 1,872 -19.0% 3,008 1,872 -37.8%Larceny 4,126 4,639 4,906 5,219 5,523 5,053 5,063 4,539 4,443 3,915 3,546 3,722 3,925 3,722 -5.2% 12,047 11,183 -7.2% 12,592 11,183 -11.2%Motor Vehicle Theft 359 371 349 432 424 400 358 354 402 391 368 341 326 341 4.6% 1,028 1,100 7.0% 1,088 1,100 1.1%
5 Year % Change 10 Year % Change % Change Average 5 Year Avg. Average 10 Year Avg.
2008 2009 2010 2011 2012 2013 2014 2015* 2016* 2017* 2016-17 2012-16 vs. 2017 2007-16 vs. 2017
Total Index Crimes 120,892 118,414 118,839 115,471 111,660 104,505 99,397 92,562 88,698 84,589 -4.6% 99,364 -14.9% 108,797 -22.3%
Violent Crimes 18,002 18,016 17,525 16,787 17,127 15,801 14,780 15,058 14,613 13,780 -5.7% 15,476 -11.0% 16,534 -16.7%Murder 239 235 245 165 192 213 202 195 225 177 -21.3% 205 -13.8% 213 -17.0%Rape* 793 701 743 667 694 643 609 1,100 970 974 0.4% N/A N/A N/A N/ARobbery 7,442 7,293 6,767 6,540 6,371 6,127 5,545 5,167 5,021 4,339 -13.6% 5,646 -23.2% 6,338 -31.5%Aggravated Assault 9,528 9,787 9,770 9,415 9,870 8,818 8,424 8,596 8,397 8,290 -1.3% 8,821 -6.0% 9,207 -10.0%
Property Crimes 102,890 100,398 101,314 98,684 94,533 88,704 84,617 77,504 74,085 70,809 -4.4% 83,889 -15.6% 92,263 -23.3%Burglary 21,706 20,856 22,858 23,166 21,183 18,379 16,246 13,599 12,305 10,774 -12.4% 16,342 -34.1% 19,084 -43.5%Larceny 72,699 72,235 72,057 69,919 68,085 65,380 63,384 58,924 56,954 55,558 -2.5% 62,545 -11.2% 66,903 -17.0%Motor Vehicle Theft 8,485 7,307 6,399 5,599 5,265 4,945 4,987 4,981 4,826 4,477 -7.2% 5,001 -10.5% 6,276 -28.7%
GIVE Totals represent the sum of Index Crimes reported by 20 police agencies participating in the initiative. Prior to April 2014, those totals represented Index Crimes reported by 17 police agencies.
*PLEASE SEE Definitions Page for Reporting Changes to the Index Crime of Rape effective March 2016, which also impacts violent and Index crime totals.
NOTE: Percentage change is not calculated when counts are fewer than 10 and the 5-year and 10-year Averages are rounded to the nearest whole number.
As of 05/02/2018GIVE Total
Index Crimes
Year to Date Comparisons
% Change 2017-182017 2018
% Change From Month in Previous Year
5 Year Average
% Change5 Year Avg.
vs. 20182018
200

Current CurrentMonth Month % Change
Apr 17 May 17 Jun 17 Jul 17 Aug 17 Sep 17 Oct 17 Nov 17 Dec 17 Jan 18 Feb 18 Mar 18 2017 2018 2017 2018 2017-18 2013-17
Violent Crimes 1,113 1,234 1,271 1,329 1,315 1,237 1,168 1,081 1,022 965 841 952 997 952 -4.5% 3,010 2,758 -8.4% 3,123 2,758 -11.7%Firearm Related 227 266 237 283 318 322 246 241 250 189 202 180 187 180 -3.7% 712 571 -19.8% 758 571 -24.7%Percent Firearm 20.4% 21.6% 18.6% 21.3% 24.2% 26.0% 21.1% 22.3% 24.5% 19.6% 24.0% 18.9% 18.8% 18.9% 23.7% 20.7% 24.3% 20.7%
Murder 21 15 13 17 12 9 18 12 21 7 6 15 15 15 0.0% 39 28 -28.2% 41 28 -31.4%
Firearm Related 11 8 9 9 5 6 11 5 13 3 2 9 10 9 30 14 -53.3% 26 14 -46.2%Percent Firearm 52.4% 53.3% 69.2% 52.9% 41.7% 66.7% 61.1% 41.7% 61.9% 42.9% 33.3% 60.0% 66.7% 60.0% 76.9% 50.0% 63.7% 50.0%
Rape* 76 78 96 83 86 90 87 85 77 73 68 80 81 80 -1.2% 216 221 2.3% N/A 221 N/AFirearm Related 0 1 0 2 2 0 0 0 2 0 4 0 2 0 3 4 N/A 4 N/APercent Firearm 0.0% 1.3% 0.0% 2.4% 2.3% 0.0% 0.0% 0.0% 2.6% 0.0% 5.9% 0.0% 2.5% 0.0% 1.4% 1.8% N/A 1.8% N/A
Robbery 344 359 355 349 415 424 358 384 365 355 307 276 297 276 -7.1% 986 938 -4.9% 1,141 938 -17.8%Firearm Related 95 104 83 88 134 166 99 123 133 111 113 86 76 86 13.2% 312 310 -0.6% 394 310 -21.3%Percent Firearm 27.6% 29.0% 23.4% 25.2% 32.3% 39.2% 27.7% 32.0% 36.4% 31.3% 36.8% 31.2% 25.6% 31.2% 31.6% 33.0% 34.5% 33.0%
Aggravated Assault 672 782 807 880 802 714 705 600 559 530 460 581 604 581 -3.8% 1,769 1,571 -11.2% 1,749 1,571 -10.2%Firearm Related 121 153 145 184 177 150 136 113 102 75 83 85 99 85 -14.1% 367 243 -33.8% 334 243 -27.3%Percent Firearm 18.0% 19.6% 18.0% 20.9% 22.1% 21.0% 19.3% 18.8% 18.2% 14.2% 18.0% 14.6% 16.4% 14.6% 20.7% 15.5% 19.1% 15.5%
5 Year % Change 10 Year % Change % Change Average 5 Year Avg. Average 10 Year Avg.
2008 2009 2010 2011 2012 2013 2014 2015* 2016* 2017* 2016-17 2012-16 vs. 2017 2007-16 vs. 2017
Violent Crimes 18,002 18,016 17,525 16,787 17,127 15,801 14,780 15,058 14,613 13,780 -5.7% 15,476 -11.0% 16,534 -16.7%Firearm Related 4,232 4,242 4,006 3,886 3,931 3,792 3,635 3,500 3,691 3,102 -16.0% 3,710 -16.4% 3,911 -20.7%Percent Firearm 23.5% 23.5% 22.9% 23.1% 23.0% 24.0% 24.6% 23.2% 25.3% 22.5% 24.0% 23.7%
Murder 239 235 245 165 192 213 202 195 225 177 -21.3% 205 -13.8% 213 -17.0%Firearm Related 153 154 164 92 134 138 125 129 137 107 -21.9% 133 -19.3% 138 -22.3%Percent Firearm 64.0% 65.5% 66.9% 55.8% 69.8% 64.8% 61.9% 66.2% 60.9% 60.5% 64.7% 64.4%
Rape* 793 701 743 667 694 643 609 1,100 970 974 0.4% N/A N/A N/A N/AFirearm Related 23 16 10 14 26 24 23 7 11 10 -9.1% N/A N/A N/A N/APercent Firearm 2.9% 2.3% 1.3% 2.1% 3.7% 3.7% 3.8% 0.6% 1.1% 1.0% N/A N/A N/A N/A
Robbery 7,442 7,293 6,767 6,540 6,371 6,127 5,545 5,167 5,021 4,339 -13.6% 5,646 -23.2% 6,338 -31.5%Firearm Related 2,360 2,345 2,104 2,117 2,050 2,027 1,867 1,656 1,729 1,337 -22.7% 1,866 -28.3% 2,049 -34.7%Percent Firearm 31.7% 32.2% 31.1% 32.4% 32.2% 33.1% 33.7% 32.0% 34.4% 30.8% 33.1% 32.4%
Aggravated Assault 9,528 9,787 9,770 9,415 9,870 8,818 8,424 8,596 8,397 8,290 -1.3% 8,821 -6.0% 9,207 -10.0%Firearm Related 1,696 1,727 1,728 1,663 1,721 1,603 1,620 1,708 1,814 1,648 -9.2% 1,693 -2.7% 1,707 -3.5%Percent Firearm 17.8% 17.6% 17.7% 17.7% 17.4% 18.2% 19.2% 19.9% 21.6% 19.9% 19.3% 18.6%
GIVE Totals represent the sum of Index Crimes reported by 20 police agencies participating in the initiative. Prior to April 2014, those totals represented Index Crimes reported by 17 police agencies.
*PLEASE SEE Definitions Page for Reporting Changes to the Index Crime of Rape effective March 2016, which also impacts violent crime totals.
NOTE: Percentage change is not calculated when counts are fewer than 10 and the 5-year and 10-year Averages are rounded to the nearest whole number.
Violent Crimes by FirearmAs of 05/02/2018
GIVE Total
% Change From Month in
Previous Year
5 Year Average
% Change5 Year Avg. vs.
20182018
Year to Date Comparisons
201
Current CurrentMonth Month % Change
Apr 17 May 17 Jun 17 Jul 17 Aug 17 Sep 17 Oct 17 Nov 17 Dec 17 Jan 18 Feb 18 Mar 18 2017 2018 2017 2018 2017-18 2013-17
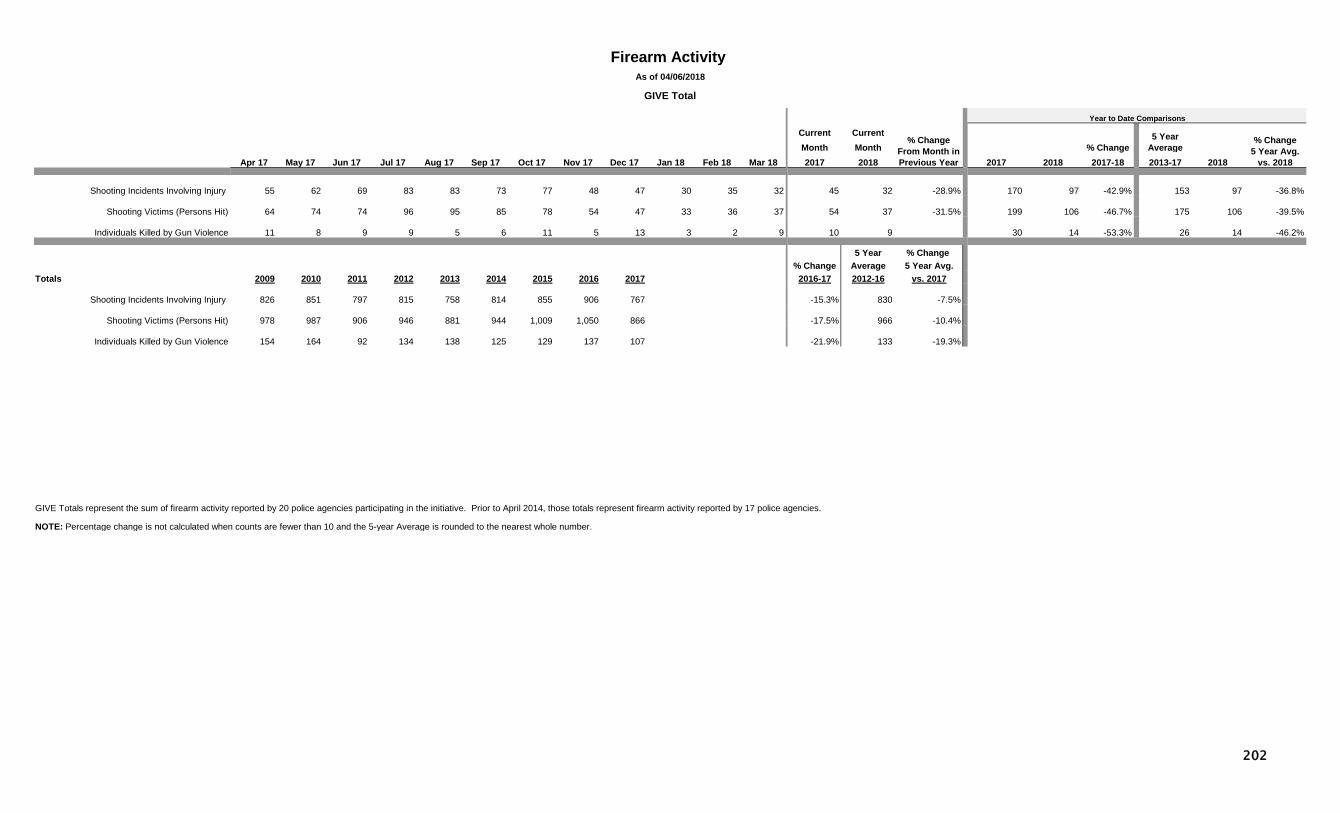
Shooting Incidents Involving Injury 55 62 69 83 83 73 77 48 47 30 35 32 45 32 -28.9% 170 97 -42.9% 153 97 -36.8%
Shooting Victims (Persons Hit) 64 74 74 96 95 85 78 54 47 33 36 37 54 37 -31.5% 199 106 -46.7% 175 106 -39.5%
Individuals Killed by Gun Violence 11 8 9 9 5 6 11 5 13 3 2 9 10 9 30 14 -53.3% 26 14 -46.2%
5 Year % Change % Change Average 5 Year Avg.
Totals 2009 2010 2011 2012 2013 2014 2015 2016 2017 2016-17 2012-16 vs. 2017
Shooting Incidents Involving Injury 826 851 797 815 758 814 855 906 767 -15.3% 830 -7.5%
Shooting Victims (Persons Hit) 978 987 906 946 881 944 1,009 1,050 866 -17.5% 966 -10.4%
Individuals Killed by Gun Violence 154 164 92 134 138 125 129 137 107 -21.9% 133 -19.3%
GIVE Totals represent the sum of firearm activity reported by 20 police agencies participating in the initiative. Prior to April 2014, those totals represent firearm activity reported by 17 police agencies.
NOTE: Percentage change is not calculated when counts are fewer than 10 and the 5-year Average is rounded to the nearest whole number.
Firearm Activity As of 04/06/2018
GIVE Total
Year to Date Comparisons
% Change From Month in Previous Year
5 Year Average
% Change5 Year Avg.
vs. 20182018
202
% Change % ChangeFrom Current Current From Month % Change
Previous Month Month in Previous YTD YTD in Apr 17 May 17 Jun 17 Jul 17 Aug 17 Sep 17 Oct 17 Nov 17 Dec 17 Jan 18 Feb 18* Mar 18* Month 2017 2018 Year 2017 2018 YTD
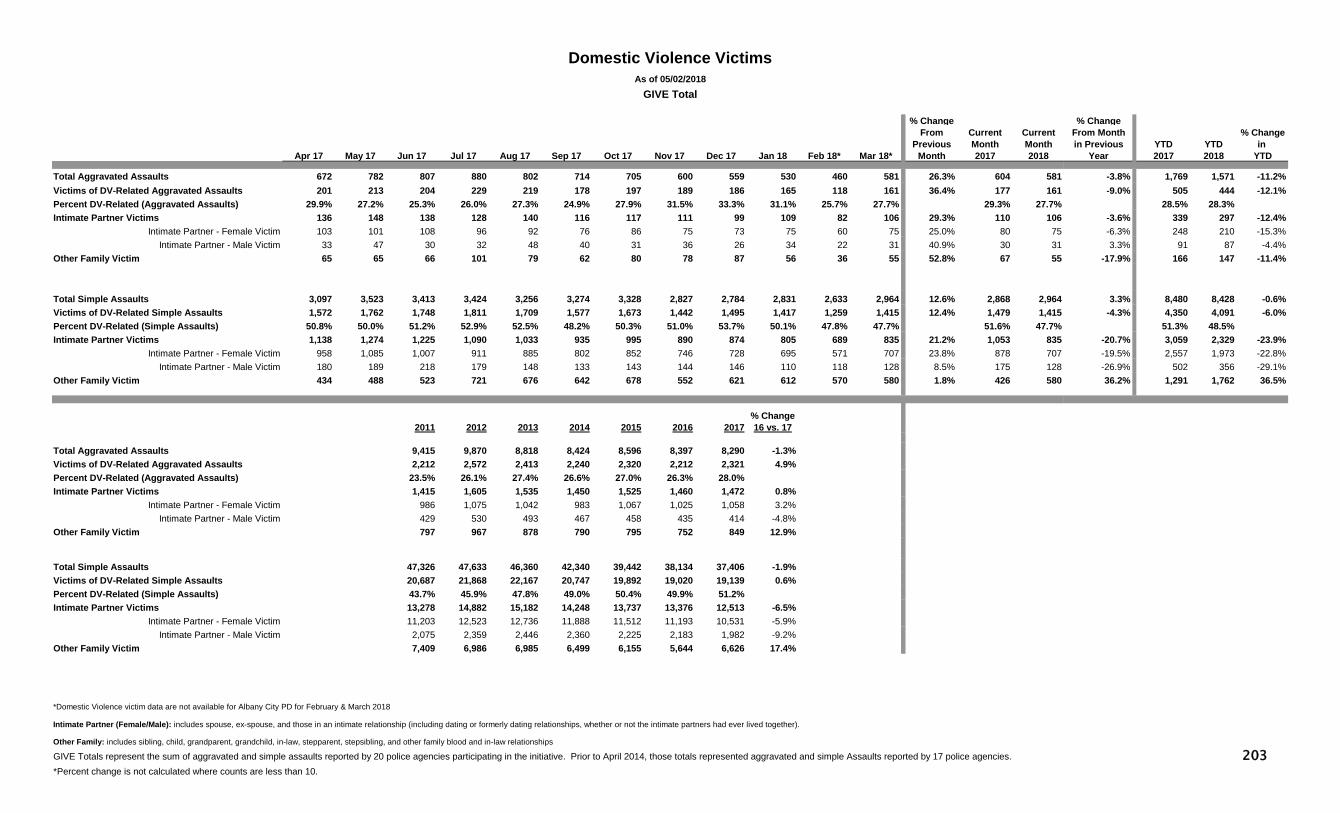
Total Aggravated Assaults 672 782 807 880 802 714 705 600 559 530 460 581 26.3% 604 581 -3.8% 1,769 1,571 -11.2%Victims of DV-Related Aggravated Assaults 201 213 204 229 219 178 197 189 186 165 118 161 36.4% 177 161 -9.0% 505 444 -12.1%Percent DV-Related (Aggravated Assaults) 29.9% 27.2% 25.3% 26.0% 27.3% 24.9% 27.9% 31.5% 33.3% 31.1% 25.7% 27.7% 29.3% 27.7% 28.5% 28.3% Intimate Partner Victims 136 148 138 128 140 116 117 111 99 109 82 106 29.3% 110 106 -3.6% 339 297 -12.4%
Intimate Partner - Female Victim 103 101 108 96 92 76 86 75 73 75 60 75 25.0% 80 75 -6.3% 248 210 -15.3%Intimate Partner - Male Victim 33 47 30 32 48 40 31 36 26 34 22 31 40.9% 30 31 3.3% 91 87 -4.4%
Other Family Victim 65 65 66 101 79 62 80 78 87 56 36 55 52.8% 67 55 -17.9% 166 147 -11.4%
Total Simple Assaults 3,097 3,523 3,413 3,424 3,256 3,274 3,328 2,827 2,784 2,831 2,633 2,964 12.6% 2,868 2,964 3.3% 8,480 8,428 -0.6%Victims of DV-Related Simple Assaults 1,572 1,762 1,748 1,811 1,709 1,577 1,673 1,442 1,495 1,417 1,259 1,415 12.4% 1,479 1,415 -4.3% 4,350 4,091 -6.0%Percent DV-Related (Simple Assaults) 50.8% 50.0% 51.2% 52.9% 52.5% 48.2% 50.3% 51.0% 53.7% 50.1% 47.8% 47.7% 51.6% 47.7% 51.3% 48.5% Intimate Partner Victims 1,138 1,274 1,225 1,090 1,033 935 995 890 874 805 689 835 21.2% 1,053 835 -20.7% 3,059 2,329 -23.9%
Intimate Partner - Female Victim 958 1,085 1,007 911 885 802 852 746 728 695 571 707 23.8% 878 707 -19.5% 2,557 1,973 -22.8%Intimate Partner - Male Victim 180 189 218 179 148 133 143 144 146 110 118 128 8.5% 175 128 -26.9% 502 356 -29.1%
Other Family Victim 434 488 523 721 676 642 678 552 621 612 570 580 1.8% 426 580 36.2% 1,291 1,762 36.5%
% Change2011 2012 2013 2014 2015 2016 2017 16 vs. 17
Total Aggravated Assaults 9,415 9,870 8,818 8,424 8,596 8,397 8,290 -1.3%Victims of DV-Related Aggravated Assaults 2,212 2,572 2,413 2,240 2,320 2,212 2,321 4.9%Percent DV-Related (Aggravated Assaults) 23.5% 26.1% 27.4% 26.6% 27.0% 26.3% 28.0% Intimate Partner Victims 1,415 1,605 1,535 1,450 1,525 1,460 1,472 0.8%
Intimate Partner - Female Victim 986 1,075 1,042 983 1,067 1,025 1,058 3.2%Intimate Partner - Male Victim 429 530 493 467 458 435 414 -4.8%
Other Family Victim 797 967 878 790 795 752 849 12.9%
Total Simple Assaults 47,326 47,633 46,360 42,340 39,442 38,134 37,406 -1.9%Victims of DV-Related Simple Assaults 20,687 21,868 22,167 20,747 19,892 19,020 19,139 0.6%Percent DV-Related (Simple Assaults) 43.7% 45.9% 47.8% 49.0% 50.4% 49.9% 51.2% Intimate Partner Victims 13,278 14,882 15,182 14,248 13,737 13,376 12,513 -6.5%
Intimate Partner - Female Victim 11,203 12,523 12,736 11,888 11,512 11,193 10,531 -5.9%Intimate Partner - Male Victim 2,075 2,359 2,446 2,360 2,225 2,183 1,982 -9.2%
Other Family Victim 7,409 6,986 6,985 6,499 6,155 5,644 6,626 17.4%
*Domestic Violence victim data are not available for Albany City PD for February & March 2018
Intimate Partner (Female/Male): includes spouse, ex-spouse, and those in an intimate relationship (including dating or formerly dating relationships, whether or not the intimate partners had ever lived together).
Other Family: includes sibling, child, grandparent, grandchild, in-law, stepparent, stepsibling, and other family blood and in-law relationships
GIVE Totals represent the sum of aggravated and simple assaults reported by 20 police agencies participating in the initiative. Prior to April 2014, those totals represented aggravated and simple Assaults reported by 17 police agencies.*Percent change is not calculated where counts are less than 10.
Domestic Violence VictimsAs of 05/02/2018
GIVE Total
203
% ChangeCurrent Current From MonthMonth Month in Previous % Change
Apr 17 May 17 Jun 17 Jul 17 Aug 17 Sep 17 Oct 17 Nov 17 Dec 17 Jan 18 Feb 18 Mar 18 2017 2018 Year 2017 2018 2017-18 2013-17
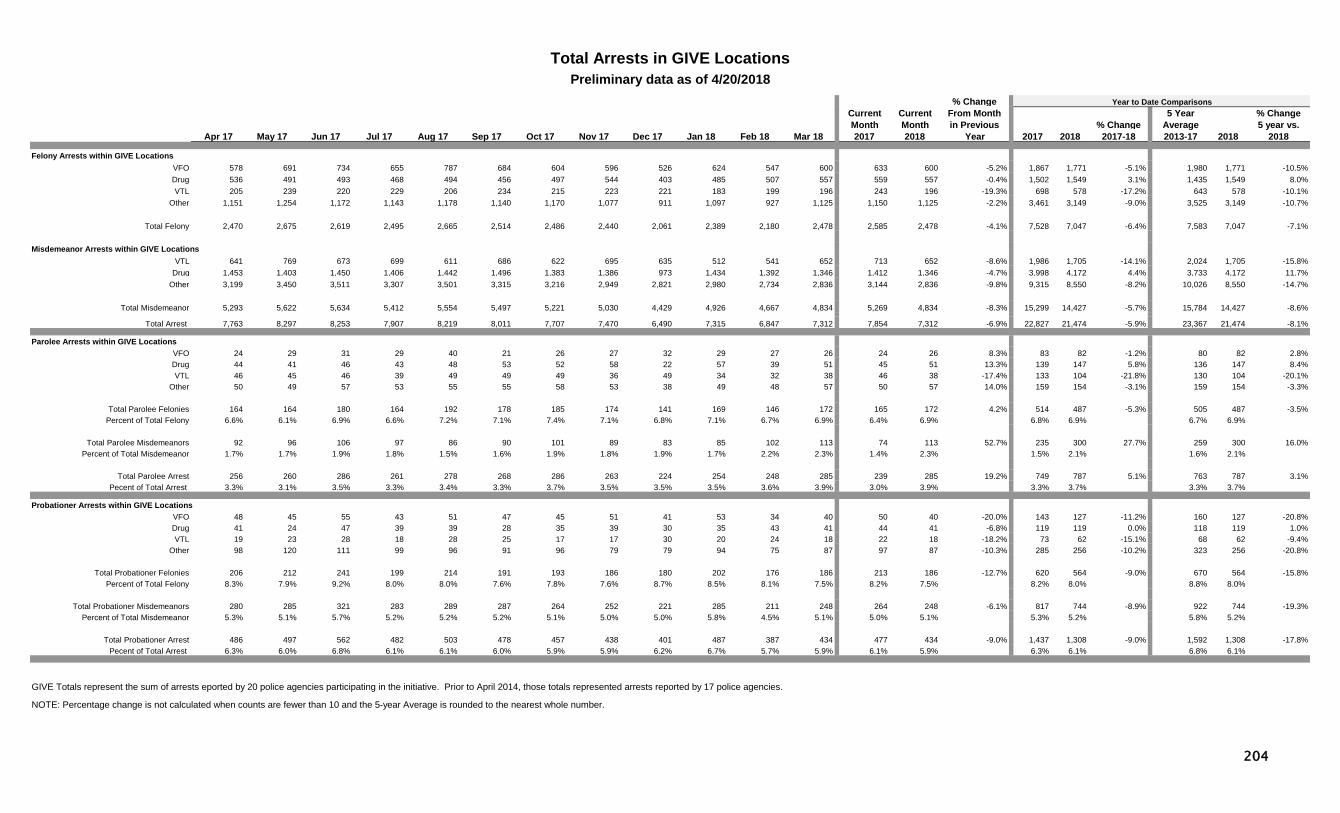
Felony Arrests within GIVE LocationsVFO 578 691 734 655 787 684 604 596 526 624 547 600 633 600 -5.2% 1,867 1,771 -5.1% 1,980 1,771 -10.5%Drug 536 491 493 468 494 456 497 544 403 485 507 557 559 557 -0.4% 1,502 1,549 3.1% 1,435 1,549 8.0%VTL 205 239 220 229 206 234 215 223 221 183 199 196 243 196 -19.3% 698 578 -17.2% 643 578 -10.1%
Other 1,151 1,254 1,172 1,143 1,178 1,140 1,170 1,077 911 1,097 927 1,125 1,150 1,125 -2.2% 3,461 3,149 -9.0% 3,525 3,149 -10.7%
Total Felony 2,470 2,675 2,619 2,495 2,665 2,514 2,486 2,440 2,061 2,389 2,180 2,478 2,585 2,478 -4.1% 7,528 7,047 -6.4% 7,583 7,047 -7.1%
Misdemeanor Arrests within GIVE LocationsVTL 641 769 673 699 611 686 622 695 635 512 541 652 713 652 -8.6% 1,986 1,705 -14.1% 2,024 1,705 -15.8%
Drug 1,453 1,403 1,450 1,406 1,442 1,496 1,383 1,386 973 1,434 1,392 1,346 1,412 1,346 -4.7% 3,998 4,172 4.4% 3,733 4,172 11.7%Other 3,199 3,450 3,511 3,307 3,501 3,315 3,216 2,949 2,821 2,980 2,734 2,836 3,144 2,836 -9.8% 9,315 8,550 -8.2% 10,026 8,550 -14.7%
Total Misdemeanor 5,293 5,622 5,634 5,412 5,554 5,497 5,221 5,030 4,429 4,926 4,667 4,834 5,269 4,834 -8.3% 15,299 14,427 -5.7% 15,784 14,427 -8.6%
Total Arrest 7,763 8,297 8,253 7,907 8,219 8,011 7,707 7,470 6,490 7,315 6,847 7,312 7,854 7,312 -6.9% 22,827 21,474 -5.9% 23,367 21,474 -8.1%
Parolee Arrests within GIVE LocationsVFO 24 29 31 29 40 21 26 27 32 29 27 26 24 26 8.3% 83 82 -1.2% 80 82 2.8%Drug 44 41 46 43 48 53 52 58 22 57 39 51 45 51 13.3% 139 147 5.8% 136 147 8.4%VTL 46 45 46 39 49 49 49 36 49 34 32 38 46 38 -17.4% 133 104 -21.8% 130 104 -20.1%
Other 50 49 57 53 55 55 58 53 38 49 48 57 50 57 14.0% 159 154 -3.1% 159 154 -3.3%
Total Parolee Felonies 164 164 180 164 192 178 185 174 141 169 146 172 165 172 4.2% 514 487 -5.3% 505 487 -3.5%Percent of Total Felony 6.6% 6.1% 6.9% 6.6% 7.2% 7.1% 7.4% 7.1% 6.8% 7.1% 6.7% 6.9% 6.4% 6.9% 6.8% 6.9% 6.7% 6.9%
Total Parolee Misdemeanors 92 96 106 97 86 90 101 89 83 85 102 113 74 113 52.7% 235 300 27.7% 259 300 16.0%Percent of Total Misdemeanor 1.7% 1.7% 1.9% 1.8% 1.5% 1.6% 1.9% 1.8% 1.9% 1.7% 2.2% 2.3% 1.4% 2.3% 1.5% 2.1% 1.6% 2.1%
Total Parolee Arrest 256 260 286 261 278 268 286 263 224 254 248 285 239 285 19.2% 749 787 5.1% 763 787 3.1%Pecent of Total Arrest 3.3% 3.1% 3.5% 3.3% 3.4% 3.3% 3.7% 3.5% 3.5% 3.5% 3.6% 3.9% 3.0% 3.9% 3.3% 3.7% 3.3% 3.7%
Probationer Arrests within GIVE LocationsVFO 48 45 55 43 51 47 45 51 41 53 34 40 50 40 -20.0% 143 127 -11.2% 160 127 -20.8%Drug 41 24 47 39 39 28 35 39 30 35 43 41 44 41 -6.8% 119 119 0.0% 118 119 1.0%VTL 19 23 28 18 28 25 17 17 30 20 24 18 22 18 -18.2% 73 62 -15.1% 68 62 -9.4%
Other 98 120 111 99 96 91 96 79 79 94 75 87 97 87 -10.3% 285 256 -10.2% 323 256 -20.8%
Total Probationer Felonies 206 212 241 199 214 191 193 186 180 202 176 186 213 186 -12.7% 620 564 -9.0% 670 564 -15.8%Percent of Total Felony 8.3% 7.9% 9.2% 8.0% 8.0% 7.6% 7.8% 7.6% 8.7% 8.5% 8.1% 7.5% 8.2% 7.5% 8.2% 8.0% 8.8% 8.0%
Total Probationer Misdemeanors 280 285 321 283 289 287 264 252 221 285 211 248 264 248 -6.1% 817 744 -8.9% 922 744 -19.3%Percent of Total Misdemeanor 5.3% 5.1% 5.7% 5.2% 5.2% 5.2% 5.1% 5.0% 5.0% 5.8% 4.5% 5.1% 5.0% 5.1% 5.3% 5.2% 5.8% 5.2%
Total Probationer Arrest 486 497 562 482 503 478 457 438 401 487 387 434 477 434 -9.0% 1,437 1,308 -9.0% 1,592 1,308 -17.8%Pecent of Total Arrest 6.3% 6.0% 6.8% 6.1% 6.1% 6.0% 5.9% 5.9% 6.2% 6.7% 5.7% 5.9% 6.1% 5.9% 6.3% 6.1% 6.8% 6.1%
GIVE Totals represent the sum of arrests eported by 20 police agencies participating in the initiative. Prior to April 2014, those totals represented arrests reported by 17 police agencies.
NOTE: Percentage change is not calculated when counts are fewer than 10 and the 5-year Average is rounded to the nearest whole number.
Total Arrests in GIVE LocationsPreliminary data as of 4/20/2018
5 Year Average
% Change5 year vs.
20182018
Year to Date Comparisons
204

Current CurrentMonth Month
Apr 17 May 17 Jun 17 Jul 17 Aug 17 Sep 17 Oct 17 Nov 17 Dec 17 Jan 18 Feb 18 Mar 18 2017 2018 2013-17
Total Index Crimes 283 346 404 440 411 438 393 352 318 301 298 272 280 272 -2.9% 892 871 -2.4% 897 871 -2.9%
Violent Crimes 84 71 86 101 71 65 83 70 55 74 57 48 63 48 -23.8% 192 179 -6.8% 172 179 3.8%Murder 1 1 2 0 0 0 1 0 1 1 0 0 0 0 2 1 1 1 Rape* 1 5 1 2 7 7 9 7 3 4 4 7 5 7 12 15 25.0% 9 15 N/ARobbery 21 22 21 20 18 21 28 17 22 22 19 6 19 6 57 47 -17.5% 54 47 -13.6%Aggravated Assault 61 43 62 79 46 37 45 46 29 47 34 35 39 35 -10.3% 121 116 -4.1% 108 116 7.6%
Property Crimes 199 275 318 339 340 373 310 282 263 227 241 224 217 224 3.2% 700 692 -1.1% 725 692 -4.5%Burglary 30 45 38 39 37 50 51 38 32 26 23 30 14 30 114.3% 73 79 8.2% 110 79 -28.2%Larceny 158 221 275 292 294 313 250 233 217 187 207 181 196 181 -7.7% 604 575 -4.8% 588 575 -2.3%Motor Vehicle Theft 11 9 5 8 9 10 9 11 14 14 11 13 7 13 23 38 65.2% 26 38 43.9%
5 Year % Change 10 Year % Change % Change Average 5 Year Avg. Average 10 Year Avg.
2008 2009 2010 2011 2012 2013 2014 2015* 2016* 2017* 2016-17 2012-16 vs. 2017 2007-16 vs. 2017
Total Index Crimes 5,489 5,255 5,633 5,557 5,128 4,829 4,660 4,271 4,320 4,277 -1.0% 4,642 -7.9% 5,052 -15.3%
Violent Crimes 1,060 1,004 983 940 800 793 775 823 849 878 3.4% 808 8.7% 916 -4.1%Murder 10 9 3 4 5 8 8 5 2 8 6 6 Rape* 49 45 42 32 41 32 27 49 58 54 -6.9% N/A N/A N/A N/ARobbery 372 327 316 321 246 227 240 240 248 247 -0.4% 240 2.8% 291 -15.2%Aggravated Assault 629 623 622 583 508 526 500 529 541 569 5.2% 521 9.3% 577 -1.4%
Property Crimes 4,429 4,251 4,650 4,617 4,328 4,036 3,885 3,448 3,471 3,399 -2.1% 3,834 -11.3% 4,136 -17.8%Burglary 1,034 877 927 893 889 684 680 480 491 433 -11.8% 645 -32.8% 792 -45.3%Larceny 3,170 3,141 3,497 3,556 3,287 3,209 3,083 2,849 2,869 2,857 -0.4% 3,059 -6.6% 3,166 -9.8%Motor Vehicle Theft 225 233 226 168 152 143 122 119 111 109 -1.8% 129 -15.8% 178 -38.9%
*PLEASE SEE Definitions Page for Reporting Changes to the Index Crime of Rape effective March 2016, which also impacts violent and Index crime totals.
NOTE: Percentage change is not calculated when counts are fewer than 10 and the 5-year and 10-year Averages are rounded to the nearest whole number.
Index CrimesAs of 04/15/2018
Year to Date Comparisons
% Change 2017-182017 2018
% Change From Month in Previous Year
5 Year Average
% Change5 Year Avg.
vs. 20182018
Albany City Police Department (IBR)
300

Current CurrentMonth Month % Change
Apr 17 May 17 Jun 17 Jul 17 Aug 17 Sep 17 Oct 17 Nov 17 Dec 17 Jan 18 Feb 18 Mar 18 2017 2018 2017 2018 2017-18 2013-17
Violent Crimes 84 71 86 101 71 65 83 70 55 74 57 48 63 48 -23.8% 192 179 -6.8% 172 179 3.8%Firearm Related 10 10 4 7 7 10 15 8 10 14 16 9 5 9 40 39 -2.5% 27 39 46.6%Percent Firearm 11.9% 14.1% 4.7% 6.9% 9.9% 15.4% 18.1% 11.4% 18.2% 18.9% 28.1% 18.8% 7.9% 18.8% 20.8% 21.8% 15.4% 21.8%
Murder 1 1 2 0 0 0 1 0 1 1 0 0 0 0 2 1 1 1
Firearm Related 1 0 1 0 0 0 1 0 1 1 0 0 0 0 1 1 0 1 Percent Firearm 100.0% 0.0% 50.0% 100.0% 100.0% 100.0% 50.0% 100.0% 50.0% 100.0%
Rape* 1 5 1 2 7 7 9 7 3 4 4 7 5 7 12 15 25.0% N/A 15 N/AFirearm Related 0 0 0 0 0 0 0 0 0 0 0 0 0 0 0 0 N/A 0 N/APercent Firearm 0.0% 0.0% 0.0% 0.0% 0.0% 0.0% 0.0% 0.0% 0.0% 0.0% 0.0% 0.0% 0.0% 0.0% 0.0% 0.0% N/A 0.0% N/A
Robbery 21 22 21 20 18 21 28 17 22 22 19 6 19 6 57 47 -17.5% 54 47 -13.6%Firearm Related 4 8 2 0 4 8 10 2 9 9 10 4 2 4 17 23 35.3% 16 23 47.4%Percent Firearm 19.0% 36.4% 9.5% 0.0% 22.2% 38.1% 35.7% 11.8% 40.9% 40.9% 52.6% 66.7% 10.5% 66.7% 29.8% 48.9% 28.7% 48.9%
Aggravated Assault 61 43 62 79 46 37 45 46 29 47 34 35 39 35 -10.3% 121 116 -4.1% 108 116 7.6%Firearm Related 5 2 1 7 3 2 4 6 0 4 6 5 3 5 22 15 -31.8% 11 15 41.5%Percent Firearm 8.2% 4.7% 1.6% 8.9% 6.5% 5.4% 8.9% 13.0% 0.0% 8.5% 17.6% 14.3% 7.7% 14.3% 18.2% 12.9% 9.8% 12.9%
5 Year % Change 10 Year % Change % Change Average 5 Year Avg. Average 10 Year Avg.
2008 2009 2010 2011 2012 2013 2014 2015* 2016* 2017* 2016-17 2012-16 vs. 2017 2007-16 vs. 2017
Violent Crimes 1,060 1,004 983 940 800 793 775 823 849 878 3.4% 808 8.7% 916 -4.1%Firearm Related 207 160 132 171 117 131 124 93 104 121 16.3% 114 6.3% 143 -15.5%Percent Firearm 19.5% 15.9% 13.4% 18.2% 14.6% 16.5% 16.0% 11.3% 12.2% 13.8% 14.1% 15.5%
Murder 10 9 3 4 5 8 8 5 2 8 6 6 Firearm Related 6 7 1 2 3 5 5 3 1 5 3 4 Percent Firearm 60.0% 77.8% 33.3% 50.0% 60.0% 62.5% 62.5% 60.0% 50.0% 62.5% 59.0% 61.6%
Rape* 49 45 42 32 41 32 27 49 58 54 -6.9% N/A N/A N/A N/AFirearm Related 0 0 0 0 0 1 0 0 0 0 N/A N/A N/A N/APercent Firearm 0.0% 0.0% 0.0% 0.0% 0.0% 3.1% 0.0% 0.0% 0.0% 0.0% N/A N/A N/A N/A
Robbery 372 327 316 321 246 227 240 240 248 247 -0.4% 240 2.8% 291 -15.2%Firearm Related 110 99 68 91 62 67 73 46 70 64 -8.6% 64 0.6% 78 -17.6%Percent Firearm 29.6% 30.3% 21.5% 28.3% 25.2% 29.5% 30.4% 19.2% 28.2% 25.9% 26.5% 26.6%
Aggravated Assault 629 623 622 583 508 526 500 529 541 569 5.2% 521 9.3% 577 -1.4%Firearm Related 91 54 63 78 52 58 46 44 33 52 57.6% 47 11.6% 62 -15.7%Percent Firearm 14.5% 8.7% 10.1% 13.4% 10.2% 11.0% 9.2% 8.3% 6.1% 9.1% 9.0% 10.5%
*PLEASE SEE Definitions Page for Reporting Changes to the Index Crime of Rape effective March 2016, which also impacts violent crime totals.
NOTE: Percentage change is not calculated when counts are fewer than 10 and the 5-year and 10-year Averages are rounded to the nearest whole number.
Violent Crimes by FirearmAs of 04/15/2018
Albany City Police Department (IBR)
% Change From Month in
Previous Year
5 Year Average
% Change5 Year Avg. vs.
20182018
Year to Date Comparisons
301

Current CurrentMonth Month % Change
Apr 17 May 17 Jun 17 Jul 17 Aug 17 Sep 17 Oct 17 Nov 17 Dec 17 Jan 18 Feb 18 Mar 18 2017 2018 2017 2018 2017-18 2013-17
Shooting Incidents Involving Injury 4 4 3 9 2 2 4 3 2 3 0 2 2 2 6 5 5 5
Shooting Victims (Persons Hit) 4 5 3 12 2 2 4 4 2 3 0 2 2 2 7 5 6 5
Individuals Killed by Gun Violence 1 0 1 0 0 0 1 0 1 1 0 0 0 0 1 1 0 1
5 Year % Change % Change Average 5 Year Avg.
Totals 2009 2010 2011 2012 2013 2014 2015 2016 2017 2016-17 2012-16 vs. 2017
Shooting Incidents Involving Injury 27 37 44 27 33 34 31 27 39 44.4% 30 28.3%
Shooting Victims (Persons Hit) 29 41 48 31 37 39 36 31 45 45.2% 35 29.3%
Individuals Killed by Gun Violence 7 1 2 3 5 5 3 1 5 3
NOTE: Percentage change is not calculated when counts are fewer than 10 and the 5-year Average is rounded to the nearest whole number.
Firearm Activity As of 04/06/2018
Albany City Police Department
Year to Date Comparisons
% Change From Month in Previous Year
5 Year Average
% Change5 Year Avg.
vs. 20182018
302
% Change % ChangeFrom Current Current From Month % Change
Previous Month Month in Previous YTD YTD in Apr 17 May 17 Jun 17 Jul 17 Aug 17 Sep 17 Oct 17 Nov 17 Dec 17 Jan 18 Feb 18* Mar 18* Month 2017 2018 Year 2017 2018 YTD
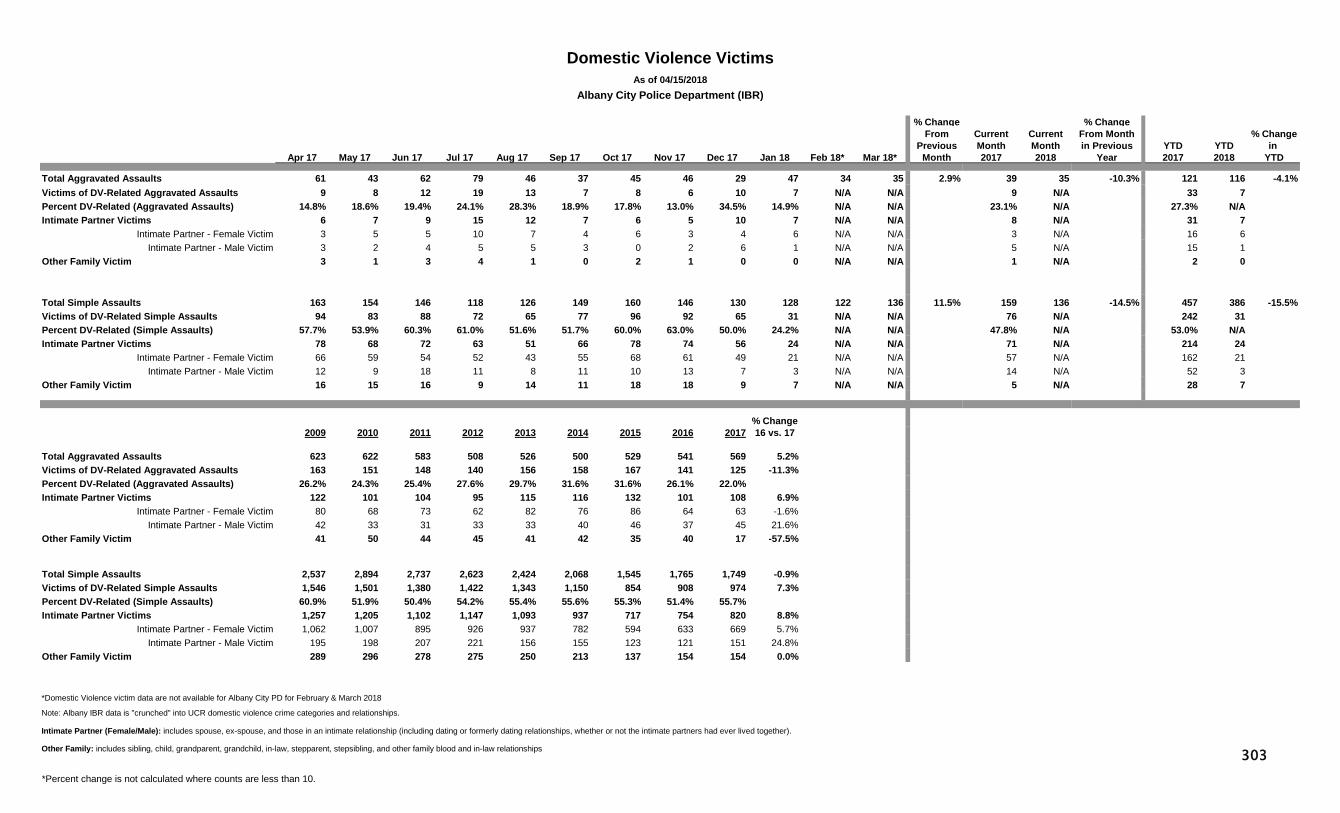
Total Aggravated Assaults 61 43 62 79 46 37 45 46 29 47 34 35 2.9% 39 35 -10.3% 121 116 -4.1%Victims of DV-Related Aggravated Assaults 9 8 12 19 13 7 8 6 10 7 N/A N/A 9 N/A 33 7 Percent DV-Related (Aggravated Assaults) 14.8% 18.6% 19.4% 24.1% 28.3% 18.9% 17.8% 13.0% 34.5% 14.9% N/A N/A 23.1% N/A 27.3% N/A Intimate Partner Victims 6 7 9 15 12 7 6 5 10 7 N/A N/A 8 N/A 31 7
Intimate Partner - Female Victim 3 5 5 10 7 4 6 3 4 6 N/A N/A 3 N/A 16 6 Intimate Partner - Male Victim 3 2 4 5 5 3 0 2 6 1 N/A N/A 5 N/A 15 1
Other Family Victim 3 1 3 4 1 0 2 1 0 0 N/A N/A 1 N/A 2 0
Total Simple Assaults 163 154 146 118 126 149 160 146 130 128 122 136 11.5% 159 136 -14.5% 457 386 -15.5%Victims of DV-Related Simple Assaults 94 83 88 72 65 77 96 92 65 31 N/A N/A 76 N/A 242 31Percent DV-Related (Simple Assaults) 57.7% 53.9% 60.3% 61.0% 51.6% 51.7% 60.0% 63.0% 50.0% 24.2% N/A N/A 47.8% N/A 53.0% N/AIntimate Partner Victims 78 68 72 63 51 66 78 74 56 24 N/A N/A 71 N/A 214 24
Intimate Partner - Female Victim 66 59 54 52 43 55 68 61 49 21 N/A N/A 57 N/A 162 21Intimate Partner - Male Victim 12 9 18 11 8 11 10 13 7 3 N/A N/A 14 N/A 52 3
Other Family Victim 16 15 16 9 14 11 18 18 9 7 N/A N/A 5 N/A 28 7
% Change2009 2010 2011 2012 2013 2014 2015 2016 2017 16 vs. 17
Total Aggravated Assaults 623 622 583 508 526 500 529 541 569 5.2%Victims of DV-Related Aggravated Assaults 163 151 148 140 156 158 167 141 125 -11.3%Percent DV-Related (Aggravated Assaults) 26.2% 24.3% 25.4% 27.6% 29.7% 31.6% 31.6% 26.1% 22.0% Intimate Partner Victims 122 101 104 95 115 116 132 101 108 6.9%
Intimate Partner - Female Victim 80 68 73 62 82 76 86 64 63 -1.6%Intimate Partner - Male Victim 42 33 31 33 33 40 46 37 45 21.6%
Other Family Victim 41 50 44 45 41 42 35 40 17 -57.5%
Total Simple Assaults 2,537 2,894 2,737 2,623 2,424 2,068 1,545 1,765 1,749 -0.9%Victims of DV-Related Simple Assaults 1,546 1,501 1,380 1,422 1,343 1,150 854 908 974 7.3%Percent DV-Related (Simple Assaults) 60.9% 51.9% 50.4% 54.2% 55.4% 55.6% 55.3% 51.4% 55.7% Intimate Partner Victims 1,257 1,205 1,102 1,147 1,093 937 717 754 820 8.8%
Intimate Partner - Female Victim 1,062 1,007 895 926 937 782 594 633 669 5.7%Intimate Partner - Male Victim 195 198 207 221 156 155 123 121 151 24.8%
Other Family Victim 289 296 278 275 250 213 137 154 154 0.0%
*Domestic Violence victim data are not available for Albany City PD for February & March 2018
Note: Albany IBR data is "crunched" into UCR domestic violence crime categories and relationships.
Intimate Partner (Female/Male): includes spouse, ex-spouse, and those in an intimate relationship (including dating or formerly dating relationships, whether or not the intimate partners had ever lived together).
Other Family: includes sibling, child, grandparent, grandchild, in-law, stepparent, stepsibling, and other family blood and in-law relationships
*Percent change is not calculated where counts are less than 10.
Domestic Violence VictimsAs of 04/15/2018
Albany City Police Department (IBR)
303
% ChangeCurrent Current From MonthMonth Month in Previous % Change
Apr 17 May 17 Jun 17 Jul 17 Aug 17 Sep 17 Oct 17 Nov 17 Dec 17 Jan 18 Feb 18 Mar 18 2017 2018 Year 2017 2018 2017-18 2013-17
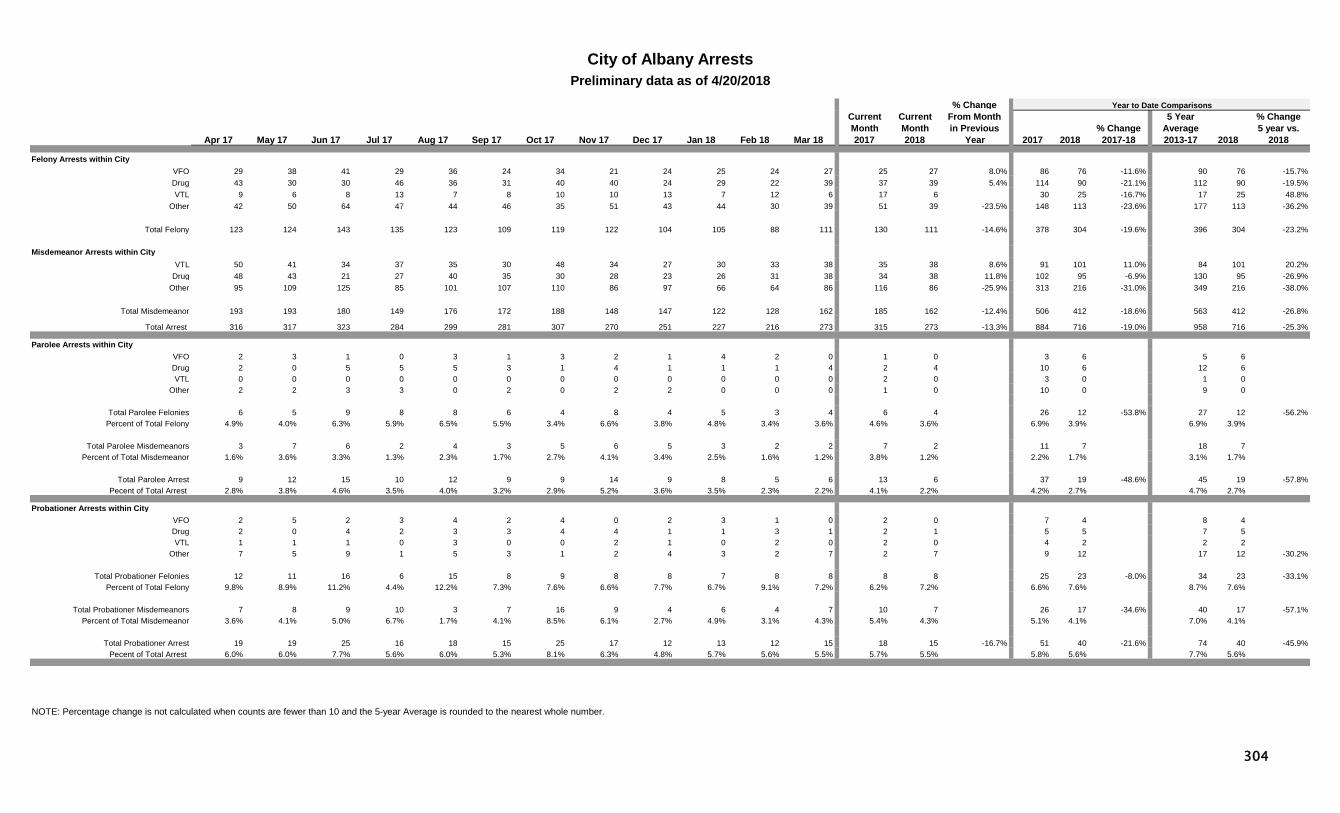
Felony Arrests within CityVFO 29 38 41 29 36 24 34 21 24 25 24 27 25 27 8.0% 86 76 -11.6% 90 76 -15.7%Drug 43 30 30 46 36 31 40 40 24 29 22 39 37 39 5.4% 114 90 -21.1% 112 90 -19.5%VTL 9 6 8 13 7 8 10 10 13 7 12 6 17 6 30 25 -16.7% 17 25 48.8%
Other 42 50 64 47 44 46 35 51 43 44 30 39 51 39 -23.5% 148 113 -23.6% 177 113 -36.2%
Total Felony 123 124 143 135 123 109 119 122 104 105 88 111 130 111 -14.6% 378 304 -19.6% 396 304 -23.2%
Misdemeanor Arrests within CityVTL 50 41 34 37 35 30 48 34 27 30 33 38 35 38 8.6% 91 101 11.0% 84 101 20.2%
Drug 48 43 21 27 40 35 30 28 23 26 31 38 34 38 11.8% 102 95 -6.9% 130 95 -26.9%Other 95 109 125 85 101 107 110 86 97 66 64 86 116 86 -25.9% 313 216 -31.0% 349 216 -38.0%
Total Misdemeanor 193 193 180 149 176 172 188 148 147 122 128 162 185 162 -12.4% 506 412 -18.6% 563 412 -26.8%
Total Arrest 316 317 323 284 299 281 307 270 251 227 216 273 315 273 -13.3% 884 716 -19.0% 958 716 -25.3%
Parolee Arrests within CityVFO 2 3 1 0 3 1 3 2 1 4 2 0 1 0 3 6 5 6 Drug 2 0 5 5 5 3 1 4 1 1 1 4 2 4 10 6 12 6 VTL 0 0 0 0 0 0 0 0 0 0 0 0 2 0 3 0 1 0
Other 2 2 3 3 0 2 0 2 2 0 0 0 1 0 10 0 9 0
Total Parolee Felonies 6 5 9 8 8 6 4 8 4 5 3 4 6 4 26 12 -53.8% 27 12 -56.2%Percent of Total Felony 4.9% 4.0% 6.3% 5.9% 6.5% 5.5% 3.4% 6.6% 3.8% 4.8% 3.4% 3.6% 4.6% 3.6% 6.9% 3.9% 6.9% 3.9%
Total Parolee Misdemeanors 3 7 6 2 4 3 5 6 5 3 2 2 7 2 11 7 18 7 Percent of Total Misdemeanor 1.6% 3.6% 3.3% 1.3% 2.3% 1.7% 2.7% 4.1% 3.4% 2.5% 1.6% 1.2% 3.8% 1.2% 2.2% 1.7% 3.1% 1.7%
Total Parolee Arrest 9 12 15 10 12 9 9 14 9 8 5 6 13 6 37 19 -48.6% 45 19 -57.8%Pecent of Total Arrest 2.8% 3.8% 4.6% 3.5% 4.0% 3.2% 2.9% 5.2% 3.6% 3.5% 2.3% 2.2% 4.1% 2.2% 4.2% 2.7% 4.7% 2.7%
Probationer Arrests within CityVFO 2 5 2 3 4 2 4 0 2 3 1 0 2 0 7 4 8 4 Drug 2 0 4 2 3 3 4 4 1 1 3 1 2 1 5 5 7 5 VTL 1 1 1 0 3 0 0 2 1 0 2 0 2 0 4 2 2 2
Other 7 5 9 1 5 3 1 2 4 3 2 7 2 7 9 12 17 12 -30.2%
Total Probationer Felonies 12 11 16 6 15 8 9 8 8 7 8 8 8 8 25 23 -8.0% 34 23 -33.1%Percent of Total Felony 9.8% 8.9% 11.2% 4.4% 12.2% 7.3% 7.6% 6.6% 7.7% 6.7% 9.1% 7.2% 6.2% 7.2% 6.6% 7.6% 8.7% 7.6%
Total Probationer Misdemeanors 7 8 9 10 3 7 16 9 4 6 4 7 10 7 26 17 -34.6% 40 17 -57.1%Percent of Total Misdemeanor 3.6% 4.1% 5.0% 6.7% 1.7% 4.1% 8.5% 6.1% 2.7% 4.9% 3.1% 4.3% 5.4% 4.3% 5.1% 4.1% 7.0% 4.1%
Total Probationer Arrest 19 19 25 16 18 15 25 17 12 13 12 15 18 15 -16.7% 51 40 -21.6% 74 40 -45.9%Pecent of Total Arrest 6.0% 6.0% 7.7% 5.6% 6.0% 5.3% 8.1% 6.3% 4.8% 5.7% 5.6% 5.5% 5.7% 5.5% 5.8% 5.6% 7.7% 5.6%
NOTE: Percentage change is not calculated when counts are fewer than 10 and the 5-year Average is rounded to the nearest whole number.
City of Albany ArrestsPreliminary data as of 4/20/2018
Year to Date Comparisons5 Year
Average% Change5 year vs.
20182018
304

Current CurrentMonth Month
Apr 17 May 17 Jun 17 Jul 17 Aug 17 Sep 17 Oct 17 Nov 17 Dec 17 Jan 18 Feb 18 Mar 18 2017 2018 2013-17
Total Index Crimes 177 189 215 219 220 185 255 230 171 196 136 129 151 129 -14.6% 481 461 -4.2% 477 461 -3.4%
Violent Crimes 31 37 46 28 33 31 38 28 17 25 19 26 28 26 -7.1% 72 70 -2.8% 69 70 1.4%Murder 2 0 0 0 0 0 0 0 0 0 0 2 1 2 2 2 1 2 Rape* 1 2 10 3 6 2 5 1 5 4 2 1 1 1 6 7 7 7 N/ARobbery 7 8 11 8 6 15 10 6 2 5 9 10 6 10 17 24 41.2% 20 24 22.4%Aggravated Assault 21 27 25 17 21 14 23 21 10 16 8 13 20 13 -35.0% 47 37 -21.3% 42 37 -11.5%
Property Crimes 146 152 169 191 187 154 217 202 154 171 117 103 123 103 -16.3% 409 391 -4.4% 408 391 -4.2%Burglary 23 26 44 36 25 27 27 53 26 26 28 20 24 20 -16.7% 82 74 -9.8% 81 74 -8.4%Larceny 118 122 122 150 159 124 177 143 126 139 85 79 97 79 -18.6% 315 303 -3.8% 315 303 -3.7%Motor Vehicle Theft 5 4 3 5 3 3 13 6 2 6 4 4 2 4 12 14 16.7% 13 14 11.1%
5 Year % Change 10 Year % Change % Change Average 5 Year Avg. Average 10 Year Avg.
2008 2009 2010 2011 2012 2013 2014 2015* 2016* 2017* 2016-17 2012-16 vs. 2017 2007-16 vs. 2017
Total Index Crimes 2,665 2,291 2,353 2,568 2,646 2,638 2,326 2,402 2,197 2,342 6.6% 2,442 -4.1% 2,440 -4.0%
Violent Crimes 276 216 268 272 312 286 278 310 354 361 2.0% 308 17.2% 279 29.6%Murder 1 15 5 0 3 3 1 4 4 4 3 4 Rape* 11 11 18 17 15 19 20 37 41 41 0.0% N/A N/A N/A N/ARobbery 84 56 70 80 78 101 83 89 94 90 -4.3% 89 1.1% 80 12.2%Aggravated Assault 180 134 175 175 216 163 174 180 215 226 5.1% 190 19.2% 174 30.1%
Property Crimes 2,389 2,075 2,085 2,296 2,334 2,352 2,048 2,092 1,843 1,981 7.5% 2,134 -7.2% 2,161 -8.3%Burglary 342 286 423 413 553 525 343 342 435 369 -15.2% 440 -16.1% 392 -5.8%Larceny 2,000 1,746 1,644 1,822 1,729 1,771 1,653 1,707 1,305 1,556 19.2% 1,633 -4.7% 1,719 -9.5%Motor Vehicle Theft 47 43 18 61 52 56 52 43 103 56 -45.6% 61 -8.5% 51 9.4%
Note: 13 homicides reported in April 2009 reflect a single incident where 13 victims were killed by one gunman during a mass shooting on April 3 rd, 2009.
*PLEASE SEE Definitions Page for Reporting Changes to the Index Crime of Rape effective March 2016, which also impacts violent and Index crime totals.
NOTE: Percentage change is not calculated when counts are fewer than 10 and the 5-year and 10-year Averages are rounded to the nearest whole number.
As of 04/23/2018
Index Crimes
Binghamton City Police Department (IBR)
Year to Date Comparisons
% Change 2017-182017 2018
% Change From Month in Previous Year
5 Year Average
% Change5 Year Avg.
vs. 20182018
400

Current CurrentMonth Month % Change
Apr 17 May 17 Jun 17 Jul 17 Aug 17 Sep 17 Oct 17 Nov 17 Dec 17 Jan 18 Feb 18 Mar 18 2017 2018 2017 2018 2017-18 2013-17
Violent Crimes 31 37 46 28 33 31 38 28 17 25 19 26 28 26 -7.1% 72 70 -2.8% 69 70 1.4%Firearm Related 9 0 3 1 3 7 6 3 1 4 5 6 6 6 16 15 -6.3% 10 15 Percent Firearm 29.0% 0.0% 6.5% 3.6% 9.1% 22.6% 15.8% 10.7% 5.9% 16.0% 26.3% 23.1% 21.4% 23.1% 22.2% 21.4% 13.9% 21.4%
Murder 2 0 0 0 0 0 0 0 0 0 0 2 1 2 2 2 1 2
Firearm Related 2 0 0 0 0 0 0 0 0 0 0 0 0 0 0 0 0 0 Percent Firearm 100.0% 0.0% 0.0% 0.0% 0.0% 0.0% 33.3% 0.0%
Rape* 1 2 10 3 6 2 5 1 5 4 2 1 1 1 6 7 N/A 7 N/AFirearm Related 0 0 0 0 0 0 0 0 0 0 0 0 0 0 0 0 N/A 0 N/APercent Firearm 0.0% 0.0% 0.0% 0.0% 0.0% 0.0% 0.0% 0.0% 0.0% 0.0% 0.0% 0.0% 0.0% 0.0% 0.0% 0.0% N/A 0.0% N/A
Robbery 7 8 11 8 6 15 10 6 2 5 9 10 6 10 17 24 41.2% 20 24 22.4%Firearm Related 3 0 1 0 0 2 4 0 0 1 5 4 1 4 4 10 4 10 Percent Firearm 42.9% 0.0% 9.1% 0.0% 0.0% 13.3% 40.0% 0.0% 0.0% 20.0% 55.6% 40.0% 16.7% 40.0% 23.5% 41.7% 22.4% 41.7%
Aggravated Assault 21 27 25 17 21 14 23 21 10 16 8 13 20 13 -35.0% 47 37 -21.3% 42 37 -11.5%Firearm Related 4 0 2 1 3 5 2 3 1 3 0 2 5 2 12 5 5 5 Percent Firearm 19.0% 0.0% 8.0% 5.9% 14.3% 35.7% 8.7% 14.3% 10.0% 18.8% 0.0% 15.4% 25.0% 15.4% 25.5% 13.5% 12.0% 13.5%
5 Year % Change 10 Year % Change % Change Average 5 Year Avg. Average 10 Year Avg.
2008 2009 2010 2011 2012 2013 2014 2015* 2016* 2017* 2016-17 2012-16 vs. 2017 2007-16 vs. 2017
Violent Crimes 276 216 268 272 312 286 278 310 354 361 2.0% 308 17.2% 279 29.6%Firearm Related 21 34 34 32 34 34 54 38 44 49 11.4% 41 20.1% 34 42.9%Percent Firearm 7.6% 15.7% 12.7% 11.8% 10.9% 11.9% 19.4% 12.3% 12.4% 13.6% 13.4% 12.3%
Murder 1 15 5 0 3 3 1 4 4 4 3 4 Firearm Related 1 14 2 0 2 1 1 1 3 2 2 3 Percent Firearm 100.0% 93.3% 40.0% 0.0% 66.7% 33.3% 100.0% 25.0% 75.0% 50.0% 60.0% 56.7%
Rape* 11 11 18 17 15 19 20 37 41 41 0.0% N/A N/A N/A N/AFirearm Related 0 0 0 0 0 0 0 0 0 0 N/A N/A N/A N/APercent Firearm 0.0% 0.0% 0.0% 0.0% 0.0% 0.0% 0.0% 0.0% 0.0% 0.0% N/A N/A N/A N/A
Robbery 84 56 70 80 78 101 83 89 94 90 -4.3% 89 1.1% 80 12.2%Firearm Related 13 11 13 18 12 20 28 19 19 14 -26.3% 20 -28.6% 16 -14.1%Percent Firearm 15.5% 19.6% 18.6% 22.5% 15.4% 19.8% 33.7% 21.3% 20.2% 15.6% 22.1% 20.2%
Aggravated Assault 180 134 175 175 216 163 174 180 215 226 5.1% 190 19.2% 174 30.1%Firearm Related 7 9 19 14 20 13 25 18 22 33 50.0% 20 68.4% 15 114.3%Percent Firearm 3.9% 6.7% 10.9% 8.0% 9.3% 8.0% 14.4% 10.0% 10.2% 14.6% 10.4% 8.7%
Note: 13 homicides reported in April 2009 reflect a single incident where 13 victims were killed by one gunman during a mass shooting on April 3rd, 2009.
*PLEASE SEE Definitions Page for Reporting Changes to the Index Crime of Rape effective March 2016, which also impacts violent crime totals.
NOTE: Percentage change is not calculated when counts are fewer than 10 and the 5-year and 10-year Averages are rounded to the nearest whole number.
Violent Crimes by FirearmAs of 04/23/2018
Binghamton City Police Department (IBR)
% Change From Month in
Previous Year
5 Year Average
% Change5 Year Avg. vs.
20182018
Year to Date Comparisons
401

Current CurrentMonth Month % Change
Apr 17 May 17 Jun 17 Jul 17 Aug 17 Sep 17 Oct 17 Nov 17 Dec 17 Jan 18 Feb 18 Mar 18 2017 2018 2017 2018 2017-18 2013-17
Shooting Incidents Involving Injury 2 0 0 0 2 1 2 0 0 0 0 0 1 0 3 0 1 0
Shooting Victims (Persons Hit) 2 0 0 0 2 1 2 0 0 0 0 0 2 0 7 0 2 0
Individuals Killed by Gun Violence 2 0 0 0 0 0 0 0 0 0 0 0 0 0 0 0 0 0
5 Year % Change % Change Average 5 Year Avg.
Totals 2009 2010 2011 2012 2013 2014 2015 2016 2017 2016-17 2012-16 vs. 2017
Shooting Incidents Involving Injury 6 11 2 8 2 6 5 5 10 5
Shooting Victims (Persons Hit) 24 11 2 8 2 6 6 6 14 6
Individuals Killed by Gun Violence 14 2 0 2 1 1 1 3 2 2
NOTE: Percentage change is not calculated when counts are fewer than 10 and the 5-year Average is rounded to the nearest whole number.
*The 13 homicides reported in April 2009 reflect a single incident where 13 victims were killed by one gunman during a mass shooting on April 3rd, 2009. The April 2009 homicides are counted as: 1 incident, 17 shooting victims, 13 killed.
Firearm Activity As of 04/06/2018
Binghamton City Police Department
Year to Date Comparisons
% Change From Month in Previous Year
5 Year Average
% Change5 Year Avg.
vs. 20182018
402

% Change % ChangeFrom Current Current From Month % Change
Previous Month Month in Previous YTD YTD in Apr 17 May 17 Jun 17 Jul 17 Aug 17 Sep 17 Oct 17 Nov 17 Dec 17 Jan 18 Feb 18 Mar 18 Month 2017 2018 Year 2017 2018 YTD
Total Aggravated Assaults 21 27 25 17 21 14 23 21 10 16 8 13 20 13 -35.0% 47 37 -21.3%Victims of DV-Related Aggravated Assaults 4 7 5 9 4 1 2 7 3 5 1 1 5 1 10 7 Percent DV-Related (Aggravated Assaults) 19.0% 25.9% 20.0% 52.9% 19.0% 7.1% 8.7% 33.3% 30.0% 31.3% 12.5% 7.7% 25.0% 7.7% 21.3% 18.9% Intimate Partner Victims 2 4 5 6 3 1 1 5 2 4 1 0 4 0 7 5
Intimate Partner - Female Victim 2 2 5 6 2 0 1 4 2 4 1 0 4 0 6 5 Intimate Partner - Male Victim 0 2 0 0 1 1 0 1 0 0 0 0 0 0 1 0
Other Family Victim 2 3 0 3 1 0 1 2 1 1 0 1 1 1 3 2
Total Simple Assaults 59 71 58 58 65 58 51 44 53 52 34 60 76.5% 48 60 25.0% 139 146 5.0%Victims of DV-Related Simple Assaults 18 27 23 25 19 18 19 16 17 14 9 24 20 24 20.0% 50 47 -6.0%Percent DV-Related (Simple Assaults) 30.5% 38.0% 39.7% 43.1% 29.2% 31.0% 37.3% 36.4% 32.1% 26.9% 26.5% 40.0% 41.7% 40.0% 36.0% 32.2% Intimate Partner Victims 14 19 20 21 15 16 14 15 15 13 8 21 15 21 40.0% 37 42 13.5%
Intimate Partner - Female Victim 13 16 18 19 14 14 12 13 14 12 7 20 11 20 81.8% 31 39 25.8%Intimate Partner - Male Victim 1 3 2 2 1 2 2 2 1 1 1 1 4 1 6 3
Other Family Victim 4 8 3 4 4 2 5 1 2 1 1 3 5 3 13 5
% Change2009 2010 2011 2012 2013 2014 2015 2016 2017 16 vs. 17
Total Aggravated Assaults 134 175 175 216 163 174 180 215 226 5.1%Victims of DV-Related Aggravated Assaults 20 34 32 55 50 39 31 59 52 -11.9%Percent DV-Related (Aggravated Assaults) 14.9% 19.4% 18.3% 25.5% 30.7% 22.4% 17.2% 27.4% 23.0% Intimate Partner Victims 13 24 25 37 39 27 23 39 36 -7.7%
Intimate Partner - Female Victim 7 22 22 25 29 20 16 29 30 3.4%Intimate Partner - Male Victim 6 2 3 12 10 7 7 10 6
Other Family Victim 7 10 7 18 11 12 8 20 16 -20.0%
Total Simple Assaults 533 623 610 791 657 563 415 694 656 -5.5%Victims of DV-Related Simple Assaults 183 189 194 217 186 134 105 233 232 -0.4%Percent DV-Related (Simple Assaults) 34.3% 30.3% 31.8% 27.4% 28.3% 23.8% 25.3% 33.6% 35.4% Intimate Partner Victims 149 150 150 170 143 108 80 177 186 5.1%
Intimate Partner - Female Victim 139 138 141 161 131 101 74 160 164 2.5%Intimate Partner - Male Victim 10 12 9 9 12 7 6 17 22 29.4%
Other Family Victim 34 39 44 47 43 26 25 56 46 -17.9%
Note: Binghamton IBR data is "crunched" into UCR domestic violence crime categories and relationships.
Intimate Partner (Female/Male): includes spouse, ex-spouse, and those in an intimate relationship (including dating or formerly dating relationships, whether or not the intimate partners had ever lived together).
Other Family: includes sibling, child, grandparent, grandchild, in-law, stepparent, stepsibling, and other family blood and in-law relationships
*Percent change is not calculated where counts are less than 10.
Domestic Violence VictimsAs of 04/23/2018
Binghamton City Police Department (IBR)
403
% ChangeCurrent Current From MonthMonth Month in Previous % Change
Apr 17 May 17 Jun 17 Jul 17 Aug 17 Sep 17 Oct 17 Nov 17 Dec 17 Jan 18 Feb 18 Mar 18 2017 2018 Year 2017 2018 2017-18 2013-17
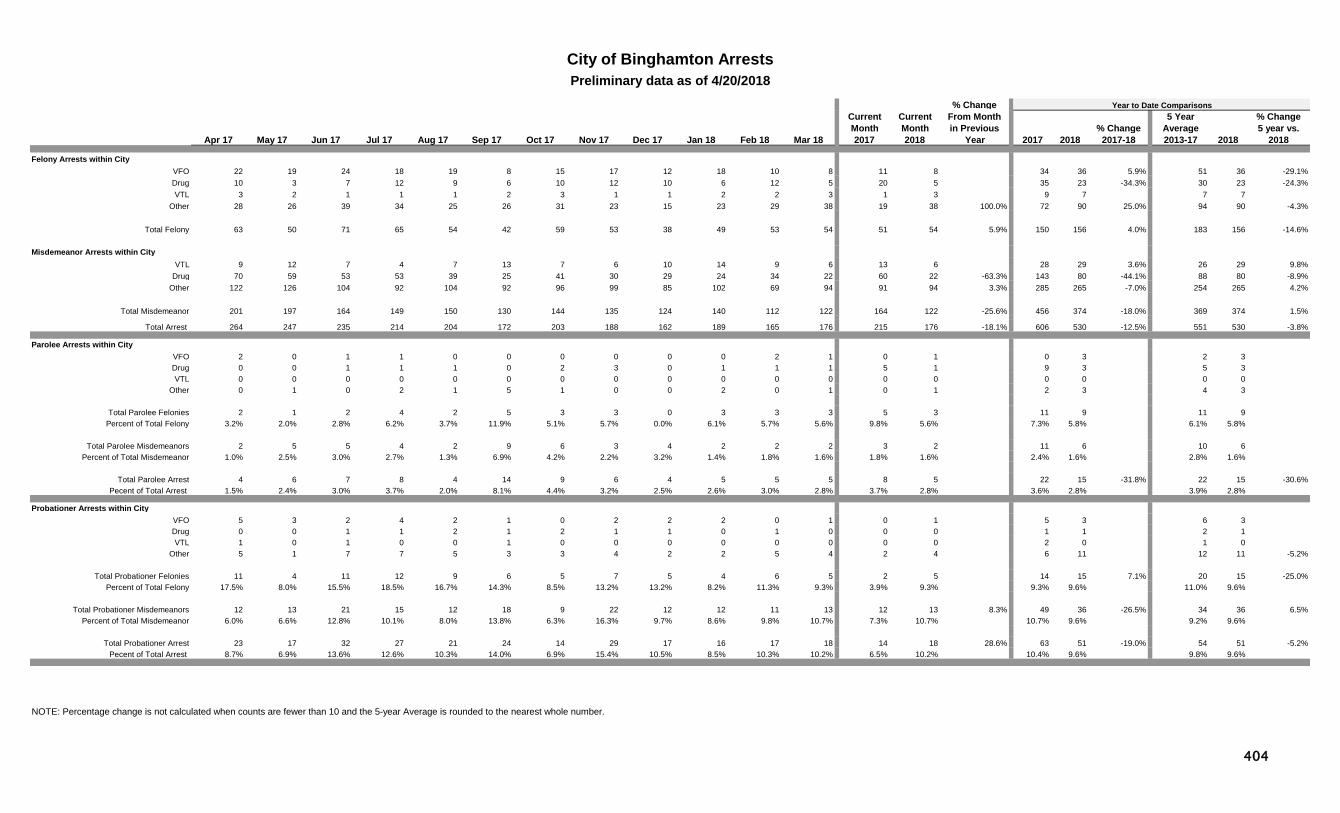
Felony Arrests within CityVFO 22 19 24 18 19 8 15 17 12 18 10 8 11 8 34 36 5.9% 51 36 -29.1%Drug 10 3 7 12 9 6 10 12 10 6 12 5 20 5 35 23 -34.3% 30 23 -24.3%VTL 3 2 1 1 1 2 3 1 1 2 2 3 1 3 9 7 7 7
Other 28 26 39 34 25 26 31 23 15 23 29 38 19 38 100.0% 72 90 25.0% 94 90 -4.3%
Total Felony 63 50 71 65 54 42 59 53 38 49 53 54 51 54 5.9% 150 156 4.0% 183 156 -14.6%
Misdemeanor Arrests within CityVTL 9 12 7 4 7 13 7 6 10 14 9 6 13 6 28 29 3.6% 26 29 9.8%
Drug 70 59 53 53 39 25 41 30 29 24 34 22 60 22 -63.3% 143 80 -44.1% 88 80 -8.9%Other 122 126 104 92 104 92 96 99 85 102 69 94 91 94 3.3% 285 265 -7.0% 254 265 4.2%
Total Misdemeanor 201 197 164 149 150 130 144 135 124 140 112 122 164 122 -25.6% 456 374 -18.0% 369 374 1.5%
Total Arrest 264 247 235 214 204 172 203 188 162 189 165 176 215 176 -18.1% 606 530 -12.5% 551 530 -3.8%
Parolee Arrests within CityVFO 2 0 1 1 0 0 0 0 0 0 2 1 0 1 0 3 2 3 Drug 0 0 1 1 1 0 2 3 0 1 1 1 5 1 9 3 5 3 VTL 0 0 0 0 0 0 0 0 0 0 0 0 0 0 0 0 0 0
Other 0 1 0 2 1 5 1 0 0 2 0 1 0 1 2 3 4 3
Total Parolee Felonies 2 1 2 4 2 5 3 3 0 3 3 3 5 3 11 9 11 9 Percent of Total Felony 3.2% 2.0% 2.8% 6.2% 3.7% 11.9% 5.1% 5.7% 0.0% 6.1% 5.7% 5.6% 9.8% 5.6% 7.3% 5.8% 6.1% 5.8%
Total Parolee Misdemeanors 2 5 5 4 2 9 6 3 4 2 2 2 3 2 11 6 10 6 Percent of Total Misdemeanor 1.0% 2.5% 3.0% 2.7% 1.3% 6.9% 4.2% 2.2% 3.2% 1.4% 1.8% 1.6% 1.8% 1.6% 2.4% 1.6% 2.8% 1.6%
Total Parolee Arrest 4 6 7 8 4 14 9 6 4 5 5 5 8 5 22 15 -31.8% 22 15 -30.6%Pecent of Total Arrest 1.5% 2.4% 3.0% 3.7% 2.0% 8.1% 4.4% 3.2% 2.5% 2.6% 3.0% 2.8% 3.7% 2.8% 3.6% 2.8% 3.9% 2.8%
Probationer Arrests within CityVFO 5 3 2 4 2 1 0 2 2 2 0 1 0 1 5 3 6 3 Drug 0 0 1 1 2 1 2 1 1 0 1 0 0 0 1 1 2 1 VTL 1 0 1 0 0 1 0 0 0 0 0 0 0 0 2 0 1 0
Other 5 1 7 7 5 3 3 4 2 2 5 4 2 4 6 11 12 11 -5.2%
Total Probationer Felonies 11 4 11 12 9 6 5 7 5 4 6 5 2 5 14 15 7.1% 20 15 -25.0%Percent of Total Felony 17.5% 8.0% 15.5% 18.5% 16.7% 14.3% 8.5% 13.2% 13.2% 8.2% 11.3% 9.3% 3.9% 9.3% 9.3% 9.6% 11.0% 9.6%
Total Probationer Misdemeanors 12 13 21 15 12 18 9 22 12 12 11 13 12 13 8.3% 49 36 -26.5% 34 36 6.5%Percent of Total Misdemeanor 6.0% 6.6% 12.8% 10.1% 8.0% 13.8% 6.3% 16.3% 9.7% 8.6% 9.8% 10.7% 7.3% 10.7% 10.7% 9.6% 9.2% 9.6%
Total Probationer Arrest 23 17 32 27 21 24 14 29 17 16 17 18 14 18 28.6% 63 51 -19.0% 54 51 -5.2%Pecent of Total Arrest 8.7% 6.9% 13.6% 12.6% 10.3% 14.0% 6.9% 15.4% 10.5% 8.5% 10.3% 10.2% 6.5% 10.2% 10.4% 9.6% 9.8% 9.6%
NOTE: Percentage change is not calculated when counts are fewer than 10 and the 5-year Average is rounded to the nearest whole number.
City of Binghamton ArrestsPreliminary data as of 4/20/2018
Year to Date Comparisons5 Year
Average% Change5 year vs.
20182018
404
Current CurrentMonth Month
Apr 17 May 17 Jun 17 Jul 17 Aug 17 Sep 17 Oct 17 Nov 17 Dec 17 Jan 18 Feb 18 Mar 18 2017 2018 2013-17
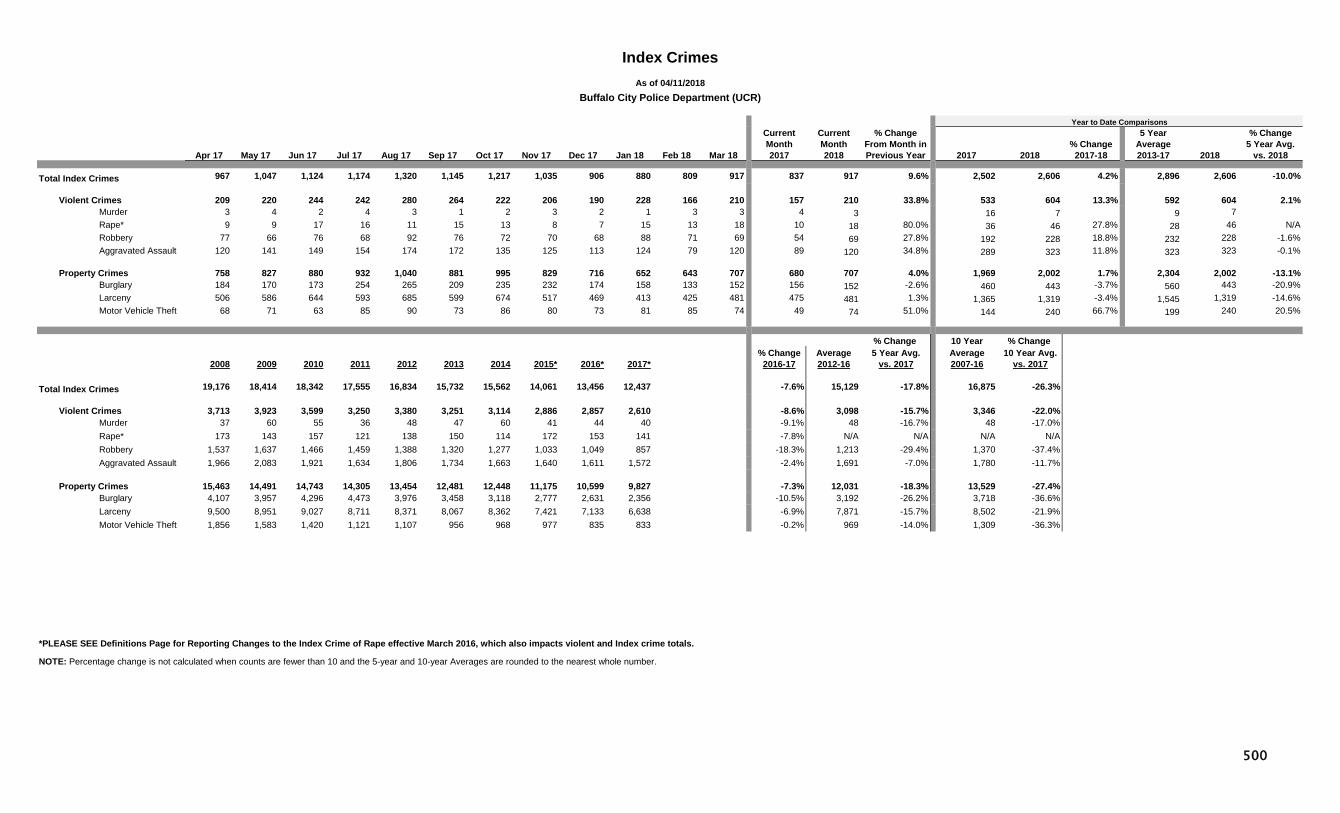
Total Index Crimes 967 1,047 1,124 1,174 1,320 1,145 1,217 1,035 906 880 809 917 837 917 9.6% 2,502 2,606 4.2% 2,896 2,606 -10.0%
Violent Crimes 209 220 244 242 280 264 222 206 190 228 166 210 157 210 33.8% 533 604 13.3% 592 604 2.1%Murder 3 4 2 4 3 1 2 3 2 1 3 3 4 3 16 7 9 7 Rape* 9 9 17 16 11 15 13 8 7 15 13 18 10 18 80.0% 36 46 27.8% 28 46 N/ARobbery 77 66 76 68 92 76 72 70 68 88 71 69 54 69 27.8% 192 228 18.8% 232 228 -1.6%Aggravated Assault 120 141 149 154 174 172 135 125 113 124 79 120 89 120 34.8% 289 323 11.8% 323 323 -0.1%
Property Crimes 758 827 880 932 1,040 881 995 829 716 652 643 707 680 707 4.0% 1,969 2,002 1.7% 2,304 2,002 -13.1%Burglary 184 170 173 254 265 209 235 232 174 158 133 152 156 152 -2.6% 460 443 -3.7% 560 443 -20.9%Larceny 506 586 644 593 685 599 674 517 469 413 425 481 475 481 1.3% 1,365 1,319 -3.4% 1,545 1,319 -14.6%Motor Vehicle Theft 68 71 63 85 90 73 86 80 73 81 85 74 49 74 51.0% 144 240 66.7% 199 240 20.5%
% Change 10 Year % Change % Change Average 5 Year Avg. Average 10 Year Avg.
2008 2009 2010 2011 2012 2013 2014 2015* 2016* 2017* 2016-17 2012-16 vs. 2017 2007-16 vs. 2017
Total Index Crimes 19,176 18,414 18,342 17,555 16,834 15,732 15,562 14,061 13,456 12,437 -7.6% 15,129 -17.8% 16,875 -26.3%
Violent Crimes 3,713 3,923 3,599 3,250 3,380 3,251 3,114 2,886 2,857 2,610 -8.6% 3,098 -15.7% 3,346 -22.0%Murder 37 60 55 36 48 47 60 41 44 40 -9.1% 48 -16.7% 48 -17.0%Rape* 173 143 157 121 138 150 114 172 153 141 -7.8% N/A N/A N/A N/ARobbery 1,537 1,637 1,466 1,459 1,388 1,320 1,277 1,033 1,049 857 -18.3% 1,213 -29.4% 1,370 -37.4%Aggravated Assault 1,966 2,083 1,921 1,634 1,806 1,734 1,663 1,640 1,611 1,572 -2.4% 1,691 -7.0% 1,780 -11.7%
Property Crimes 15,463 14,491 14,743 14,305 13,454 12,481 12,448 11,175 10,599 9,827 -7.3% 12,031 -18.3% 13,529 -27.4%Burglary 4,107 3,957 4,296 4,473 3,976 3,458 3,118 2,777 2,631 2,356 -10.5% 3,192 -26.2% 3,718 -36.6%Larceny 9,500 8,951 9,027 8,711 8,371 8,067 8,362 7,421 7,133 6,638 -6.9% 7,871 -15.7% 8,502 -21.9%Motor Vehicle Theft 1,856 1,583 1,420 1,121 1,107 956 968 977 835 833 -0.2% 969 -14.0% 1,309 -36.3%
*PLEASE SEE Definitions Page for Reporting Changes to the Index Crime of Rape effective March 2016, which also impacts violent and Index crime totals.
NOTE: Percentage change is not calculated when counts are fewer than 10 and the 5-year and 10-year Averages are rounded to the nearest whole number.
As of 04/11/2018
Index Crimes
Buffalo City Police Department (UCR)
Year to Date Comparisons
% Change 2017-182017 2018
% Change From Month in Previous Year
5 Year Average
% Change5 Year Avg.
vs. 20182018
500

Current CurrentMonth Month % Change
Apr 17 May 17 Jun 17 Jul 17 Aug 17 Sep 17 Oct 17 Nov 17 Dec 17 Jan 18 Feb 18 Mar 18 2017 2018 2017 2018 2017-18 2013-17
Violent Crimes 209 220 244 242 280 264 222 206 190 228 166 210 157 210 33.8% 533 604 13.3% 592 604 2.1%Firearm Related 64 57 69 65 81 83 56 74 62 69 43 59 49 59 20.4% 166 171 3.0% 182 171 -5.8%Percent Firearm 30.6% 25.9% 28.3% 26.9% 28.9% 31.4% 25.2% 35.9% 32.6% 30.3% 25.9% 28.1% 31.2% 28.1% 31.1% 28.3% 30.7% 28.3%
Murder 3 4 2 4 3 1 2 3 2 1 3 3 4 3 16 7 9 7
Firearm Related 2 4 2 3 2 1 1 2 2 0 1 2 4 2 16 3 7 3 Percent Firearm 66.7% 100.0% 100.0% 75.0% 66.7% 100.0% 50.0% 66.7% 100.0% 0.0% 33.3% 66.7% 100.0% 66.7% 100.0% 42.9% 82.2% 42.9%
Rape* 9 9 17 16 11 15 13 8 7 15 13 18 10 18 80.0% 36 46 27.8% N/A 46 N/AFirearm Related 0 0 0 2 0 0 0 0 1 0 0 0 0 0 0 0 N/A 0 N/APercent Firearm 0.0% 0.0% 0.0% 12.5% 0.0% 0.0% 0.0% 0.0% 14.3% 0.0% 0.0% 0.0% 0.0% 0.0% 0.0% 0.0% N/A 0.0% N/A
Robbery 77 66 76 68 92 76 72 70 68 88 71 69 54 69 27.8% 192 228 18.8% 232 228 -1.6%Firearm Related 22 14 23 19 36 29 19 26 27 42 22 27 21 27 28.6% 68 91 33.8% 93 91 -1.7%Percent Firearm 28.6% 21.2% 30.3% 27.9% 39.1% 38.2% 26.4% 37.1% 39.7% 47.7% 31.0% 39.1% 38.9% 39.1% 35.4% 39.9% 40.0% 39.9%
Aggravated Assault 120 141 149 154 174 172 135 125 113 124 79 120 89 120 34.8% 289 323 11.8% 323 323 -0.1%Firearm Related 40 39 44 41 43 53 36 46 32 27 20 30 24 30 25.0% 82 77 -6.1% 81 77 -5.4%Percent Firearm 33.3% 27.7% 29.5% 26.6% 24.7% 30.8% 26.7% 36.8% 28.3% 21.8% 25.3% 25.0% 27.0% 25.0% 28.4% 23.8% 25.2% 23.8%
5 Year % Change 10 Year % Change % Change Average 5 Year Avg. Average 10 Year Avg.
2008 2009 2010 2011 2012 2013 2014 2015* 2016* 2017* 2016-17 2012-16 vs. 2017 2007-16 vs. 2017
Violent Crimes 3,713 3,923 3,599 3,250 3,380 3,251 3,114 2,886 2,857 2,610 -8.6% 3,098 -15.7% 3,346 -22.0%Firearm Related 1,171 1,172 1,026 1,022 1,076 950 940 879 1,004 777 -22.6% 970 -19.9% 1,036 -25.0%Percent Firearm 31.5% 29.9% 28.5% 31.4% 31.8% 29.2% 30.2% 30.5% 35.1% 29.8% 31.4% 31.0%
Murder 37 60 55 36 48 47 60 41 44 40 -9.1% 48 -16.7% 48 -17.0%Firearm Related 30 50 43 29 41 35 37 35 35 35 0.0% 37 -4.4% 38 -7.2%Percent Firearm 81.1% 83.3% 78.2% 80.6% 85.4% 74.5% 61.7% 85.4% 79.5% 87.5% 77.3% 78.7%
Rape* 173 143 157 121 138 150 114 172 153 141 -7.8% N/A N/A N/A N/AFirearm Related 4 7 4 4 5 11 8 3 3 3 N/A N/A N/A N/APercent Firearm 2.3% 4.9% 2.5% 3.3% 3.6% 7.3% 7.0% 1.7% 2.0% 2.1% N/A N/A N/A N/A
Robbery 1,537 1,637 1,466 1,459 1,388 1320 1,277 1,033 1,049 857 -18.3% 1,213 -29.4% 1,370 -37.4%Firearm Related 648 587 510 578 574 480 475 410 458 283 -38.2% 479 -41.0% 534 -47.0%Percent Firearm 42.2% 35.9% 34.8% 39.6% 41.4% 36.4% 37.2% 39.7% 43.7% 33.0% 39.7% 39.1%
Aggravated Assault 1,966 2,083 1,921 1,634 1,806 1734 1,663 1,640 1,611 1,572 -2.4% 1,691 -7.0% 1,780 -11.7%Firearm Related 489 528 469 411 456 424 420 431 508 456 -10.2% 448 1.8% 459 -0.5%Percent Firearm 24.9% 25.3% 24.4% 25.2% 25.2% 24.5% 25.3% 26.3% 31.5% 29.0% 26.6% 25.8%
*PLEASE SEE Definitions Page for Reporting Changes to the Index Crime of Rape effective March 2016, which also impacts violent crime totals.
NOTE: Percentage change is not calculated when counts are fewer than 10 and the 5-year and 10-year Averages are rounded to the nearest whole number.
Violent Crimes by FirearmAs of 04/11/2018
Buffalo City Police Department (UCR)
% Change From Month in
Previous Year
5 Year Average
% Change5 Year Avg. vs.
20182018
Year to Date Comparisons
501

Current CurrentMonth Month % Change
Apr 17 May 17 Jun 17 Jul 17 Aug 17 Sep 17 Oct 17 Nov 17 Dec 17 Jan 18 Feb 18 Mar 18 2017 2018 2017 2018 2017-18 2013-17
Shooting Incidents Involving Injury 12 18 19 17 17 23 14 19 13 10 11 10 12 10 -16.7% 48 31 -35.4% 36 31 -12.9%
Shooting Victims (Persons Hit) 16 22 22 21 20 29 15 23 14 12 11 11 16 11 -31.3% 54 34 -37.0% 41 34 -16.3%
Individuals Killed by Gun Violence 2 4 2 3 2 1 1 2 2 0 1 2 4 2 16 3 7 3
5 Year % Change % Change Average 5 Year Avg.
Totals 2009 2010 2011 2012 2013 2014 2015 2016 2017 2016-17 2012-16 vs. 2017
Shooting Incidents Involving Injury 261 220 229 217 171 205 204 262 200 -23.7% 212 -5.6%
Shooting Victims (Persons Hit) 306 262 255 268 201 257 242 296 236 -20.3% 253 -6.6%
Individuals Killed by Gun Violence 50 43 29 41 35 37 35 35 35 0.0% 37 -4.4%
NOTE: Percentage change is not calculated when counts are fewer than 10 and the 5-year Average is rounded to the nearest whole number.
Firearm Activity As of 04/06/2018
Buffalo City Police Department
Year to Date Comparisons
% Change From Month in Previous Year
5 Year Average
% Change5 Year Avg.
vs. 20182018
502

% Change % ChangeFrom Current Current From Month % Change
Previous Month Month in Previous YTD YTD in Apr 17 May 17 Jun 17 Jul 17 Aug 17 Sep 17 Oct 17 Nov 17 Dec 17 Jan 18 Feb 18 Mar 18 Month 2017 2018 Year 2017 2018 YTD
Total Aggravated Assaults 120 141 149 154 174 172 135 125 113 124 79 120 51.9% 89 120 34.8% 289 323 11.8%Victims of DV-Related Aggravated Assaults 33 43 38 43 44 38 42 27 37 43 27 37 37.0% 26 37 42.3% 84 107 27.4%Percent DV-Related (Aggravated Assaults) 27.5% 30.5% 25.5% 27.9% 25.3% 22.1% 31.1% 21.6% 32.7% 34.7% 34.2% 30.8% 29.2% 30.8% 29.1% 33.1% Intimate Partner Victims 25 35 29 30 37 30 27 25 25 32 21 32 52.4% 16 32 100.0% 63 85 34.9%
Intimate Partner - Female Victim 21 24 26 21 25 21 20 19 22 22 16 23 43.8% 14 23 64.3% 54 61 13.0%Intimate Partner - Male Victim 4 11 3 9 12 9 7 6 3 10 5 9 2 9 9 24
Other Family Victim 8 8 9 13 7 8 15 2 12 11 6 5 10 5 21 22 4.8%
Total Simple Assaults 399 466 473 473 516 497 430 386 337 391 392 444 13.3% 407 444 9.1% 1,126 1,227 9.0%Victims of DV-Related Simple Assaults 240 235 250 237 280 224 230 185 201 204 152 247 62.5% 210 247 17.6% 576 603 4.7%Percent DV-Related (Simple Assaults) 60.2% 50.4% 52.9% 50.1% 54.3% 45.1% 53.5% 47.9% 59.6% 52.2% 38.8% 55.6% 51.6% 55.6% 51.2% 49.1% Intimate Partner Victims 199 199 202 189 235 179 198 161 175 165 132 213 61.4% 177 213 20.3% 483 510 5.6%
Intimate Partner - Female Victim 182 186 178 170 212 165 173 142 155 152 112 185 65.2% 162 185 14.2% 440 449 2.0%Intimate Partner - Male Victim 17 13 24 19 23 14 25 19 20 13 20 28 40.0% 15 28 86.7% 43 61 41.9%
Other Family Victim 41 36 48 48 45 45 32 24 26 39 20 34 70.0% 33 34 3.0% 93 93 0.0%
% Change2009 2010 2011 2012 2013 2014 2015 2016 2017 16 vs. 17
Total Aggravated Assaults 2,083 1,921 1,634 1,806 1,734 1,663 1,640 1,611 1,572 -2.4%Victims of DV-Related Aggravated Assaults 341 373 309 416 481 426 441 374 429 14.7%Percent DV-Related (Aggravated Assaults) 16.4% 19.4% 18.9% 23.0% 27.7% 25.6% 26.9% 23.2% 27.3% Intimate Partner Victims 244 291 225 319 351 304 346 286 326 14.0%
Intimate Partner - Female Victim 180 219 167 228 249 211 249 202 253 25.2%Intimate Partner - Male Victim 64 72 58 91 102 93 97 84 73 -13.1%
Other Family Victim 97 82 84 97 130 122 95 88 103 17.0%
Total Simple Assaults 5,154 6,495 5,917 6,438 6,743 6,050 5,856 5,267 5,103 -3.1%Victims of DV-Related Simple Assaults 2,349 2,483 2,327 3,187 3,709 3,324 3,244 2,886 2,658 -7.9%Percent DV-Related (Simple Assaults) 45.6% 38.2% 39.3% 49.5% 55.0% 54.9% 55.4% 54.8% 52.1% Intimate Partner Victims 1,854 2,093 1,929 2,601 3,018 2,728 2,675 2,425 2,220 -8.5%
Intimate Partner - Female Victim 1,693 1,928 1,785 2,354 2,666 2,418 2,363 2,156 2,003 -7.1%Intimate Partner - Male Victim 161 165 144 247 352 310 312 269 217 -19.3%
Other Family Victim 495 390 398 586 691 596 569 461 438 -5.0%
Intimate Partner (Female/Male): includes spouse, ex-spouse, and those in an intimate relationship (including dating or formerly dating relationships, whether or not the intimate partners had ever lived together).
Other Family: includes sibling, child, grandparent, grandchild, in-law, stepparent, stepsibling, and other family blood and in-law relationships
*Percent change is not calculated where counts are less than 10.
Domestic Violence VictimsAs of 04/11/2018
Buffalo City Police Department (UCR)
503

% ChangeCurrent Current From MonthMonth Month in Previous % Change
Apr 17 May 17 Jun 17 Jul 17 Aug 17 Sep 17 Oct 17 Nov 17 Dec 17 Jan 18 Feb 18 Mar 18 2017 2018 Year 2017 2018 2017-18 2013-17
Felony Arrests within CityVFO 84 111 148 111 148 113 93 94 91 114 92 87 71 87 22.5% 274 293 6.9% 360 293 -18.5%Drug 82 60 52 61 76 44 45 55 39 45 60 83 81 83 2.5% 182 188 3.3% 174 188 7.8%VTL 14 8 8 9 14 6 7 9 5 4 8 11 11 11 0.0% 38 23 -39.5% 42 23 -45.8%
Other 156 133 137 129 153 129 165 144 96 141 136 173 154 173 12.3% 437 450 3.0% 461 450 -2.4%
Total Felony 336 312 345 310 391 292 310 302 231 304 296 354 317 354 11.7% 931 954 2.5% 1,038 954 -8.1%
Misdemeanor Arrests within CityVTL 24 33 23 18 25 22 27 32 23 19 15 26 28 26 -7.1% 79 60 -24.1% 95 60 -36.6%
Drug 155 142 145 142 152 148 112 91 69 99 109 151 137 151 10.2% 343 359 4.7% 467 359 -23.1%Other 381 332 367 326 416 376 345 309 258 339 301 372 351 372 6.0% 973 1,012 4.0% 1,175 1,012 -13.9%
Total Misdemeanor 560 507 535 486 593 546 484 432 350 457 425 549 516 549 6.4% 1,395 1,431 2.6% 1,736 1,431 -17.6%
Total Arrest 896 819 880 796 984 838 794 734 581 761 721 903 833 903 8.4% 2,326 2,385 2.5% 2,774 2,385 -14.0%
Parolee Arrests within CityVFO 4 5 9 6 5 4 5 4 7 9 9 2 7 2 24 20 -16.7% 20 20 -2.0%Drug 2 1 4 2 2 0 2 2 3 1 6 3 2 3 10 10 0.0% 9 10 VTL 0 0 0 0 0 1 0 0 0 0 0 0 0 0 1 0 1 0
Other 5 5 2 3 3 4 10 9 4 5 4 7 8 7 16 16 0.0% 16 16 -2.4%
Total Parolee Felonies 11 11 15 11 10 9 17 15 14 15 19 12 17 12 -29.4% 51 46 -9.8% 47 46 -3.0%Percent of Total Felony 3.3% 3.5% 4.3% 3.5% 2.6% 3.1% 5.5% 5.0% 6.1% 4.9% 6.4% 3.4% 5.4% 3.4% 5.5% 4.8% 4.6% 4.8%
Total Parolee Misdemeanors 12 10 7 9 9 14 10 14 6 6 7 8 8 8 19 21 10.5% 37 21 -42.9%Percent of Total Misdemeanor 2.1% 2.0% 1.3% 1.9% 1.5% 2.6% 2.1% 3.2% 1.7% 1.3% 1.6% 1.5% 1.6% 1.5% 1.4% 1.5% 2.1% 1.5%
Total Parolee Arrest 23 21 22 20 19 23 27 29 20 21 26 20 25 20 -20.0% 70 67 -4.3% 84 67 -20.4%Pecent of Total Arrest 2.6% 2.6% 2.5% 2.5% 1.9% 2.7% 3.4% 4.0% 3.4% 2.8% 3.6% 2.2% 3.0% 2.2% 3.0% 2.8% 3.0% 2.8%
Probationer Arrests within CityVFO 1 5 4 5 6 4 7 3 1 4 4 1 2 1 13 9 19 9 Drug 3 0 6 3 2 6 0 4 4 3 2 5 7 5 15 10 -33.3% 9 10 VTL 1 2 0 0 0 1 0 0 0 1 0 0 1 0 2 1 3 1
Other 6 10 2 4 5 4 7 7 6 12 6 9 7 9 21 27 28.6% 23 27 18.4%
Total Probationer Felonies 11 17 12 12 13 15 14 14 11 20 12 15 17 15 -11.8% 51 47 -7.8% 53 47 -11.7%Percent of Total Felony 3.3% 5.4% 3.5% 3.9% 3.3% 5.1% 4.5% 4.6% 4.8% 6.6% 4.1% 4.2% 5.4% 4.2% 5.5% 4.9% 5.1% 4.9%
Total Probationer Misdemeanors 25 13 19 17 19 18 9 14 16 23 13 24 14 24 71.4% 45 60 33.3% 62 60 -2.9%Percent of Total Misdemeanor 4.5% 2.6% 3.6% 3.5% 3.2% 3.3% 1.9% 3.2% 4.6% 5.0% 3.1% 4.4% 2.7% 4.4% 3.2% 4.2% 3.6% 4.2%
Total Probationer Arrest 36 30 31 29 32 33 23 28 27 43 25 39 31 39 25.8% 96 107 11.5% 115 107 -7.0%Pecent of Total Arrest 4.0% 3.7% 3.5% 3.6% 3.3% 3.9% 2.9% 3.8% 4.6% 5.7% 3.5% 4.3% 3.7% 4.3% 4.1% 4.5% 4.1% 4.5%
NOTE: Percentage change is not calculated when counts are fewer than 10 and the 5-year Average is rounded to the nearest whole number.
City of Buffalo ArrestsPreliminary data as of 4/20/2018
Year to Date Comparisons5 Year
Average% Change5 year vs.
20182018
504

Current CurrentMonth Month
Apr 17 May 17 Jun 17 Jul 17 Aug 17 Sep 17 Oct 17 Nov 17 Dec 17 Jan 18 Feb 18 Mar 18 2017 2018 2013-17
Total Index Crimes 72 92 77 99 74 79 69 69 88 78 44 60 58 60 3.4% 206 182 -11.7% 262 182 -30.4%
Violent Crimes 31 29 23 39 38 28 26 17 35 17 14 18 17 18 5.9% 66 49 -25.8% 87 49 -43.4%Murder 0 1 0 0 3 0 0 0 1 0 0 1 1 1 1 1 1 1 Rape* 0 0 0 2 0 0 0 0 2 0 0 0 1 0 2 0 1 0 N/ARobbery 8 9 6 11 11 12 11 8 6 7 6 3 6 3 27 16 -40.7% 42 16 -61.7%Aggravated Assault 23 19 17 26 24 16 15 9 26 10 8 14 9 14 36 32 -11.1% 42 32 -24.5%
Property Crimes 41 63 54 60 36 51 43 52 53 61 30 42 41 42 2.4% 140 133 -5.0% 175 133 -24.0%Burglary 10 5 4 9 9 11 9 10 9 6 2 3 4 3 16 11 -31.3% 34 11 -67.5%Larceny 24 49 43 40 22 29 25 35 32 40 19 28 32 28 -12.5% 94 87 -7.4% 114 87 -23.6%Motor Vehicle Theft 7 9 7 11 5 11 9 7 12 15 9 11 5 11 30 35 16.7% 27 35 27.7%
5 Year % Change 10 Year % Change % Change Average 5 Year Avg. Average 10 Year Avg.
2008 2009 2010 2011 2012 2013 2014 2015* 2016* 2017* 2016-17 2012-16 vs. 2017 2007-16 vs. 2017
Total Index Crimes 1,239 1,554 1,503 1,488 1,456 1,391 1,446 1,120 1,125 925 -17.8% 1,308 -29.3% 1,357 -31.8%
Violent Crimes 341 482 452 439 464 433 481 403 400 332 -17.0% 436 -23.9% 423 -21.5%Murder 10 6 12 8 9 10 8 6 6 6 8 8 Rape* 10 9 3 10 9 3 4 8 5 6 N/A N/A N/A N/ARobbery 192 254 218 207 207 204 248 175 149 109 -26.8% 197 -44.6% 200 -45.4%Aggravated Assault 129 213 219 214 239 216 221 214 240 211 -12.1% 226 -6.6% 208 1.4%
Property Crimes 898 1,072 1,051 1,049 992 958 965 717 725 593 -18.2% 871 -31.9% 934 -36.5%Burglary 197 199 304 295 217 206 201 164 131 92 -29.8% 184 -49.9% 211 -56.4%Larceny 470 644 613 600 636 630 607 456 459 393 -14.4% 558 -29.5% 561 -30.0%Motor Vehicle Theft 231 229 134 154 139 122 157 97 135 108 -20.0% 130 -16.9% 162 -33.2%
*PLEASE SEE Definitions Page for Reporting Changes to the Index Crime of Rape effective March 2016, which also impacts violent and Index crime totals.
NOTE: Percentage change is not calculated when counts are fewer than 10 and the 5-year and 10-year Averages are rounded to the nearest whole number.
As of 04/12/2018
Index Crimes
Year to Date Comparisons
% Change 2017-182017 2018
% Change From Month in Previous Year
5 Year Average
% Change5 Year Avg.
vs. 20182018
Hempstead Village Police Department (UCR)
600

Current CurrentMonth Month % Change
Apr 17 May 17 Jun 17 Jul 17 Aug 17 Sep 17 Oct 17 Nov 17 Dec 17 Jan 18 Feb 18 Mar 18 2017 2018 2017 2018 2017-18 2013-17
Violent Crimes 31 29 23 39 38 28 26 17 35 17 14 18 17 18 5.9% 66 49 -25.8% 87 49 -43.4%Firearm Related 3 3 4 3 8 7 8 5 8 3 6 0 3 0 9 9 22 9 Percent Firearm 9.7% 10.3% 17.4% 7.7% 21.1% 25.0% 30.8% 29.4% 22.9% 17.6% 42.9% 0.0% 17.6% 0.0% 13.6% 18.4% 24.9% 18.4%
Murder 0 1 0 0 3 0 0 0 1 0 0 1 1 1 1 1 1 1 Firearm Related 0 0 0 0 0 0 0 0 1 0 0 0 1 0 1 0 1 0 Percent Firearm 0.0% 0.0% 100.0% 0.0% 100.0% 0.0% 100.0% 0.0% 83.3% 0.0%
Rape* 0 0 0 2 0 0 0 0 2 0 0 0 1 0 2 0 N/A 0 N/AFirearm Related 0 0 0 0 0 0 0 0 0 0 0 0 0 0 0 0 N/A 0 N/APercent Firearm 0.0% 0.0% 0.0% 0.0% N/A N/A
Robbery 8 9 6 11 11 12 11 8 6 7 6 3 6 3 27 16 -40.7% 42 16 -61.7%Firearm Related 1 1 1 0 6 4 6 4 1 2 4 0 2 0 5 6 14 6 Percent Firearm 12.5% 11.1% 16.7% 0.0% 54.5% 33.3% 54.5% 50.0% 16.7% 28.6% 66.7% 0.0% 33.3% 0.0% 18.5% 37.5% 34.4% 37.5%
Aggravated Assault 23 19 17 26 24 16 15 9 26 10 8 14 9 14 36 32 -11.1% 42 32 -24.5%Firearm Related 2 2 3 3 2 3 2 1 6 1 2 0 0 0 3 3 6 3 Percent Firearm 8.7% 10.5% 17.6% 11.5% 8.3% 18.8% 13.3% 11.1% 23.1% 10.0% 25.0% 0.0% 0.0% 0.0% 8.3% 9.4% 14.6% 9.4%
5 Year % Change 10 Year % Change % Change Average 5 Year Avg. Average 10 Year Avg.
2008 2009 2010 2011 2012 2013 2014 2015* 2016* 2017* 2016-17 2012-16 vs. 2017 2007-16 vs. 2017
Violent Crimes 341 482 452 439 464 433 481 403 400 332 -17.0% 436 -23.9% 423 -21.5%Firearm Related 101 146 124 95 119 134 142 84 87 58 -33.3% 113 -48.8% 114 -49.1%Percent Firearm 29.6% 30.3% 27.4% 21.6% 25.6% 30.9% 29.5% 20.8% 21.8% 17.5% 25.7% 27.0%
Murder 10 6 12 8 9 10 8 6 6 6 8 8 Firearm Related 6 2 6 4 6 7 7 5 4 2 6 5 Percent Firearm 60.0% 33.3% 50.0% 50.0% 66.7% 70.0% 87.5% 83.3% 66.7% 33.3% 74.8% 63.9%
Rape* 10 9 3 10 9 3 4 8 5 6 N/A N/A N/A N/AFirearm Related 2 0 0 1 1 0 1 0 0 0 N/A N/A N/A N/APercent Firearm 20.0% 0.0% 0.0% 10.0% 11.1% 0.0% 25.0% 0.0% 0.0% 0.0% N/A N/A N/A N/A
Robbery 192 254 218 207 207 204 248 175 149 109 -26.8% 197 -44.6% 200 -45.4%Firearm Related 73 103 71 59 65 87 92 50 39 29 -25.6% 67 -56.5% 70 -58.4%Percent Firearm 38.0% 40.6% 32.6% 28.5% 31.4% 42.6% 37.1% 28.6% 26.2% 26.6% 33.2% 34.7%
Aggravated Assault 129 213 219 214 239 216 221 214 240 211 -12.1% 226 -6.6% 208 1.4%Firearm Related 20 41 47 31 47 40 42 29 44 27 -38.6% 40 -33.2% 39 -29.9%Percent Firearm 15.5% 19.2% 21.5% 14.5% 19.7% 18.5% 19.0% 13.6% 18.3% 12.8% 17.8% 18.5%
*PLEASE SEE Definitions Page for Reporting Changes to the Index Crime of Rape effective March 2016, which also impacts violent crime totals.
NOTE: Percentage change is not calculated when counts are fewer than 10 and the 5-year and 10-year Averages are rounded to the nearest whole number.
Violent Crimes by FirearmAs of 04/12/2018
Hempstead Village Police Department (UCR)
% Change From Month in
Previous Year
5 Year Average
% Change5 Year Avg. vs.
20182018
Year to Date Comparisons
601

Current CurrentMonth Month % Change
Apr 17 May 17 Jun 17 Jul 17 Aug 17 Sep 17 Oct 17 Nov 17 Dec 17 Jan 18 Feb 18 Mar 18 2017 2018 2017 2018 2017-18 2013-17
Shooting Incidents Involving Injury 1 1 3 3 0 2 2 0 3 0 1 0 1 0 4 1 4 1
Shooting Victims (Persons Hit) 2 1 3 3 0 2 2 0 3 0 1 0 1 0 4 1 5 1
Individuals Killed by Gun Violence 0 0 0 0 0 0 0 0 1 0 0 0 1 0 1 0 1 0
5 Year % Change % Change Average 5 Year Avg.
Totals 2009 2010 2011 2012 2013 2014 2015 2016 2017 2016-17 2012-16 vs. 2017
Shooting Incidents Involving Injury 36 38 23 37 37 27 16 32 19 -40.6% 30 -36.2%
Shooting Victims (Persons Hit) 39 40 26 40 39 30 17 37 20 -45.9% 33 -38.7%
Individuals Killed by Gun Violence 2 6 4 6 7 7 5 4 2 6
NOTE: Percentage change is not calculated when counts are fewer than 10 and the 5-year Average is rounded to the nearest whole number.
Firearm Activity As of 04/06/2018
Hempstead Village Police Department
Year to Date Comparisons
% Change From Month in Previous Year
5 Year Average
% Change5 Year Avg.
vs. 20182018
602

% Change % ChangeFrom Current Current From Month % Change
Previous Month Month in Previous YTD YTD in Apr 17 May 17 Jun 17 Jul 17 Aug 17 Sep 17 Oct 17 Nov 17 Dec 17 Jan 18 Feb 18 Mar 18 Month 2017 2018 Year 2017 2018 YTD
Total Aggravated Assaults 23 19 17 26 24 16 15 9 26 10 8 14 9 14 36 32 -11.1%Victims of DV-Related Aggravated Assaults 0 0 0 0 1 0 0 0 0 0 0 0 0 0 0 0 Percent DV-Related (Aggravated Assaults) 0.0% 0.0% 0.0% 0.0% 4.2% 0.0% 0.0% 0.0% 0.0% 0.0% 0.0% 0.0% 0.0% 0.0% 0.0% 0.0% Intimate Partner Victims 0 0 0 0 1 0 0 0 0 0 0 0 0 0 0 0
Intimate Partner - Female Victim 0 0 0 0 0 0 0 0 0 0 0 0 0 0 0 0 Intimate Partner - Male Victim 0 0 0 0 1 0 0 0 0 0 0 0 0 0 0 0
Other Family Victim 0 0 0 0 0 0 0 0 0 0 0 0 0 0 0 0
Total Simple Assaults 6 11 18 10 10 12 13 8 4 13 12 7 2 7 8 32 Victims of DV-Related Simple Assaults 7 11 9 15 16 18 9 8 7 13 3 6 6 6 26 22 -15.4%Percent DV-Related (Simple Assaults) 116.7% 100.0% 50.0% 150.0% 160.0% 150.0% 69.2% 100.0% 175.0% 100.0% 25.0% 85.7% 300.0% 85.7% 325.0% 68.8% Intimate Partner Victims 6 11 7 13 12 15 8 6 5 6 3 3 6 3 22 12 -45.5%
Intimate Partner - Female Victim 6 11 7 11 12 15 7 5 3 5 3 3 5 3 19 11 -42.1%Intimate Partner - Male Victim 0 0 0 2 0 0 1 1 2 1 0 0 1 0 3 1
Other Family Victim 1 0 2 2 4 3 1 2 2 7 0 3 0 3 4 10
% Change2009 2010 2011 2012 2013 2014 2015 2016 2017 16 vs. 17
Total Aggravated Assaults 213 219 214 239 216 221 214 240 211 -12.1%Victims of DV-Related Aggravated Assaults 20 11 16 9 7 10 11 3 1 Percent DV-Related (Aggravated Assaults) 9.4% 5.0% 7.5% 3.8% 3.2% 4.5% 5.1% 1.3% 0.5% Intimate Partner Victims 16 6 10 5 5 7 8 2 1
Intimate Partner - Female Victim 15 6 10 4 4 5 5 2 0 Intimate Partner - Male Victim 1 0 0 1 1 2 3 0 1
Other Family Victim 4 5 6 4 2 3 3 1 0
Total Simple Assaults 292 325 316 370 363 339 261 114 100 -12.3%Victims of DV-Related Simple Assaults 31 120 150 172 184 185 182 156 126 -19.2%Percent DV-Related (Simple Assaults) 10.6% 36.9% 47.5% 46.5% 50.7% 54.6% 69.7% 136.8% 126.0% Intimate Partner Victims 22 33 69 133 142 140 138 124 105 -15.3%
Intimate Partner - Female Victim 22 32 63 117 125 125 111 102 96 -5.9%Intimate Partner - Male Victim 0 1 6 16 17 15 27 22 9
Other Family Victim 9 87 81 39 42 45 44 32 21 -34.4%
Intimate Partner (Female/Male): includes spouse, ex-spouse, and those in an intimate relationship (including dating or formerly dating relationships, whether or not the intimate partners had ever lived together).
Other Family: includes sibling, child, grandparent, grandchild, in-law, stepparent, stepsibling, and other family blood and in-law relationships
*Percent change is not calculated where counts are less than 10.
Domestic Violence VictimsAs of 04/12/2018
Hempstead Village Police Department (UCR)
603
% ChangeCurrent Current From MonthMonth Month in Previous % Change
Apr 17 May 17 Jun 17 Jul 17 Aug 17 Sep 17 Oct 17 Nov 17 Dec 17 Jan 18 Feb 18 Mar 18 2017 2018 Year 2017 2018 2017-18 2013-17
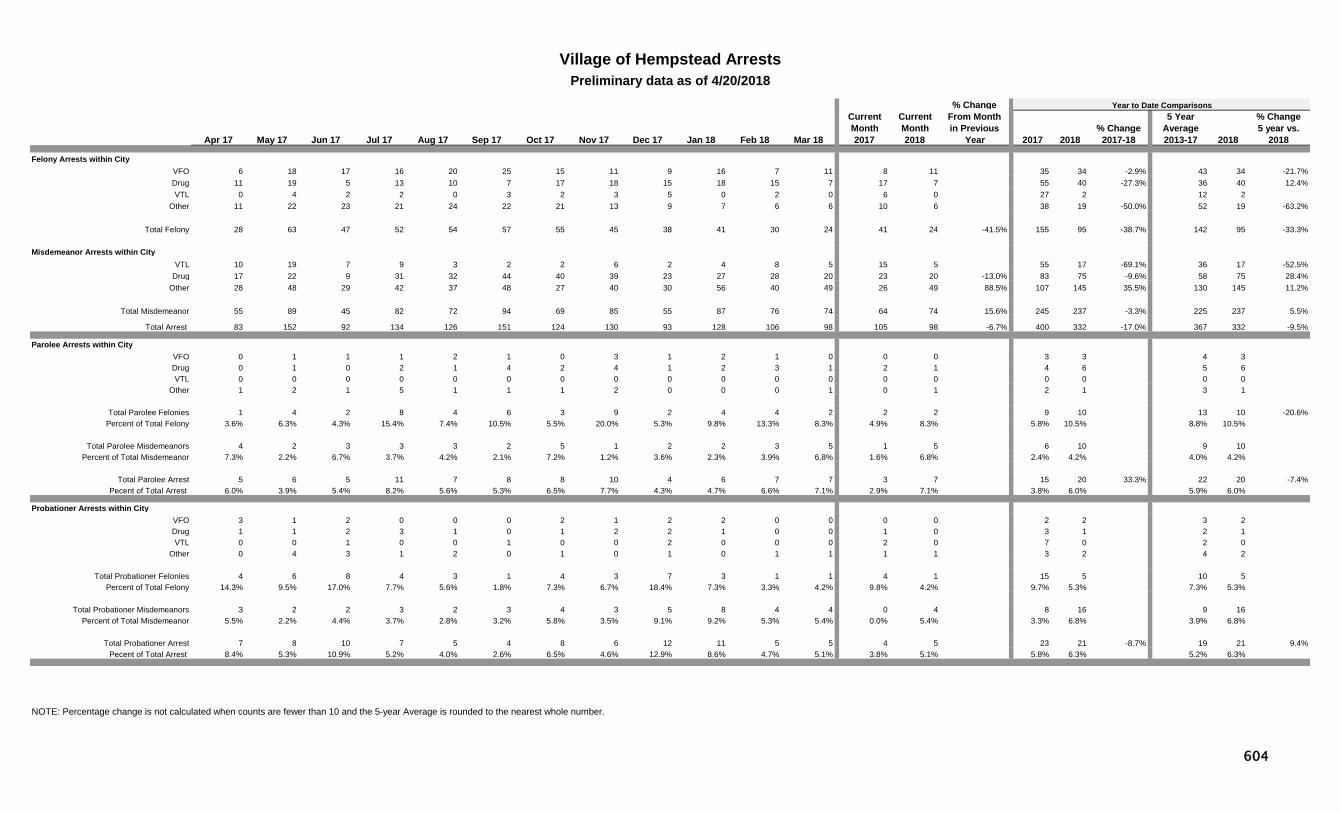
Felony Arrests within CityVFO 6 18 17 16 20 25 15 11 9 16 7 11 8 11 35 34 -2.9% 43 34 -21.7%Drug 11 19 5 13 10 7 17 18 15 18 15 7 17 7 55 40 -27.3% 36 40 12.4%VTL 0 4 2 2 0 3 2 3 5 0 2 0 6 0 27 2 12 2
Other 11 22 23 21 24 22 21 13 9 7 6 6 10 6 38 19 -50.0% 52 19 -63.2%
Total Felony 28 63 47 52 54 57 55 45 38 41 30 24 41 24 -41.5% 155 95 -38.7% 142 95 -33.3%
Misdemeanor Arrests within CityVTL 10 19 7 9 3 2 2 6 2 4 8 5 15 5 55 17 -69.1% 36 17 -52.5%
Drug 17 22 9 31 32 44 40 39 23 27 28 20 23 20 -13.0% 83 75 -9.6% 58 75 28.4%Other 28 48 29 42 37 48 27 40 30 56 40 49 26 49 88.5% 107 145 35.5% 130 145 11.2%
Total Misdemeanor 55 89 45 82 72 94 69 85 55 87 76 74 64 74 15.6% 245 237 -3.3% 225 237 5.5%
Total Arrest 83 152 92 134 126 151 124 130 93 128 106 98 105 98 -6.7% 400 332 -17.0% 367 332 -9.5%
Parolee Arrests within CityVFO 0 1 1 1 2 1 0 3 1 2 1 0 0 0 3 3 4 3 Drug 0 1 0 2 1 4 2 4 1 2 3 1 2 1 4 6 5 6 VTL 0 0 0 0 0 0 0 0 0 0 0 0 0 0 0 0 0 0
Other 1 2 1 5 1 1 1 2 0 0 0 1 0 1 2 1 3 1
Total Parolee Felonies 1 4 2 8 4 6 3 9 2 4 4 2 2 2 9 10 13 10 -20.6%Percent of Total Felony 3.6% 6.3% 4.3% 15.4% 7.4% 10.5% 5.5% 20.0% 5.3% 9.8% 13.3% 8.3% 4.9% 8.3% 5.8% 10.5% 8.8% 10.5%
Total Parolee Misdemeanors 4 2 3 3 3 2 5 1 2 2 3 5 1 5 6 10 9 10 Percent of Total Misdemeanor 7.3% 2.2% 6.7% 3.7% 4.2% 2.1% 7.2% 1.2% 3.6% 2.3% 3.9% 6.8% 1.6% 6.8% 2.4% 4.2% 4.0% 4.2%
Total Parolee Arrest 5 6 5 11 7 8 8 10 4 6 7 7 3 7 15 20 33.3% 22 20 -7.4%Pecent of Total Arrest 6.0% 3.9% 5.4% 8.2% 5.6% 5.3% 6.5% 7.7% 4.3% 4.7% 6.6% 7.1% 2.9% 7.1% 3.8% 6.0% 5.9% 6.0%
Probationer Arrests within CityVFO 3 1 2 0 0 0 2 1 2 2 0 0 0 0 2 2 3 2 Drug 1 1 2 3 1 0 1 2 2 1 0 0 1 0 3 1 2 1 VTL 0 0 1 0 0 1 0 0 2 0 0 0 2 0 7 0 2 0
Other 0 4 3 1 2 0 1 0 1 0 1 1 1 1 3 2 4 2
Total Probationer Felonies 4 6 8 4 3 1 4 3 7 3 1 1 4 1 15 5 10 5 Percent of Total Felony 14.3% 9.5% 17.0% 7.7% 5.6% 1.8% 7.3% 6.7% 18.4% 7.3% 3.3% 4.2% 9.8% 4.2% 9.7% 5.3% 7.3% 5.3%
Total Probationer Misdemeanors 3 2 2 3 2 3 4 3 5 8 4 4 0 4 8 16 9 16 Percent of Total Misdemeanor 5.5% 2.2% 4.4% 3.7% 2.8% 3.2% 5.8% 3.5% 9.1% 9.2% 5.3% 5.4% 0.0% 5.4% 3.3% 6.8% 3.9% 6.8%
Total Probationer Arrest 7 8 10 7 5 4 8 6 12 11 5 5 4 5 23 21 -8.7% 19 21 9.4%Pecent of Total Arrest 8.4% 5.3% 10.9% 5.2% 4.0% 2.6% 6.5% 4.6% 12.9% 8.6% 4.7% 5.1% 3.8% 5.1% 5.8% 6.3% 5.2% 6.3%
NOTE: Percentage change is not calculated when counts are fewer than 10 and the 5-year Average is rounded to the nearest whole number.
Village of Hempstead ArrestsPreliminary data as of 4/20/2018
Year to Date Comparisons5 Year
Average% Change5 year vs.
20182018
604

Current CurrentMonth Month
Apr 17 May 17 Jun 17 Jul 17 Aug 17 Sep 17 Oct 17 Nov 17 Dec 17 Jan 18 Feb 18 Mar 18 2017 2018 2013-17
Total Index Crimes 108 85 114 94 99 94 87 95 81 70 53 60 79 60 -24.1% 218 183 -16.1% 249 183 -26.6%
Violent Crimes 17 15 19 19 17 17 18 29 14 11 16 14 13 14 7.7% 31 41 32.3% 38 41 6.8%Murder 0 0 0 0 1 0 0 0 0 0 0 0 0 0 0 0 0 0 Rape* 3 3 4 1 0 1 3 6 1 2 4 2 0 2 4 8 6 8 N/ARobbery 2 1 1 4 5 4 3 4 5 2 1 4 0 4 2 7 8 7 Aggravated Assault 12 11 14 14 11 12 12 19 8 7 11 8 13 8 25 26 4.0% 24 26 6.6%
Property Crimes 91 70 95 75 82 77 69 66 67 59 37 46 66 46 -30.3% 187 142 -24.1% 211 142 -32.7%Burglary 32 25 23 17 17 22 25 17 9 15 10 13 10 13 30.0% 39 38 -2.6% 51 38 -24.9%Larceny 55 41 68 53 62 53 40 45 53 42 26 33 52 33 -36.5% 140 101 -27.9% 152 101 -33.4%Motor Vehicle Theft 4 4 4 5 3 2 4 4 5 2 1 0 4 0 8 3 9 3
5 Year % Change 10 Year % Change % Change Average 5 Year Avg. Average 10 Year Avg.
2008 2009 2010 2011 2012 2013 2014 2015* 2016* 2017* 2016-17 2012-16 vs. 2017 2007-16 vs. 2017
Total Index Crimes 1,365 1,255 1,462 1,327 1,364 1,308 1,485 1,250 1,288 1,075 -16.5% 1,339 -19.7% 1,343 -19.9%
Violent Crimes 185 153 181 203 183 168 198 238 225 196 -12.9% 202 -3.2% 190 3.0%Murder 3 2 0 0 0 0 1 2 4 1 1 1 Rape* 20 20 24 22 15 19 20 42 40 26 -35.0% N/A N/A N/A N/ARobbery 40 26 35 36 39 39 45 55 47 31 -34.0% 45 -31.1% 39 -20.9%Aggravated Assault 122 105 122 145 129 110 132 139 134 138 3.0% 129 7.1% 126 10.0%
Property Crimes 1,180 1,102 1,281 1,124 1,181 1,140 1,287 1,012 1,063 879 -17.3% 1,137 -22.7% 1,153 -23.7%Burglary 344 266 342 335 359 281 355 297 323 226 -30.0% 323 -30.0% 320 -29.4%Larceny 811 816 895 758 784 829 884 663 687 610 -11.2% 769 -20.7% 795 -23.2%Motor Vehicle Theft 25 20 44 31 38 30 48 52 53 43 -18.9% 44 -2.7% 38 13.8%
*PLEASE SEE Definitions Page for Reporting Changes to the Index Crime of Rape effective March 2016, which also impacts violent and Index crime totals.
NOTE: Percentage change is not calculated when counts are fewer than 10 and the 5-year and 10-year Averages are rounded to the nearest whole number.
Note: A local IBR programming error has been identified for incidents involving Grand Larceny in the 4th of a motor vehicle (PL 155.30 sub 8) and Unauthorized Use in the 3rd (PL 165.05 sub 1). This error may result in an under count of this agency’s reported motor vehicle thefts.
Jamestown City Police Department (IBR)As of 04/10/2018
Index Crimes
Year to Date Comparisons
% Change 2017-182017 2018
% Change From Month in Previous Year
5 Year Average
% Change5 Year Avg.
vs. 20182018
700
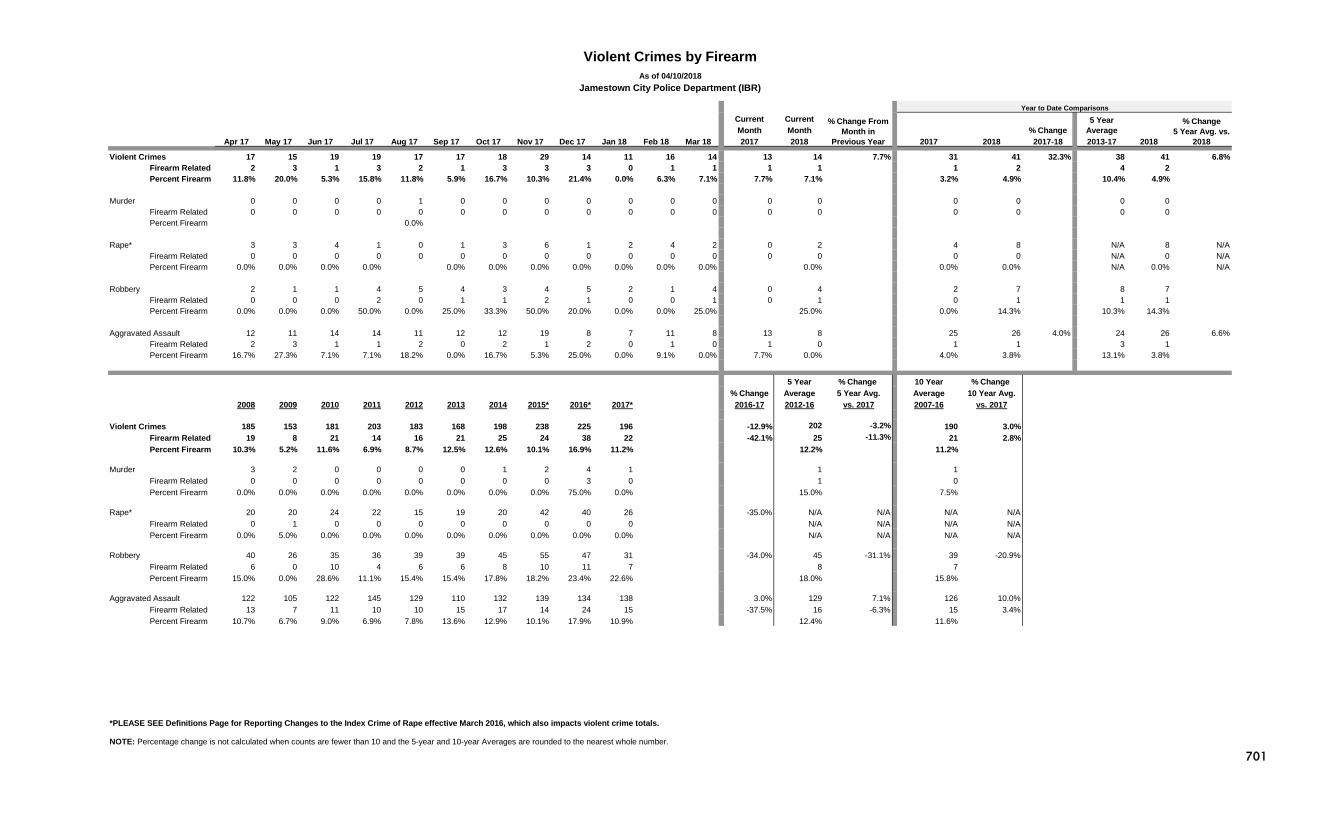
Current CurrentMonth Month % Change
Apr 17 May 17 Jun 17 Jul 17 Aug 17 Sep 17 Oct 17 Nov 17 Dec 17 Jan 18 Feb 18 Mar 18 2017 2018 2017 2018 2017-18 2013-17
Violent Crimes 17 15 19 19 17 17 18 29 14 11 16 14 13 14 7.7% 31 41 32.3% 38 41 6.8%Firearm Related 2 3 1 3 2 1 3 3 3 0 1 1 1 1 1 2 4 2 Percent Firearm 11.8% 20.0% 5.3% 15.8% 11.8% 5.9% 16.7% 10.3% 21.4% 0.0% 6.3% 7.1% 7.7% 7.1% 3.2% 4.9% 10.4% 4.9%
Murder 0 0 0 0 1 0 0 0 0 0 0 0 0 0 0 0 0 0
Firearm Related 0 0 0 0 0 0 0 0 0 0 0 0 0 0 0 0 0 0 Percent Firearm 0.0%
Rape* 3 3 4 1 0 1 3 6 1 2 4 2 0 2 4 8 N/A 8 N/AFirearm Related 0 0 0 0 0 0 0 0 0 0 0 0 0 0 0 0 N/A 0 N/APercent Firearm 0.0% 0.0% 0.0% 0.0% 0.0% 0.0% 0.0% 0.0% 0.0% 0.0% 0.0% 0.0% 0.0% 0.0% N/A 0.0% N/A
Robbery 2 1 1 4 5 4 3 4 5 2 1 4 0 4 2 7 8 7 Firearm Related 0 0 0 2 0 1 1 2 1 0 0 1 0 1 0 1 1 1 Percent Firearm 0.0% 0.0% 0.0% 50.0% 0.0% 25.0% 33.3% 50.0% 20.0% 0.0% 0.0% 25.0% 25.0% 0.0% 14.3% 10.3% 14.3%
Aggravated Assault 12 11 14 14 11 12 12 19 8 7 11 8 13 8 25 26 4.0% 24 26 6.6%Firearm Related 2 3 1 1 2 0 2 1 2 0 1 0 1 0 1 1 3 1 Percent Firearm 16.7% 27.3% 7.1% 7.1% 18.2% 0.0% 16.7% 5.3% 25.0% 0.0% 9.1% 0.0% 7.7% 0.0% 4.0% 3.8% 13.1% 3.8%
5 Year % Change 10 Year % Change % Change Average 5 Year Avg. Average 10 Year Avg.
2008 2009 2010 2011 2012 2013 2014 2015* 2016* 2017* 2016-17 2012-16 vs. 2017 2007-16 vs. 2017
Violent Crimes 185 153 181 203 183 168 198 238 225 196 -12.9% 202 -3.2% 190 3.0%Firearm Related 19 8 21 14 16 21 25 24 38 22 -42.1% 25 -11.3% 21 2.8%Percent Firearm 10.3% 5.2% 11.6% 6.9% 8.7% 12.5% 12.6% 10.1% 16.9% 11.2% 12.2% 11.2%
Murder 3 2 0 0 0 0 1 2 4 1 1 1 Firearm Related 0 0 0 0 0 0 0 0 3 0 1 0 Percent Firearm 0.0% 0.0% 0.0% 0.0% 0.0% 0.0% 0.0% 0.0% 75.0% 0.0% 15.0% 7.5%
Rape* 20 20 24 22 15 19 20 42 40 26 -35.0% N/A N/A N/A N/AFirearm Related 0 1 0 0 0 0 0 0 0 0 N/A N/A N/A N/APercent Firearm 0.0% 5.0% 0.0% 0.0% 0.0% 0.0% 0.0% 0.0% 0.0% 0.0% N/A N/A N/A N/A
Robbery 40 26 35 36 39 39 45 55 47 31 -34.0% 45 -31.1% 39 -20.9%Firearm Related 6 0 10 4 6 6 8 10 11 7 8 7 Percent Firearm 15.0% 0.0% 28.6% 11.1% 15.4% 15.4% 17.8% 18.2% 23.4% 22.6% 18.0% 15.8%
Aggravated Assault 122 105 122 145 129 110 132 139 134 138 3.0% 129 7.1% 126 10.0%Firearm Related 13 7 11 10 10 15 17 14 24 15 -37.5% 16 -6.3% 15 3.4%Percent Firearm 10.7% 6.7% 9.0% 6.9% 7.8% 13.6% 12.9% 10.1% 17.9% 10.9% 12.4% 11.6%
*PLEASE SEE Definitions Page for Reporting Changes to the Index Crime of Rape effective March 2016, which also impacts violent crime totals.
NOTE: Percentage change is not calculated when counts are fewer than 10 and the 5-year and 10-year Averages are rounded to the nearest whole number.
Violent Crimes by FirearmAs of 04/10/2018
Jamestown City Police Department (IBR)
% Change From Month in
Previous Year
5 Year Average
% Change5 Year Avg. vs.
20182018
Year to Date Comparisons
701

Current CurrentMonth Month % Change
Apr 17 May 17 Jun 17 Jul 17 Aug 17 Sep 17 Oct 17 Nov 17 Dec 17 Jan 18 Feb 18 Mar 18 2017 2018 2017 2018 2017-18 2013-17
Shooting Incidents Involving Injury 0 0 0 0 0 0 2 1 0 0 0 1 0 1 0 1 1 1
Shooting Victims (Persons Hit) 0 0 0 0 0 0 2 1 0 0 0 1 0 1 0 1 1 1
Individuals Killed by Gun Violence 0 0 0 0 0 0 0 0 0 0 0 0 0 0 0 0 0 0
5 Year % Change % Change Average 5 Year Avg.
Totals 2009 2010 2011 2012 2013 2014 2015 2016 2017 2016-17 2012-16 vs. 2017
Shooting Incidents Involving Injury 0 1 1 0 1 2 3 7 3 3
Shooting Victims (Persons Hit) 0 1 1 0 1 2 3 7 3 3
Individuals Killed by Gun Violence 0 0 0 0 0 0 0 3 0 1
NOTE: Percentage change is not calculated when counts are fewer than 10 and the 5-year Average is rounded to the nearest whole number.
Firearm Activity As of 04/06/2018
Jamestown City Police Department
Year to Date Comparisons
% Change From Month in Previous Year
5 Year Average
% Change5 Year Avg.
vs. 20182018
702

% Change % ChangeFrom Current Current From Month % Change
Previous Month Month in Previous YTD YTD in Apr 17 May 17 Jun 17 Jul 17 Aug 17 Sep 17 Oct 17 Nov 17 Dec 17 Jan 18 Feb 18 Mar 18 Month 2017 2018 Year 2017 2018 YTD
Total Aggravated Assaults 12 11 14 14 11 12 12 19 8 7 11 8 13 8 25 26 4.0%Victims of DV-Related Aggravated Assaults 6 7 5 7 5 2 5 9 5 4 8 3 4 3 10 15 50.0%Percent DV-Related (Aggravated Assaults) 50.0% 63.6% 35.7% 50.0% 45.5% 16.7% 41.7% 47.4% 62.5% 57.1% 72.7% 37.5% 30.8% 37.5% 40.0% 57.7% Intimate Partner Victims 5 5 5 4 4 1 3 7 2 3 7 2 0 2 4 12
Intimate Partner - Female Victim 4 5 4 4 3 1 2 7 2 3 5 2 0 2 4 10 Intimate Partner - Male Victim 1 0 1 0 1 0 1 0 0 0 2 0 0 0 0 2
Other Family Victim 1 2 0 3 1 1 2 2 3 1 1 1 4 1 6 3
Total Simple Assaults 69 80 41 66 61 45 61 55 51 42 39 65 66.7% 55 65 18.2% 129 146 13.2%Victims of DV-Related Simple Assaults 30 44 26 48 40 31 30 33 30 29 31 43 38.7% 36 43 19.4% 78 103 32.1%Percent DV-Related (Simple Assaults) 43.5% 55.0% 63.4% 72.7% 65.6% 68.9% 49.2% 60.0% 58.8% 69.0% 79.5% 66.2% 65.5% 66.2% 60.5% 70.5% Intimate Partner Victims 27 34 19 37 26 22 24 25 23 20 22 33 50.0% 27 33 22.2% 61 75 23.0%
Intimate Partner - Female Victim 19 27 12 35 22 20 19 18 19 19 15 32 113.3% 21 32 52.4% 51 66 29.4%Intimate Partner - Male Victim 8 7 7 2 4 2 5 7 4 1 7 1 6 1 10 9
Other Family Victim 3 10 7 11 14 9 6 8 7 9 9 10 9 10 17 28 64.7%
% Change2009 2010 2011 2012 2013 2014 2015 2016 2017 16 vs. 17
Total Aggravated Assaults 105 122 145 129 110 132 139 134 138 3.0%Victims of DV-Related Aggravated Assaults 23 50 47 41 43 45 56 43 61 41.9%Percent DV-Related (Aggravated Assaults) 21.9% 41.0% 32.4% 31.8% 39.1% 34.1% 40.3% 32.1% 44.2% Intimate Partner Victims 17 33 33 28 26 27 33 27 40 48.1%
Intimate Partner - Female Victim 7 24 27 24 19 19 27 22 36 63.6%Intimate Partner - Male Victim 10 9 6 4 7 8 6 5 4
Other Family Victim 6 17 14 13 17 18 23 16 21 31.3%
Total Simple Assaults 982 1,254 1,195 1,097 909 779 731 705 658 -6.7%Victims of DV-Related Simple Assaults 560 689 675 564 476 426 418 428 390 -8.9%Percent DV-Related (Simple Assaults) 57.0% 54.9% 56.5% 51.4% 52.4% 54.7% 57.2% 60.7% 59.3% Intimate Partner Victims 424 531 487 419 357 301 301 316 298 -5.7%
Intimate Partner - Female Victim 343 401 374 338 290 256 246 252 242 -4.0%Intimate Partner - Male Victim 81 130 113 81 67 45 55 64 56 -12.5%
Other Family Victim 136 158 188 145 119 125 117 112 92 -17.9%
Note: Jamestown IBR data is "crunched" into UCR domestic violence crime categories and relationships.
Intimate Partner (Female/Male): includes spouse, ex-spouse, and those in an intimate relationship (including dating or formerly dating relationships, whether or not the intimate partners had ever lived together).
Other Family: includes sibling, child, grandparent, grandchild, in-law, stepparent, stepsibling, and other family blood and in-law relationships
*Percent change is not calculated where counts are less than 10.
Domestic Violence VictimsAs of 04/10/2018
Jamestown City Police Department (IBR)
703

% ChangeCurrent Current From MonthMonth Month in Previous % Change
Apr 17 May 17 Jun 17 Jul 17 Aug 17 Sep 17 Oct 17 Nov 17 Dec 17 Jan 18 Feb 18 Mar 18 2017 2018 Year 2017 2018 2017-18 2013-17
Felony Arrests within CityVFO 7 9 12 8 12 13 11 14 14 9 10 10 10 10 0.0% 20 29 45.0% 20 29 42.2%Drug 28 24 14 20 3 6 11 16 4 6 1 16 11 16 45.5% 33 23 -30.3% 28 23 -18.4%VTL 2 1 2 4 4 3 4 1 0 9 2 1 3 1 6 12 6 12
Other 26 37 20 19 35 23 22 36 14 22 25 36 16 36 125.0% 65 83 27.7% 56 83 47.7%
Total Felony 63 71 48 51 54 45 48 67 32 46 38 63 40 63 57.5% 124 147 18.5% 111 147 32.9%
Misdemeanor Arrests within CityVTL 2 5 6 9 8 8 3 12 6 12 9 12 6 12 25 33 32.0% 23 33 44.7%
Drug 15 21 22 21 24 29 13 23 9 13 18 21 13 21 61.5% 41 52 26.8% 30 52 71.1%Other 73 78 68 79 92 61 69 55 57 71 36 58 53 58 9.4% 164 165 0.6% 188 165 -12.4%
Total Misdemeanor 90 104 96 109 124 98 85 90 72 96 63 91 72 91 26.4% 230 250 8.7% 242 250 3.5%
Total Arrest 153 175 144 160 178 143 133 157 104 142 101 154 112 154 37.5% 354 397 12.1% 352 397 12.7%
Parolee Arrests within CityVFO 0 1 0 0 1 2 0 1 0 0 0 0 0 0 1 0 1 0 Drug 0 1 0 1 0 1 0 1 0 0 0 0 0 0 0 0 1 0 VTL 0 0 0 1 0 0 0 0 0 0 0 0 0 0 0 0 0 0
Other 2 4 1 0 1 1 0 1 0 0 0 0 0 0 4 0 2 0
Total Parolee Felonies 2 6 1 2 2 4 0 3 0 0 0 0 0 0 5 0 3 0 Percent of Total Felony 3.2% 8.5% 2.1% 3.9% 3.7% 8.9% 0.0% 4.5% 0.0% 0.0% 0.0% 0.0% 0.0% 0.0% 4.0% 0.0% 2.9% 0.0%
Total Parolee Misdemeanors 1 4 1 2 4 0 0 2 4 0 2 2 1 2 7 4 6 4 Percent of Total Misdemeanor 1.1% 3.8% 1.0% 1.8% 3.2% 0.0% 0.0% 2.2% 5.6% 0.0% 3.2% 2.2% 1.4% 2.2% 3.0% 1.6% 2.3% 1.6%
Total Parolee Arrest 3 10 2 4 6 4 0 5 4 0 2 2 1 2 12 4 9 4 Pecent of Total Arrest 2.0% 5.7% 1.4% 2.5% 3.4% 2.8% 0.0% 3.2% 3.8% 0.0% 2.0% 1.3% 0.9% 1.3% 3.4% 1.0% 2.5% 1.0%
Probationer Arrests within CityVFO 1 0 2 1 2 1 1 1 2 2 1 2 1 2 2 5 2 5 Drug 3 3 2 2 1 0 1 1 1 1 0 2 1 2 5 3 3 3 VTL 0 0 0 0 1 2 0 0 0 1 1 0 0 0 1 2 1 2
Other 3 11 2 6 6 5 7 4 2 3 5 4 0 4 10 12 20.0% 12 12 1.7%
Total Probationer Felonies 7 14 6 9 10 8 9 6 5 7 7 8 2 8 18 22 22.2% 18 22 20.9%Percent of Total Felony 11.1% 19.7% 12.5% 17.6% 18.5% 17.8% 18.8% 9.0% 15.6% 15.2% 18.4% 12.7% 5.0% 12.7% 14.5% 15.0% 16.5% 15.0%
Total Probationer Misdemeanors 10 11 8 8 12 5 6 9 4 7 5 6 7 6 24 18 -25.0% 29 18 -37.1%Percent of Total Misdemeanor 11.1% 10.6% 8.3% 7.3% 9.7% 5.1% 7.1% 10.0% 5.6% 7.3% 7.9% 6.6% 9.7% 6.6% 10.4% 7.2% 11.8% 7.2%
Total Probationer Arrest 17 25 14 17 22 13 15 15 9 14 12 14 9 14 42 40 -4.8% 47 40 -14.5%Pecent of Total Arrest 11.1% 14.3% 9.7% 10.6% 12.4% 9.1% 11.3% 9.6% 8.7% 9.9% 11.9% 9.1% 8.0% 9.1% 11.9% 10.1% 13.3% 10.1%
NOTE: Percentage change is not calculated when counts are fewer than 10 and the 5-year Average is rounded to the nearest whole number.
City of Jamestown ArrestsPreliminary data as of 4/20/2018
Year to Date Comparisons5 Year
Average% Change5 year vs.
20182018
704

Current CurrentMonth Month
Apr 17 May 17 Jun 17 Jul 17 Aug 17 Sep 17 Oct 17 Nov 17 Dec 17 Jan 18 Feb 18 Mar 18 2017 2018 2013-17
Total Index Crimes 34 44 54 42 50 44 56 56 37 36 27 32 39 32 -17.9% 105 95 -9.5% 127 95 -25.4%
Violent Crimes 4 6 15 9 8 3 7 6 2 5 2 7 7 7 13 14 7.7% 16 14 -12.5%Murder 0 0 0 0 0 0 0 1 0 0 0 0 0 0 0 0 0 0 Rape* 1 0 1 0 2 0 0 0 0 0 0 1 0 1 1 1 2 1 N/ARobbery 1 2 3 3 2 1 3 2 1 2 1 1 2 1 4 4 4 4 Aggravated Assault 2 4 11 6 4 2 4 3 1 3 1 5 5 5 8 9 10 9
Property Crimes 30 38 39 33 42 41 49 50 35 31 25 25 32 25 -21.9% 92 81 -12.0% 111 81 -27.3%Burglary 3 9 6 5 4 5 2 3 6 4 5 4 2 4 10 13 30.0% 16 13 -20.7%Larceny 26 29 33 28 37 35 46 47 29 26 20 18 30 18 -40.0% 82 64 -22.0% 93 64 -30.9%Motor Vehicle Theft 1 0 0 0 1 1 1 0 0 1 0 3 0 3 0 4 2 4
5 Year % Change 10 Year % Change % Change Average 5 Year Avg. Average 10 Year Avg.
2008 2009 2010 2011 2012 2013 2014 2015* 2016* 2017* 2016-17 2012-16 vs. 2017 2007-16 vs. 2017
Total Index Crimes 714 759 692 673 842 761 743 731 560 522 -6.8% 727 -28.2% 724 -27.9%
Violent Crimes 69 97 81 93 70 74 71 71 76 73 -3.9% 72 0.8% 77 -5.1%Murder 0 0 1 0 0 1 2 0 0 1 1 1 Rape* 5 2 5 8 4 4 9 13 10 5 N/A N/A N/A N/ARobbery 48 69 29 34 20 25 25 30 23 22 -4.3% 25 -10.6% 34 -35.5%Aggravated Assault 16 26 46 51 46 44 35 28 43 45 4.7% 39 14.8% 36 25.7%
Property Crimes 645 662 611 580 772 687 672 660 484 449 -7.2% 655 -31.5% 647 -30.6%Burglary 115 122 142 115 114 112 87 98 57 53 -7.0% 94 -43.4% 108 -51.1%Larceny 510 510 451 450 648 565 578 549 418 392 -6.2% 552 -28.9% 523 -25.0%Motor Vehicle Theft 20 30 18 15 10 10 7 13 9 4 10 16
*PLEASE SEE Definitions Page for Reporting Changes to the Index Crime of Rape effective March 2016, which also impacts violent and Index crime totals.
NOTE: Percentage change is not calculated when counts are fewer than 10 and the 5-year and 10-year Averages are rounded to the nearest whole number.
Kingston City Police Department (UCR)As of 04/11/2018
Index Crimes
Year to Date Comparisons
% Change 2017-182017 2018
% Change From Month in Previous Year
5 Year Average
% Change5 Year Avg.
vs. 20182018
800
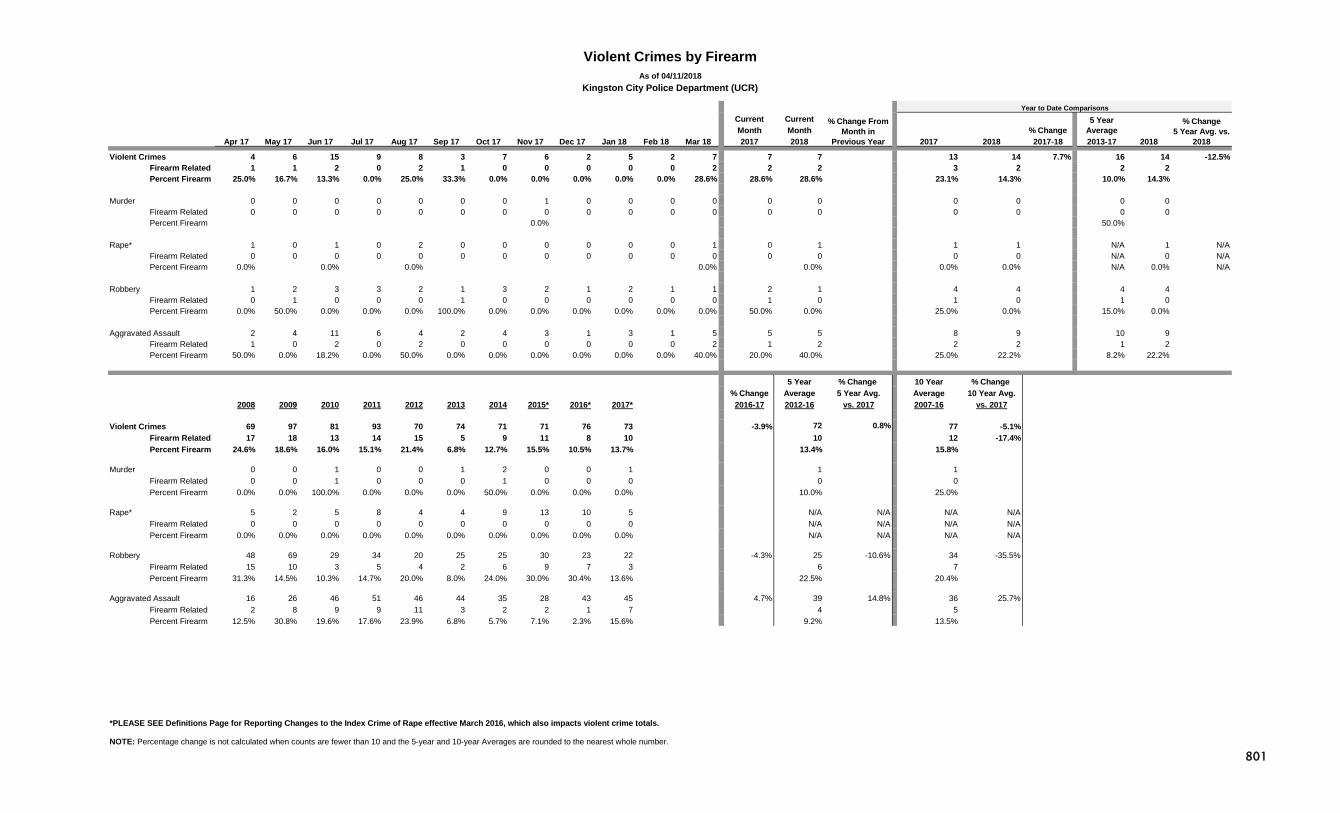
Current CurrentMonth Month % Change
Apr 17 May 17 Jun 17 Jul 17 Aug 17 Sep 17 Oct 17 Nov 17 Dec 17 Jan 18 Feb 18 Mar 18 2017 2018 2017 2018 2017-18 2013-17
Violent Crimes 4 6 15 9 8 3 7 6 2 5 2 7 7 7 13 14 7.7% 16 14 -12.5%Firearm Related 1 1 2 0 2 1 0 0 0 0 0 2 2 2 3 2 2 2 Percent Firearm 25.0% 16.7% 13.3% 0.0% 25.0% 33.3% 0.0% 0.0% 0.0% 0.0% 0.0% 28.6% 28.6% 28.6% 23.1% 14.3% 10.0% 14.3%
Murder 0 0 0 0 0 0 0 1 0 0 0 0 0 0 0 0 0 0
Firearm Related 0 0 0 0 0 0 0 0 0 0 0 0 0 0 0 0 0 0 Percent Firearm 0.0% 50.0%
Rape* 1 0 1 0 2 0 0 0 0 0 0 1 0 1 1 1 N/A 1 N/AFirearm Related 0 0 0 0 0 0 0 0 0 0 0 0 0 0 0 0 N/A 0 N/APercent Firearm 0.0% 0.0% 0.0% 0.0% 0.0% 0.0% 0.0% N/A 0.0% N/A
Robbery 1 2 3 3 2 1 3 2 1 2 1 1 2 1 4 4 4 4 Firearm Related 0 1 0 0 0 1 0 0 0 0 0 0 1 0 1 0 1 0 Percent Firearm 0.0% 50.0% 0.0% 0.0% 0.0% 100.0% 0.0% 0.0% 0.0% 0.0% 0.0% 0.0% 50.0% 0.0% 25.0% 0.0% 15.0% 0.0%
Aggravated Assault 2 4 11 6 4 2 4 3 1 3 1 5 5 5 8 9 10 9 Firearm Related 1 0 2 0 2 0 0 0 0 0 0 2 1 2 2 2 1 2 Percent Firearm 50.0% 0.0% 18.2% 0.0% 50.0% 0.0% 0.0% 0.0% 0.0% 0.0% 0.0% 40.0% 20.0% 40.0% 25.0% 22.2% 8.2% 22.2%
5 Year % Change 10 Year % Change % Change Average 5 Year Avg. Average 10 Year Avg.
2008 2009 2010 2011 2012 2013 2014 2015* 2016* 2017* 2016-17 2012-16 vs. 2017 2007-16 vs. 2017
Violent Crimes 69 97 81 93 70 74 71 71 76 73 -3.9% 72 0.8% 77 -5.1%Firearm Related 17 18 13 14 15 5 9 11 8 10 10 12 -17.4%Percent Firearm 24.6% 18.6% 16.0% 15.1% 21.4% 6.8% 12.7% 15.5% 10.5% 13.7% 13.4% 15.8%
Murder 0 0 1 0 0 1 2 0 0 1 1 1 Firearm Related 0 0 1 0 0 0 1 0 0 0 0 0 Percent Firearm 0.0% 0.0% 100.0% 0.0% 0.0% 0.0% 50.0% 0.0% 0.0% 0.0% 10.0% 25.0%
Rape* 5 2 5 8 4 4 9 13 10 5 N/A N/A N/A N/AFirearm Related 0 0 0 0 0 0 0 0 0 0 N/A N/A N/A N/APercent Firearm 0.0% 0.0% 0.0% 0.0% 0.0% 0.0% 0.0% 0.0% 0.0% 0.0% N/A N/A N/A N/A
Robbery 48 69 29 34 20 25 25 30 23 22 -4.3% 25 -10.6% 34 -35.5%Firearm Related 15 10 3 5 4 2 6 9 7 3 6 7 Percent Firearm 31.3% 14.5% 10.3% 14.7% 20.0% 8.0% 24.0% 30.0% 30.4% 13.6% 22.5% 20.4%
Aggravated Assault 16 26 46 51 46 44 35 28 43 45 4.7% 39 14.8% 36 25.7%Firearm Related 2 8 9 9 11 3 2 2 1 7 4 5 Percent Firearm 12.5% 30.8% 19.6% 17.6% 23.9% 6.8% 5.7% 7.1% 2.3% 15.6% 9.2% 13.5%
*PLEASE SEE Definitions Page for Reporting Changes to the Index Crime of Rape effective March 2016, which also impacts violent crime totals.
NOTE: Percentage change is not calculated when counts are fewer than 10 and the 5-year and 10-year Averages are rounded to the nearest whole number.
Violent Crimes by FirearmAs of 04/11/2018
Kingston City Police Department (UCR)
% Change From Month in
Previous Year
5 Year Average
% Change5 Year Avg. vs.
20182018
Year to Date Comparisons
801

Current CurrentMonth Month % Change
Apr 17 May 17 Jun 17 Jul 17 Aug 17 Sep 17 Oct 17 Nov 17 Dec 17 Jan 18 Feb 18 Mar 18 2017 2018 2017 2018 2017-18 2013-17
Shooting Incidents Involving Injury 0 0 1 0 1 0 0 0 0 0 0 0 0 0 0 0 0 0
Shooting Victims (Persons Hit) 0 0 1 0 1 0 0 0 0 0 0 0 0 0 0 0 0 0
Individuals Killed by Gun Violence 0 0 0 0 0 0 0 0 0 0 0 0 0 0 0 0 0 0
5 Year % Change % Change Average 5 Year Avg.
Totals 2009 2010 2011 2012 2013 2014 2015 2016 2017 2016-17 2012-16 vs. 2017
Shooting Incidents Involving Injury 5 6 5 1 2 2 2 2 2 2
Shooting Victims (Persons Hit) 5 8 6 10 2 3 2 3 2 4
Individuals Killed by Gun Violence 0 1 0 0 0 1 0 0 0 0
NOTE: Percentage change is not calculated when counts are fewer than 10 and the 5-year Average is rounded to the nearest whole number.
Firearm Activity As of 04/06/2018
Kingston City Police Department
Year to Date Comparisons
% Change From Month in Previous Year
5 Year Average
% Change5 Year Avg.
vs. 20182018
802

% Change % ChangeFrom Current Current From Month % Change
Previous Month Month in Previous YTD YTD in Apr 17 May 17 Jun 17 Jul 17 Aug 17 Sep 17 Oct 17 Nov 17 Dec 17 Jan 18 Feb 18 Mar 18 Month 2017 2018 Year 2017 2018 YTD
Total Aggravated Assaults 2 4 11 6 4 2 4 3 1 3 1 5 5 5 8 9 Victims of DV-Related Aggravated Assaults 0 0 0 2 1 0 1 0 1 3 1 3 1 3 2 7 Percent DV-Related (Aggravated Assaults) 0.0% 0.0% 0.0% 33.3% 25.0% 0.0% 25.0% 0.0% 100.0% 100.0% 100.0% 60.0% 20.0% 60.0% 25.0% 77.8% Intimate Partner Victims 0 0 0 2 1 0 1 0 1 2 0 3 1 3 2 5
Intimate Partner - Female Victim 0 0 0 2 0 0 1 0 1 0 0 3 1 3 2 3 Intimate Partner - Male Victim 0 0 0 0 1 0 0 0 0 2 0 0 0 0 0 2
Other Family Victim 0 0 0 0 0 0 0 0 0 1 1 0 0 0 0 2
Total Simple Assaults 15 29 28 28 18 23 26 21 23 25 17 32 88.2% 24 32 33.3% 81 74 -8.6%Victims of DV-Related Simple Assaults 12 11 12 13 5 9 9 12 15 14 11 12 9.1% 13 12 -7.7% 38 37 -2.6%Percent DV-Related (Simple Assaults) 80.0% 37.9% 42.9% 46.4% 27.8% 39.1% 34.6% 57.1% 65.2% 56.0% 64.7% 37.5% 54.2% 37.5% 46.9% 50.0% Intimate Partner Victims 8 9 10 13 3 9 7 9 12 10 5 9 11 9 32 24 -25.0%
Intimate Partner - Female Victim 7 8 8 9 3 5 6 7 11 9 5 8 10 8 24 22 -8.3%Intimate Partner - Male Victim 1 1 2 4 0 4 1 2 1 1 0 1 1 1 8 2
Other Family Victim 4 2 2 0 2 0 2 3 3 4 6 3 2 3 6 13
% Change2009 2010 2011 2012 2013 2014 2015 2016 2017 16 vs. 17
Total Aggravated Assaults 26 46 51 46 44 35 28 43 45 4.7%Victims of DV-Related Aggravated Assaults 15 14 21 7 11 7 4 12 7 Percent DV-Related (Aggravated Assaults) 57.7% 30.4% 41.2% 15.2% 25.0% 20.0% 14.3% 27.9% 15.6% Intimate Partner Victims 14 10 16 5 9 6 2 11 7
Intimate Partner - Female Victim 12 6 13 3 8 4 0 7 6 Intimate Partner - Male Victim 2 4 3 2 1 2 2 4 1
Other Family Victim 1 4 5 2 2 1 2 1 0
Total Simple Assaults 560 495 518 441 474 414 372 320 292 -8.8%Victims of DV-Related Simple Assaults 186 203 188 156 157 169 150 143 136 -4.9%Percent DV-Related (Simple Assaults) 33.2% 41.0% 36.3% 35.4% 33.1% 40.8% 40.3% 44.7% 46.6% Intimate Partner Victims 154 160 153 119 121 122 115 102 112 9.8%
Intimate Partner - Female Victim 130 135 123 93 94 92 89 83 88 6.0%Intimate Partner - Male Victim 24 25 30 26 27 30 26 19 24 26.3%
Other Family Victim 32 43 35 37 36 47 35 41 24 -41.5%
Intimate Partner (Female/Male): includes spouse, ex-spouse, and those in an intimate relationship (including dating or formerly dating relationships, whether or not the intimate partners had ever lived together).
Other Family: includes sibling, child, grandparent, grandchild, in-law, stepparent, stepsibling, and other family blood and in-law relationships
*Percent change is not calculated where counts are less than 10.
Domestic Violence VictimsAs of 04/11/2018
Kingston City Police Department (UCR)
803

% ChangeCurrent Current From MonthMonth Month in Previous % Change
Apr 17 May 17 Jun 17 Jul 17 Aug 17 Sep 17 Oct 17 Nov 17 Dec 17 Jan 18 Feb 18 Mar 18 2017 2018 Year 2017 2018 2017-18 2013-17
Felony Arrests within CityVFO 0 1 4 5 6 2 3 7 6 5 3 2 2 2 9 10 15 10 -33.3%Drug 8 9 6 3 2 4 2 5 3 7 7 10 5 10 13 24 84.6% 18 24 30.4%VTL 5 1 2 2 2 1 1 3 3 4 0 3 2 3 7 7 6 7
Other 17 17 11 22 17 13 14 10 12 16 8 17 13 17 30.8% 44 41 -6.8% 44 41 -6.4%
Total Felony 30 28 23 32 27 20 20 25 24 32 18 32 22 32 45.5% 73 82 12.3% 83 82 -1.2%
Misdemeanor Arrests within CityVTL 16 13 11 11 6 10 9 11 7 4 6 9 11 9 37 19 -48.6% 28 19 -32.6%
Drug 16 12 16 19 7 7 3 9 7 4 6 8 12 8 37 18 -51.4% 26 18 -30.8%Other 50 40 43 53 45 25 42 23 37 35 24 33 43 33 -23.3% 128 92 -28.1% 124 92 -25.9%
Total Misdemeanor 82 65 70 83 58 42 54 43 51 43 36 50 66 50 -24.2% 202 129 -36.1% 178 129 -27.7%
Total Arrest 112 93 93 115 85 62 74 68 75 75 54 82 88 82 -6.8% 275 211 -23.3% 261 211 -19.3%
Parolee Arrests within CityVFO 0 0 0 1 0 0 1 0 3 2 0 0 0 0 1 2 1 2 Drug 0 1 0 0 0 0 0 1 0 3 0 0 2 0 4 3 4 3 VTL 0 0 0 0 0 0 0 0 1 0 0 1 0 1 0 1 0 1
Other 2 2 0 1 2 1 0 0 1 1 0 0 0 0 1 1 2 1
Total Parolee Felonies 2 3 0 2 2 1 1 1 5 6 0 1 2 1 6 7 7 7 Percent of Total Felony 6.7% 10.7% 0.0% 6.3% 7.4% 5.0% 5.0% 4.0% 20.8% 18.8% 0.0% 3.1% 9.1% 3.1% 8.2% 8.5% 8.2% 8.5%
Total Parolee Misdemeanors 4 1 2 3 2 0 0 0 2 2 3 1 2 1 3 6 4 6 Percent of Total Misdemeanor 4.9% 1.5% 2.9% 3.6% 3.4% 0.0% 0.0% 0.0% 3.9% 4.7% 8.3% 2.0% 3.0% 2.0% 1.5% 4.7% 2.2% 4.7%
Total Parolee Arrest 6 4 2 5 4 1 1 1 7 8 3 2 4 2 9 13 11 13 20.4%Pecent of Total Arrest 5.4% 4.3% 2.2% 4.3% 4.7% 1.6% 1.4% 1.5% 9.3% 10.7% 5.6% 2.4% 4.5% 2.4% 3.3% 6.2% 4.1% 6.2%
Probationer Arrests within CityVFO 0 0 0 0 2 0 0 1 0 0 0 0 0 0 1 0 2 0 Drug 0 1 0 0 0 1 0 0 0 0 0 0 0 0 1 0 2 0 VTL 1 0 0 0 0 0 0 0 0 0 0 0 0 0 1 0 0 0
Other 1 2 4 4 1 0 0 0 0 0 0 1 0 1 5 1 6 1
Total Probationer Felonies 2 3 4 4 3 1 0 1 0 0 0 1 0 1 8 1 9 1 Percent of Total Felony 6.7% 10.7% 17.4% 12.5% 11.1% 5.0% 0.0% 4.0% 0.0% 0.0% 0.0% 3.1% 0.0% 3.1% 11.0% 1.2% 11.3% 1.2%
Total Probationer Misdemeanors 4 7 2 3 5 1 3 3 3 5 1 2 4 2 10 8 10 8 Percent of Total Misdemeanor 4.9% 10.8% 2.9% 3.6% 8.6% 2.4% 5.6% 7.0% 5.9% 11.6% 2.8% 4.0% 6.1% 4.0% 5.0% 6.2% 5.4% 6.2%
Total Probationer Arrest 6 10 6 7 8 2 3 4 3 5 1 3 4 3 18 9 19 9 Pecent of Total Arrest 5.4% 10.8% 6.5% 6.1% 9.4% 3.2% 4.1% 5.9% 4.0% 6.7% 1.9% 3.7% 4.5% 3.7% 6.5% 4.3% 7.3% 4.3%
NOTE: Percentage change is not calculated when counts are fewer than 10 and the 5-year Average is rounded to the nearest whole number.
City of Kingston ArrestsPreliminary data as of 4/20/2018
Year to Date Comparisons5 Year
Average% Change5 year vs.
20182018
804

Current CurrentMonth Month
Apr 17 May 17 Jun 17 Jul 17 Aug 17 Sep 17 Oct 17 Nov 17 Dec 17 Jan 18 Feb 18 Mar 18 2017 2018 2013-17
Total Index Crimes 58 66 60 68 74 56 62 58 85 34 50 50 64 50 -21.9% 174 134 -23.0% 191 134 -29.7%
Violent Crimes 8 12 8 14 5 8 6 9 10 6 7 8 4 8 23 21 -8.7% 25 21 -16.7%Murder 0 0 0 0 1 1 0 0 0 0 0 0 0 0 0 0 0 0 Rape* 0 1 0 2 1 0 1 1 3 1 1 2 1 2 2 4 1 4 N/ARobbery 1 5 4 6 2 3 2 6 1 1 4 1 1 1 7 6 7 6 Aggravated Assault 7 6 4 6 1 4 3 2 6 4 2 5 2 5 14 11 -21.4% 16 11 -32.9%
Property Crimes 50 54 52 54 69 48 56 49 75 28 43 42 60 42 -30.0% 151 113 -25.2% 165 113 -31.7%Burglary 7 2 5 5 13 5 7 6 5 5 8 2 6 2 20 15 -25.0% 30 15 -50.3%Larceny 43 49 46 48 53 43 49 42 69 22 34 38 54 38 -29.6% 130 94 -27.7% 130 94 -27.9%Motor Vehicle Theft 0 3 1 1 3 0 0 1 1 1 1 2 0 2 1 4 5 4
5 Year % Change 10 Year % Change % Change Average 5 Year Avg. Average 10 Year Avg.
2008 2009 2010 2011 2012 2013 2014 2015* 2016* 2017* 2016-17 2012-16 vs. 2017 2007-16 vs. 2017
Total Index Crimes 1,193 1,179 1,321 1,198 1,175 966 953 796 787 761 -3.3% 935 -18.6% 1,070 -28.9%
Violent Crimes 177 155 150 191 227 114 125 113 122 103 -15.6% 140 -26.5% 157 -34.3%Murder 5 1 1 2 2 1 1 0 1 2 1 2 Rape* 14 8 7 12 14 6 3 11 9 11 N/A N/A N/A N/ARobbery 75 57 63 67 94 47 45 34 43 37 -14.0% 53 -29.7% 62 -40.3%Aggravated Assault 83 89 79 110 117 60 76 68 69 53 -23.2% 78 -32.1% 84 -36.6%
Property Crimes 1,016 1,024 1,171 1,007 948 852 828 683 665 658 -1.1% 795 -17.3% 914 -28.0%Burglary 216 204 194 188 206 136 162 121 105 75 -28.6% 146 -48.6% 175 -57.1%Larceny 755 794 949 792 723 683 644 540 539 572 6.1% 626 -8.6% 711 -19.5%Motor Vehicle Theft 45 26 28 27 19 33 22 22 21 11 -47.6% 23 -53.0% 28 -60.6%
*PLEASE SEE Definitions Page for Reporting Changes to the Index Crime of Rape effective March 2016, which also impacts violent and Index crime totals.
NOTE: Percentage change is not calculated when counts are fewer than 10 and the 5-year and 10-year Averages are rounded to the nearest whole number.
As of 04/17/2018Middletown City Police Department (UCR)
Index Crimes
Year to Date Comparisons
% Change 2017-182017 2018
% Change From Month in Previous Year
5 Year Average
% Change5 Year Avg.
vs. 20182018
900

Current CurrentMonth Month % Change
Apr 17 May 17 Jun 17 Jul 17 Aug 17 Sep 17 Oct 17 Nov 17 Dec 17 Jan 18 Feb 18 Mar 18 2017 2018 2017 2018 2017-18 2013-17
Violent Crimes 8 12 8 14 5 8 6 9 10 6 7 8 4 8 23 21 -8.7% 25 21 -16.7%Firearm Related 1 6 1 3 1 0 0 1 0 0 4 0 1 0 8 4 5 4 Percent Firearm 12.5% 50.0% 12.5% 21.4% 20.0% 0.0% 0.0% 11.1% 0.0% 0.0% 57.1% 0.0% 25.0% 0.0% 34.8% 19.0% 19.0% 19.0%
Murder 0 0 0 0 1 1 0 0 0 0 0 0 0 0 0 0 0 0 Firearm Related 0 0 0 0 1 0 0 0 0 0 0 0 0 0 0 0 0 0 Percent Firearm 100.0% 0.0% 0.0%
Rape* 0 1 0 2 1 0 1 1 3 1 1 2 1 2 2 4 N/A 4 N/AFirearm Related 0 0 0 0 0 0 0 0 0 0 0 0 0 0 0 0 N/A 0 N/APercent Firearm 0.0% 0.0% 0.0% 0.0% 0.0% 0.0% 0.0% 0.0% 0.0% 0.0% 0.0% 0.0% 0.0% N/A 0.0% N/A
Robbery 1 5 4 6 2 3 2 6 1 1 4 1 1 1 7 6 7 6 Firearm Related 0 4 1 1 0 0 0 1 0 0 2 0 1 0 4 2 2 2 Percent Firearm 0.0% 80.0% 25.0% 16.7% 0.0% 0.0% 0.0% 16.7% 0.0% 0.0% 50.0% 0.0% 100.0% 0.0% 57.1% 33.3% 22.2% 33.3%
Aggravated Assault 7 6 4 6 1 4 3 2 6 4 2 5 2 5 14 11 -21.4% 16 11 -32.9%Firearm Related 1 2 0 2 0 0 0 0 0 0 2 0 0 0 4 2 3 2 Percent Firearm 14.3% 33.3% 0.0% 33.3% 0.0% 0.0% 0.0% 0.0% 0.0% 0.0% 100.0% 0.0% 0.0% 0.0% 28.6% 18.2% 19.5% 18.2%
5 Year % Change 10 Year % Change % Change Average 5 Year Avg. Average 10 Year Avg.
2008 2009 2010 2011 2012 2013 2014 2015* 2016* 2017* 2016-17 2012-16 vs. 2017 2007-16 vs. 2017
Violent Crimes 177 155 150 191 227 114 125 113 122 103 -15.6% 140 -26.5% 157 -34.3%Firearm Related 22 19 18 32 29 13 15 13 28 21 -25.0% 20 7.1% 21 1.0%Percent Firearm 12.4% 12.3% 12.0% 16.8% 12.8% 11.4% 12.0% 11.5% 23.0% 20.4% 14.1% 13.4%
Murder 5 1 1 2 2 1 1 0 1 2 1 2 Firearm Related 2 0 0 1 1 0 0 0 0 1 0 0 Percent Firearm 40.0% 0.0% 0.0% 50.0% 50.0% 0.0% 0.0% 0.0% 0.0% 50.0% 10.0% 14.0%
Rape* 14 8 7 12 14 6 3 11 9 11 N/A N/A N/A N/AFirearm Related 0 0 0 0 0 0 0 1 1 0 N/A N/A N/A N/APercent Firearm 0.0% 0.0% 0.0% 0.0% 0.0% 0.0% 0.0% 9.1% 11.1% 0.0% N/A N/A N/A N/A
Robbery 75 57 63 67 94 47 45 34 43 37 -14.0% 53 -29.7% 62 -40.3%Firearm Related 14 15 13 19 14 9 7 3 9 11 8 11 -3.5%Percent Firearm 18.7% 26.3% 20.6% 28.4% 14.9% 19.1% 15.6% 8.8% 20.9% 29.7% 15.9% 18.5%
Aggravated Assault 83 89 79 110 117 60 76 68 69 53 -23.2% 78 -32.1% 84 -36.6%Firearm Related 6 4 5 12 14 4 8 9 18 9 11 9 Percent Firearm 7.2% 4.5% 6.3% 10.9% 12.0% 6.7% 10.5% 13.2% 26.1% 17.0% 13.7% 10.7%
*PLEASE SEE Definitions Page for Reporting Changes to the Index Crime of Rape effective March 2016, which also impacts violent crime totals.
NOTE: Percentage change is not calculated when counts are fewer than 10 and the 5-year and 10-year Averages are rounded to the nearest whole number.
Violent Crimes by FirearmAs of 04/17/2018
Middletown City Police Department (UCR)
% Change From Month in
Previous Year
5 Year Average
% Change5 Year Avg. vs.
20182018
Year to Date Comparisons
901

Current CurrentMonth Month % Change
Apr 17 May 17 Jun 17 Jul 17 Aug 17 Sep 17 Oct 17 Nov 17 Dec 17 Jan 18 Feb 18 Mar 18 2017 2018 2017 2018 2017-18 2013-17
Shooting Incidents Involving Injury 0 0 0 0 1 0 0 0 0 0 0 0 0 0 1 0 0 0
Shooting Victims (Persons Hit) 0 0 0 0 0 0 0 0 0 0 0 0 0 0 1 0 0 0
Individuals Killed by Gun Violence 0 0 0 0 1 0 0 0 0 0 0 0 0 0 0 0 0 0
5 Year % Change % Change Average 5 Year Avg.
Totals 2009 2010 2011 2012 2013 2014 2015 2016 2017 2016-17 2012-16 vs. 2017
Shooting Incidents Involving Injury 1 4 3 6 0 0 0 3 2 2
Shooting Victims (Persons Hit) 1 4 4 7 0 0 0 5 1 2
Individuals Killed by Gun Violence 0 0 1 1 0 0 0 0 1 0
NOTE: Percentage change is not calculated when counts are fewer than 10 and the 5-year Average is rounded to the nearest whole number.
Firearm Activity As of 04/06/2018
Middletown City Police Department
Year to Date Comparisons
% Change From Month in Previous Year
5 Year Average
% Change5 Year Avg.
vs. 20182018
902
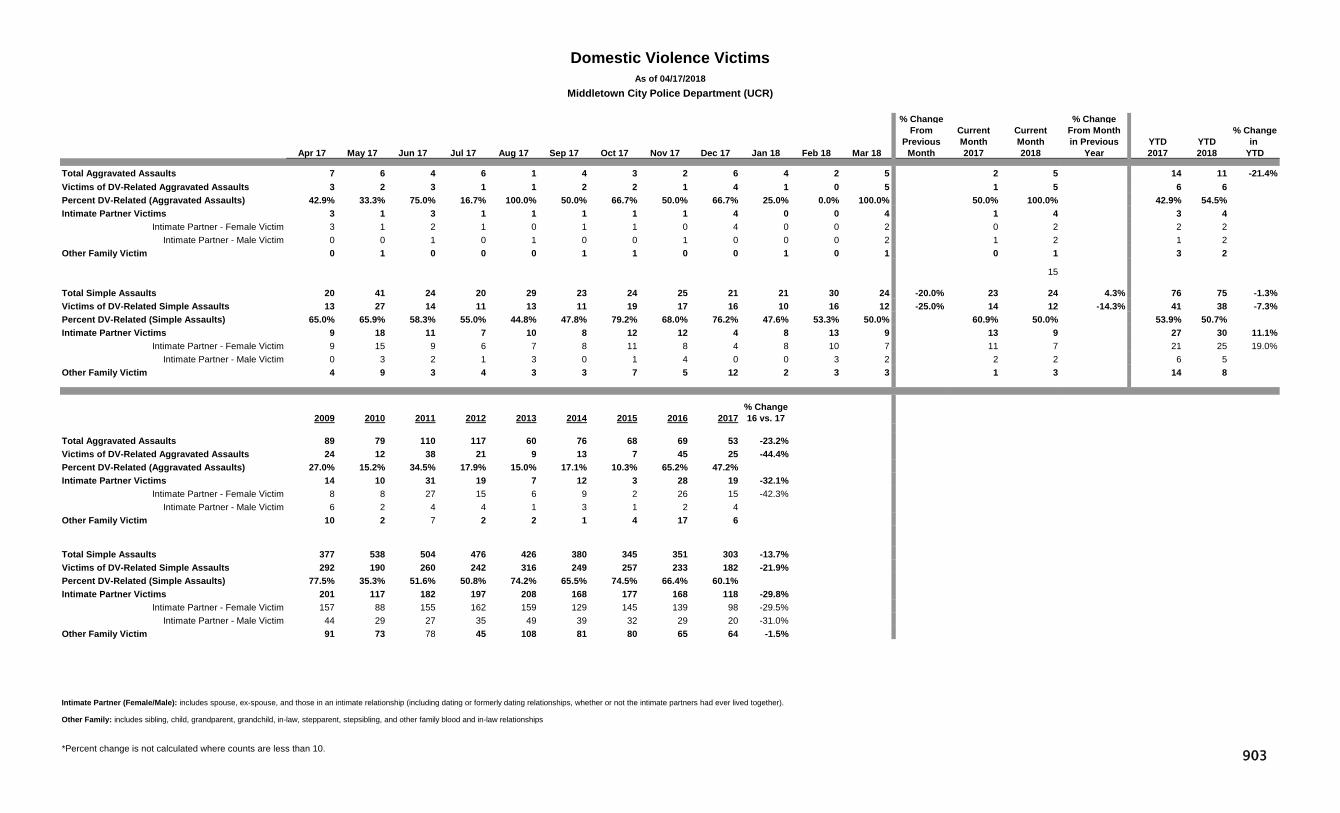
% Change % ChangeFrom Current Current From Month % Change
Previous Month Month in Previous YTD YTD in Apr 17 May 17 Jun 17 Jul 17 Aug 17 Sep 17 Oct 17 Nov 17 Dec 17 Jan 18 Feb 18 Mar 18 Month 2017 2018 Year 2017 2018 YTD
Total Aggravated Assaults 7 6 4 6 1 4 3 2 6 4 2 5 2 5 14 11 -21.4%Victims of DV-Related Aggravated Assaults 3 2 3 1 1 2 2 1 4 1 0 5 1 5 6 6 Percent DV-Related (Aggravated Assaults) 42.9% 33.3% 75.0% 16.7% 100.0% 50.0% 66.7% 50.0% 66.7% 25.0% 0.0% 100.0% 50.0% 100.0% 42.9% 54.5% Intimate Partner Victims 3 1 3 1 1 1 1 1 4 0 0 4 1 4 3 4
Intimate Partner - Female Victim 3 1 2 1 0 1 1 0 4 0 0 2 0 2 2 2 Intimate Partner - Male Victim 0 0 1 0 1 0 0 1 0 0 0 2 1 2 1 2
Other Family Victim 0 1 0 0 0 1 1 0 0 1 0 1 0 1 3 2
15
Total Simple Assaults 20 41 24 20 29 23 24 25 21 21 30 24 -20.0% 23 24 4.3% 76 75 -1.3%Victims of DV-Related Simple Assaults 13 27 14 11 13 11 19 17 16 10 16 12 -25.0% 14 12 -14.3% 41 38 -7.3%Percent DV-Related (Simple Assaults) 65.0% 65.9% 58.3% 55.0% 44.8% 47.8% 79.2% 68.0% 76.2% 47.6% 53.3% 50.0% 60.9% 50.0% 53.9% 50.7% Intimate Partner Victims 9 18 11 7 10 8 12 12 4 8 13 9 13 9 27 30 11.1%
Intimate Partner - Female Victim 9 15 9 6 7 8 11 8 4 8 10 7 11 7 21 25 19.0%Intimate Partner - Male Victim 0 3 2 1 3 0 1 4 0 0 3 2 2 2 6 5
Other Family Victim 4 9 3 4 3 3 7 5 12 2 3 3 1 3 14 8
% Change2009 2010 2011 2012 2013 2014 2015 2016 2017 16 vs. 17
Total Aggravated Assaults 89 79 110 117 60 76 68 69 53 -23.2%Victims of DV-Related Aggravated Assaults 24 12 38 21 9 13 7 45 25 -44.4%Percent DV-Related (Aggravated Assaults) 27.0% 15.2% 34.5% 17.9% 15.0% 17.1% 10.3% 65.2% 47.2% Intimate Partner Victims 14 10 31 19 7 12 3 28 19 -32.1%
Intimate Partner - Female Victim 8 8 27 15 6 9 2 26 15 -42.3%Intimate Partner - Male Victim 6 2 4 4 1 3 1 2 4
Other Family Victim 10 2 7 2 2 1 4 17 6
Total Simple Assaults 377 538 504 476 426 380 345 351 303 -13.7%Victims of DV-Related Simple Assaults 292 190 260 242 316 249 257 233 182 -21.9%Percent DV-Related (Simple Assaults) 77.5% 35.3% 51.6% 50.8% 74.2% 65.5% 74.5% 66.4% 60.1% Intimate Partner Victims 201 117 182 197 208 168 177 168 118 -29.8%
Intimate Partner - Female Victim 157 88 155 162 159 129 145 139 98 -29.5%Intimate Partner - Male Victim 44 29 27 35 49 39 32 29 20 -31.0%
Other Family Victim 91 73 78 45 108 81 80 65 64 -1.5%
Intimate Partner (Female/Male): includes spouse, ex-spouse, and those in an intimate relationship (including dating or formerly dating relationships, whether or not the intimate partners had ever lived together).
Other Family: includes sibling, child, grandparent, grandchild, in-law, stepparent, stepsibling, and other family blood and in-law relationships
*Percent change is not calculated where counts are less than 10.
Domestic Violence VictimsAs of 04/17/2018
Middletown City Police Department (UCR)
903

% ChangeCurrent Current From MonthMonth Month in Previous % Change
Apr 17 May 17 Jun 17 Jul 17 Aug 17 Sep 17 Oct 17 Nov 17 Dec 17 Jan 18 Feb 18 Mar 18 2017 2018 Year 2017 2018 2017-18 2013-17
Felony Arrests within CityVFO 7 3 4 8 6 6 3 13 8 4 3 9 17 9 35 16 -54.3% 21 16 -23.8%Drug 9 6 4 5 6 8 5 7 8 6 13 13 12 13 8.3% 30 32 6.7% 31 32 2.6%VTL 1 3 2 1 0 1 3 2 2 2 4 4 2 4 10 10 0.0% 7 10
Other 6 9 12 8 14 8 8 9 4 7 6 14 6 14 31 27 -12.9% 38 27 -28.2%
Total Felony 23 21 22 22 26 23 19 31 22 19 26 40 37 40 8.1% 106 85 -19.8% 97 85 -12.0%
Misdemeanor Arrests within CityVTL 6 8 14 9 12 3 6 13 6 13 9 18 14 18 28.6% 40 40 0.0% 37 40 9.3%
Drug 20 27 24 12 28 16 31 21 7 26 26 22 22 22 0.0% 69 74 7.2% 68 74 8.5%Other 32 37 51 37 46 29 42 35 36 20 32 30 43 30 -30.2% 114 82 -28.1% 139 82 -40.8%
Total Misdemeanor 58 72 89 58 86 48 79 69 49 59 67 70 79 70 -11.4% 223 196 -12.1% 243 196 -19.5%
Total Arrest 81 93 111 80 112 71 98 100 71 78 93 110 116 110 -5.2% 329 281 -14.6% 340 281 -17.4%
Parolee Arrests within CityVFO 0 0 0 1 0 1 0 0 1 0 0 0 0 0 0 0 0 0 Drug 1 2 0 0 1 2 1 2 0 0 0 0 1 0 1 0 2 0 VTL 0 0 0 0 0 0 0 0 0 0 0 0 0 0 1 0 1 0
Other 2 0 0 1 0 0 0 0 0 0 0 0 0 0 1 0 1 0
Total Parolee Felonies 3 2 0 2 1 3 1 2 1 0 0 0 1 0 3 0 4 0 Percent of Total Felony 13.0% 9.5% 0.0% 9.1% 3.8% 13.0% 5.3% 6.5% 4.5% 0.0% 0.0% 0.0% 2.7% 0.0% 2.8% 0.0% 4.1% 0.0%
Total Parolee Misdemeanors 1 3 3 0 2 2 6 1 1 1 2 0 4 0 7 3 6 3 Percent of Total Misdemeanor 1.7% 4.2% 3.4% 0.0% 2.3% 4.2% 7.6% 1.4% 2.0% 1.7% 3.0% 0.0% 5.1% 0.0% 3.1% 1.5% 2.3% 1.5%
Total Parolee Arrest 4 5 3 2 3 5 7 3 2 1 2 0 5 0 10 3 10 3 Pecent of Total Arrest 4.9% 5.4% 2.7% 2.5% 2.7% 7.0% 7.1% 3.0% 2.8% 1.3% 2.2% 0.0% 4.3% 0.0% 3.0% 1.1% 2.8% 1.1%
Probationer Arrests within CityVFO 1 0 0 0 0 1 0 1 1 0 0 1 6 1 6 1 2 1 Drug 1 0 1 0 1 0 0 1 0 1 1 0 1 0 3 2 3 2 VTL 0 0 0 0 0 0 2 0 0 0 0 1 0 1 0 1 1 1
Other 1 0 1 0 3 0 1 0 1 0 0 3 1 3 5 3 7 3
Total Probationer Felonies 3 0 2 0 4 1 3 2 2 1 1 5 8 5 14 7 12 7 Percent of Total Felony 13.0% 0.0% 9.1% 0.0% 15.4% 4.3% 15.8% 6.5% 9.1% 5.3% 3.8% 12.5% 21.6% 12.5% 13.2% 8.2% 12.0% 8.2%
Total Probationer Misdemeanors 1 4 5 4 11 7 4 6 4 2 3 4 4 4 11 9 14 9 Percent of Total Misdemeanor 1.7% 5.6% 5.6% 6.9% 12.8% 14.6% 5.1% 8.7% 8.2% 3.4% 4.5% 5.7% 5.1% 5.7% 4.9% 4.6% 5.8% 4.6%
Total Probationer Arrest 4 4 7 4 15 8 7 8 6 3 4 9 12 9 25 16 -36.0% 26 16 -38.0%Pecent of Total Arrest 4.9% 4.3% 6.3% 5.0% 13.4% 11.3% 7.1% 8.0% 8.5% 3.8% 4.3% 8.2% 10.3% 8.2% 7.6% 5.7% 7.6% 5.7%
NOTE: Percentage change is not calculated when counts are fewer than 10 and the 5-year Average is rounded to the nearest whole number.
City of Middletown ArrestsPreliminary data as of 4/20/2018
Year to Date Comparisons5 Year
Average% Change5 year vs.
20182018
904
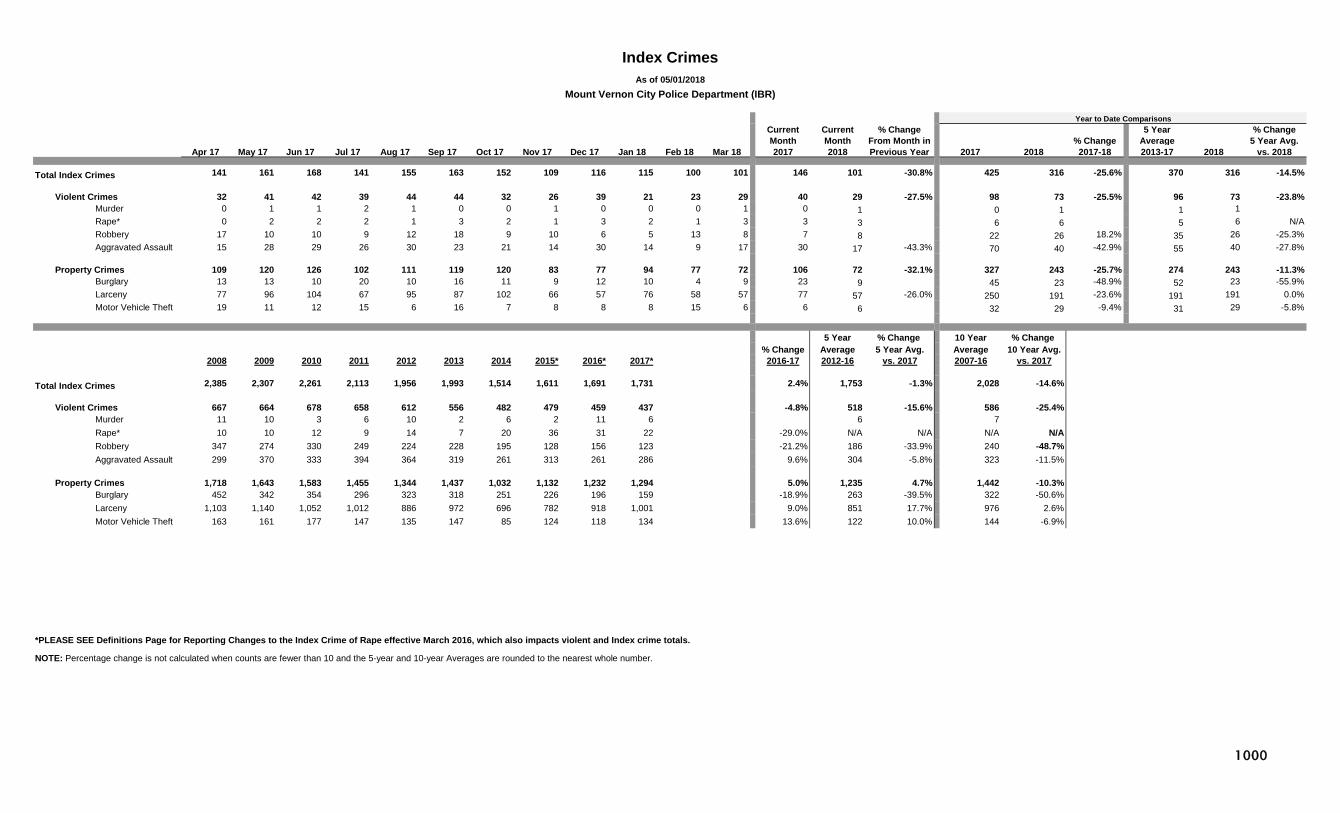
Current CurrentMonth Month
Apr 17 May 17 Jun 17 Jul 17 Aug 17 Sep 17 Oct 17 Nov 17 Dec 17 Jan 18 Feb 18 Mar 18 2017 2018 2013-17
Total Index Crimes 141 161 168 141 155 163 152 109 116 115 100 101 146 101 -30.8% 425 316 -25.6% 370 316 -14.5%
Violent Crimes 32 41 42 39 44 44 32 26 39 21 23 29 40 29 -27.5% 98 73 -25.5% 96 73 -23.8%Murder 0 1 1 2 1 0 0 1 0 0 0 1 0 1 0 1 1 1 Rape* 0 2 2 2 1 3 2 1 3 2 1 3 3 3 6 6 5 6 N/ARobbery 17 10 10 9 12 18 9 10 6 5 13 8 7 8 22 26 18.2% 35 26 -25.3%Aggravated Assault 15 28 29 26 30 23 21 14 30 14 9 17 30 17 -43.3% 70 40 -42.9% 55 40 -27.8%
Property Crimes 109 120 126 102 111 119 120 83 77 94 77 72 106 72 -32.1% 327 243 -25.7% 274 243 -11.3%Burglary 13 13 10 20 10 16 11 9 12 10 4 9 23 9 45 23 -48.9% 52 23 -55.9%Larceny 77 96 104 67 95 87 102 66 57 76 58 57 77 57 -26.0% 250 191 -23.6% 191 191 0.0%Motor Vehicle Theft 19 11 12 15 6 16 7 8 8 8 15 6 6 6 32 29 -9.4% 31 29 -5.8%
5 Year % Change 10 Year % Change % Change Average 5 Year Avg. Average 10 Year Avg.
2008 2009 2010 2011 2012 2013 2014 2015* 2016* 2017* 2016-17 2012-16 vs. 2017 2007-16 vs. 2017
Total Index Crimes 2,385 2,307 2,261 2,113 1,956 1,993 1,514 1,611 1,691 1,731 2.4% 1,753 -1.3% 2,028 -14.6%
Violent Crimes 667 664 678 658 612 556 482 479 459 437 -4.8% 518 -15.6% 586 -25.4%Murder 11 10 3 6 10 2 6 2 11 6 6 7 Rape* 10 10 12 9 14 7 20 36 31 22 -29.0% N/A N/A N/A N/ARobbery 347 274 330 249 224 228 195 128 156 123 -21.2% 186 -33.9% 240 -48.7%Aggravated Assault 299 370 333 394 364 319 261 313 261 286 9.6% 304 -5.8% 323 -11.5%
Property Crimes 1,718 1,643 1,583 1,455 1,344 1,437 1,032 1,132 1,232 1,294 5.0% 1,235 4.7% 1,442 -10.3%Burglary 452 342 354 296 323 318 251 226 196 159 -18.9% 263 -39.5% 322 -50.6%Larceny 1,103 1,140 1,052 1,012 886 972 696 782 918 1,001 9.0% 851 17.7% 976 2.6%Motor Vehicle Theft 163 161 177 147 135 147 85 124 118 134 13.6% 122 10.0% 144 -6.9%
*PLEASE SEE Definitions Page for Reporting Changes to the Index Crime of Rape effective March 2016, which also impacts violent and Index crime totals.
NOTE: Percentage change is not calculated when counts are fewer than 10 and the 5-year and 10-year Averages are rounded to the nearest whole number.
Mount Vernon City Police Department (IBR)As of 05/01/2018
Index Crimes
Year to Date Comparisons
% Change 2017-182017 2018
% Change From Month in Previous Year
5 Year Average
% Change5 Year Avg.
vs. 20182018
1000

Current CurrentMonth Month % Change
Apr 17 May 17 Jun 17 Jul 17 Aug 17 Sep 17 Oct 17 Nov 17 Dec 17 Jan 18 Feb 18 Mar 18 2017 2018 2017 2018 2017-18 2013-17
Violent Crimes 32 41 42 39 44 44 32 26 39 21 23 29 40 29 -27.5% 98 73 -25.5% 96 73 -23.8%Firearm Related 13 21 5 6 9 11 4 6 2 7 7 5 5 5 17 19 11.8% 20 19 -5.0%Percent Firearm 40.6% 51.2% 11.9% 15.4% 20.5% 25.0% 12.5% 23.1% 5.1% 33.3% 30.4% 17.2% 12.5% 17.2% 17.3% 26.0% 20.9% 26.0%
Murder 0 1 1 2 1 0 0 1 0 0 0 1 0 1 0 1 1 1 Firearm Related 0 1 0 1 1 0 0 1 0 0 0 1 0 1 0 1 0 1 Percent Firearm 100.0% 0.0% 50.0% 100.0% 100.0% 100.0% 100.0% 100.0% 66.7% 100.0%
Rape* 0 2 2 2 1 3 2 1 3 2 1 3 3 3 6 6 N/A 6 N/AFirearm Related 0 0 0 0 1 0 0 0 0 0 0 0 0 0 0 0 N/A 0 N/APercent Firearm 0.0% 0.0% 0.0% 100.0% 0.0% 0.0% 0.0% 0.0% 0.0% 0.0% 0.0% 0.0% 0.0% 0.0% 0.0% N/A 0.0% N/A
Robbery 17 10 10 9 12 18 9 10 6 5 13 8 7 8 22 26 18.2% 35 26 -25.3%Firearm Related 7 2 3 0 3 7 1 4 2 4 5 1 1 1 5 10 10 10 0.0%Percent Firearm 41.2% 20.0% 30.0% 0.0% 25.0% 38.9% 11.1% 40.0% 33.3% 80.0% 38.5% 12.5% 14.3% 12.5% 22.7% 38.5% 28.7% 38.5%
Aggravated Assault 15 28 29 26 30 23 21 14 30 14 9 17 30 17 -43.3% 70 40 -42.9% 55 40 -27.8%Firearm Related 6 18 2 5 4 4 3 1 0 3 2 3 4 3 12 8 10 8 Percent Firearm 40.0% 64.3% 6.9% 19.2% 13.3% 17.4% 14.3% 7.1% 0.0% 21.4% 22.2% 17.6% 13.3% 17.6% 17.1% 20.0% 17.3% 20.0%
5 Year % Change 10 Year % Change % Change Average 5 Year Avg. Average 10 Year Avg.
2008 2009 2010 2011 2012 2013 2014 2015* 2016* 2017* 2016-17 2012-16 vs. 2017 2007-16 vs. 2017
Violent Crimes 667 664 678 658 612 556 482 479 459 437 -4.8% 518 -15.6% 585.5 -25.4%Firearm Related 160 104 141 136 155 130 94 95 110 94 -14.5% 117 -19.5% 126 -25.2%Percent Firearm 24.0% 15.7% 20.8% 20.7% 25.3% 23.4% 19.5% 19.8% 24.0% 21.5% 22.4% 21.5%
Murder 11 10 3 6 10 2 6 2 11 6 6 7 Firearm Related 8 5 3 3 8 2 4 2 8 4 5 5 Percent Firearm 72.7% 50.0% 100.0% 50.0% 80.0% 100.0% 66.7% 100.0% 72.7% 66.7% 83.9% 79.2%
Rape* 10 10 12 9 14 7 20 36 31 22 -29.0% N/A N/A N/A N/AFirearm Related 0 0 0 0 1 0 1 0 0 1 N/A N/A N/A N/APercent Firearm 0.0% 0.0% 0.0% 0.0% 7.1% 0.0% 5.0% 0.0% 0.0% 4.5% N/A N/A N/A N/A
Robbery 347 274 330 249 224 228 195 128 156 123 -21.2% 186 -33.9% 240 -48.7%
Firearm Related 109 63 93 75 69 74 61 30 52 34 -34.6% 57 -40.6% 69 -51.0%Percent Firearm 31.4% 23.0% 28.2% 30.1% 30.8% 32.5% 31.3% 23.4% 33.3% 27.6% 30.3% 29.0%
Aggravated Assault 299 370 333 394 364 319 261 313 261 286 9.6% 304 -5.8% 323 -11.5%Firearm Related 43 36 45 58 77 54 28 63 50 55 10.0% 54 1.1% 51 7.8%Percent Firearm 14.4% 9.7% 13.5% 14.7% 21.2% 16.9% 10.7% 20.1% 19.2% 19.2% 17.6% 15.8%
*PLEASE SEE Definitions Page for Reporting Changes to the Index Crime of Rape effective March 2016, which also impacts violent crime totals.
NOTE: Percentage change is not calculated when counts are fewer than 10 and the 5-year and 10-year Averages are rounded to the nearest whole number.
Violent Crimes by FirearmAs of 05/01/2018
Mount Vernon City Police Department (IBR)
% Change From Month in
Previous Year
5 Year Average
% Change5 Year Avg. vs.
20182018
Year to Date Comparisons
1001

Current CurrentMonth Month % Change
Apr 17 May 17 Jun 17 Jul 17 Aug 17 Sep 17 Oct 17 Nov 17 Dec 17 Jan 18 Feb 18 Mar 18 2017 2018 2017 2018 2017-18 2013-17
Shooting Incidents Involving Injury 2 5 0 1 4 1 3 2 1 0 1 1 3 1 5 2 3 2
Shooting Victims (Persons Hit) 2 5 0 1 3 1 3 1 1 0 1 2 3 2 5 3 3 3
Individuals Killed by Gun Violence 0 1 0 1 1 0 0 1 0 0 0 1 0 1 0 1 0 1
5 Year % Change % Change Average 5 Year Avg.
Totals 2009 2010 2011 2012 2013 2014 2015 2016 2017 2016-17 2012-16 vs. 2017
Shooting Incidents Involving Injury 15 15 25 31 12 16 22 25 24 -4.0% 21 13.2%
Shooting Victims (Persons Hit) 16 18 27 32 14 17 30 38 22 -42.1% 26 -16.0%
Individuals Killed by Gun Violence 5 3 3 8 2 4 2 8 4 5
NOTE: Percentage change is not calculated when counts are fewer than 10 and the 5-year Average is rounded to the nearest whole number.
Firearm Activity As of 04/06/2018
Mount Vernon City Police Department
Year to Date Comparisons
% Change From Month in Previous Year
5 Year Average
% Change5 Year Avg.
vs. 20182018
1002
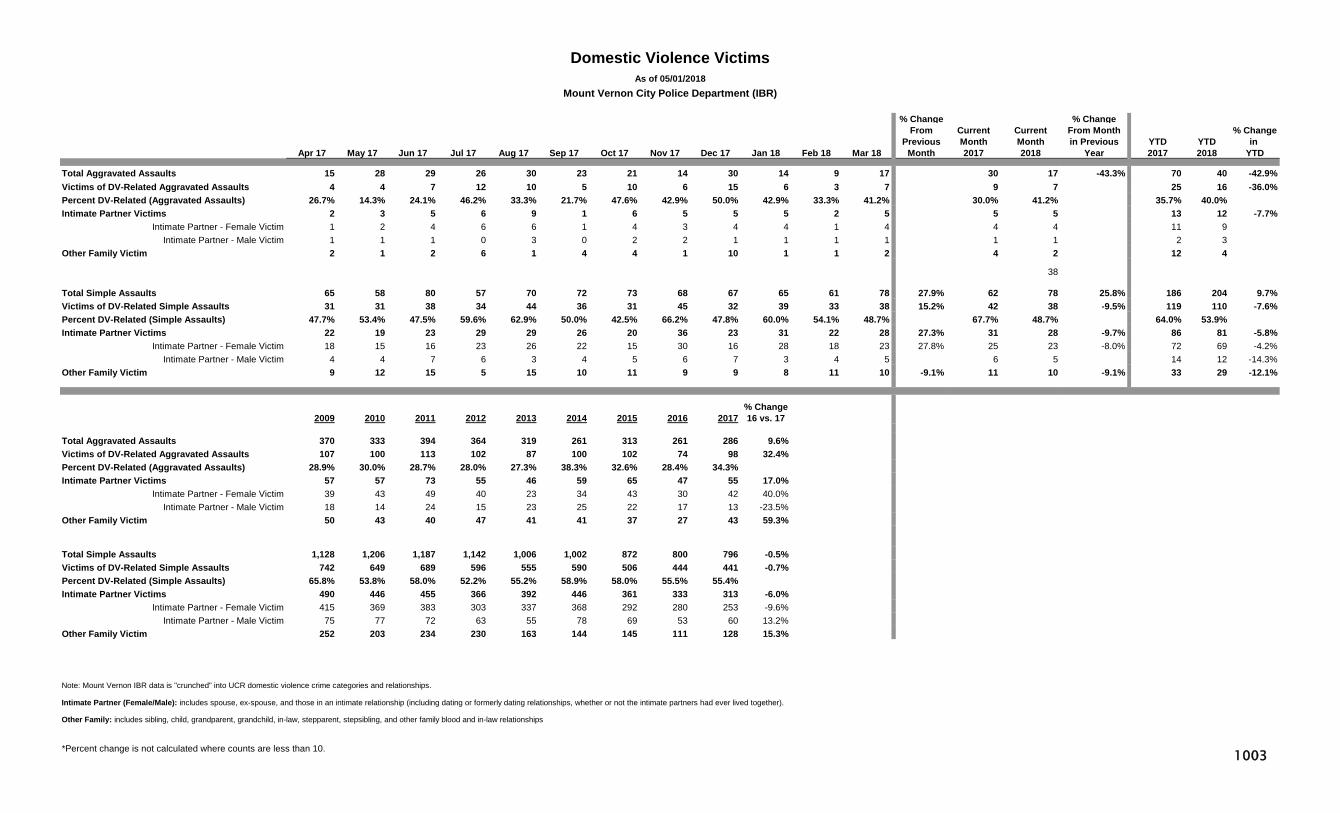
% Change % ChangeFrom Current Current From Month % Change
Previous Month Month in Previous YTD YTD in Apr 17 May 17 Jun 17 Jul 17 Aug 17 Sep 17 Oct 17 Nov 17 Dec 17 Jan 18 Feb 18 Mar 18 Month 2017 2018 Year 2017 2018 YTD
Total Aggravated Assaults 15 28 29 26 30 23 21 14 30 14 9 17 30 17 -43.3% 70 40 -42.9%Victims of DV-Related Aggravated Assaults 4 4 7 12 10 5 10 6 15 6 3 7 9 7 25 16 -36.0%Percent DV-Related (Aggravated Assaults) 26.7% 14.3% 24.1% 46.2% 33.3% 21.7% 47.6% 42.9% 50.0% 42.9% 33.3% 41.2% 30.0% 41.2% 35.7% 40.0% Intimate Partner Victims 2 3 5 6 9 1 6 5 5 5 2 5 5 5 13 12 -7.7%
Intimate Partner - Female Victim 1 2 4 6 6 1 4 3 4 4 1 4 4 4 11 9 Intimate Partner - Male Victim 1 1 1 0 3 0 2 2 1 1 1 1 1 1 2 3
Other Family Victim 2 1 2 6 1 4 4 1 10 1 1 2 4 2 12 4
38
Total Simple Assaults 65 58 80 57 70 72 73 68 67 65 61 78 27.9% 62 78 25.8% 186 204 9.7%Victims of DV-Related Simple Assaults 31 31 38 34 44 36 31 45 32 39 33 38 15.2% 42 38 -9.5% 119 110 -7.6%Percent DV-Related (Simple Assaults) 47.7% 53.4% 47.5% 59.6% 62.9% 50.0% 42.5% 66.2% 47.8% 60.0% 54.1% 48.7% 67.7% 48.7% 64.0% 53.9% Intimate Partner Victims 22 19 23 29 29 26 20 36 23 31 22 28 27.3% 31 28 -9.7% 86 81 -5.8%
Intimate Partner - Female Victim 18 15 16 23 26 22 15 30 16 28 18 23 27.8% 25 23 -8.0% 72 69 -4.2%Intimate Partner - Male Victim 4 4 7 6 3 4 5 6 7 3 4 5 6 5 14 12 -14.3%
Other Family Victim 9 12 15 5 15 10 11 9 9 8 11 10 -9.1% 11 10 -9.1% 33 29 -12.1%
% Change2009 2010 2011 2012 2013 2014 2015 2016 2017 16 vs. 17
Total Aggravated Assaults 370 333 394 364 319 261 313 261 286 9.6%Victims of DV-Related Aggravated Assaults 107 100 113 102 87 100 102 74 98 32.4%Percent DV-Related (Aggravated Assaults) 28.9% 30.0% 28.7% 28.0% 27.3% 38.3% 32.6% 28.4% 34.3% Intimate Partner Victims 57 57 73 55 46 59 65 47 55 17.0%
Intimate Partner - Female Victim 39 43 49 40 23 34 43 30 42 40.0%Intimate Partner - Male Victim 18 14 24 15 23 25 22 17 13 -23.5%
Other Family Victim 50 43 40 47 41 41 37 27 43 59.3%
Total Simple Assaults 1,128 1,206 1,187 1,142 1,006 1,002 872 800 796 -0.5%Victims of DV-Related Simple Assaults 742 649 689 596 555 590 506 444 441 -0.7%Percent DV-Related (Simple Assaults) 65.8% 53.8% 58.0% 52.2% 55.2% 58.9% 58.0% 55.5% 55.4% Intimate Partner Victims 490 446 455 366 392 446 361 333 313 -6.0%
Intimate Partner - Female Victim 415 369 383 303 337 368 292 280 253 -9.6%Intimate Partner - Male Victim 75 77 72 63 55 78 69 53 60 13.2%
Other Family Victim 252 203 234 230 163 144 145 111 128 15.3%
Note: Mount Vernon IBR data is "crunched" into UCR domestic violence crime categories and relationships.
Intimate Partner (Female/Male): includes spouse, ex-spouse, and those in an intimate relationship (including dating or formerly dating relationships, whether or not the intimate partners had ever lived together).
Other Family: includes sibling, child, grandparent, grandchild, in-law, stepparent, stepsibling, and other family blood and in-law relationships
*Percent change is not calculated where counts are less than 10.
Domestic Violence VictimsAs of 05/01/2018
Mount Vernon City Police Department (IBR)
1003

% ChangeCurrent Current From MonthMonth Month in Previous % Change
Apr 17 May 17 Jun 17 Jul 17 Aug 17 Sep 17 Oct 17 Nov 17 Dec 17 Jan 18 Feb 18 Mar 18 2017 2018 Year 2017 2018 2017-18 2013-17
Felony Arrests within CityVFO 13 16 15 20 17 7 12 9 10 11 15 12 15 12 -20.0% 43 38 -11.6% 38 38 -1.0%Drug 5 2 2 6 4 5 4 6 3 5 6 6 7 6 17 17 0.0% 31 17 -45.5%VTL 0 0 3 0 1 1 3 2 0 1 3 2 1 2 2 6 9 6
Other 13 20 18 15 17 21 20 15 14 13 13 13 23 13 -43.5% 50 39 -22.0% 65 39 -39.6%
Total Felony 31 38 38 41 39 34 39 32 27 30 37 33 46 33 -28.3% 112 100 -10.7% 144 100 -30.4%
Misdemeanor Arrests within CityVTL 10 7 3 9 3 1 11 2 2 3 6 9 10 9 26 18 -30.8% 22 18 -17.4%
Drug 27 15 14 6 22 12 15 9 11 28 40 23 23 23 0.0% 47 91 93.6% 65 91 40.0%Other 79 67 84 49 66 63 57 56 59 57 60 47 72 47 -34.7% 204 164 -19.6% 199 164 -17.4%
Total Misdemeanor 116 89 101 64 91 76 83 67 72 88 106 79 105 79 -24.8% 277 273 -1.4% 285 273 -4.3%
Total Arrest 147 127 139 105 130 110 122 99 99 118 143 112 151 112 -25.8% 389 373 -4.1% 429 373 -13.1%
Parolee Arrests within CityVFO 0 4 2 1 0 0 2 0 0 0 2 1 0 1 2 3 2 3 Drug 0 1 1 1 0 1 0 1 0 4 1 0 0 0 0 5 1 5 VTL 0 0 0 0 0 0 0 0 0 0 0 0 0 0 0 0 0 0
Other 0 0 1 2 0 0 0 1 0 1 0 0 2 0 3 1 3 1
Total Parolee Felonies 0 5 4 4 0 1 2 2 0 5 3 1 2 1 5 9 6 9 Percent of Total Felony 0.0% 13.2% 10.5% 9.8% 0.0% 2.9% 5.1% 6.3% 0.0% 16.7% 8.1% 3.0% 4.3% 3.0% 4.5% 9.0% 4.2% 9.0%
Total Parolee Misdemeanors 4 1 3 4 2 3 2 1 3 4 1 3 1 3 6 8 6 8 Percent of Total Misdemeanor 3.4% 1.1% 3.0% 6.3% 2.2% 3.9% 2.4% 1.5% 4.2% 4.5% 0.9% 3.8% 1.0% 3.8% 2.2% 2.9% 2.0% 2.9%
Total Parolee Arrest 4 6 7 8 2 4 4 3 3 9 4 4 3 4 11 17 54.5% 12 17 44.1%Pecent of Total Arrest 2.7% 4.7% 5.0% 7.6% 1.5% 3.6% 3.3% 3.0% 3.0% 7.6% 2.8% 3.6% 2.0% 3.6% 2.8% 4.6% 2.8% 4.6%
Probationer Arrests within CityVFO 1 2 1 1 2 1 1 2 2 1 1 1 3 1 6 3 4 3 Drug 1 0 0 0 0 0 1 1 1 1 1 1 0 1 4 3 3 3 VTL 0 0 1 0 0 0 1 0 0 1 0 0 0 0 1 1 0 1
Other 1 0 4 0 3 0 2 1 0 1 1 3 1 3 7 5 6 5
Total Probationer Felonies 3 2 6 1 5 1 5 4 3 4 3 5 4 5 18 12 -33.3% 13 12 -4.8%Percent of Total Felony 9.7% 5.3% 15.8% 2.4% 12.8% 2.9% 12.8% 12.5% 11.1% 13.3% 8.1% 15.2% 8.7% 15.2% 16.1% 12.0% 8.8% 12.0%
Total Probationer Misdemeanors 9 6 9 3 10 2 8 6 1 6 2 9 9 9 34 17 -50.0% 24 17 -29.8%Percent of Total Misdemeanor 7.8% 6.7% 8.9% 4.7% 11.0% 2.6% 9.6% 9.0% 1.4% 6.8% 1.9% 11.4% 8.6% 11.4% 12.3% 6.2% 8.5% 6.2%
Total Probationer Arrest 12 8 15 4 15 3 13 10 4 10 5 14 13 14 7.7% 52 29 -44.2% 37 29 -21.2%Pecent of Total Arrest 8.2% 6.3% 10.8% 3.8% 11.5% 2.7% 10.7% 10.1% 4.0% 8.5% 3.5% 12.5% 8.6% 12.5% 13.4% 7.8% 8.6% 7.8%
NOTE: Percentage change is not calculated when counts are fewer than 10 and the 5-year Average is rounded to the nearest whole number.
City of Mount Vernon ArrestsPreliminary data as of 4/20/2018
Year to Date Comparisons5 Year
Average% Change5 year vs.
20182018
1004

Current CurrentMonth Month
Apr 17 May 17 Jun 17 Jul 17 Aug 17 Sep 17 Oct 17 Nov 17 Dec 17 Jan 18 Feb 18 Mar 18 2017 2018 2013-17
Total Index Crimes 836 933 958 1,008 1,071 1,063 910 935 1,045 857 781 831 804 831 3.4% 2,457 2,469 0.5% 2,814 2,469 -12.2%
Violent Crimes 66 101 112 112 92 82 95 102 92 90 68 89 102 89 -12.7% 259 247 -4.6% 296 247 -16.7%Murder 0 0 0 0 1 2 3 1 0 0 0 0 3 0 3 0 3 0 Rape* 2 3 6 2 3 1 1 3 1 1 1 1 3 1 6 3 13 3 N/ARobbery 25 34 33 33 32 31 38 38 46 45 30 31 36 31 -13.9% 106 106 0.0% 128 106 -17.3%Aggravated Assault 39 64 73 77 56 48 53 60 45 44 37 57 60 57 -5.0% 144 138 -4.2% 152 138 -9.4%
Property Crimes 770 832 846 896 979 981 815 833 953 767 713 742 702 742 5.7% 2,198 2,222 1.1% 2,517 2,222 -11.7%Burglary 59 75 80 76 79 72 83 75 77 62 58 51 57 51 -10.5% 212 171 -19.3% 321 171 -46.7%Larceny 677 724 725 781 861 861 689 734 836 676 621 660 615 660 7.3% 1,880 1,957 4.1% 2,083 1,957 -6.1%Motor Vehicle Theft 34 33 41 39 39 48 43 24 40 29 34 31 30 31 3.3% 106 94 -11.3% 113 94 -17.1%
5 Year % Change 10 Year % Change % Change Average 5 Year Avg. Average 10 Year Avg.
2008 2009 2010 2011 2012 2013 2014 2015* 2016* 2017* 2016-17 2012-16 vs. 2017 2007-16 vs. 2017
Total Index Crimes 16,449 16,825 15,378 14,771 14,967 14,283 13,488 12,714 11,827 11,216 -5.2% 13,456 -16.6% 14,623 -23.3%
Violent Crimes 1,602 1,640 1,497 1,459 1,637 1,394 1,279 1,318 1,167 1,113 -4.6% 1,359 -18.1% 1,463 -23.9%Murder 14 18 15 7 12 12 6 13 12 10 -16.7% 11 -9.1% 12 -18.7%Rape* 58 74 71 44 55 43 53 68 48 28 -41.7% N/A N/A N/A N/ARobbery 748 754 672 713 726 706 550 555 478 416 -13.0% 603 -31.0% 665 -37.4%Aggravated Assault 782 794 739 695 844 633 670 682 629 659 4.8% 692 -4.7% 727 -9.4%
Property Crimes 14,847 15,185 13,881 13,312 13,330 12,889 12,209 11,396 10,660 10,103 -5.2% 12,097 -16.5% 13,160 -23.2%Burglary 1,929 1,998 1,928 2,062 2,019 1,737 1,460 1,311 1,144 888 -22.4% 1,534 -42.1% 1,740 -49.0%Larceny 11,900 12,066 11,117 10,483 10,596 10,558 10,174 9,596 9,054 8,768 -3.2% 9,996 -12.3% 10,647 -17.6%Motor Vehicle Theft 1,018 1,121 836 767 715 594 575 489 462 447 -3.2% 567 -21.2% 773 -42.2%
*PLEASE SEE Definitions Page for Reporting Changes to the Index Crime of Rape effective March 2016, which also impacts violent and Index crime totals.
NOTE: Percentage change is not calculated when counts are fewer than 10 and the 5-year and 10-year Averages are rounded to the nearest whole number.
As of 04/02/2018
Index Crimes
Nassau County Police Department (UCR)
Year to Date Comparisons
% Change 2017-182017 2018
% Change From Month in Previous Year
5 Year Average
% Change5 Year Avg.
vs. 20182018
1100

Current CurrentMonth Month % Change
Apr 17 May 17 Jun 17 Jul 17 Aug 17 Sep 17 Oct 17 Nov 17 Dec 17 Jan 18 Feb 18 Mar 18 2017 2018 2017 2018 2017-18 2013-17
Violent Crimes 66 101 112 112 92 82 95 102 92 90 68 89 102 89 -12.7% 259 247 -4.6% 296 247 -16.7%Firearm Related 5 16 9 16 15 14 6 10 14 15 15 6 4 6 26 36 38.5% 51 36 -29.7%Percent Firearm 7.6% 15.8% 8.0% 14.3% 16.3% 17.1% 6.3% 9.8% 15.2% 16.7% 22.1% 6.7% 3.9% 6.7% 10.0% 14.6% 17.3% 14.6%
Murder 0 0 0 0 1 2 3 1 0 0 0 0 3 0 3 0 3 0
Firearm Related 0 0 0 0 0 1 0 0 0 0 0 0 1 0 1 0 1 0 Percent Firearm 0.0% 50.0% 0.0% 0.0% 33.3% 33.3% 50.0%
Rape* 2 3 6 2 3 1 1 3 1 1 1 1 3 1 6 3 N/A 3 N/AFirearm Related 0 0 0 0 0 0 0 0 0 0 0 0 0 0 0 0 N/A 0 N/APercent Firearm 0.0% 0.0% 0.0% 0.0% 0.0% 0.0% 0.0% 0.0% 0.0% 0.0% 0.0% 0.0% 0.0% 0.0% 0.0% 0.0% N/A 0.0% N/A
Robbery 25 34 33 33 32 31 38 38 46 45 30 31 36 31 -13.9% 106 106 0.0% 128 106 -17.3%Firearm Related 4 11 5 7 8 12 5 9 12 12 13 5 3 5 19 30 57.9% 39 30 -23.9%Percent Firearm 16.0% 32.4% 15.2% 21.2% 25.0% 38.7% 13.2% 23.7% 26.1% 26.7% 43.3% 16.1% 8.3% 16.1% 17.9% 28.3% 30.7% 28.3%
Aggravated Assault 39 64 73 77 56 48 53 60 45 44 37 57 60 57 -5.0% 144 138 -4.2% 152 138 -9.4%Firearm Related 1 5 4 9 7 1 1 1 2 3 2 1 0 1 6 6 9 6 Percent Firearm 2.6% 7.8% 5.5% 11.7% 12.5% 2.1% 1.9% 1.7% 4.4% 6.8% 5.4% 1.8% 0.0% 1.8% 4.2% 4.3% 6.2% 4.3%
5 Year % Change 10 Year % Change % Change Average 5 Year Avg. Average 10 Year Avg.
2008 2009 2010 2011 2012 2013 2014 2015* 2016* 2017* 2016-17 2012-16 vs. 2017 2007-16 vs. 2017
Violent Crimes 1,602 1,640 1,497 1,459 1,637 1,394 1,279 1,318 1,167 1,113 -4.6% 1,359 -18.1% 1,463 -23.9%Firearm Related 258 286 220 235 261 285 242 227 198 131 -33.8% 243 -46.0% 245 -46.6%Percent Firearm 16.1% 17.4% 14.7% 16.1% 15.9% 20.4% 18.9% 17.2% 17.0% 11.8% 17.9% 16.9%
Murder 14 18 15 7 12 12 6 13 12 10 -16.7% 11 -9.1% 12 -18.7%Firearm Related 4 4 12 3 7 9 3 7 7 2 7 7 Percent Firearm 28.6% 22.2% 80.0% 42.9% 58.3% 75.0% 50.0% 53.8% 58.3% 20.0% 59.1% 55.5%
Rape* 58 74 71 44 55 43 53 68 48 28 -41.7% N/A N/A N/A N/AFirearm Related 1 0 0 1 1 3 2 0 0 0 N/A N/A N/A N/APercent Firearm 1.7% 0.0% 0.0% 2.3% 1.8% 7.0% 3.8% 0.0% 0.0% 0.0% N/A N/A N/A N/A
Robbery 748 754 672 713 726 706 550 555 478 416 -13.0% 603 -31.0% 665 -37.4%Firearm Related 218 224 172 198 206 222 182 170 147 92 -37.4% 185 -50.4% 194 -52.5%Percent Firearm 29.1% 29.7% 25.6% 27.8% 28.4% 31.4% 33.1% 30.6% 30.8% 22.1% 30.9% 29.3%
Aggravated Assault 782 794 739 695 844 633 670 682 629 659 4.8% 692 -4.7% 727 -9.4%Firearm Related 35 58 36 33 47 51 55 50 44 37 -15.9% 49 -25.1% 44 -16.1%Percent Firearm 4.5% 7.3% 4.9% 4.7% 5.6% 8.1% 8.2% 7.3% 7.0% 5.6% 7.2% 6.2%
*PLEASE SEE Definitions Page for Reporting Changes to the Index Crime of Rape effective March 2016, which also impacts violent crime totals.
NOTE: Percentage change is not calculated when counts are fewer than 10 and the 5-year and 10-year Averages are rounded to the nearest whole number.
Violent Crimes by FirearmAs of 04/02/2018
Nassau County Police Department (UCR)
% Change From Month in
Previous Year
5 Year Average
% Change5 Year Avg. vs.
20182018
Year to Date Comparisons
1101
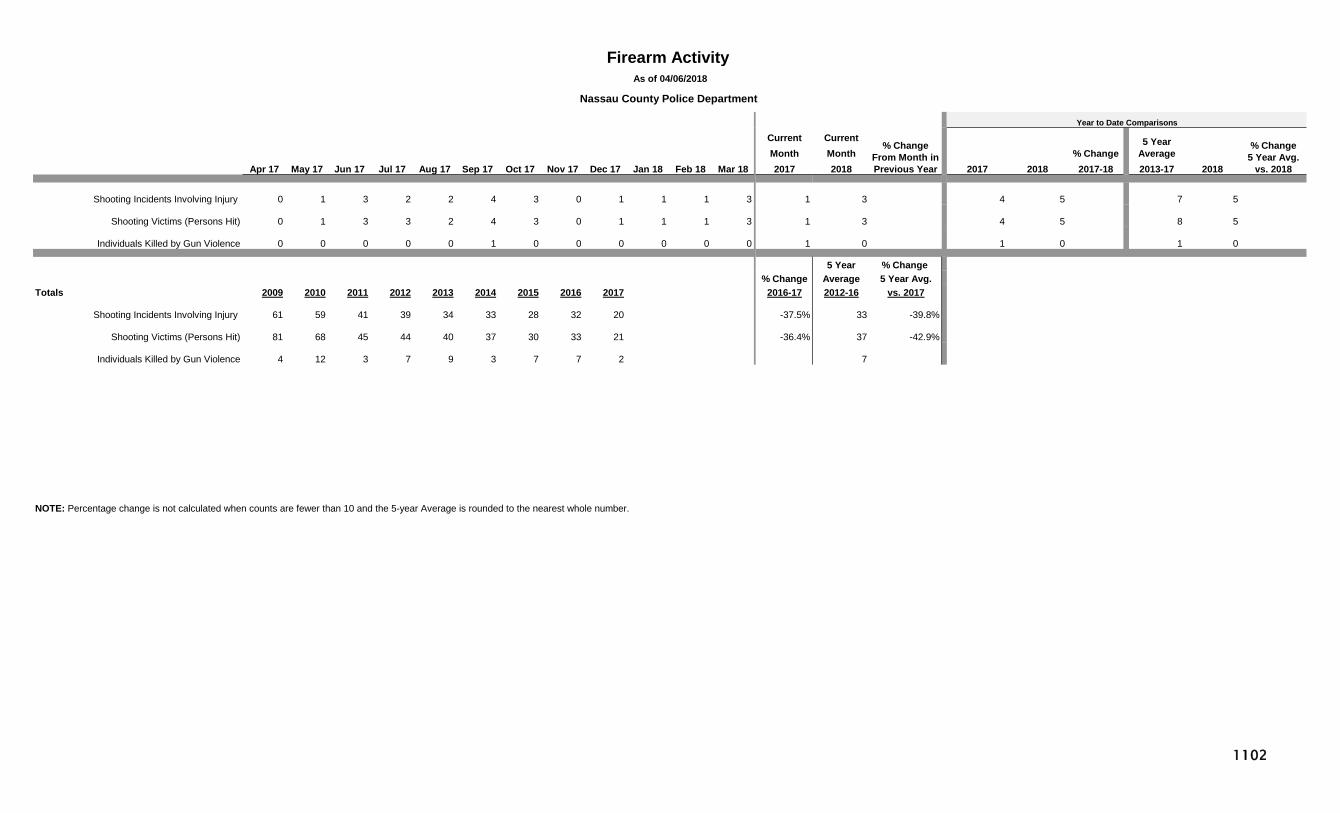
Current CurrentMonth Month % Change
Apr 17 May 17 Jun 17 Jul 17 Aug 17 Sep 17 Oct 17 Nov 17 Dec 17 Jan 18 Feb 18 Mar 18 2017 2018 2017 2018 2017-18 2013-17
Shooting Incidents Involving Injury 0 1 3 2 2 4 3 0 1 1 1 3 1 3 4 5 7 5
Shooting Victims (Persons Hit) 0 1 3 3 2 4 3 0 1 1 1 3 1 3 4 5 8 5
Individuals Killed by Gun Violence 0 0 0 0 0 1 0 0 0 0 0 0 1 0 1 0 1 0
5 Year % Change % Change Average 5 Year Avg.
Totals 2009 2010 2011 2012 2013 2014 2015 2016 2017 2016-17 2012-16 vs. 2017
Shooting Incidents Involving Injury 61 59 41 39 34 33 28 32 20 -37.5% 33 -39.8%
Shooting Victims (Persons Hit) 81 68 45 44 40 37 30 33 21 -36.4% 37 -42.9%
Individuals Killed by Gun Violence 4 12 3 7 9 3 7 7 2 7
NOTE: Percentage change is not calculated when counts are fewer than 10 and the 5-year Average is rounded to the nearest whole number.
Firearm Activity As of 04/06/2018
Nassau County Police Department
Year to Date Comparisons
% Change From Month in Previous Year
5 Year Average
% Change5 Year Avg.
vs. 20182018
1102
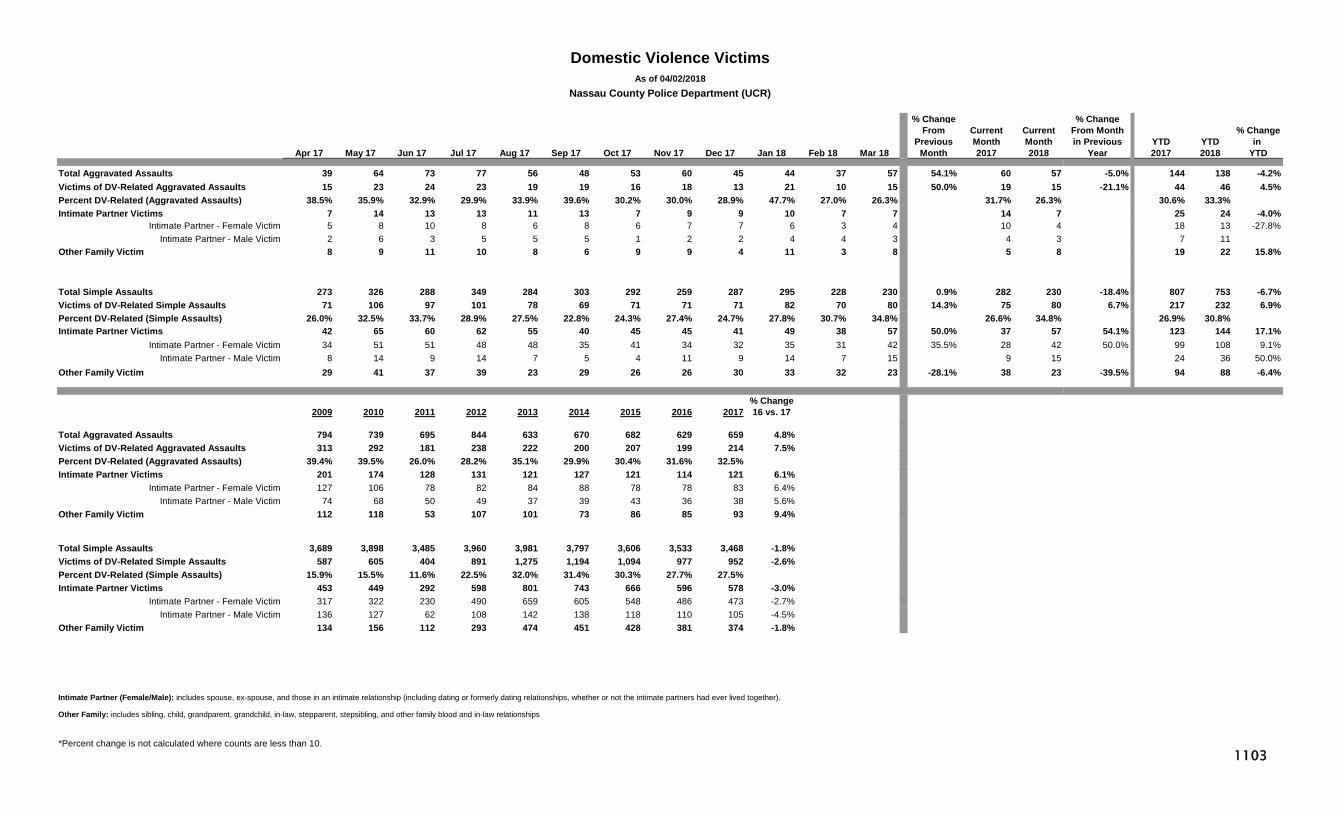
% Change % ChangeFrom Current Current From Month % Change
Previous Month Month in Previous YTD YTD in Apr 17 May 17 Jun 17 Jul 17 Aug 17 Sep 17 Oct 17 Nov 17 Dec 17 Jan 18 Feb 18 Mar 18 Month 2017 2018 Year 2017 2018 YTD
Total Aggravated Assaults 39 64 73 77 56 48 53 60 45 44 37 57 54.1% 60 57 -5.0% 144 138 -4.2%Victims of DV-Related Aggravated Assaults 15 23 24 23 19 19 16 18 13 21 10 15 50.0% 19 15 -21.1% 44 46 4.5%Percent DV-Related (Aggravated Assaults) 38.5% 35.9% 32.9% 29.9% 33.9% 39.6% 30.2% 30.0% 28.9% 47.7% 27.0% 26.3% 31.7% 26.3% 30.6% 33.3% Intimate Partner Victims 7 14 13 13 11 13 7 9 9 10 7 7 14 7 25 24 -4.0%
Intimate Partner - Female Victim 5 8 10 8 6 8 6 7 7 6 3 4 10 4 18 13 -27.8%Intimate Partner - Male Victim 2 6 3 5 5 5 1 2 2 4 4 3 4 3 7 11
Other Family Victim 8 9 11 10 8 6 9 9 4 11 3 8 5 8 19 22 15.8%
Total Simple Assaults 273 326 288 349 284 303 292 259 287 295 228 230 0.9% 282 230 -18.4% 807 753 -6.7%Victims of DV-Related Simple Assaults 71 106 97 101 78 69 71 71 71 82 70 80 14.3% 75 80 6.7% 217 232 6.9%Percent DV-Related (Simple Assaults) 26.0% 32.5% 33.7% 28.9% 27.5% 22.8% 24.3% 27.4% 24.7% 27.8% 30.7% 34.8% 26.6% 34.8% 26.9% 30.8% Intimate Partner Victims 42 65 60 62 55 40 45 45 41 49 38 57 50.0% 37 57 54.1% 123 144 17.1%
Intimate Partner - Female Victim 34 51 51 48 48 35 41 34 32 35 31 42 35.5% 28 42 50.0% 99 108 9.1%Intimate Partner - Male Victim 8 14 9 14 7 5 4 11 9 14 7 15 9 15 24 36 50.0%
Other Family Victim 29 41 37 39 23 29 26 26 30 33 32 23 -28.1% 38 23 -39.5% 94 88 -6.4%
% Change2009 2010 2011 2012 2013 2014 2015 2016 2017 16 vs. 17
Total Aggravated Assaults 794 739 695 844 633 670 682 629 659 4.8%Victims of DV-Related Aggravated Assaults 313 292 181 238 222 200 207 199 214 7.5%Percent DV-Related (Aggravated Assaults) 39.4% 39.5% 26.0% 28.2% 35.1% 29.9% 30.4% 31.6% 32.5% Intimate Partner Victims 201 174 128 131 121 127 121 114 121 6.1%
Intimate Partner - Female Victim 127 106 78 82 84 88 78 78 83 6.4%Intimate Partner - Male Victim 74 68 50 49 37 39 43 36 38 5.6%
Other Family Victim 112 118 53 107 101 73 86 85 93 9.4%
Total Simple Assaults 3,689 3,898 3,485 3,960 3,981 3,797 3,606 3,533 3,468 -1.8%Victims of DV-Related Simple Assaults 587 605 404 891 1,275 1,194 1,094 977 952 -2.6%Percent DV-Related (Simple Assaults) 15.9% 15.5% 11.6% 22.5% 32.0% 31.4% 30.3% 27.7% 27.5% Intimate Partner Victims 453 449 292 598 801 743 666 596 578 -3.0%
Intimate Partner - Female Victim 317 322 230 490 659 605 548 486 473 -2.7%Intimate Partner - Male Victim 136 127 62 108 142 138 118 110 105 -4.5%
Other Family Victim 134 156 112 293 474 451 428 381 374 -1.8%
Intimate Partner (Female/Male): includes spouse, ex-spouse, and those in an intimate relationship (including dating or formerly dating relationships, whether or not the intimate partners had ever lived together).
Other Family: includes sibling, child, grandparent, grandchild, in-law, stepparent, stepsibling, and other family blood and in-law relationships
*Percent change is not calculated where counts are less than 10.
Domestic Violence VictimsAs of 04/02/2018
Nassau County Police Department (UCR)
1103

% ChangeCurrent Current From MonthMonth Month in Previous % Change
Apr 17 May 17 Jun 17 Jul 17 Aug 17 Sep 17 Oct 17 Nov 17 Dec 17 Jan 18 Feb 18 Mar 18 2017 2018 Year 2017 2018 2017-18 2013-17
Felony Arrests within CountyVFO 85 117 122 106 101 123 111 103 90 103 90 99 103 99 -3.9% 300 292 -2.7% 310 292 -5.8%Drug 85 82 81 87 92 84 104 112 91 77 98 85 97 85 -12.4% 278 260 -6.5% 234 260 10.9%VTL 34 45 33 39 31 52 52 42 49 28 31 34 33 34 3.0% 131 93 -29.0% 108 93 -14.0%
Other 207 203 201 242 242 214 243 221 193 212 166 178 212 178 -16.0% 646 556 -13.9% 699 556 -20.5%
Total Felony 411 447 437 474 466 473 510 478 423 420 385 396 445 396 -11.0% 1,355 1,201 -11.4% 1,352 1,201 -11.2%
Misdemeanor Arrests within CountyVTL 148 178 167 141 146 166 154 165 183 107 124 146 151 146 -3.3% 460 377 -18.0% 431 377 -12.6%
Drug 380 363 385 389 359 370 443 505 341 505 452 402 414 402 -2.9% 1,148 1,359 18.4% 802 1,359 69.5%Other 418 497 488 501 475 519 453 455 449 483 415 412 430 412 -4.2% 1,354 1,310 -3.2% 1,547 1,310 -15.3%
Total Misdemeanor 946 1,038 1,040 1,031 980 1,055 1,050 1,125 973 1,095 991 960 995 960 -3.5% 2,962 3,046 2.8% 2,780 3,046 9.6%
Total Arrest 1,357 1,485 1,477 1,505 1,446 1,528 1,560 1,603 1,396 1,515 1,376 1,356 1,440 1,356 -5.8% 4,317 4,247 -1.6% 4,132 4,247 2.8%
Parolee Arrests within CountyVFO 1 3 0 0 2 0 1 1 0 0 1 0 0 0 1 1 1 1 Drug 8 4 4 11 5 5 7 9 3 5 5 6 6 6 19 16 -15.8% 22 16 -27.3%VTL 15 13 14 10 9 6 16 13 13 11 7 12 12 12 0.0% 31 30 -3.2% 35 30 -13.8%
Other 26 20 27 19 27 20 23 15 18 20 25 31 19 31 63.2% 55 76 38.2% 65 76 17.6%
Total Parolee Felonies 50 40 45 40 43 31 47 38 34 36 38 49 37 49 32.4% 106 123 16.0% 122 123 0.8%Percent of Total Felony 12.2% 8.9% 10.3% 8.4% 9.2% 6.6% 9.2% 7.9% 8.0% 8.6% 9.9% 12.4% 8.3% 12.4% 7.8% 10.2% 9.0% 10.2%
Total Parolee Misdemeanors 0 1 2 1 1 2 2 2 2 17 25 27 2 27 3 69 2 69 Percent of Total Misdemeanor 0.0% 0.1% 0.2% 0.1% 0.1% 0.2% 0.2% 0.2% 0.2% 1.6% 2.5% 2.8% 0.2% 2.8% 0.1% 2.3% 0.1% 2.3%
Total Parolee Arrest 50 41 47 41 44 33 49 40 36 53 63 76 39 76 94.9% 109 192 76.1% 124 192 54.3%Pecent of Total Arrest 3.7% 2.8% 3.2% 2.7% 3.0% 2.2% 3.1% 2.5% 2.6% 3.5% 4.6% 5.6% 2.7% 5.6% 2.5% 4.5% 3.0% 4.5%
Probationer Arrests within CountyVFO 6 4 12 6 5 7 7 11 7 11 3 8 5 8 19 22 15.8% 20 22 12.2%Drug 14 4 7 10 8 2 9 11 4 2 6 3 5 3 14 11 -21.4% 15 11 -28.6%VTL 5 1 3 2 5 2 3 1 6 3 3 4 4 4 17 10 -41.2% 11 10 -5.7%
Other 16 24 15 14 20 11 19 10 9 9 11 10 20 10 -50.0% 44 30 -31.8% 52 30 -42.7%
Total Probationer Felonies 41 33 37 32 38 22 38 33 26 25 23 25 34 25 -26.5% 94 73 -22.3% 98 73 -25.5%Percent of Total Felony 10.0% 7.4% 8.5% 6.8% 8.2% 4.7% 7.5% 6.9% 6.1% 6.0% 6.0% 6.3% 7.6% 6.3% 6.9% 6.1% 7.2% 6.1%
Total Probationer Misdemeanors 21 28 42 28 24 32 43 39 31 40 31 32 26 32 23.1% 104 103 -1.0% 110 103 -6.5%Percent of Total Misdemeanor 2.2% 2.7% 4.0% 2.7% 2.4% 3.0% 4.1% 3.5% 3.2% 3.7% 3.1% 3.3% 2.6% 3.3% 3.5% 3.4% 4.0% 3.4%
Total Probationer Arrest 62 61 79 60 62 54 81 72 57 65 54 57 60 57 -5.0% 198 176 -11.1% 208 176 -15.5%Pecent of Total Arrest 4.6% 4.1% 5.3% 4.0% 4.3% 3.5% 5.2% 4.5% 4.1% 4.3% 3.9% 4.2% 4.2% 4.2% 4.6% 4.1% 5.0% 4.1%
NOTE: Percentage change is not calculated when counts are fewer than 10 and the 5-year Average is rounded to the nearest whole number.
Nassau County ArrestsPreliminary data as of 4/20/2018
Year to Date Comparisons5 Year
Average% Change5 year vs.
20182018
1104

Current CurrentMonth Month
Apr 17 May 17 Jun 17 Jul 17 Aug 17 Sep 17 Oct 17 Nov 17 Dec 17 Jan 18 Feb 18 Mar 18 2017 2018 2013-17
Total Index Crimes 98 84 94 113 112 86 92 79 78 81 69 91 70 91 30.0% 258 241 -6.6% 282 241 -14.5%
Violent Crimes 34 24 37 34 35 28 38 23 19 30 24 26 19 26 36.8% 75 80 6.7% 85 80 -6.1%Murder 0 2 1 0 0 0 1 0 0 0 0 0 1 0 2 0 1 0 Rape* 3 2 2 2 4 1 1 4 2 0 1 2 1 2 2 3 5 3 N/ARobbery 11 4 7 13 9 9 13 6 8 11 10 8 7 8 21 29 38.1% 27 29 7.4%Aggravated Assault 20 16 27 19 22 18 23 13 9 19 13 16 10 16 60.0% 50 48 -4.0% 52 48 -8.0%
Property Crimes 64 60 57 79 77 58 54 56 59 51 45 65 51 65 27.5% 183 161 -12.0% 197 161 -18.1%Burglary 8 13 10 29 18 8 10 15 17 14 5 9 8 9 32 28 -12.5% 52 28 -45.7%Larceny 56 47 41 46 55 45 39 40 40 34 35 54 38 54 42.1% 137 123 -10.2% 132 123 -7.1%Motor Vehicle Theft 0 0 6 4 4 5 5 1 2 3 5 2 5 2 14 10 -28.6% 13 10 -20.6%
5 Year % Change 10 Year % Change % Change Average 5 Year Avg. Average 10 Year Avg.
2008 2009 2010 2011 2012 2013 2014 2015* 2016* 2017* 2016-17 2012-16 vs. 2017 2007-16 vs. 2017
Total Index Crimes 1,539 1,530 1,655 1,770 1,761 1,475 1,275 1,209 1,288 1,094 -15.1% 1,402 -21.9% 1,511 -27.6%
Violent Crimes 476 465 523 527 544 435 409 412 403 347 -13.9% 441 -21.2% 463 -25.1%Murder 7 4 11 4 5 5 1 4 6 6 4 5 Rape* 13 8 7 11 19 21 12 19 22 23 4.5% N/A N/A N/A N/ARobbery 162 187 195 254 214 150 124 128 125 101 -19.2% 148 -31.8% 167 -39.5%Aggravated Assault 294 266 310 258 306 259 272 261 250 217 -13.2% 270 -19.5% 277 -21.5%
Property Crimes 1,063 1,065 1,132 1,243 1,217 1,040 866 797 885 747 -15.6% 961 -22.3% 1,048 -28.7%Burglary 333 316 342 401 341 304 230 211 206 160 -22.3% 258 -38.1% 300 -46.7%Larceny 640 661 724 782 814 673 577 543 626 546 -12.8% 647 -15.6% 683 -20.1%Motor Vehicle Theft 90 88 66 60 62 63 59 43 53 41 -22.6% 56 -26.8% 65 -37.2%
*PLEASE SEE Definitions Page for Reporting Changes to the Index Crime of Rape effective March 2016, which also impacts violent and Index crime totals.
NOTE: Percentage change is not calculated when counts are fewer than 10 and the 5-year and 10-year Averages are rounded to the nearest whole number.
As of 04/27/2018
Index Crimes
Newburgh City Police Department (UCR)
Year to Date Comparisons
% Change 2017-182017 2018
% Change From Month in Previous Year
5 Year Average
% Change5 Year Avg.
vs. 20182018
1200

Current CurrentMonth Month % Change
Apr 17 May 17 Jun 17 Jul 17 Aug 17 Sep 17 Oct 17 Nov 17 Dec 17 Jan 18 Feb 18 Mar 18 2017 2018 2017 2018 2017-18 2013-17
Violent Crimes 34 24 37 34 35 28 38 23 19 30 24 26 19 26 36.8% 75 80 6.7% 85 80 -6.1%Firearm Related 8 3 5 10 4 4 8 2 3 4 4 5 7 5 21 13 -38.1% 25 13 -47.2%Percent Firearm 23.5% 12.5% 13.5% 29.4% 11.4% 14.3% 21.1% 8.7% 15.8% 13.3% 16.7% 19.2% 36.8% 19.2% 28.0% 16.3% 28.9% 16.3%
Murder 0 2 1 0 0 0 1 0 0 0 0 0 1 0 2 0 1 0
Firearm Related 0 1 1 0 0 0 0 0 0 0 0 0 1 0 2 0 1 0 Percent Firearm 50.0% 100.0% 0.0% 100.0% 100.0% 100.0%
Rape* 3 2 2 2 4 1 1 4 2 0 1 2 1 2 2 3 N/A 3 N/AFirearm Related 0 0 0 0 0 0 0 0 0 0 0 0 0 0 0 0 N/A 0 N/APercent Firearm 0.0% 0.0% 0.0% 0.0% 0.0% 0.0% 0.0% 0.0% 0.0% 0.0% 0.0% 0.0% 0.0% 0.0% 0.0% N/A 0.0% N/A
Robbery 11 4 7 13 9 9 13 6 8 11 10 8 7 8 21 29 38.1% 27 29 7.4%Firearm Related 2 1 2 5 1 3 5 0 3 2 3 2 3 2 7 7 10 7 Percent Firearm 18.2% 25.0% 28.6% 38.5% 11.1% 33.3% 38.5% 0.0% 37.5% 18.2% 30.0% 25.0% 42.9% 25.0% 33.3% 24.1% 35.6% 24.1%
Aggravated Assault 20 16 27 19 22 18 23 13 9 19 13 16 10 16 60.0% 50 48 -4.0% 52 48 -8.0%Firearm Related 6 1 2 5 3 1 3 2 0 2 1 3 3 3 12 6 14 6 Percent Firearm 30.0% 6.3% 7.4% 26.3% 13.6% 5.6% 13.0% 15.4% 0.0% 10.5% 7.7% 18.8% 30.0% 18.8% 24.0% 12.5% 26.8% 12.5%
5 Year % Change 10 Year % Change % Change Average 5 Year Avg. Average 10 Year Avg.
2008 2009 2010 2011 2012 2013 2014 2015* 2016* 2017* 2016-17 2012-16 vs. 2017 2007-16 vs. 2017
Violent Crimes 476 465 523 527 544 435 409 412 403 347 -13.9% 441 -21.2% 463 -25.1%Firearm Related 54 85 109 133 112 109 122 119 115 68 -40.9% 115 -41.1% 101 -32.8%Percent Firearm 11.3% 18.3% 20.8% 25.2% 20.6% 25.1% 29.8% 28.9% 28.5% 19.6% 26.6% 22.1%
Murder 7 4 11 4 5 5 1 4 6 6 4 5 Firearm Related 5 2 8 0 4 4 1 3 5 4 3 3 Percent Firearm 71.4% 50.0% 72.7% 0.0% 80.0% 80.0% 100.0% 75.0% 83.3% 66.7% 83.7% 61.2%
Rape* 13 8 7 11 19 21 12 19 22 23 4.5% N/A N/A N/A N/AFirearm Related 0 1 0 0 3 0 0 0 1 0 N/A N/A N/A N/APercent Firearm 0.0% 12.5% 0.0% 0.0% 15.8% 0.0% 0.0% 0.0% 4.5% 0.0% N/A N/A N/A N/A
Robbery 162 187 195 254 214 150 124 128 125 101 -19.2% 148 -31.8% 167 -39.5%Firearm Related 29 50 42 65 47 47 28 44 41 29 -29.3% 41 -30.0% 41 -30.0%Percent Firearm 17.9% 26.7% 21.5% 25.6% 22.0% 31.3% 22.6% 34.4% 32.8% 28.7% 28.6% 25.1%
Aggravated Assault 294 266 310 258 306 259 272 261 250 217 -13.2% 270 -19.5% 277 -21.5%Firearm Related 20 32 59 68 58 58 93 72 68 35 -48.5% 70 -49.9% 56 -37.6%Percent Firearm 6.8% 12.0% 19.0% 26.4% 19.0% 22.4% 34.2% 27.6% 27.2% 16.1% 26.1% 20.6%
*PLEASE SEE Definitions Page for Reporting Changes to the Index Crime of Rape effective March 2016, which also impacts violent crime totals.
NOTE: Percentage change is not calculated when counts are fewer than 10 and the 5-year and 10-year Averages are rounded to the nearest whole number.
Violent Crimes by FirearmAs of 04/27/2018
Newburgh City Police Department (UCR)
% Change From Month in
Previous Year
5 Year Average
% Change5 Year Avg. vs.
20182018
Year to Date Comparisons
1201

Current CurrentMonth Month % Change
Apr 17 May 17 Jun 17 Jul 17 Aug 17 Sep 17 Oct 17 Nov 17 Dec 17 Jan 18 Feb 18 Mar 18 2017 2018 2017 2018 2017-18 2013-17
Shooting Incidents Involving Injury 2 2 1 0 1 0 0 2 0 1 0 1 1 1 6 2 8 2
Shooting Victims (Persons Hit) 2 2 1 0 1 0 0 2 0 1 0 1 1 1 9 2 9 2
Individuals Killed by Gun Violence 0 1 1 0 0 0 0 0 0 0 0 0 1 0 2 0 1 0
5 Year % Change % Change Average 5 Year Avg.
Totals 2009 2010 2011 2012 2013 2014 2015 2016 2017 2016-17 2012-16 vs. 2017
Shooting Incidents Involving Injury 19 30 28 36 36 42 43 38 14 -63.2% 39 -64.1%
Shooting Victims (Persons Hit) 20 31 35 43 41 48 55 48 17 -64.6% 47 -63.8%
Individuals Killed by Gun Violence 2 8 0 4 4 1 3 5 4 3
NOTE: Percentage change is not calculated when counts are fewer than 10 and the 5-year Average is rounded to the nearest whole number.
Firearm Activity As of 04/06/2018
Newburgh City Police Department
Year to Date Comparisons
% Change From Month in Previous Year
5 Year Average
% Change5 Year Avg.
vs. 20182018
1202

% Change % ChangeFrom Current Current From Month % Change
Previous Month Month in Previous YTD YTD in Apr 17 May 17 Jun 17 Jul 17 Aug 17 Sep 17 Oct 17 Nov 17 Dec 17 Jan 18 Feb 18 Mar 18 Month 2017 2018 Year 2017 2018 YTD
Total Aggravated Assaults 20 16 27 19 22 18 23 13 9 19 13 16 23.1% 10 16 60.0% 50 48 -4.0%Victims of DV-Related Aggravated Assaults 6 3 8 3 6 3 6 0 2 7 4 8 4 8 24 19 -20.8%Percent DV-Related (Aggravated Assaults) 30.0% 18.8% 29.6% 15.8% 27.3% 16.7% 26.1% 0.0% 22.2% 36.8% 30.8% 50.0% 40.0% 50.0% 48.0% 39.6% Intimate Partner Victims 6 2 4 3 3 3 6 0 0 6 2 6 2 6 17 14 -17.6%
Intimate Partner - Female Victim 4 2 2 2 2 0 6 0 0 1 1 3 2 3 12 5 Intimate Partner - Male Victim 2 0 2 1 1 3 0 0 0 5 1 3 0 3 5 9
Other Family Victim 0 1 4 0 3 0 0 0 2 1 2 2 2 2 7 5
Total Simple Assaults 42 44 42 49 49 46 65 45 50 60 47 42 -10.6% 37 42 13.5% 129 149 15.5%Victims of DV-Related Simple Assaults 26 35 45 37 44 35 42 31 30 43 31 27 -12.9% 25 27 8.0% 96 101 5.2%Percent DV-Related (Simple Assaults) 61.9% 79.5% 107.1% 75.5% 89.8% 76.1% 64.6% 68.9% 60.0% 71.7% 66.0% 64.3% 67.6% 64.3% 74.4% 67.8% Intimate Partner Victims 18 24 27 33 39 27 29 24 22 32 24 20 -16.7% 16 20 25.0% 76 76 0.0%
Intimate Partner - Female Victim 13 19 21 28 28 18 20 23 17 26 18 14 -22.2% 13 14 7.7% 65 58 -10.8%Intimate Partner - Male Victim 5 5 6 5 11 9 9 1 5 6 6 6 3 6 11 18 63.6%
Other Family Victim 8 11 18 4 5 8 13 7 8 11 7 7 9 7 20 25 25.0%
% Change2009 2010 2011 2012 2013 2014 2015 2016 2017 16 vs. 17
Total Aggravated Assaults n/a n/a 258 306 259 272 261 250 217 -13.2%Victims of DV-Related Aggravated Assaults n/a n/a 19 31 27 28 57 53 61 15.1%Percent DV-Related (Aggravated Assaults) n/a n/a 7.4% 10.1% 10.4% 10.3% 21.8% 21.2% 28.1% Intimate Partner Victims n/a n/a 11 26 21 18 42 37 44 18.9%
Intimate Partner - Female Victim n/a n/a 9 20 16 18 34 21 30 42.9%Intimate Partner - Male Victim n/a n/a 2 6 5 0 8 16 14 -12.5%
Other Family Victim n/a n/a 8 5 6 10 15 16 17 6.3%
Total Simple Assaults n/a n/a 710 669 669 717 663 415 561 35.2%Victims of DV-Related Simple Assaults n/a n/a 229 236 214 215 253 284 421 48.2%Percent DV-Related (Simple Assaults) n/a n/a 32.3% 35.3% 32.0% 30.0% 38.2% 68.4% 75.0% Intimate Partner Victims n/a n/a 186 189 178 173 196 222 319 43.7%
Intimate Partner - Female Victim n/a n/a 159 158 156 147 167 184 252 37.0%Intimate Partner - Male Victim n/a n/a 27 31 22 26 29 38 67 76.3%
Other Family Victim n/a n/a 43 47 36 42 57 62 102 64.5%
Intimate Partner (Female/Male): includes spouse, ex-spouse, and those in an intimate relationship (including dating or formerly dating relationships, whether or not the intimate partners had ever lived together).
Other Family: includes sibling, child, grandparent, grandchild, in-law, stepparent, stepsibling, and other family blood and in-law relationships
*Percent change is not calculated where counts are less than 10.
Domestic Violence VictimsAs of 04/27/2018
Newburgh City Police Department (UCR)
1203

% ChangeCurrent Current From MonthMonth Month in Previous % Change
Apr 17 May 17 Jun 17 Jul 17 Aug 17 Sep 17 Oct 17 Nov 17 Dec 17 Jan 18 Feb 18 Mar 18 2017 2018 Year 2017 2018 2017-18 2013-17
Felony Arrests within CityVFO 15 13 17 9 20 12 11 11 4 7 14 21 12 21 75.0% 42 42 0.0% 45 42 -6.7%Drug 18 15 4 9 7 8 14 13 9 6 19 17 15 17 13.3% 35 42 20.0% 34 42 23.5%VTL 3 5 5 5 4 2 8 4 1 4 3 3 5 3 13 10 -23.1% 7 10
Other 13 28 22 16 28 16 15 11 16 19 16 13 32 13 -59.4% 60 48 -20.0% 43 48 12.1%
Total Felony 49 61 48 39 59 38 48 39 30 36 52 54 64 54 -15.6% 150 142 -5.3% 128 142 10.6%
Misdemeanor Arrests within CityVTL 21 17 19 22 9 18 8 12 10 12 15 14 12 14 16.7% 34 41 20.6% 27 41 49.6%
Drug 45 26 41 14 34 26 31 24 23 26 22 36 39 36 -7.7% 103 84 -18.4% 82 84 2.9%Other 46 54 56 49 56 66 58 50 40 53 41 39 53 39 -26.4% 165 133 -19.4% 114 133 17.1%
Total Misdemeanor 112 97 116 85 99 110 97 86 73 91 78 89 104 89 -14.4% 302 258 -14.6% 223 258 15.9%
Total Arrest 161 158 164 124 158 148 145 125 103 127 130 143 168 143 -14.9% 452 400 -11.5% 351 400 14.0%
Parolee Arrests within CityVFO 5 0 0 1 1 0 2 0 2 0 1 2 1 2 2 3 1 3 Drug 2 2 1 1 1 0 2 1 1 1 2 1 2 1 5 4 3 4 VTL 0 0 0 0 0 0 0 0 0 0 0 0 1 0 1 0 0 0
Other 0 0 1 0 0 0 1 1 0 0 0 0 0 0 1 0 1 0
Total Parolee Felonies 7 2 2 2 2 0 5 2 3 1 3 3 4 3 9 7 6 7 Percent of Total Felony 14.3% 3.3% 4.2% 5.1% 3.4% 0.0% 10.4% 5.1% 10.0% 2.8% 5.8% 5.6% 6.3% 5.6% 6.0% 4.9% 4.8% 4.9%
Total Parolee Misdemeanors 4 0 4 5 3 4 3 5 4 3 2 3 5 3 14 8 10 8 Percent of Total Misdemeanor 3.6% 0.0% 3.4% 5.9% 3.0% 3.6% 3.1% 5.8% 5.5% 3.3% 2.6% 3.4% 4.8% 3.4% 4.6% 3.1% 4.3% 3.1%
Total Parolee Arrest 11 2 6 7 5 4 8 7 7 4 5 6 9 6 23 15 -34.8% 16 15 -5.1%Pecent of Total Arrest 6.8% 1.3% 3.7% 5.6% 3.2% 2.7% 5.5% 5.6% 6.8% 3.1% 3.8% 4.2% 5.4% 4.2% 5.1% 3.8% 4.5% 3.8%
Probationer Arrests within CityVFO 1 2 0 0 3 0 0 0 0 0 1 2 1 2 6 3 5 3 Drug 1 3 1 1 2 2 1 0 0 1 5 1 0 1 4 7 4 7 VTL 1 0 2 1 0 0 1 0 0 0 0 1 1 1 1 1 1 1
Other 1 2 2 5 2 1 0 3 3 4 0 0 3 0 4 4 3 4
Total Probationer Felonies 4 7 5 7 7 3 2 3 3 5 6 4 5 4 15 15 0.0% 12 15 21.0%Percent of Total Felony 8.2% 11.5% 10.4% 17.9% 11.9% 7.9% 4.2% 7.7% 10.0% 13.9% 11.5% 7.4% 7.8% 7.4% 10.0% 10.6% 9.7% 10.6%
Total Probationer Misdemeanors 7 4 5 3 5 7 5 3 5 9 5 4 9 4 19 18 -5.3% 13 18 38.5%Percent of Total Misdemeanor 6.3% 4.1% 4.3% 3.5% 5.1% 6.4% 5.2% 3.5% 6.8% 9.9% 6.4% 4.5% 8.7% 4.5% 6.3% 7.0% 5.8% 7.0%
Total Probationer Arrest 11 11 10 10 12 10 7 6 8 14 11 8 14 8 34 33 -2.9% 25 33 29.9%Pecent of Total Arrest 6.8% 7.0% 6.1% 8.1% 7.6% 6.8% 4.8% 4.8% 7.8% 11.0% 8.5% 5.6% 8.3% 5.6% 7.5% 8.3% 7.2% 8.3%
NOTE: Percentage change is not calculated when counts are fewer than 10 and the 5-year Average is rounded to the nearest whole number.
City of Newburgh ArrestsPreliminary data as of 4/20/2018
Year to Date Comparisons5 Year
Average% Change5 year vs.
20182018
1204

Current CurrentMonth Month
Apr 17 May 17 Jun 17 Jul 17 Aug 17 Sep 17 Oct 17 Nov 17 Dec 17 Jan 18 Feb 18 Mar 18 2017 2018 2013-17
Total Index Crimes 206 293 313 244 313 262 254 198 173 164 157 173 190 173 -8.9% 624 494 -20.8% 649 494 -23.9%
Violent Crimes 51 56 43 49 55 48 43 35 31 24 39 32 46 32 -30.4% 133 95 -28.6% 113 95 -15.8%Murder 0 0 0 0 0 0 2 0 1 1 0 0 0 0 0 1 1 1 Rape* 5 3 3 6 2 3 2 4 1 0 5 2 3 2 7 7 4 7 N/ARobbery 14 15 5 10 18 20 7 12 12 9 14 13 14 13 -7.1% 37 36 -2.7% 37 36 -2.7%Aggravated Assault 32 38 35 33 35 25 32 19 17 14 20 17 29 17 -41.4% 89 51 -42.7% 71 51 -28.2%
Property Crimes 155 237 270 195 258 214 211 163 142 140 118 141 144 141 -2.1% 491 399 -18.7% 537 399 -25.6%Burglary 22 51 40 35 51 42 54 28 28 26 16 16 24 16 -33.3% 107 58 -45.8% 134 58 -56.7%Larceny 121 169 222 150 191 162 150 127 105 103 95 114 104 114 9.6% 341 312 -8.5% 367 312 -14.9%Motor Vehicle Theft 12 17 8 10 16 10 7 8 9 11 7 11 16 11 -31.3% 43 29 -32.6% 36 29 -19.4%
5 Year % Change 10 Year % Change % Change Average 5 Year Avg. Average 10 Year Avg.
2008 2009 2010 2011 2012 2013 2014 2015* 2016* 2017* 2016-17 2012-16 vs. 2017 2007-16 vs. 2017
Total Index Crimes 3,310 3,422 3,535 3,518 3,584 3,393 3,217 3,091 2,968 2,880 -3.0% 3,251 -11.4% 3,323 -13.3%
Violent Crimes 566 609 610 580 619 584 575 557 565 544 -3.7% 580 -6.2% 577 -5.8%Murder 3 6 5 4 3 3 3 4 3 3 3 4 Rape* 24 29 23 31 26 12 20 32 14 36 157.1% N/A N/A N/A N/ARobbery 173 167 185 174 171 166 161 157 199 150 -24.6% 171 -12.2% 169 -11.1%Aggravated Assault 366 407 397 371 419 403 391 364 349 355 1.7% 385 -7.8% 380 -6.6%
Property Crimes 2,744 2,813 2,925 2,938 2,965 2,809 2,642 2,534 2,403 2,336 -2.8% 2,671 -12.5% 2,745 -14.9%Burglary 829 806 956 850 749 746 650 618 551 458 -16.9% 663 -30.9% 742 -38.3%Larceny 1,763 1,879 1,835 1,930 2,087 1,949 1,859 1,786 1,666 1,738 4.3% 1,869 -7.0% 1,855 -6.3%Motor Vehicle Theft 152 128 134 158 129 114 133 130 186 140 -24.7% 138 1.2% 148 -5.1%
*PLEASE SEE Definitions Page for Reporting Changes to the Index Crime of Rape effective March 2016, which also impacts violent and Index crime totals.
NOTE: Percentage change is not calculated when counts are fewer than 10 and the 5-year and 10-year Averages are rounded to the nearest whole number.
Index Crimes
Niagara Falls City Police Department (IBR)As of 04/20/2018
Year to Date Comparisons
% Change 2017-182017 2018
% Change From Month in Previous Year
5 Year Average
% Change5 Year Avg.
vs. 20182018
1300

Current CurrentMonth Month % Change
Apr 17 May 17 Jun 17 Jul 17 Aug 17 Sep 17 Oct 17 Nov 17 Dec 17 Jan 18 Feb 18 Mar 18 2017 2018 2017 2018 2017-18 2013-17
Violent Crimes 51 56 43 49 55 48 43 35 31 24 39 32 46 32 -30.4% 133 95 -28.6% 113 95 -15.8%Firearm Related 14 13 10 13 17 22 8 7 9 5 15 11 12 11 -8.3% 34 31 -8.8% 27 31 13.1%Percent Firearm 27.5% 23.2% 23.3% 26.5% 30.9% 45.8% 18.6% 20.0% 29.0% 20.8% 38.5% 34.4% 26.1% 34.4% 25.6% 32.6% 24.3% 32.6%
Murder 0 0 0 0 0 0 2 0 1 1 0 0 0 0 0 1 1 1
Firearm Related 0 0 0 0 0 0 2 0 1 1 0 0 0 0 0 1 0 1 Percent Firearm 100.0% 100.0% 100.0% 100.0% 66.7% 100.0%
Rape* 5 3 3 6 2 3 2 4 1 0 5 2 3 2 7 7 N/A 7 N/AFirearm Related 0 0 0 0 1 0 0 0 0 0 0 0 0 0 0 0 N/A 0 N/APercent Firearm 0.0% 0.0% 0.0% 0.0% 50.0% 0.0% 0.0% 0.0% 0.0% 0.0% 0.0% 0.0% 0.0% 0.0% 0.0% N/A 0.0% N/A
Robbery 14 15 5 10 18 20 7 12 12 9 14 13 14 13 -7.1% 37 36 -2.7% 37 36 -2.7%Firearm Related 3 5 2 2 5 17 2 3 5 1 6 7 7 7 16 14 -12.5% 13 14 9.4%Percent Firearm 21.4% 33.3% 40.0% 20.0% 27.8% 85.0% 28.6% 25.0% 41.7% 11.1% 42.9% 53.8% 50.0% 53.8% 43.2% 38.9% 34.6% 38.9%
Aggravated Assault 32 38 35 33 35 25 32 19 17 14 20 17 29 17 -41.4% 89 51 -42.7% 71 51 -28.2%Firearm Related 11 8 8 11 11 5 4 4 3 3 9 4 5 4 18 16 -11.1% 14 16 12.7%Percent Firearm 34.4% 21.1% 22.9% 33.3% 31.4% 20.0% 12.5% 21.1% 17.6% 21.4% 45.0% 23.5% 17.2% 23.5% 20.2% 31.4% 20.0% 31.4%
5 Year % Change 10 Year % Change % Change Average 5 Year Avg. Average 10 Year Avg.
2008 2009 2010 2011 2012 2013 2014 2015* 2016* 2017* 2016-17 2012-16 vs. 2017 2007-16 vs. 2017
Violent Crimes 566 609 610 580 619 584 575 557 565 544 -3.7% 580 -6.2% 577 -5.8%Firearm Related 86 104 102 120 123 124 136 119 124 147 18.5% 125 17.4% 112 31.7%Percent Firearm 15.2% 17.1% 16.7% 20.7% 19.9% 21.2% 23.7% 21.4% 21.9% 27.0% 21.6% 19.3%
Murder 3 6 5 4 3 3 3 4 3 3 3 4 Firearm Related 3 4 3 2 1 3 2 2 1 3 2 2 Percent Firearm 100.0% 66.7% 60.0% 50.0% 33.3% 100.0% 66.7% 50.0% 33.3% 100.0% 56.7% 63.5%
Rape* 24 29 23 31 26 12 20 32 14 36 157.1% N/A N/A N/A N/AFirearm Related 0 0 0 0 0 0 2 0 0 1 N/A N/A N/A N/APercent Firearm 0.0% 0.0% 0.0% 0.0% 0.0% 0.0% 10.0% 0.0% 0.0% 2.8% N/A N/A N/A N/A
Robbery 173 167 185 174 171 166 161 157 199 150 -24.6% 171 -12.2% 169 -11.1%Firearm Related 29 47 49 43 49 47 52 44 65 60 -7.7% 51 16.7% 45 32.2%Percent Firearm 16.8% 28.1% 26.5% 24.7% 28.7% 28.3% 32.3% 28.0% 32.7% 40.0% 30.0% 26.8%
Aggravated Assault 366 407 397 371 419 403 391 364 349 355 1.7% 385 -7.8% 380 -6.6%Firearm Related 54 53 50 75 73 74 80 73 58 83 43.1% 72 15.9% 64 30.5%Percent Firearm 14.8% 13.0% 12.6% 20.2% 17.4% 18.4% 20.5% 20.1% 16.6% 23.4% 18.6% 16.7%
*PLEASE SEE Definitions Page for Reporting Changes to the Index Crime of Rape effective March 2016, which also impacts violent crime totals.
NOTE: Percentage change is not calculated when counts are fewer than 10 and the 5-year and 10-year Averages are rounded to the nearest whole number.
Violent Crimes by FirearmAs of 04/20/2018
Niagara Falls City Police Department (IBR)
% Change From Month in
Previous Year
5 Year Average
% Change5 Year Avg. vs.
20182018
Year to Date Comparisons
1301

Current CurrentMonth Month % Change
Apr 17 May 17 Jun 17 Jul 17 Aug 17 Sep 17 Oct 17 Nov 17 Dec 17 Jan 18 Feb 18 Mar 18 2017 2018 2017 2018 2017-18 2013-17
Shooting Incidents Involving Injury 0 4 1 1 5 2 3 0 1 1 1 0 2 0 5 2 4 2
Shooting Victims (Persons Hit) 0 4 1 1 7 2 3 0 1 1 1 0 2 0 6 2 4 2
Individuals Killed by Gun Violence 0 0 0 0 0 0 2 0 1 1 0 0 0 0 0 1 0 1
5 Year % Change % Change Average 5 Year Avg.
Totals 2009 2010 2011 2012 2013 2014 2015 2016 2017 2016-17 2012-16 vs. 2017
Shooting Incidents Involving Injury 13 18 22 25 20 29 15 19 22 15.8% 22 1.9%
Shooting Victims (Persons Hit) 15 18 24 25 23 31 15 19 25 31.6% 23 10.6%
Individuals Killed by Gun Violence 4 3 2 1 3 2 2 1 3 2
NOTE: Percentage change is not calculated when counts are fewer than 10 and the 5-year Average is rounded to the nearest whole number.
Firearm Activity As of 04/06/2018
Niagara Falls City Police Department
Year to Date Comparisons
% Change From Month in Previous Year
5 Year Average
% Change5 Year Avg.
vs. 20182018
1302

% Change % ChangeFrom Current Current From Month % Change
Previous Month Month in Previous YTD YTD in Apr 17 May 17 Jun 17 Jul 17 Aug 17 Sep 17 Oct 17 Nov 17 Dec 17 Jan 18 Feb 18 Mar 18 Month 2017 2018 Year 2017 2018 YTD
Total Aggravated Assaults 32 38 35 33 35 25 32 19 17 14 20 17 -15.0% 29 17 -41.4% 89 51 -42.7%Victims of DV-Related Aggravated Assaults 9 7 10 5 11 7 7 10 5 3 4 8 8 8 23 15 -34.8%Percent DV-Related (Aggravated Assaults) 28.1% 18.4% 28.6% 15.2% 31.4% 28.0% 21.9% 52.6% 29.4% 21.4% 20.0% 47.1% 27.6% 47.1% 25.8% 29.4% Intimate Partner Victims 5 5 7 3 8 7 5 9 3 3 3 6 4 6 16 12 -25.0%
Intimate Partner - Female Victim 4 2 5 2 6 4 4 6 2 2 1 6 3 6 11 9 Intimate Partner - Male Victim 1 3 2 1 2 3 1 3 1 1 2 0 1 0 5 3
Other Family Victim 4 2 3 2 3 0 2 1 2 0 1 2 4 2 7 3
Total Simple Assaults 89 135 139 116 128 121 116 88 75 67 62 68 9.7% 85 68 -20.0% 294 197 -33.0%Victims of DV-Related Simple Assaults 61 63 68 63 61 61 62 42 40 37 33 34 3.0% 52 34 -34.6% 153 104 -32.0%Percent DV-Related (Simple Assaults) 68.5% 46.7% 48.9% 54.3% 47.7% 50.4% 53.4% 47.7% 53.3% 55.2% 53.2% 50.0% 61.2% 50.0% 52.0% 52.8% Intimate Partner Victims 49 54 56 54 50 45 47 35 31 31 25 28 12.0% 45 28 -37.8% 126 84 -33.3%
Intimate Partner - Female Victim 44 47 48 44 40 38 38 29 25 30 20 25 25.0% 37 25 -32.4% 102 75 -26.5%Intimate Partner - Male Victim 5 7 8 10 10 7 9 6 6 1 5 3 8 3 24 9
Other Family Victim 12 9 12 9 11 16 15 7 9 6 8 6 7 6 27 20 -25.9%
% Change2009 2010 2011 2012 2013 2014 2015 2016 2017 16 vs. 17
Total Aggravated Assaults 407 397 371 419 403 391 364 349 355 1.7%Victims of DV-Related Aggravated Assaults 123 122 95 131 127 154 110 112 94 -16.1%Percent DV-Related (Aggravated Assaults) 30.2% 30.7% 25.6% 31.3% 31.5% 39.4% 30.2% 32.1% 26.5% Intimate Partner Victims 100 87 75 88 90 111 73 76 68 -10.5%
Intimate Partner - Female Victim 74 56 50 59 68 74 51 57 46 -19.3%Intimate Partner - Male Victim 26 31 25 29 22 37 22 19 22 15.8%
Other Family Victim 23 35 20 43 37 43 37 36 26 -27.8%
Total Simple Assaults 1,140 1,261 1,301 1,563 1,625 1,581 1,520 1,400 1,301 -7.1%Victims of DV-Related Simple Assaults 588 555 580 765 776 872 861 766 674 -12.0%Percent DV-Related (Simple Assaults) 51.6% 44.0% 44.6% 48.9% 47.8% 55.2% 56.6% 54.7% 51.8% Intimate Partner Victims 463 433 452 608 607 681 670 607 547 -9.9%
Intimate Partner - Female Victim 389 372 382 526 513 553 546 509 455 -10.6%Intimate Partner - Male Victim 74 61 70 82 94 128 124 98 92 -6.1%
Other Family Victim 125 122 128 157 169 191 191 159 127 -20.1%
Note: Niagara Falls IBR data is "crunched" into UCR domestic violence crime categories and relationships.
Intimate Partner (Female/Male): includes spouse, ex-spouse, and those in an intimate relationship (including dating or formerly dating relationships, whether or not the intimate partners had ever lived together).
Other Family: includes sibling, child, grandparent, grandchild, in-law, stepparent, stepsibling, and other family blood and in-law relationships
*Percent change is not calculated where counts are less than 10.
Domestic Violence VictimsAs of 04/20/2018
Niagara Falls City Police Department (IBR)
1303

% ChangeCurrent Current From MonthMonth Month in Previous % Change
Apr 17 May 17 Jun 17 Jul 17 Aug 17 Sep 17 Oct 17 Nov 17 Dec 17 Jan 18 Feb 18 Mar 18 2017 2018 Year 2017 2018 2017-18 2013-17
Felony Arrests within CityVFO 17 17 12 15 22 23 26 10 11 9 12 15 23 15 -34.8% 53 36 -32.1% 61 36 -41.2%Drug 15 7 12 10 13 5 14 13 8 12 10 12 16 12 -25.0% 37 34 -8.1% 34 34 0.6%VTL 3 2 1 2 3 2 3 6 3 2 3 2 2 2 8 7 8 7
Other 28 48 26 21 26 24 27 18 29 11 18 29 34 29 -14.7% 85 58 -31.8% 89 58 -34.8%
Total Felony 63 74 51 48 64 54 70 47 51 34 43 58 75 58 -22.7% 183 135 -26.2% 192 135 -29.8%
Misdemeanor Arrests within CityVTL 4 10 9 4 10 17 9 7 10 3 7 8 11 8 31 18 -41.9% 25 18 -28.6%
Drug 17 18 26 26 20 17 22 11 6 12 15 7 10 7 28 34 21.4% 28 34 19.7%Other 90 99 147 76 104 92 99 78 72 57 78 71 90 71 -21.1% 266 206 -22.6% 284 206 -27.5%
Total Misdemeanor 111 127 182 106 134 126 130 96 88 72 100 86 111 86 -22.5% 325 258 -20.6% 338 258 -23.6%
Total Arrest 174 201 233 154 198 180 200 143 139 106 143 144 186 144 -22.6% 508 393 -22.6% 530 393 -25.8%
Parolee Arrests within CityVFO 0 0 1 1 0 1 1 1 2 0 1 0 0 0 1 1 1 1 Drug 1 0 0 1 3 0 3 1 1 1 0 0 2 0 3 1 3 1 VTL 0 0 0 0 0 0 0 2 0 0 0 0 1 0 1 0 0 0
Other 0 0 0 0 0 1 1 2 1 0 1 0 1 0 1 1 2 1
Total Parolee Felonies 1 0 1 2 3 2 5 6 4 1 2 0 4 0 6 3 7 3 Percent of Total Felony 1.6% 0.0% 2.0% 4.2% 4.7% 3.7% 7.1% 12.8% 7.8% 2.9% 4.7% 0.0% 5.3% 0.0% 3.3% 2.2% 3.6% 2.2%
Total Parolee Misdemeanors 3 6 5 3 4 1 5 2 2 0 2 2 0 2 4 4 6 4 Percent of Total Misdemeanor 2.7% 4.7% 2.7% 2.8% 3.0% 0.8% 3.8% 2.1% 2.3% 0.0% 2.0% 2.3% 0.0% 2.3% 1.2% 1.6% 1.8% 1.6%
Total Parolee Arrest 4 6 6 5 7 3 10 8 6 1 4 2 4 2 10 7 13 7 Pecent of Total Arrest 2.3% 3.0% 2.6% 3.2% 3.5% 1.7% 5.0% 5.6% 4.3% 0.9% 2.8% 1.4% 2.2% 1.4% 2.0% 1.8% 2.5% 1.8%
Probationer Arrests within CityVFO 0 2 1 0 2 1 2 0 2 1 0 1 1 1 5 2 5 2 Drug 2 1 2 2 1 0 0 0 0 1 1 1 1 1 1 3 3 3 VTL 0 0 0 0 0 0 0 0 0 1 0 0 0 0 1 1 1 1
Other 4 3 3 0 2 2 2 0 5 1 3 4 3 4 6 8 8 8
Total Probationer Felonies 6 6 6 2 5 3 4 0 7 4 4 6 5 6 13 14 7.7% 17 14 -18.6%Percent of Total Felony 9.5% 8.1% 11.8% 4.2% 7.8% 5.6% 5.7% 0.0% 13.7% 11.8% 9.3% 10.3% 6.7% 10.3% 7.1% 10.4% 8.9% 10.4%
Total Probationer Misdemeanors 4 8 8 7 9 6 7 5 4 3 3 7 4 7 15 13 -13.3% 17 13 -23.5%Percent of Total Misdemeanor 3.6% 6.3% 4.4% 6.6% 6.7% 4.8% 5.4% 5.2% 4.5% 4.2% 3.0% 8.1% 3.6% 8.1% 4.6% 5.0% 5.0% 5.0%
Total Probationer Arrest 10 14 14 9 14 9 11 5 11 7 7 13 9 13 28 27 -3.6% 34 27 -21.1%Pecent of Total Arrest 5.7% 7.0% 6.0% 5.8% 7.1% 5.0% 5.5% 3.5% 7.9% 6.6% 4.9% 9.0% 4.8% 9.0% 5.5% 6.9% 6.5% 6.9%
NOTE: Percentage change is not calculated when counts are fewer than 10 and the 5-year Average is rounded to the nearest whole number.
City of Niagara Falls ArrestsPreliminary data as of 4/20/2018
Year to Date Comparisons5 Year
Average% Change5 year vs.
20182018
1304

Current CurrentMonth Month
Apr 17 May 17 Jun 17 Jul 17 Aug 17 Sep 17 Oct 17 Nov 17 Dec 17 Jan 18 Feb 18 Mar 18 2017 2018 2013-17
Total Index Crimes 47 66 88 75 86 83 81 61 53 46 35 37 54 37 -31.5% 181 118 -34.8% 205 118 -42.3%
Violent Crimes 14 16 28 17 22 23 26 19 12 17 9 14 10 14 40.0% 38 40 5.3% 55 40 -27.8%Murder 0 0 0 0 0 1 0 1 0 2 0 0 0 0 0 2 0 2 Rape* 2 3 5 1 1 3 6 1 3 0 2 1 2 1 3 3 4 3 N/ARobbery 1 4 11 6 4 6 6 6 4 4 1 5 1 5 9 10 18 10 -44.4%Aggravated Assault 11 9 12 10 17 13 14 11 5 11 6 8 7 8 26 25 -3.8% 33 25 -23.3%
Property Crimes 33 50 60 58 64 60 55 42 41 29 26 23 44 23 -47.7% 143 78 -45.5% 149 78 -47.7%Burglary 6 6 16 9 13 11 8 5 7 8 3 3 6 3 30 14 -53.3% 36 14 -61.5%Larceny 26 42 44 48 51 46 44 34 30 20 18 19 36 19 -47.2% 103 57 -44.7% 104 57 -45.4%Motor Vehicle Theft 1 2 0 1 0 3 3 3 4 1 5 1 2 1 10 7 8 7
5 Year % Change 10 Year % Change % Change Average 5 Year Avg. Average 10 Year Avg.
2008 2009 2010 2011 2012 2013 2014 2015* 2016* 2017* 2016-17 2012-16 vs. 2017 2007-16 vs. 2017
Total Index Crimes 1,521 1,447 1,459 1,355 1,328 1,115 966 925 833 821 -1.4% 1,033 -20.6% 1,240 -33.8%
Violent Crimes 397 417 400 326 342 288 261 243 234 215 -8.1% 274 -21.4% 330 -34.8%Murder 5 3 6 5 3 7 3 2 3 2 4 4 Rape* 23 11 21 22 12 16 13 32 23 28 21.7% N/A N/A N/A N/ARobbery 165 206 143 107 87 100 95 70 60 57 -5.0% 82 -30.8% 120 -52.4%Aggravated Assault 204 197 230 192 240 165 150 139 148 128 -13.5% 168 -24.0% 187 -31.5%
Property Crimes 1,124 1,030 1,059 1,029 986 827 705 682 599 606 1.2% 760 -20.2% 910 -33.4%Burglary 261 274 275 283 247 189 179 148 129 111 -14.0% 178 -37.8% 224 -50.4%Larceny 787 691 732 704 690 590 501 503 442 468 5.9% 545 -14.2% 635 -26.3%Motor Vehicle Theft 76 65 52 42 49 48 25 31 28 27 -3.6% 36 -25.4% 52 -48.1%
*PLEASE SEE Definitions Page for Reporting Changes to the Index Crime of Rape effective March 2016, which also impacts violent and Index crime totals.
NOTE: Percentage change is not calculated when counts are fewer than 10 and the 5-year and 10-year Averages are rounded to the nearest whole number.
Note: A local IBR programming error has been identified for incidents involving Grand Larceny in the 4th of a motor vehicle (PL 155.30 sub 8) and Unauthorized Use in the 3rd (PL 165.05 sub 1). This error may result in an under count of this agency’s reported motor vehicle thefts.
As of 04/26/2018
Index Crimes
Poughkeepsie City Police Department (IBR)
Year to Date Comparisons
% Change 2017-182017 2018
% Change From Month in Previous Year
5 Year Average
% Change5 Year Avg.
vs. 20182018
1400
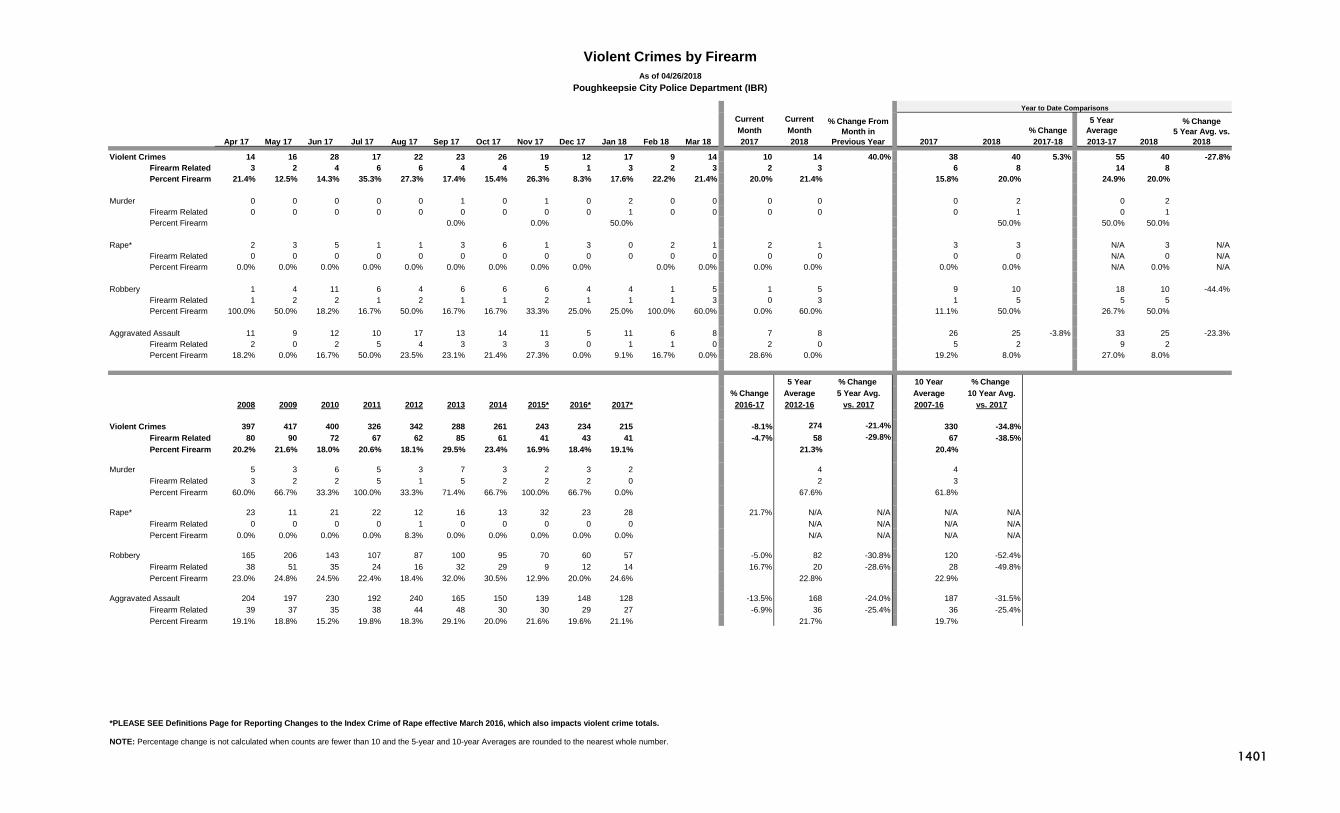
Current CurrentMonth Month % Change
Apr 17 May 17 Jun 17 Jul 17 Aug 17 Sep 17 Oct 17 Nov 17 Dec 17 Jan 18 Feb 18 Mar 18 2017 2018 2017 2018 2017-18 2013-17
Violent Crimes 14 16 28 17 22 23 26 19 12 17 9 14 10 14 40.0% 38 40 5.3% 55 40 -27.8%Firearm Related 3 2 4 6 6 4 4 5 1 3 2 3 2 3 6 8 14 8 Percent Firearm 21.4% 12.5% 14.3% 35.3% 27.3% 17.4% 15.4% 26.3% 8.3% 17.6% 22.2% 21.4% 20.0% 21.4% 15.8% 20.0% 24.9% 20.0%
Murder 0 0 0 0 0 1 0 1 0 2 0 0 0 0 0 2 0 2
Firearm Related 0 0 0 0 0 0 0 0 0 1 0 0 0 0 0 1 0 1 Percent Firearm 0.0% 0.0% 50.0% 50.0% 50.0% 50.0%
Rape* 2 3 5 1 1 3 6 1 3 0 2 1 2 1 3 3 N/A 3 N/AFirearm Related 0 0 0 0 0 0 0 0 0 0 0 0 0 0 0 0 N/A 0 N/APercent Firearm 0.0% 0.0% 0.0% 0.0% 0.0% 0.0% 0.0% 0.0% 0.0% 0.0% 0.0% 0.0% 0.0% 0.0% 0.0% N/A 0.0% N/A
Robbery 1 4 11 6 4 6 6 6 4 4 1 5 1 5 9 10 18 10 -44.4%Firearm Related 1 2 2 1 2 1 1 2 1 1 1 3 0 3 1 5 5 5 Percent Firearm 100.0% 50.0% 18.2% 16.7% 50.0% 16.7% 16.7% 33.3% 25.0% 25.0% 100.0% 60.0% 0.0% 60.0% 11.1% 50.0% 26.7% 50.0%
Aggravated Assault 11 9 12 10 17 13 14 11 5 11 6 8 7 8 26 25 -3.8% 33 25 -23.3%Firearm Related 2 0 2 5 4 3 3 3 0 1 1 0 2 0 5 2 9 2 Percent Firearm 18.2% 0.0% 16.7% 50.0% 23.5% 23.1% 21.4% 27.3% 0.0% 9.1% 16.7% 0.0% 28.6% 0.0% 19.2% 8.0% 27.0% 8.0%
5 Year % Change 10 Year % Change % Change Average 5 Year Avg. Average 10 Year Avg.
2008 2009 2010 2011 2012 2013 2014 2015* 2016* 2017* 2016-17 2012-16 vs. 2017 2007-16 vs. 2017
Violent Crimes 397 417 400 326 342 288 261 243 234 215 -8.1% 274 -21.4% 330 -34.8%Firearm Related 80 90 72 67 62 85 61 41 43 41 -4.7% 58 -29.8% 67 -38.5%Percent Firearm 20.2% 21.6% 18.0% 20.6% 18.1% 29.5% 23.4% 16.9% 18.4% 19.1% 21.3% 20.4%
Murder 5 3 6 5 3 7 3 2 3 2 4 4 Firearm Related 3 2 2 5 1 5 2 2 2 0 2 3 Percent Firearm 60.0% 66.7% 33.3% 100.0% 33.3% 71.4% 66.7% 100.0% 66.7% 0.0% 67.6% 61.8%
Rape* 23 11 21 22 12 16 13 32 23 28 21.7% N/A N/A N/A N/AFirearm Related 0 0 0 0 1 0 0 0 0 0 N/A N/A N/A N/APercent Firearm 0.0% 0.0% 0.0% 0.0% 8.3% 0.0% 0.0% 0.0% 0.0% 0.0% N/A N/A N/A N/A
Robbery 165 206 143 107 87 100 95 70 60 57 -5.0% 82 -30.8% 120 -52.4%Firearm Related 38 51 35 24 16 32 29 9 12 14 16.7% 20 -28.6% 28 -49.8%Percent Firearm 23.0% 24.8% 24.5% 22.4% 18.4% 32.0% 30.5% 12.9% 20.0% 24.6% 22.8% 22.9%
Aggravated Assault 204 197 230 192 240 165 150 139 148 128 -13.5% 168 -24.0% 187 -31.5%Firearm Related 39 37 35 38 44 48 30 30 29 27 -6.9% 36 -25.4% 36 -25.4%Percent Firearm 19.1% 18.8% 15.2% 19.8% 18.3% 29.1% 20.0% 21.6% 19.6% 21.1% 21.7% 19.7%
*PLEASE SEE Definitions Page for Reporting Changes to the Index Crime of Rape effective March 2016, which also impacts violent crime totals.
NOTE: Percentage change is not calculated when counts are fewer than 10 and the 5-year and 10-year Averages are rounded to the nearest whole number.
Violent Crimes by FirearmAs of 04/26/2018
Poughkeepsie City Police Department (IBR)
% Change From Month in
Previous Year
5 Year Average
% Change5 Year Avg. vs.
20182018
Year to Date Comparisons
1401

Current CurrentMonth Month % Change
Apr 17 May 17 Jun 17 Jul 17 Aug 17 Sep 17 Oct 17 Nov 17 Dec 17 Jan 18 Feb 18 Mar 18 2017 2018 2017 2018 2017-18 2013-17
Shooting Incidents Involving Injury 1 0 0 2 2 0 1 0 0 1 1 0 0 0 2 2 4 2
Shooting Victims (Persons Hit) 1 0 0 2 2 0 2 0 0 0 1 0 0 0 2 1 4 1
Individuals Killed by Gun Violence 0 0 0 0 0 0 0 0 0 1 0 0 0 0 0 1 0 1
5 Year % Change % Change Average 5 Year Avg.
Totals 2009 2010 2011 2012 2013 2014 2015 2016 2017 2016-17 2012-16 vs. 2017
Shooting Incidents Involving Injury 17 15 17 13 32 13 15 17 8 18
Shooting Victims (Persons Hit) 19 15 19 17 34 14 15 18 9 20
Individuals Killed by Gun Violence 2 2 5 1 5 2 2 2 0 2
NOTE: Percentage change is not calculated when counts are fewer than 10 and the 5-year Average is rounded to the nearest whole number.
Firearm Activity As of 04/06/2018
Poughkeepsie City Police Department
Year to Date Comparisons
% Change From Month in Previous Year
5 Year Average
% Change5 Year Avg.
vs. 20182018
1402

% Change % ChangeFrom Current Current From Month % Change
Previous Month Month in Previous YTD YTD in Apr 17 May 17 Jun 17 Jul 17 Aug 17 Sep 17 Oct 17 Nov 17 Dec 17 Jan 18 Feb 18 Mar 18 Month 2017 2018 Year 2017 2018 YTD
Total Aggravated Assaults 11 9 12 10 17 13 14 11 5 11 6 8 7 8 26 25 -3.8%Victims of DV-Related Aggravated Assaults 0 5 2 0 6 5 4 3 3 2 1 4 4 4 5 7 Percent DV-Related (Aggravated Assaults) 0.0% 55.6% 16.7% 0.0% 35.3% 38.5% 28.6% 27.3% 60.0% 18.2% 16.7% 50.0% 57.1% 50.0% 19.2% 28.0% Intimate Partner Victims 0 4 2 0 5 2 4 1 2 2 1 3 3 3 4 6
Intimate Partner - Female Victim 0 3 2 0 2 1 2 1 1 2 1 1 2 1 3 4 Intimate Partner - Male Victim 0 1 0 0 3 1 2 0 1 0 0 2 1 2 1 2
Other Family Victim 0 1 0 0 1 3 0 2 1 0 0 1 1 1 1 1
Total Simple Assaults 28 33 34 28 35 31 31 36 25 37 19 30 57.9% 43 30 -30.2% 106 86 -18.9%Victims of DV-Related Simple Assaults 13 18 10 17 19 14 17 17 24 18 13 18 38.5% 19 18 -5.3% 45 49 8.9%Percent DV-Related (Simple Assaults) 46.4% 54.5% 29.4% 60.7% 54.3% 45.2% 54.8% 47.2% 96.0% 48.6% 68.4% 60.0% 44.2% 60.0% 42.5% 57.0% Intimate Partner Victims 11 15 10 12 18 12 13 14 21 16 10 16 60.0% 18 16 -11.1% 43 42 -2.3%
Intimate Partner - Female Victim 10 14 8 10 14 12 10 13 17 13 8 15 13 15 15.4% 37 36 -2.7%Intimate Partner - Male Victim 1 1 2 2 4 0 3 1 4 3 2 1 5 1 6 6
Other Family Victim 2 3 0 5 1 2 4 3 3 2 3 2 1 2 2 7
% Change2009 2010 2011 2012 2013 2014 2015 2016 2017 16 vs. 17
Total Aggravated Assaults 197 230 192 240 165 150 139 148 128 -13.5%Victims of DV-Related Aggravated Assaults 47 59 38 79 41 47 36 51 33 -35.3%Percent DV-Related (Aggravated Assaults) 23.9% 25.7% 19.8% 32.9% 24.8% 31.3% 25.9% 34.5% 25.8% Intimate Partner Victims 39 46 30 59 23 39 29 36 24 -33.3%
Intimate Partner - Female Victim 26 33 23 41 17 27 23 31 15 -51.6%Intimate Partner - Male Victim 13 13 7 18 6 12 6 5 9
Other Family Victim 8 13 8 20 18 8 7 15 9
Total Simple Assaults 684 784 719 813 603 540 460 448 387 -13.6%Victims of DV-Related Simple Assaults 403 411 398 435 348 319 266 285 194 -31.9%Percent DV-Related (Simple Assaults) 58.9% 52.4% 55.4% 53.5% 57.7% 59.1% 57.8% 63.6% 50.1% Intimate Partner Victims 316 336 318 320 278 264 218 236 169 -28.4%
Intimate Partner - Female Victim 267 282 267 263 226 215 189 193 145 -24.9%Intimate Partner - Male Victim 49 54 51 57 52 49 29 43 24 -44.2%
Other Family Victim 87 75 80 115 70 55 48 49 25 -49.0%
Note: Poughkeepsie IBR data is "crunched" into UCR domestic violence crime categories and relationships.
Intimate Partner (Female/Male): includes spouse, ex-spouse, and those in an intimate relationship (including dating or formerly dating relationships, whether or not the intimate partners had ever lived together).
Other Family: includes sibling, child, grandparent, grandchild, in-law, stepparent, stepsibling, and other family blood and in-law relationships
*Percent change is not calculated where counts are less than 10.
Domestic Violence VictimsAs of 04/26/2018
Poughkeepsie City Police Department (IBR)
1403

% ChangeCurrent Current From MonthMonth Month in Previous % Change
Apr 17 May 17 Jun 17 Jul 17 Aug 17 Sep 17 Oct 17 Nov 17 Dec 17 Jan 18 Feb 18 Mar 18 2017 2018 Year 2017 2018 2017-18 2013-17
Felony Arrests within CityVFO 10 10 14 6 10 7 9 10 1 6 3 7 6 7 22 16 -27.3% 23 16 -30.4%Drug 10 11 14 8 10 9 9 9 17 9 5 6 16 6 27 20 -25.9% 22 20 -9.9%VTL 1 9 1 2 4 3 2 2 1 3 0 5 4 5 12 8 6 8
Other 14 13 19 21 15 20 14 11 15 15 13 24 26 24 -7.7% 69 52 -24.6% 54 52 -3.7%
Total Felony 35 43 48 37 39 39 34 32 34 33 21 42 52 42 -19.2% 130 96 -26.2% 105 96 -8.7%
Misdemeanor Arrests within CityVTL 9 12 9 12 4 16 14 18 16 10 7 9 12 9 30 26 -13.3% 29 26 -10.3%
Drug 12 21 10 25 16 17 10 18 11 11 11 15 6 15 23 37 60.9% 28 37 34.1%Other 28 48 44 35 54 38 35 33 29 32 27 32 34 32 -5.9% 101 91 -9.9% 106 91 -14.0%
Total Misdemeanor 49 81 63 72 74 71 59 69 56 53 45 56 52 56 7.7% 154 154 0.0% 162 154 -5.2%
Total Arrest 84 124 111 109 113 110 93 101 90 86 66 98 104 98 -5.8% 284 250 -12.0% 268 250 -6.6%
Parolee Arrests within CityVFO 1 0 1 1 0 1 0 1 0 0 0 0 0 0 1 0 1 0 Drug 3 2 3 0 2 1 2 1 2 1 1 2 2 2 2 4 3 4 VTL 0 0 0 0 0 0 0 0 0 0 0 0 0 0 0 0 0 0
Other 1 0 1 1 1 4 2 1 0 0 1 3 1 3 4 4 2 4
Total Parolee Felonies 5 2 5 2 3 6 4 3 2 1 2 5 3 5 7 8 6 8 Percent of Total Felony 14.3% 4.7% 10.4% 5.4% 7.7% 15.4% 11.8% 9.4% 5.9% 3.0% 9.5% 11.9% 5.8% 11.9% 5.4% 8.3% 6.1% 8.3%
Total Parolee Misdemeanors 2 1 3 1 4 0 2 2 2 0 1 3 2 3 4 4 3 4 Percent of Total Misdemeanor 4.1% 1.2% 4.8% 1.4% 5.4% 0.0% 3.4% 2.9% 3.6% 0.0% 2.2% 5.4% 3.8% 5.4% 2.6% 2.6% 2.0% 2.6%
Total Parolee Arrest 7 3 8 3 7 6 6 5 4 1 3 8 5 8 11 12 9.1% 10 12 Pecent of Total Arrest 8.3% 2.4% 7.2% 2.8% 6.2% 5.5% 6.5% 5.0% 4.4% 1.2% 4.5% 8.2% 4.8% 8.2% 3.9% 4.8% 3.6% 4.8%
Probationer Arrests within CityVFO 0 0 0 0 0 1 0 1 0 3 0 0 0 0 1 3 2 3 Drug 0 0 2 0 1 1 2 0 1 1 0 2 2 2 2 3 2 3 VTL 0 1 0 0 0 0 0 0 0 0 0 1 0 1 2 1 1 1
Other 2 2 0 1 1 2 1 1 1 0 3 2 3 2 5 5 6 5
Total Probationer Felonies 2 3 2 1 2 4 3 2 2 4 3 5 5 5 10 12 20.0% 12 12 1.7%Percent of Total Felony 5.7% 7.0% 4.2% 2.7% 5.1% 10.3% 8.8% 6.3% 5.9% 12.1% 14.3% 11.9% 9.6% 11.9% 7.7% 12.5% 11.2% 12.5%
Total Probationer Misdemeanors 3 2 2 3 3 6 4 3 3 4 2 6 8 6 14 12 -14.3% 15 12 -18.9%Percent of Total Misdemeanor 6.1% 2.5% 3.2% 4.2% 4.1% 8.5% 6.8% 4.3% 5.4% 7.5% 4.4% 10.7% 15.4% 10.7% 9.1% 7.8% 9.1% 7.8%
Total Probationer Arrest 5 5 4 4 5 10 7 5 5 8 5 11 13 11 -15.4% 24 24 0.0% 27 24 -9.8%Pecent of Total Arrest 6.0% 4.0% 3.6% 3.7% 4.4% 9.1% 7.5% 5.0% 5.6% 9.3% 7.6% 11.2% 12.5% 11.2% 8.5% 9.6% 9.9% 9.6%
NOTE: Percentage change is not calculated when counts are fewer than 10 and the 5-year Average is rounded to the nearest whole number.
City of Poughkeepsie ArrestsPreliminary data as of 4/20/2018
Year to Date Comparisons5 Year
Average% Change5 year vs.
20182018
1404
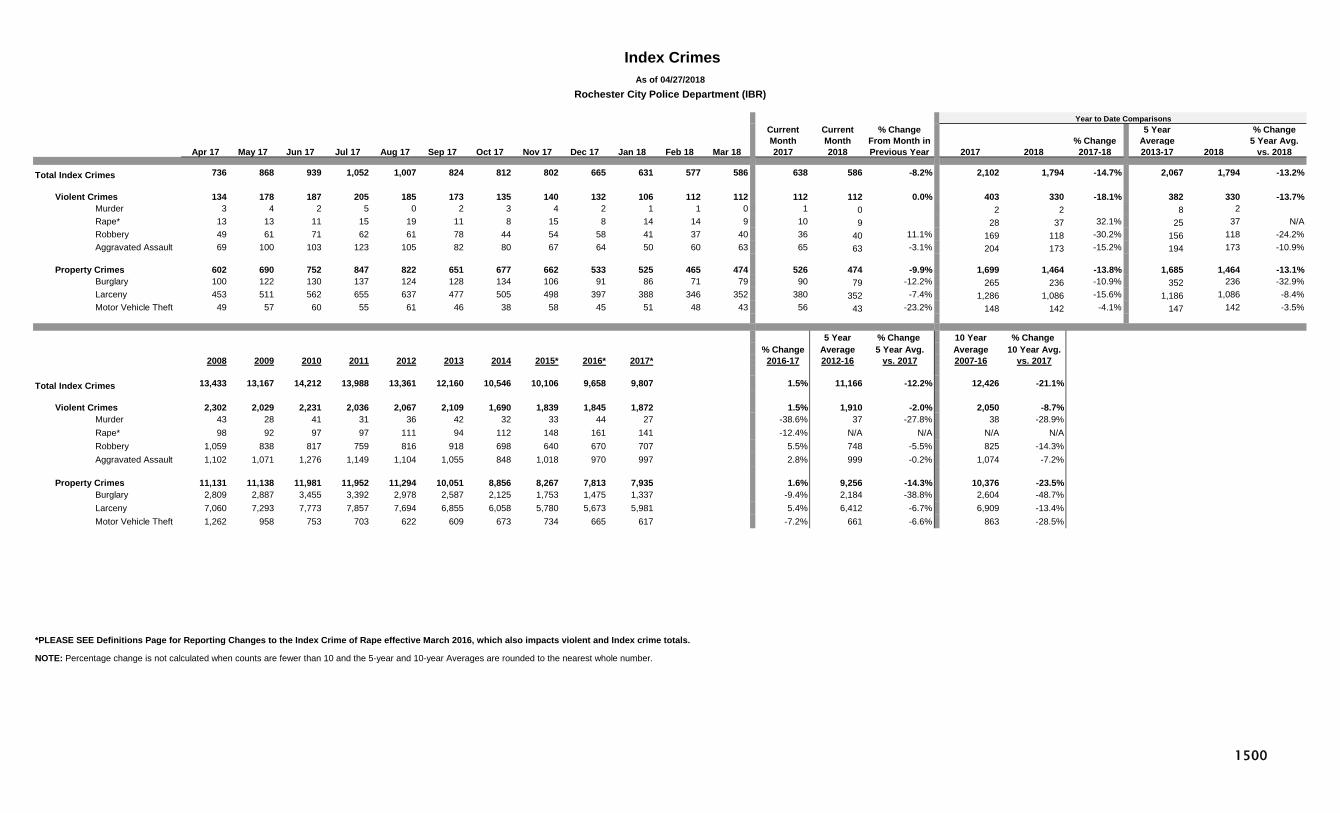
Current CurrentMonth Month
Apr 17 May 17 Jun 17 Jul 17 Aug 17 Sep 17 Oct 17 Nov 17 Dec 17 Jan 18 Feb 18 Mar 18 2017 2018 2013-17
Total Index Crimes 736 868 939 1,052 1,007 824 812 802 665 631 577 586 638 586 -8.2% 2,102 1,794 -14.7% 2,067 1,794 -13.2%
Violent Crimes 134 178 187 205 185 173 135 140 132 106 112 112 112 112 0.0% 403 330 -18.1% 382 330 -13.7%Murder 3 4 2 5 0 2 3 4 2 1 1 0 1 0 2 2 8 2 Rape* 13 13 11 15 19 11 8 15 8 14 14 9 10 9 28 37 32.1% 25 37 N/ARobbery 49 61 71 62 61 78 44 54 58 41 37 40 36 40 11.1% 169 118 -30.2% 156 118 -24.2%Aggravated Assault 69 100 103 123 105 82 80 67 64 50 60 63 65 63 -3.1% 204 173 -15.2% 194 173 -10.9%
Property Crimes 602 690 752 847 822 651 677 662 533 525 465 474 526 474 -9.9% 1,699 1,464 -13.8% 1,685 1,464 -13.1%Burglary 100 122 130 137 124 128 134 106 91 86 71 79 90 79 -12.2% 265 236 -10.9% 352 236 -32.9%Larceny 453 511 562 655 637 477 505 498 397 388 346 352 380 352 -7.4% 1,286 1,086 -15.6% 1,186 1,086 -8.4%Motor Vehicle Theft 49 57 60 55 61 46 38 58 45 51 48 43 56 43 -23.2% 148 142 -4.1% 147 142 -3.5%
5 Year % Change 10 Year % Change % Change Average 5 Year Avg. Average 10 Year Avg.
2008 2009 2010 2011 2012 2013 2014 2015* 2016* 2017* 2016-17 2012-16 vs. 2017 2007-16 vs. 2017
Total Index Crimes 13,433 13,167 14,212 13,988 13,361 12,160 10,546 10,106 9,658 9,807 1.5% 11,166 -12.2% 12,426 -21.1%
Violent Crimes 2,302 2,029 2,231 2,036 2,067 2,109 1,690 1,839 1,845 1,872 1.5% 1,910 -2.0% 2,050 -8.7%Murder 43 28 41 31 36 42 32 33 44 27 -38.6% 37 -27.8% 38 -28.9%Rape* 98 92 97 97 111 94 112 148 161 141 -12.4% N/A N/A N/A N/ARobbery 1,059 838 817 759 816 918 698 640 670 707 5.5% 748 -5.5% 825 -14.3%Aggravated Assault 1,102 1,071 1,276 1,149 1,104 1,055 848 1,018 970 997 2.8% 999 -0.2% 1,074 -7.2%
Property Crimes 11,131 11,138 11,981 11,952 11,294 10,051 8,856 8,267 7,813 7,935 1.6% 9,256 -14.3% 10,376 -23.5%Burglary 2,809 2,887 3,455 3,392 2,978 2,587 2,125 1,753 1,475 1,337 -9.4% 2,184 -38.8% 2,604 -48.7%Larceny 7,060 7,293 7,773 7,857 7,694 6,855 6,058 5,780 5,673 5,981 5.4% 6,412 -6.7% 6,909 -13.4%Motor Vehicle Theft 1,262 958 753 703 622 609 673 734 665 617 -7.2% 661 -6.6% 863 -28.5%
*PLEASE SEE Definitions Page for Reporting Changes to the Index Crime of Rape effective March 2016, which also impacts violent and Index crime totals.
NOTE: Percentage change is not calculated when counts are fewer than 10 and the 5-year and 10-year Averages are rounded to the nearest whole number.
As of 04/27/2018
Index Crimes
Rochester City Police Department (IBR)
Year to Date Comparisons
% Change 2017-182017 2018
% Change From Month in Previous Year
5 Year Average
% Change5 Year Avg.
vs. 20182018
1500
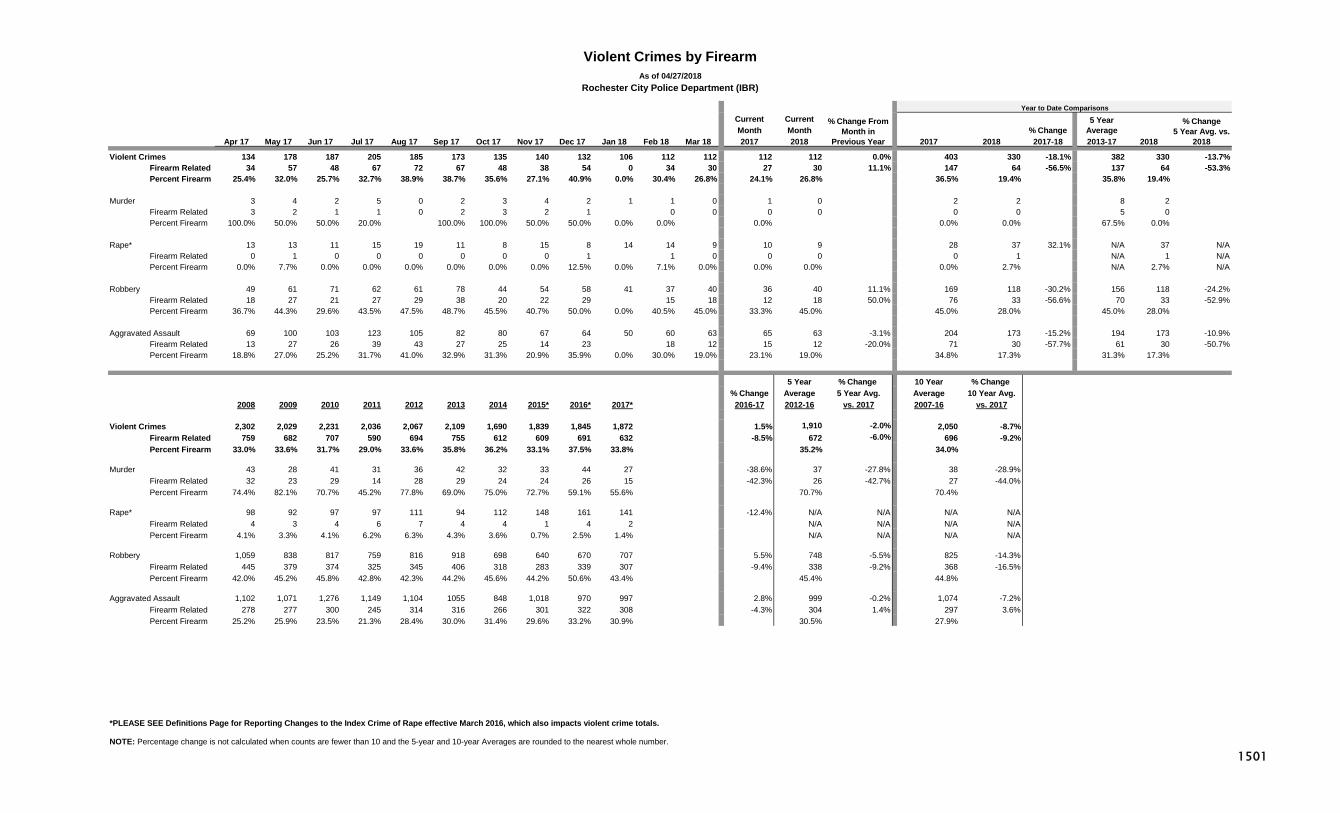
Current CurrentMonth Month % Change
Apr 17 May 17 Jun 17 Jul 17 Aug 17 Sep 17 Oct 17 Nov 17 Dec 17 Jan 18 Feb 18 Mar 18 2017 2018 2017 2018 2017-18 2013-17
Violent Crimes 134 178 187 205 185 173 135 140 132 106 112 112 112 112 0.0% 403 330 -18.1% 382 330 -13.7%Firearm Related 34 57 48 67 72 67 48 38 54 0 34 30 27 30 11.1% 147 64 -56.5% 137 64 -53.3%Percent Firearm 25.4% 32.0% 25.7% 32.7% 38.9% 38.7% 35.6% 27.1% 40.9% 0.0% 30.4% 26.8% 24.1% 26.8% 36.5% 19.4% 35.8% 19.4%
Murder 3 4 2 5 0 2 3 4 2 1 1 0 1 0 2 2 8 2
Firearm Related 3 2 1 1 0 2 3 2 1 0 0 0 0 0 0 5 0 Percent Firearm 100.0% 50.0% 50.0% 20.0% 100.0% 100.0% 50.0% 50.0% 0.0% 0.0% 0.0% 0.0% 0.0% 67.5% 0.0%
Rape* 13 13 11 15 19 11 8 15 8 14 14 9 10 9 28 37 32.1% N/A 37 N/AFirearm Related 0 1 0 0 0 0 0 0 1 1 0 0 0 0 1 N/A 1 N/APercent Firearm 0.0% 7.7% 0.0% 0.0% 0.0% 0.0% 0.0% 0.0% 12.5% 0.0% 7.1% 0.0% 0.0% 0.0% 0.0% 2.7% N/A 2.7% N/A
Robbery 49 61 71 62 61 78 44 54 58 41 37 40 36 40 11.1% 169 118 -30.2% 156 118 -24.2%Firearm Related 18 27 21 27 29 38 20 22 29 15 18 12 18 50.0% 76 33 -56.6% 70 33 -52.9%Percent Firearm 36.7% 44.3% 29.6% 43.5% 47.5% 48.7% 45.5% 40.7% 50.0% 0.0% 40.5% 45.0% 33.3% 45.0% 45.0% 28.0% 45.0% 28.0%
Aggravated Assault 69 100 103 123 105 82 80 67 64 50 60 63 65 63 -3.1% 204 173 -15.2% 194 173 -10.9%Firearm Related 13 27 26 39 43 27 25 14 23 18 12 15 12 -20.0% 71 30 -57.7% 61 30 -50.7%Percent Firearm 18.8% 27.0% 25.2% 31.7% 41.0% 32.9% 31.3% 20.9% 35.9% 0.0% 30.0% 19.0% 23.1% 19.0% 34.8% 17.3% 31.3% 17.3%
5 Year % Change 10 Year % Change % Change Average 5 Year Avg. Average 10 Year Avg.
2008 2009 2010 2011 2012 2013 2014 2015* 2016* 2017* 2016-17 2012-16 vs. 2017 2007-16 vs. 2017
Violent Crimes 2,302 2,029 2,231 2,036 2,067 2,109 1,690 1,839 1,845 1,872 1.5% 1,910 -2.0% 2,050 -8.7%Firearm Related 759 682 707 590 694 755 612 609 691 632 -8.5% 672 -6.0% 696 -9.2%Percent Firearm 33.0% 33.6% 31.7% 29.0% 33.6% 35.8% 36.2% 33.1% 37.5% 33.8% 35.2% 34.0%
Murder 43 28 41 31 36 42 32 33 44 27 -38.6% 37 -27.8% 38 -28.9%Firearm Related 32 23 29 14 28 29 24 24 26 15 -42.3% 26 -42.7% 27 -44.0%Percent Firearm 74.4% 82.1% 70.7% 45.2% 77.8% 69.0% 75.0% 72.7% 59.1% 55.6% 70.7% 70.4%
Rape* 98 92 97 97 111 94 112 148 161 141 -12.4% N/A N/A N/A N/AFirearm Related 4 3 4 6 7 4 4 1 4 2 N/A N/A N/A N/APercent Firearm 4.1% 3.3% 4.1% 6.2% 6.3% 4.3% 3.6% 0.7% 2.5% 1.4% N/A N/A N/A N/A
Robbery 1,059 838 817 759 816 918 698 640 670 707 5.5% 748 -5.5% 825 -14.3%Firearm Related 445 379 374 325 345 406 318 283 339 307 -9.4% 338 -9.2% 368 -16.5%Percent Firearm 42.0% 45.2% 45.8% 42.8% 42.3% 44.2% 45.6% 44.2% 50.6% 43.4% 45.4% 44.8%
Aggravated Assault 1,102 1,071 1,276 1,149 1,104 1055 848 1,018 970 997 2.8% 999 -0.2% 1,074 -7.2%Firearm Related 278 277 300 245 314 316 266 301 322 308 -4.3% 304 1.4% 297 3.6%Percent Firearm 25.2% 25.9% 23.5% 21.3% 28.4% 30.0% 31.4% 29.6% 33.2% 30.9% 30.5% 27.9%
*PLEASE SEE Definitions Page for Reporting Changes to the Index Crime of Rape effective March 2016, which also impacts violent crime totals.
NOTE: Percentage change is not calculated when counts are fewer than 10 and the 5-year and 10-year Averages are rounded to the nearest whole number.
Violent Crimes by FirearmAs of 04/27/2018
Rochester City Police Department (IBR)
% Change From Month in
Previous Year
5 Year Average
% Change5 Year Avg. vs.
20182018
Year to Date Comparisons
1501

Current CurrentMonth Month % Change
Apr 17 May 17 Jun 17 Jul 17 Aug 17 Sep 17 Oct 17 Nov 17 Dec 17 Jan 18 Feb 18 Mar 18 2017 2018 2017 2018 2017-18 2013-17
Shooting Incidents Involving Injury 11 11 13 20 24 13 11 11 11 5 8 2 7 2 31 15 -51.6% 34 15 -56.4%
Shooting Victims (Persons Hit) 11 16 14 23 27 15 11 13 13 6 9 3 8 3 36 18 -50.0% 40 18 -55.0%
Individuals Killed by Gun Violence 3 2 1 1 0 2 3 2 1 0 0 0 0 0 0 0 5 0
5 Year % Change % Change Average 5 Year Avg.
Totals 2009 2010 2011 2012 2013 2014 2015 2016 2017 2016-17 2012-16 vs. 2017
Shooting Incidents Involving Injury 126 155 131 194 192 168 191 156 156 0.0% 180 -13.4%
Shooting Victims (Persons Hit) 152 172 143 218 228 187 225 183 179 -2.2% 208 -14.0%
Individuals Killed by Gun Violence 23 29 14 28 29 24 24 26 15 -42.3% 26 -42.7%
NOTE: Percentage change is not calculated when counts are fewer than 10 and the 5-year Average is rounded to the nearest whole number.
As of 04/06/2018
Firearm Activity
Rochester City Police Department
% Change From Month in Previous Year
Year to Date Comparisons
5 Year Average
% Change5 Year Avg.
vs. 20182018
1502

% Change % ChangeFrom Current Current From Month % Change
Previous Month Month in Previous YTD YTD in Apr 17 May 17 Jun 17 Jul 17 Aug 17 Sep 17 Oct 17 Nov 17 Dec 17 Jan 18 Feb 18 Mar 18 Month 2017 2018 Year 2017 2018 YTD
Total Aggravated Assaults 69 100 103 123 105 82 80 67 64 50 60 63 5.0% 65 63 -3.1% 204 173 -15.2%Victims of DV-Related Aggravated Assaults 27 38 33 28 28 19 25 30 29 14 13 22 69.2% 15 22 46.7% 49 49 0.0%Percent DV-Related (Aggravated Assaults) 39.1% 38.0% 32.0% 22.8% 26.7% 23.2% 31.3% 44.8% 45.3% 28.0% 21.7% 34.9% 23.1% 34.9% 24.0% 28.3% Intimate Partner Victims 21 29 19 17 17 13 17 17 12 10 11 16 45.5% 11 16 45.5% 38 37 -2.6%
Intimate Partner - Female Victim 12 18 13 13 11 9 11 11 7 5 10 10 0.0% 7 10 27 25 -7.4%Intimate Partner - Male Victim 9 11 6 4 6 4 6 6 5 5 1 6 4 6 11 12 9.1%
Other Family Victim 6 9 14 11 11 6 8 13 17 4 2 6 4 6 11 12 9.1%
Total Simple Assaults 375 468 406 410 354 405 395 320 339 353 342 389 13.7% 345 389 12.8% 984 1,084 10.2%Victims of DV-Related Simple Assaults 193 217 187 223 184 180 195 170 177 188 205 223 8.8% 179 223 24.6% 525 616 17.3%Percent DV-Related (Simple Assaults) 51.5% 46.4% 46.1% 54.4% 52.0% 44.4% 49.4% 53.1% 52.2% 53.3% 59.9% 57.3% 51.9% 57.3% 53.4% 56.8% Intimate Partner Victims 157 167 144 183 138 134 155 134 147 149 162 172 6.2% 138 172 24.6% 418 483 15.6%
Intimate Partner - Female Victim 138 154 122 150 124 115 138 112 123 131 144 151 4.9% 122 151 23.8% 371 426 14.8%Intimate Partner - Male Victim 19 13 22 33 14 19 17 22 24 18 18 21 16.7% 16 21 31.3% 47 57 21.3%
Other Family Victim 36 50 43 40 46 46 40 36 30 39 43 51 18.6% 41 51 24.4% 107 133 24.3%
% Change2009 2010 2011 2012 2013 2014 2015 2016 2017 16 vs. 17
Total Aggravated Assaults 1,071 1,276 1,149 1,104 1,055 848 1,018 970 997 2.8%Victims of DV-Related Aggravated Assaults 337 423 376 369 300 213 280 249 306 22.9%Percent DV-Related (Aggravated Assaults) 31.5% 33.2% 32.7% 33.4% 28.4% 25.1% 27.5% 25.7% 30.7% Intimate Partner Victims 259 302 281 265 203 137 194 169 200 18.3%
Intimate Partner - Female Victim 152 188 172 172 130 89 134 112 132 17.9%Intimate Partner - Male Victim 107 114 109 93 73 48 60 57 68 19.3%
Other Family Victim 78 121 95 104 97 76 86 80 106 32.5%
Total Simple Assaults 5,497 5,673 5,234 4,693 4,828 4,623 4,626 4,605 4,456 -3.2%Victims of DV-Related Simple Assaults 2,531 3,076 2,635 2,673 2,660 2,024 2,093 2,142 2,251 5.1%Percent DV-Related (Simple Assaults) 46.0% 54.2% 50.3% 57.0% 55.1% 43.8% 45.2% 46.5% 50.5% Intimate Partner Victims 2,047 2,469 2,137 2,162 2,146 1,580 1,655 1,666 1,777 6.7%
Intimate Partner - Female Victim 1,823 2,177 1,884 1,598 1,563 1,394 1,463 1,476 1,547 4.8%Intimate Partner - Male Victim 224 292 253 220 199 186 192 190 230 21.1%
Other Family Victim 484 607 498 479 439 444 438 476 474 -0.4%
Note: Rochester IBR data is "crunched" into UCR domestic violence crime categories and relationships.
Intimate Partner (Female/Male): includes spouse, ex-spouse, and those in an intimate relationship (including dating or formerly dating relationships, whether or not the intimate partners had ever lived together).
Other Family: includes sibling, child, grandparent, grandchild, in-law, stepparent, stepsibling, and other family blood and in-law relationships
*Percent change is not calculated where counts are less than 10.
Domestic Violence VictimsAs of 04/27/2018
Rochester City Police Department (IBR)
1503

% ChangeCurrent Current From MonthMonth Month in Previous % Change
Apr 17 May 17 Jun 17 Jul 17 Aug 17 Sep 17 Oct 17 Nov 17 Dec 17 Jan 18 Feb 18 Mar 18 2017 2018 Year 2017 2018 2017-18 2013-17
Felony Arrests within CityVFO 55 70 81 90 99 78 71 72 56 66 56 67 82 67 -18.3% 230 189 -17.8% 210 189 -10.2%Drug 30 68 53 37 36 39 42 44 30 37 40 45 38 45 18.4% 121 122 0.8% 115 122 5.9%VTL 41 48 54 50 55 73 38 48 52 55 50 41 48 41 -14.6% 134 146 9.0% 133 146 9.6%
Other 83 106 82 85 71 93 91 80 73 81 64 69 84 69 -17.9% 244 214 -12.3% 239 214 -10.3%
Total Felony 209 292 270 262 261 283 242 244 211 239 210 222 252 222 -11.9% 729 671 -8.0% 697 671 -3.8%
Misdemeanor Arrests within CityVTL 68 57 52 75 47 65 51 55 63 54 43 69 65 69 6.2% 163 166 1.8% 203 166 -18.3%
Drug 36 65 63 44 43 60 58 40 29 37 39 53 31 53 71.0% 116 129 11.2% 160 129 -19.3%Other 320 403 423 423 408 392 381 284 315 295 288 280 313 280 -10.5% 991 863 -12.9% 1,085 863 -20.5%
Total Misdemeanor 424 525 538 542 498 517 490 379 407 386 370 402 409 402 -1.7% 1,270 1,158 -8.8% 1,448 1,158 -20.0%
Total Arrest 633 817 808 804 759 800 732 623 618 625 580 624 661 624 -5.6% 1,999 1,829 -8.5% 2,146 1,829 -14.8%
Parolee Arrests within CityVFO 2 5 6 6 10 3 4 4 2 5 1 5 7 5 20 11 -45.0% 12 11 -9.8%Drug 2 7 5 3 2 6 2 3 0 5 3 3 3 3 10 11 10.0% 7 11 VTL 3 1 2 2 3 2 0 1 2 0 1 2 4 2 7 3 5 3
Other 3 0 5 1 2 5 3 4 1 4 1 2 5 2 21 7 12 7
Total Parolee Felonies 10 13 18 12 17 16 9 12 5 14 6 12 19 12 -36.8% 58 32 -44.8% 36 32 -11.1%Percent of Total Felony 4.8% 4.5% 6.7% 4.6% 6.5% 5.7% 3.7% 4.9% 2.4% 5.9% 2.9% 5.4% 7.5% 5.4% 8.0% 4.8% 5.2% 4.8%
Total Parolee Misdemeanors 13 19 21 21 7 16 12 7 10 12 14 21 12 21 75.0% 52 47 -9.6% 44 47 5.9%Percent of Total Misdemeanor 3.1% 3.6% 3.9% 3.9% 1.4% 3.1% 2.4% 1.8% 2.5% 3.1% 3.8% 5.2% 2.9% 5.2% 4.1% 4.1% 3.1% 4.1%
Total Parolee Arrest 23 32 39 33 24 32 21 19 15 26 20 33 31 33 6.5% 110 79 -28.2% 80 79 -1.7%Pecent of Total Arrest 3.6% 3.9% 4.8% 4.1% 3.2% 4.0% 2.9% 3.0% 2.4% 4.2% 3.4% 5.3% 4.7% 5.3% 5.5% 4.3% 3.7% 4.3%
Probationer Arrests within CityVFO 6 8 11 9 6 5 9 9 2 5 3 5 5 5 21 13 -38.1% 22 13 -40.9%Drug 4 5 6 1 3 2 7 2 3 2 3 10 4 10 18 15 -16.7% 15 15 -1.3%VTL 4 6 5 8 7 12 1 6 10 6 10 5 6 5 14 21 50.0% 17 21 25.0%
Other 8 9 13 7 6 11 10 7 6 10 10 7 6 7 21 27 28.6% 24 27 11.6%
Total Probationer Felonies 22 28 35 25 22 30 27 24 21 23 26 27 21 27 28.6% 74 76 2.7% 78 76 -2.8%Percent of Total Felony 10.5% 9.6% 13.0% 9.5% 8.4% 10.6% 11.2% 9.8% 10.0% 9.6% 12.4% 12.2% 8.3% 12.2% 10.2% 11.3% 11.2% 11.3%
Total Probationer Misdemeanors 34 30 37 46 48 40 30 30 33 40 29 29 29 29 0.0% 92 98 6.5% 109 98 -10.3%Percent of Total Misdemeanor 8.0% 5.7% 6.9% 8.5% 9.6% 7.7% 6.1% 7.9% 8.1% 10.4% 7.8% 7.2% 7.1% 7.2% 7.2% 8.5% 7.5% 8.5%
Total Probationer Arrest 56 58 72 71 70 70 57 54 54 63 55 56 50 56 12.0% 166 174 4.8% 187 174 -7.2%Pecent of Total Arrest 8.8% 7.1% 8.9% 8.8% 9.2% 8.8% 7.8% 8.7% 8.7% 10.1% 9.5% 9.0% 7.6% 9.0% 8.3% 9.5% 8.7% 9.5%
NOTE: Percentage change is not calculated when counts are fewer than 10 and the 5-year Average is rounded to the nearest whole number.
City of Rochester ArrestsPreliminary data as of 4/20/2018
5 Year Average
% Change5 year vs.
20182018
Year to Date Comparisons
1504

Current CurrentMonth Month
Apr 17 May 17 Jun 17 Jul 17 Aug 17 Sep 17 Oct 17 Nov 17 Dec 17 Jan 18 Feb 18 Mar 18 2017 2018 2013-17
Total Index Crimes 205 256 227 232 217 221 242 240 226 219 206 214 185 214 15.7% 569 639 12.3% 602 639 6.1%
Violent Crimes 47 64 46 58 51 57 44 43 34 48 41 53 55 53 -3.6% 133 142 6.8% 138 142 2.7%Murder 0 0 0 1 0 0 0 0 0 0 0 0 1 0 1 0 2 0 Rape* 2 3 6 5 6 9 4 5 4 3 9 8 5 8 14 20 42.9% 14 20 N/ARobbery 16 21 8 12 9 17 10 18 5 12 8 11 11 11 0.0% 25 31 24.0% 36 31 -14.8%Aggravated Assault 29 40 32 40 36 31 30 20 25 33 24 34 38 34 -10.5% 93 91 -2.2% 86 91 5.8%
Property Crimes 158 192 181 174 166 164 198 197 192 171 165 161 130 161 23.8% 436 497 14.0% 464 497 7.2%Burglary 25 30 35 28 24 31 43 44 28 30 37 32 15 32 113.3% 60 99 65.0% 104 99 -5.2%Larceny 120 152 134 133 129 115 144 143 143 124 105 108 103 108 4.9% 323 337 4.3% 326 337 3.5%Motor Vehicle Theft 13 10 12 13 13 18 11 10 21 17 23 21 12 21 75.0% 53 61 15.1% 34 61 80.5%
5 Year % Change 10 Year % Change % Change Average 5 Year Avg. Average 10 Year Avg.
2008 2009 2010 2011 2012 2013 2014 2015* 2016* 2017* 2016-17 2012-16 vs. 2017 2007-16 vs. 2017
Total Index Crimes 3,708 3,928 4,066 3,734 3,455 3,414 3,045 2,634 2,708 2,635 -2.7% 3,051 -13.6% 3,425 -23.1%
Violent Crimes 654 592 679 636 624 610 549 596 600 577 -3.8% 596 -3.2% 615 -6.1%Murder 9 7 8 4 7 8 5 10 7 2 7 7 Rape* 35 31 53 40 32 31 30 68 59 58 -1.7% N/A N/A N/A N/ARobbery 288 243 256 205 199 205 156 155 146 141 -3.4% 172 -18.1% 212 -33.4%Aggravated Assault 322 311 362 387 386 366 358 363 388 376 -3.1% 372 1.0% 355 6.1%
Property Crimes 3,054 3,336 3,387 3,098 2,831 2,804 2,496 2,038 2,108 2,058 -2.4% 2,455 -16.2% 2,810 -26.8%Burglary 925 822 856 901 810 771 634 464 379 348 -8.2% 612 -43.1% 737 -52.8%Larceny 1,905 2,299 2,347 2,023 1,878 1,879 1,745 1,446 1,532 1,536 0.3% 1,696 -9.4% 1,891 -18.8%Motor Vehicle Theft 224 215 184 174 143 154 117 128 197 174 -11.7% 148 17.7% 183 -4.7%
*PLEASE SEE Definitions Page for Reporting Changes to the Index Crime of Rape effective March 2016, which also impacts violent and Index crime totals.
NOTE: Percentage change is not calculated when counts are fewer than 10 and the 5-year and 10-year Averages are rounded to the nearest whole number.
Index CrimesAs of 04/06/2018
Schenectady City Police Department (IBR)
Year to Date Comparisons
% Change 2017-182017 2018
% Change From Month in Previous Year
5 Year Average
% Change5 Year Avg.
vs. 20182018
1600

Current CurrentMonth Month % Change
Apr 17 May 17 Jun 17 Jul 17 Aug 17 Sep 17 Oct 17 Nov 17 Dec 17 Jan 18 Feb 18 Mar 18 2017 2018 2017 2018 2017-18 2013-17
Violent Crimes 47 64 46 58 51 57 44 43 34 48 41 53 55 53 -3.6% 133 142 6.8% 138 142 2.7%Firearm Related 3 9 10 9 7 10 9 11 3 3 4 5 13 5 21 12 -42.9% 23 12 -47.8%Percent Firearm 6.4% 14.1% 21.7% 15.5% 13.7% 17.5% 20.5% 25.6% 8.8% 6.3% 9.8% 9.4% 23.6% 9.4% 15.8% 8.5% 16.6% 8.5%
Murder 0 0 0 1 0 0 0 0 0 0 0 0 1 0 1 0 2 0
Firearm Related 0 0 0 1 0 0 0 0 0 0 0 0 0 0 0 0 1 0 Percent Firearm 100.0% 0.0% 0.0% 30.0%
Rape* 2 3 6 5 6 9 4 5 4 3 9 8 5 8 14 20 42.9% N/A 20 N/AFirearm Related 0 0 0 0 0 0 0 0 0 0 0 0 1 0 1 0 N/A 0 N/APercent Firearm 0.0% 0.0% 0.0% 0.0% 0.0% 0.0% 0.0% 0.0% 0.0% 0.0% 0.0% 0.0% 20.0% 0.0% 7.1% 0.0% N/A 0.0% N/A
Robbery 16 21 8 12 9 17 10 18 5 12 8 11 11 11 0.0% 25 31 24.0% 36 31 -14.8%Firearm Related 2 5 2 1 2 5 5 8 2 1 2 1 2 1 6 4 9 4 Percent Firearm 12.5% 23.8% 25.0% 8.3% 22.2% 29.4% 50.0% 44.4% 40.0% 8.3% 25.0% 9.1% 18.2% 9.1% 24.0% 12.9% 24.2% 12.9%
Aggravated Assault 29 40 32 40 36 31 30 20 25 33 24 34 38 34 -10.5% 93 91 -2.2% 86 91 5.8%Firearm Related 1 4 8 7 5 5 4 3 1 2 2 4 10 4 14 8 13 8 Percent Firearm 3.4% 10.0% 25.0% 17.5% 13.9% 16.1% 13.3% 15.0% 4.0% 6.1% 8.3% 11.8% 26.3% 11.8% 15.1% 8.8% 15.3% 8.8%
5 Year % Change 10 Year % Change % Change Average 5 Year Avg. Average 10 Year Avg.
2008 2009 2010 2011 2012 2013 2014 2015* 2016* 2017* 2016-17 2012-16 vs. 2017 2007-16 vs. 2017
Violent Crimes 654 592 679 636 624 610 549 596 600 577 -3.8% 596 -3.2% 615 -6.1%Firearm Related 163 125 138 125 91 107 100 112 96 92 -4.2% 101 -9.1% 120 -23.3%Percent Firearm 24.9% 21.1% 20.3% 19.7% 14.6% 17.5% 18.2% 18.8% 16.0% 15.9% 17.0% 19.5%
Murder 9 7 8 4 7 8 5 10 7 2 7 7 Firearm Related 7 5 5 2 2 2 5 4 6 1 4 4 Percent Firearm 77.8% 71.4% 62.5% 50.0% 28.6% 25.0% 100.0% 40.0% 85.7% 50.0% 55.9% 62.1%
Rape* 35 31 53 40 32 31 30 68 59 58 -1.7% N/A N/A N/A N/AFirearm Related 2 1 0 2 0 3 1 0 0 1 N/A N/A N/A N/APercent Firearm 5.7% 3.2% 0.0% 5.0% 0.0% 9.7% 3.3% 0.0% 0.0% 1.7% N/A N/A N/A N/A
Robbery 288 243 256 205 199 205 156 155 146 141 -3.4% 172 -18.1% 212 -33.4%Firearm Related 78 65 57 51 31 49 40 31 31 38 22.6% 36 4.4% 50 -23.5%Percent Firearm 27.1% 26.7% 22.3% 24.9% 15.6% 23.9% 25.6% 20.0% 21.2% 27.0% 21.3% 23.1%
Aggravated Assault 322 311 362 387 386 366 358 363 388 376 -3.1% 372 1.0% 355 6.1%Firearm Related 76 54 76 70 58 53 54 77 59 52 -11.9% 60 -13.6% 65 -20.0%Percent Firearm 23.6% 17.4% 21.0% 18.1% 15.0% 14.5% 15.1% 21.2% 15.2% 13.8% 16.2% 18.5%
*PLEASE SEE Definitions Page for Reporting Changes to the Index Crime of Rape effective March 2016, which also impacts violent crime totals.
NOTE: Percentage change is not calculated when counts are fewer than 10 and the 5-year and 10-year Averages are rounded to the nearest whole number.
Violent Crimes by FirearmAs of 04/06/2018
Schenectady City Police Department (IBR)
% Change From Month in
Previous Year
5 Year Average
% Change5 Year Avg. vs.
20182018
Year to Date Comparisons
1601

Current CurrentMonth Month % Change
Apr 17 May 17 Jun 17 Jul 17 Aug 17 Sep 17 Oct 17 Nov 17 Dec 17 Jan 18 Feb 18 Mar 18 2017 2018 2017 2018 2017-18 2013-17
Shooting Incidents Involving Injury 1 0 1 2 1 3 0 1 1 0 0 1 1 1 2 1 3 1
Shooting Victims (Persons Hit) 1 0 1 3 1 3 0 1 1 0 0 1 1 1 2 1 3 1
Individuals Killed by Gun Violence 0 0 0 1 0 0 0 0 0 0 0 0 0 0 0 0 1 0
5 Year % Change % Change Average 5 Year Avg.
Totals 2009 2010 2011 2012 2013 2014 2015 2016 2017 2016-17 2012-16 vs. 2017
Shooting Incidents Involving Injury 15 24 21 21 15 15 24 18 12 -33.3% 19 -35.5%
Shooting Victims (Persons Hit) 16 24 26 24 16 16 25 20 13 -35.0% 20 -35.6%
Individuals Killed by Gun Violence 5 5 2 2 2 5 4 6 1 4
NOTE: Percentage change is not calculated when counts are fewer than 10 and the 5-year Average is rounded to the nearest whole number.
Firearm Activity As of 04/06/2018
Schenectady City Police Department
Year to Date Comparisons
% Change From Month in Previous Year
5 Year Average
% Change5 Year Avg.
vs. 20182018
1602

% Change % ChangeFrom Current Current From Month % Change
Previous Month Month in Previous YTD YTD in Apr 17 May 17 Jun 17 Jul 17 Aug 17 Sep 17 Oct 17 Nov 17 Dec 17 Jan 18 Feb 18 Mar 18 Month 2017 2018 Year 2017 2018 YTD
Total Aggravated Assaults 29 40 32 40 36 31 30 20 25 33 24 34 41.7% 38 34 -10.5% 93 91 -2.2%Victims of DV-Related Aggravated Assaults 8 10 6 4 10 8 7 3 6 9 0 0 8 0 26 9 Percent DV-Related (Aggravated Assaults) 27.6% 25.0% 18.8% 10.0% 27.8% 25.8% 23.3% 15.0% 24.0% 27.3% 0.0% 0.0% 21.1% 0.0% 28.0% 9.9% Intimate Partner Victims 6 7 4 0 8 7 2 2 4 6 0 0 6 0 17 6
Intimate Partner - Female Victim 6 3 2 0 7 6 2 1 3 4 0 0 4 0 9 4 Intimate Partner - Male Victim 0 4 2 0 1 1 0 1 1 2 0 0 2 0 8 2
Other Family Victim 2 3 2 4 2 1 5 1 2 3 0 0 2 0 9 3
Total Simple Assaults 155 152 167 150 159 154 168 127 98 148 124 161 29.8% 136 161 18.4% 384 433 12.8%Victims of DV-Related Simple Assaults 75 74 95 84 90 85 88 74 68 65 0 0 81 0 221 65 -70.6%Percent DV-Related (Simple Assaults) 48.4% 48.7% 56.9% 56.0% 56.6% 55.2% 52.4% 58.3% 69.4% 43.9% 0.0% 0.0% 59.6% 0.0% 57.6% 15.0% Intimate Partner Victims 54 61 73 64 71 65 73 54 52 49 0 0 61 0 167 49 -70.7%
Intimate Partner - Female Victim 44 43 58 54 58 56 66 44 41 41 0 0 52 0 143 41 -71.3%Intimate Partner - Male Victim 10 18 15 10 13 9 7 10 11 8 0 0 9 0 24 8
Other Family Victim 21 13 22 20 19 20 15 20 16 16 0 0 20 0 54 16 -70.4%
% Change2009 2010 2011 2012 2013 2014 2015 2016 2017 16 vs. 17
Total Aggravated Assaults 311 362 387 386 366 358 363 388 376 -3.1%Victims of DV-Related Aggravated Assaults 114 130 103 128 103 109 95 113 88 -22.1%Percent DV-Related (Aggravated Assaults) 36.7% 35.9% 26.6% 33.2% 28.1% 30.4% 26.2% 29.1% 23.4% Intimate Partner Victims 76 89 68 87 56 72 65 86 57 -33.7%
Intimate Partner - Female Victim 57 63 51 66 33 45 47 56 39 -30.4%Intimate Partner - Male Victim 19 26 17 21 23 27 18 30 18 -40.0%
Other Family Victim 38 41 35 41 47 37 30 27 31 14.8%
Total Simple Assaults 2,769 2,816 2,499 2,439 2,341 2,050 1,305 1,668 1,714 2.8%Victims of DV-Related Simple Assaults 1,597 1,639 1,228 1,290 935 937 735 918 954 3.9%Percent DV-Related (Simple Assaults) 57.7% 58.2% 49.1% 52.9% 39.9% 45.7% 56.3% 55.0% 55.7% Intimate Partner Victims 1,150 1,170 815 930 579 642 551 697 734 5.3%
Intimate Partner - Female Victim 980 960 677 767 476 522 461 573 607 5.9%Intimate Partner - Male Victim 170 210 138 163 103 120 90 124 127 2.4%
Other Family Victim 447 469 413 360 356 295 184 221 220 -0.5%
Note: Schenectady IBR data is "crunched" into UCR domestic violence crime categories and relationships.
Intimate Partner (Female/Male): includes spouse, ex-spouse, and those in an intimate relationship (including dating or formerly dating relationships, whether or not the intimate partners had ever lived together).
Other Family: includes sibling, child, grandparent, grandchild, in-law, stepparent, stepsibling, and other family blood and in-law relationships
*Percent change is not calculated where counts are less than 10.
Domestic Violence VictimsAs of 04/06/2018
Schenectady City Police Department (IBR)
1603

% ChangeCurrent Current From MonthMonth Month in Previous % Change
Apr 17 May 17 Jun 17 Jul 17 Aug 17 Sep 17 Oct 17 Nov 17 Dec 17 Jan 18 Feb 18 Mar 18 2017 2018 Year 2017 2018 2017-18 2013-17
Felony Arrests within CityVFO 10 18 12 17 24 19 9 23 16 24 12 24 21 24 14.3% 45 60 33.3% 59 60 1.0%Drug 26 20 33 20 27 22 15 15 9 36 21 19 30 19 -36.7% 76 76 0.0% 69 76 10.8%VTL 4 5 2 4 3 2 3 3 3 6 4 5 4 5 7 15 9 15
Other 42 42 63 43 57 44 49 28 39 61 37 43 45 43 -4.4% 122 141 15.6% 117 141 20.9%
Total Felony 82 85 110 84 111 87 76 69 67 127 74 91 100 91 -9.0% 250 292 16.8% 254 292 15.1%
Misdemeanor Arrests within CityVTL 8 11 6 2 7 5 12 15 9 4 7 8 9 8 23 19 -17.4% 28 19 -31.2%
Drug 10 6 15 13 13 23 20 19 14 12 10 17 10 17 70.0% 24 39 62.5% 39 39 -1.0%Other 111 128 118 104 99 109 109 97 84 99 100 112 98 112 14.3% 292 311 6.5% 355 311 -12.3%
Total Misdemeanor 129 145 139 119 119 137 141 131 107 115 117 137 117 137 17.1% 339 369 8.8% 422 369 -12.5%
Total Arrest 211 230 249 203 230 224 217 200 174 242 191 228 217 228 5.1% 589 661 12.2% 675 661 -2.1%
Parolee Arrests within CityVFO 1 1 2 1 3 0 0 1 2 0 1 1 1 1 4 2 5 2 Drug 5 3 1 6 5 7 3 7 2 4 1 4 3 4 12 9 9 9 VTL 0 1 0 0 0 0 0 0 0 0 0 0 0 0 0 0 0 0
Other 0 1 6 4 4 2 4 1 1 3 11 4 0 4 5 18 6 18
Total Parolee Felonies 6 6 9 11 12 9 7 9 5 7 13 9 4 9 21 29 38.1% 21 29 38.1%Percent of Total Felony 7.3% 7.1% 8.2% 13.1% 10.8% 10.3% 9.2% 13.0% 7.5% 5.5% 17.6% 9.9% 4.0% 9.9% 8.4% 9.9% 8.3% 9.9%
Total Parolee Misdemeanors 4 7 4 5 9 8 7 13 6 2 6 6 5 6 12 14 16.7% 14 14 0.0%Percent of Total Misdemeanor 3.1% 4.8% 2.9% 4.2% 7.6% 5.8% 5.0% 9.9% 5.6% 1.7% 5.1% 4.4% 4.3% 4.4% 3.5% 3.8% 3.3% 3.8%
Total Parolee Arrest 10 13 13 16 21 17 14 22 11 9 19 15 9 15 33 43 30.3% 35 43 22.9%Pecent of Total Arrest 4.7% 5.7% 5.2% 7.9% 9.1% 7.6% 6.5% 11.0% 6.3% 3.7% 9.9% 6.6% 4.1% 6.6% 5.6% 6.5% 5.2% 6.5%
Probationer Arrests within CityVFO 1 0 0 2 2 2 0 3 1 3 0 2 1 2 2 5 4 5 Drug 0 0 4 3 2 0 0 0 0 3 2 0 1 0 4 5 5 5 VTL 0 0 1 0 1 0 0 0 0 1 1 0 1 0 1 2 1 2
Other 7 1 5 2 3 1 5 2 5 14 3 3 7 3 20 20 0.0% 13 20 58.7%
Total Probationer Felonies 8 1 10 7 8 3 5 5 6 21 6 5 10 5 27 32 18.5% 22 32 45.5%Percent of Total Felony 9.8% 1.2% 9.1% 8.3% 7.2% 3.4% 6.6% 7.2% 9.0% 16.5% 8.1% 5.5% 10.0% 5.5% 10.8% 11.0% 8.7% 11.0%
Total Probationer Misdemeanors 8 10 12 8 10 11 10 8 7 10 6 4 11 4 24 20 -16.7% 30 20 -33.3%Percent of Total Misdemeanor 6.2% 6.9% 8.6% 6.7% 8.4% 8.0% 7.1% 6.1% 6.5% 8.7% 5.1% 2.9% 9.4% 2.9% 7.1% 5.4% 7.1% 5.4%
Total Probationer Arrest 16 11 22 15 18 14 15 13 13 31 12 9 21 9 51 52 2.0% 52 52 0.0%Pecent of Total Arrest 7.6% 4.8% 8.8% 7.4% 7.8% 6.3% 6.9% 6.5% 7.5% 12.8% 6.3% 3.9% 9.7% 3.9% 8.7% 7.9% 7.7% 7.9%
NOTE: Percentage change is not calculated when counts are fewer than 10 and the 5-year Average is rounded to the nearest whole number.
City of Schenectady ArrestsPreliminary data as of 4/20/2018
Year to Date Comparisons5 Year
Average% Change5 year vs.
20182018
1604

Current CurrentMonth Month
Apr 17 May 17 Jun 17 Jul 17 Aug 17 Sep 17 Oct 17 Nov 17 Dec 17 Jan 18 Feb 18 Mar 18 2017 2018 2013-17
Total Index Crimes 48 31 46 46 48 45 48 44 48 45 44 32 34 32 -5.9% 119 121 1.7% 117 121 3.2%
Violent Crimes 9 10 12 13 15 11 12 7 8 8 13 13 16 13 -18.8% 36 34 -5.6% 31 34 9.7%Murder 0 0 0 0 0 0 0 0 0 0 0 0 0 0 0 0 0 0 Rape* 3 1 3 2 2 3 4 2 2 0 1 6 0 6 6 7 2 7 N/ARobbery 0 3 3 2 7 1 2 4 3 6 6 0 3 0 6 12 8 12 Aggravated Assault 6 6 6 9 6 7 6 1 3 2 6 7 13 7 24 15 -37.5% 21 15 -27.9%
Property Crimes 39 21 34 33 33 34 36 37 40 37 31 19 18 19 5.6% 83 87 4.8% 86 87 0.9%Burglary 4 0 2 2 2 4 3 6 6 3 1 2 2 2 6 6 12 6 Larceny 35 17 32 31 29 29 33 29 32 34 28 16 16 16 0.0% 73 78 6.8% 71 78 10.2%Motor Vehicle Theft 0 4 0 0 2 1 0 2 2 0 2 1 0 1 4 3 4 3
5 Year % Change 10 Year % Change % Change Average 5 Year Avg. Average 10 Year Avg.
2008 2009 2010 2011 2012 2013 2014 2015* 2016* 2017* 2016-17 2012-16 vs. 2017 2007-16 vs. 2017
Total Index Crimes 721 633 765 639 709 539 519 524 511 523 2.3% 560 -6.7% 622 -15.8%
Violent Crimes 202 169 139 162 212 134 128 156 125 133 6.4% 151 -11.9% 163 -18.5%Murder 1 0 1 0 0 2 0 1 1 0 1 1 Rape* 7 5 4 10 8 9 5 17 14 28 100.0% N/A N/A N/A N/ARobbery 63 57 43 61 67 34 38 45 39 31 -20.5% 45 -30.5% 52 -40.2%Aggravated Assault 131 107 91 91 137 89 85 93 71 74 4.2% 95 -22.1% 102 -27.2%
Property Crimes 519 464 626 477 497 405 391 368 386 390 1.0% 409 -4.7% 458 -14.9%Burglary 85 80 106 80 91 53 77 32 37 35 -5.4% 58 -39.7% 73 -52.1%Larceny 410 362 494 378 376 336 303 325 336 340 1.2% 335 1.4% 365 -6.7%Motor Vehicle Theft 24 22 26 19 30 16 11 11 13 15 15.4% 16 -7.4% 21 -27.9%
*PLEASE SEE Definitions Page for Reporting Changes to the Index Crime of Rape effective March 2016, which also impacts violent and Index crime totals.
NOTE: Percentage change is not calculated when counts are fewer than 10 and the 5-year and 10-year Averages are rounded to the nearest whole number.
As of 04/30/2018
Index Crimes
Spring Valley Village Police Department (IBR)
Year to Date Comparisons
% Change 2017-182017 2018
% Change From Month in Previous Year
5 Year Average
% Change5 Year Avg.
vs. 20182018
1700

Current CurrentMonth Month % Change
Apr 17 May 17 Jun 17 Jul 17 Aug 17 Sep 17 Oct 17 Nov 17 Dec 17 Jan 18 Feb 18 Mar 18 2017 2018 2017 2018 2017-18 2013-17
Violent Crimes 9 10 12 13 15 11 12 7 8 8 13 13 16 13 -18.8% 36 34 -5.6% 31 34 9.7%Firearm Related 0 0 1 0 0 1 0 0 1 2 0 0 3 0 3 2 3 2 Percent Firearm 0.0% 0.0% 8.3% 0.0% 0.0% 9.1% 0.0% 0.0% 12.5% 25.0% 0.0% 0.0% 18.8% 0.0% 8.3% 5.9% 10.3% 5.9%
Murder 0 0 0 0 0 0 0 0 0 0 0 0 0 0 0 0 0 0
Firearm Related 0 0 0 0 0 0 0 0 0 0 0 0 0 0 0 0 0 0 Percent Firearm
Rape* 3 1 3 2 2 3 4 2 2 0 1 6 0 6 6 7 N/A 7 N/AFirearm Related 0 0 0 0 0 0 0 0 0 0 0 0 0 0 0 0 N/A 0 N/APercent Firearm 0.0% 0.0% 0.0% 0.0% 0.0% 0.0% 0.0% 0.0% 0.0% 0.0% 0.0% 0.0% 0.0% 0.0% N/A 0.0% N/A
Robbery 0 3 3 2 7 1 2 4 3 6 6 0 3 0 6 12 8 12 Firearm Related 0 0 1 0 0 1 0 0 1 2 0 0 1 0 1 2 1 2 Percent Firearm 0.0% 33.3% 0.0% 0.0% 100.0% 0.0% 0.0% 33.3% 33.3% 0.0% 33.3% 16.7% 16.7% 12.8% 16.7%
Aggravated Assault 6 6 6 9 6 7 6 1 3 2 6 7 13 7 24 15 -37.5% 21 15 -27.9%Firearm Related 0 0 0 0 0 0 0 0 0 0 0 0 2 0 2 0 2 0 Percent Firearm 0.0% 0.0% 0.0% 0.0% 0.0% 0.0% 0.0% 0.0% 0.0% 0.0% 0.0% 0.0% 15.4% 0.0% 8.3% 0.0% 10.6% 0.0%
5 Year % Change 10 Year % Change % Change Average 5 Year Avg. Average 10 Year Avg.
2008 2009 2010 2011 2012 2013 2014 2015* 2016* 2017* 2016-17 2012-16 vs. 2017 2007-16 vs. 2017
Violent Crimes 202 169 139 162 212 134 128 156 125 133 6.4% 151 -11.9% 163 -18.5%Firearm Related 9 29 21 18 24 7 12 12 12 6 13 16 Percent Firearm 4.5% 17.2% 15.1% 11.1% 11.3% 5.2% 9.4% 7.7% 9.6% 4.5% 8.6% 10.0%
Murder 1 0 1 0 0 2 0 1 1 0 1 1 Firearm Related 0 0 0 0 0 0 0 0 0 0 0 0 Percent Firearm 0.0% 0.0% 0.0% 0.0% 0.0% 0.0% 0.0% 0.0% 0.0% 0.0% 0.0% 0.0%
Rape* 7 5 4 10 8 9 5 17 14 28 100.0% N/A N/A N/A N/AFirearm Related 0 0 0 0 0 0 0 0 0 0 N/A N/A N/A N/APercent Firearm 0.0% 0.0% 0.0% 0.0% 0.0% 0.0% 0.0% 0.0% 0.0% 0.0% N/A N/A N/A N/A
Robbery 63 57 43 61 67 34 38 45 39 31 -20.5% 45 -30.5% 52 -40.2%Firearm Related 4 18 9 14 16 4 3 6 1 4 6 9 Percent Firearm 6.3% 31.6% 20.9% 23.0% 23.9% 11.8% 7.9% 13.3% 2.6% 12.9% 11.9% 16.1%
Aggravated Assault 131 107 91 91 137 89 85 93 71 74 4.2% 95 -22.1% 102 -27.2%Firearm Related 5 11 12 4 8 3 9 6 11 2 7 7 Percent Firearm 3.8% 10.3% 13.2% 4.4% 5.8% 3.4% 10.6% 6.5% 15.5% 2.7% 8.3% 7.7%
*PLEASE SEE Definitions Page for Reporting Changes to the Index Crime of Rape effective March 2016, which also impacts violent crime totals.
NOTE: Percentage change is not calculated when counts are fewer than 10 and the 5-year and 10-year Averages are rounded to the nearest whole number.
Violent Crimes by FirearmAs of 04/30/2018
Spring Valley Village Police Department (IBR)
% Change From Month in
Previous Year
5 Year Average
% Change5 Year Avg. vs.
20182018
Year to Date Comparisons
1701
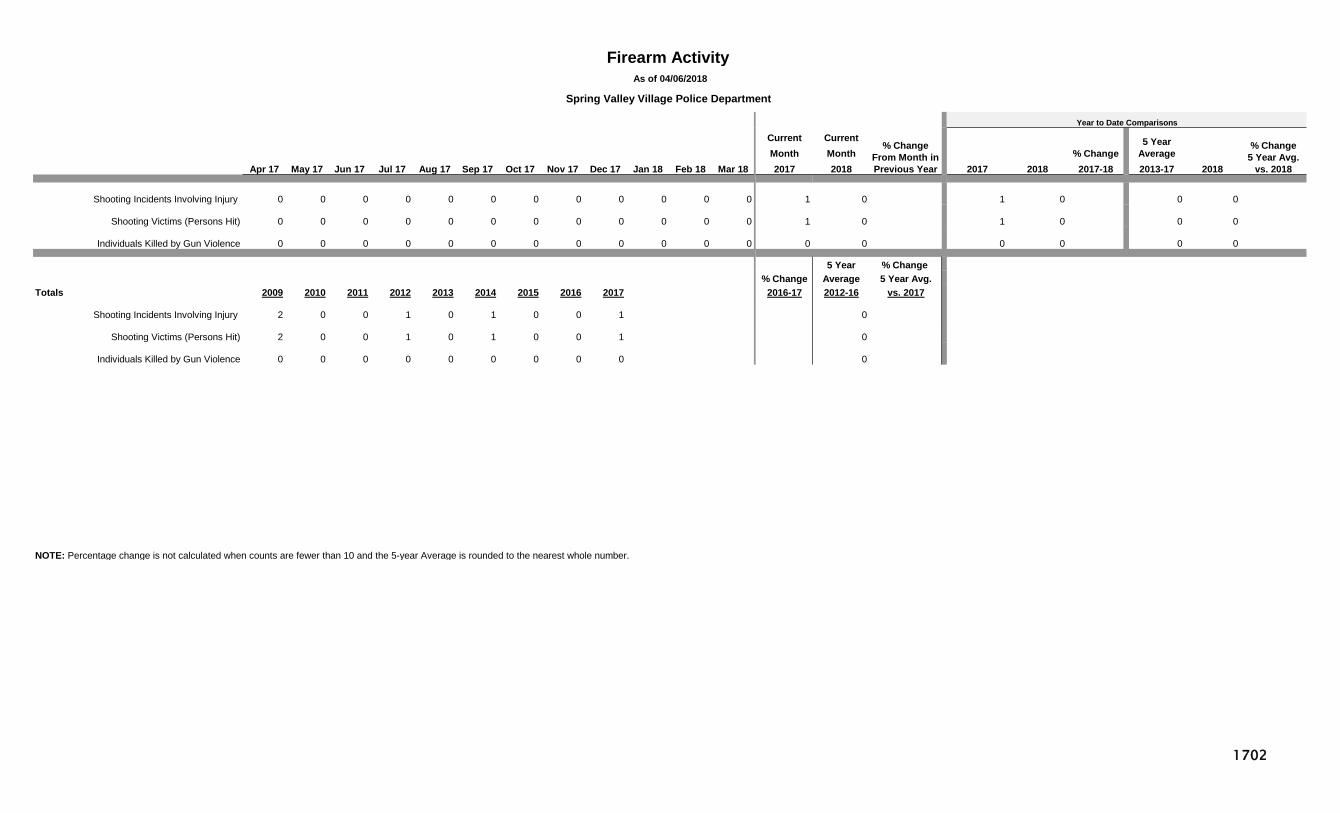
Current CurrentMonth Month % Change
Apr 17 May 17 Jun 17 Jul 17 Aug 17 Sep 17 Oct 17 Nov 17 Dec 17 Jan 18 Feb 18 Mar 18 2017 2018 2017 2018 2017-18 2013-17
Shooting Incidents Involving Injury 0 0 0 0 0 0 0 0 0 0 0 0 1 0 1 0 0 0
Shooting Victims (Persons Hit) 0 0 0 0 0 0 0 0 0 0 0 0 1 0 1 0 0 0
Individuals Killed by Gun Violence 0 0 0 0 0 0 0 0 0 0 0 0 0 0 0 0 0 0
5 Year % Change % Change Average 5 Year Avg.
Totals 2009 2010 2011 2012 2013 2014 2015 2016 2017 2016-17 2012-16 vs. 2017
Shooting Incidents Involving Injury 2 0 0 1 0 1 0 0 1 0
Shooting Victims (Persons Hit) 2 0 0 1 0 1 0 0 1 0
Individuals Killed by Gun Violence 0 0 0 0 0 0 0 0 0 0
NOTE: Percentage change is not calculated when counts are fewer than 10 and the 5-year Average is rounded to the nearest whole number.
Firearm Activity As of 04/06/2018
Spring Valley Village Police Department
Year to Date Comparisons
% Change From Month in Previous Year
5 Year Average
% Change5 Year Avg.
vs. 20182018
1702
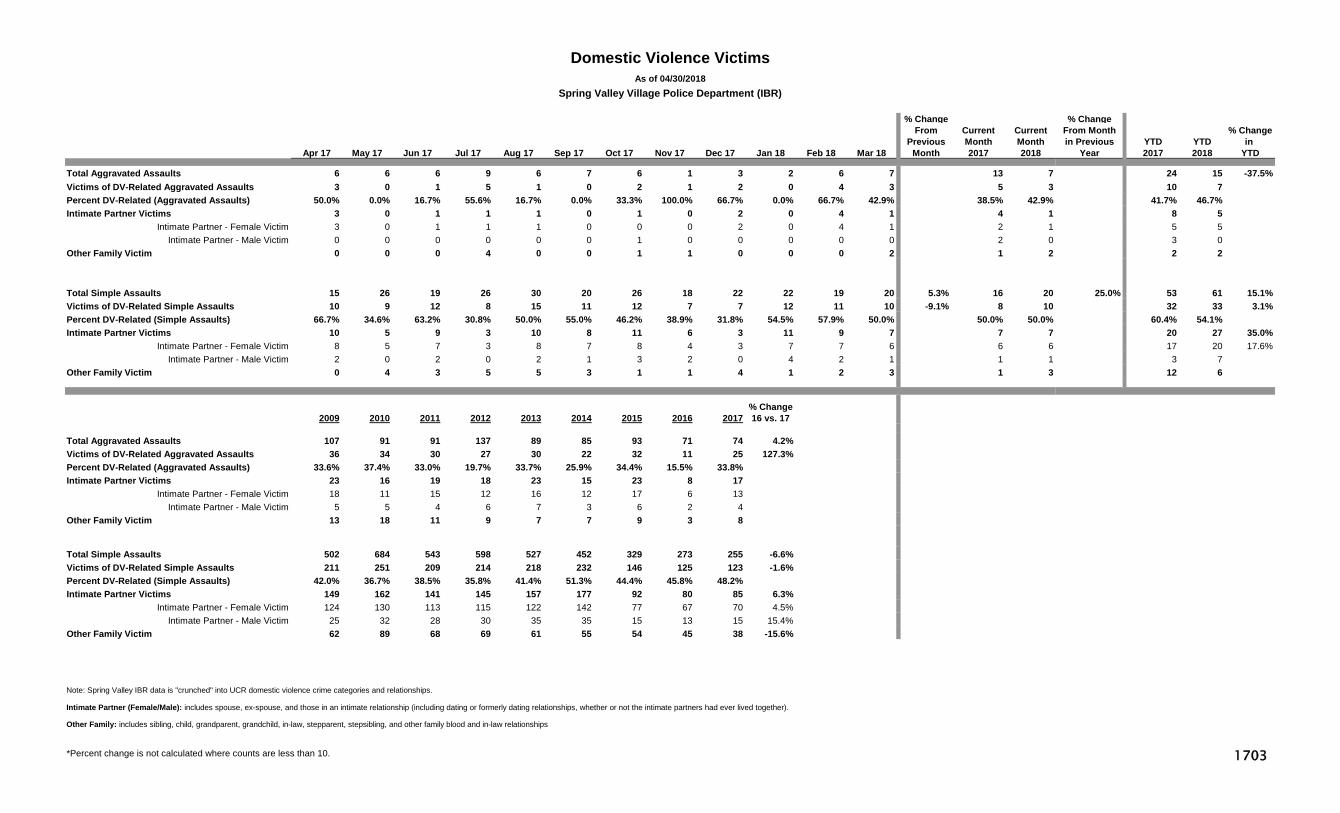
% Change % ChangeFrom Current Current From Month % Change
Previous Month Month in Previous YTD YTD in Apr 17 May 17 Jun 17 Jul 17 Aug 17 Sep 17 Oct 17 Nov 17 Dec 17 Jan 18 Feb 18 Mar 18 Month 2017 2018 Year 2017 2018 YTD
Total Aggravated Assaults 6 6 6 9 6 7 6 1 3 2 6 7 13 7 24 15 -37.5%Victims of DV-Related Aggravated Assaults 3 0 1 5 1 0 2 1 2 0 4 3 5 3 10 7 Percent DV-Related (Aggravated Assaults) 50.0% 0.0% 16.7% 55.6% 16.7% 0.0% 33.3% 100.0% 66.7% 0.0% 66.7% 42.9% 38.5% 42.9% 41.7% 46.7% Intimate Partner Victims 3 0 1 1 1 0 1 0 2 0 4 1 4 1 8 5
Intimate Partner - Female Victim 3 0 1 1 1 0 0 0 2 0 4 1 2 1 5 5 Intimate Partner - Male Victim 0 0 0 0 0 0 1 0 0 0 0 0 2 0 3 0
Other Family Victim 0 0 0 4 0 0 1 1 0 0 0 2 1 2 2 2
Total Simple Assaults 15 26 19 26 30 20 26 18 22 22 19 20 5.3% 16 20 25.0% 53 61 15.1%Victims of DV-Related Simple Assaults 10 9 12 8 15 11 12 7 7 12 11 10 -9.1% 8 10 32 33 3.1%Percent DV-Related (Simple Assaults) 66.7% 34.6% 63.2% 30.8% 50.0% 55.0% 46.2% 38.9% 31.8% 54.5% 57.9% 50.0% 50.0% 50.0% 60.4% 54.1% Intimate Partner Victims 10 5 9 3 10 8 11 6 3 11 9 7 7 7 20 27 35.0%
Intimate Partner - Female Victim 8 5 7 3 8 7 8 4 3 7 7 6 6 6 17 20 17.6%Intimate Partner - Male Victim 2 0 2 0 2 1 3 2 0 4 2 1 1 1 3 7
Other Family Victim 0 4 3 5 5 3 1 1 4 1 2 3 1 3 12 6
% Change2009 2010 2011 2012 2013 2014 2015 2016 2017 16 vs. 17
Total Aggravated Assaults 107 91 91 137 89 85 93 71 74 4.2%Victims of DV-Related Aggravated Assaults 36 34 30 27 30 22 32 11 25 127.3%Percent DV-Related (Aggravated Assaults) 33.6% 37.4% 33.0% 19.7% 33.7% 25.9% 34.4% 15.5% 33.8% Intimate Partner Victims 23 16 19 18 23 15 23 8 17
Intimate Partner - Female Victim 18 11 15 12 16 12 17 6 13 Intimate Partner - Male Victim 5 5 4 6 7 3 6 2 4
Other Family Victim 13 18 11 9 7 7 9 3 8
Total Simple Assaults 502 684 543 598 527 452 329 273 255 -6.6%Victims of DV-Related Simple Assaults 211 251 209 214 218 232 146 125 123 -1.6%Percent DV-Related (Simple Assaults) 42.0% 36.7% 38.5% 35.8% 41.4% 51.3% 44.4% 45.8% 48.2% Intimate Partner Victims 149 162 141 145 157 177 92 80 85 6.3%
Intimate Partner - Female Victim 124 130 113 115 122 142 77 67 70 4.5%Intimate Partner - Male Victim 25 32 28 30 35 35 15 13 15 15.4%
Other Family Victim 62 89 68 69 61 55 54 45 38 -15.6%
Note: Spring Valley IBR data is "crunched" into UCR domestic violence crime categories and relationships.
Intimate Partner (Female/Male): includes spouse, ex-spouse, and those in an intimate relationship (including dating or formerly dating relationships, whether or not the intimate partners had ever lived together).
Other Family: includes sibling, child, grandparent, grandchild, in-law, stepparent, stepsibling, and other family blood and in-law relationships
*Percent change is not calculated where counts are less than 10.
Domestic Violence VictimsAs of 04/30/2018
Spring Valley Village Police Department (IBR)
1703
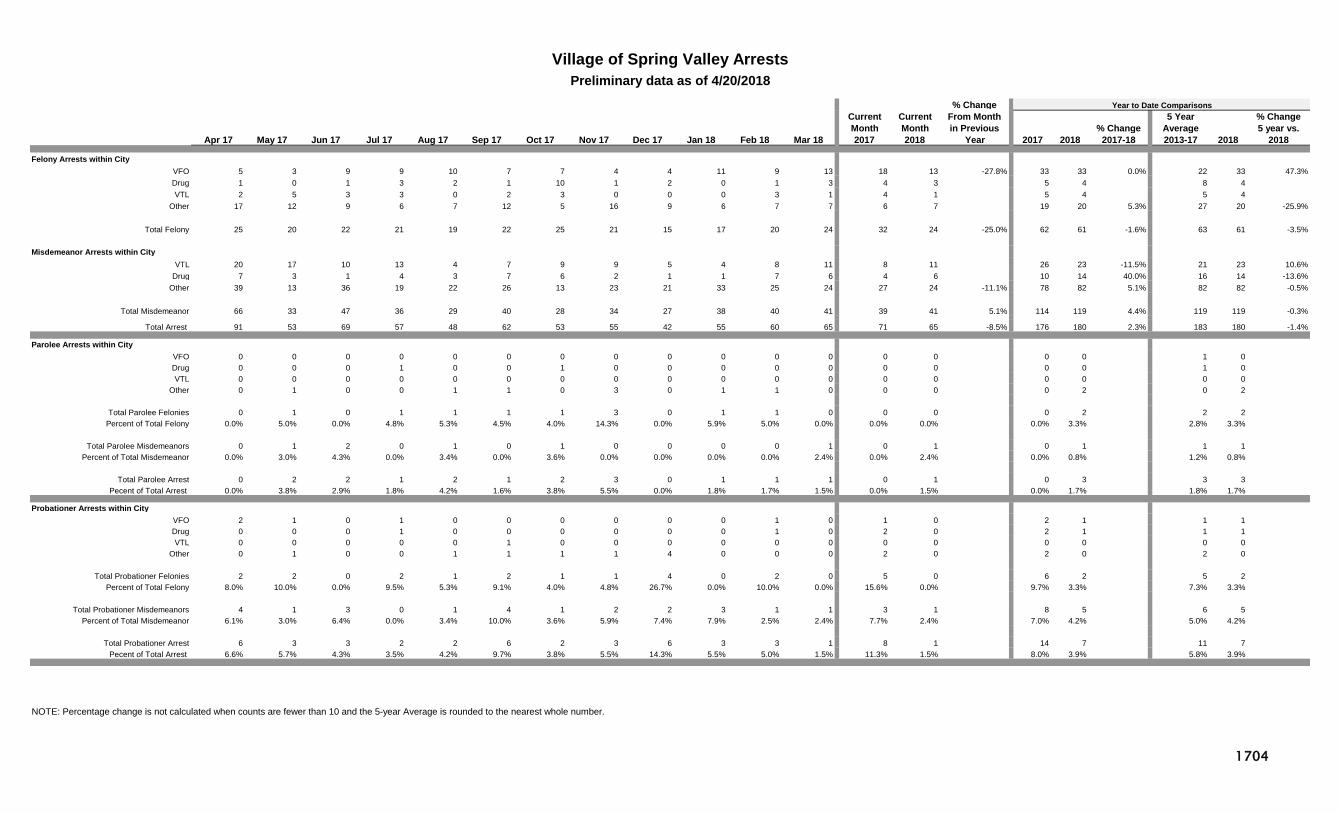
% ChangeCurrent Current From MonthMonth Month in Previous % Change
Apr 17 May 17 Jun 17 Jul 17 Aug 17 Sep 17 Oct 17 Nov 17 Dec 17 Jan 18 Feb 18 Mar 18 2017 2018 Year 2017 2018 2017-18 2013-17
Felony Arrests within CityVFO 5 3 9 9 10 7 7 4 4 11 9 13 18 13 -27.8% 33 33 0.0% 22 33 47.3%Drug 1 0 1 3 2 1 10 1 2 0 1 3 4 3 5 4 8 4 VTL 2 5 3 3 0 2 3 0 0 0 3 1 4 1 5 4 5 4
Other 17 12 9 6 7 12 5 16 9 6 7 7 6 7 19 20 5.3% 27 20 -25.9%
Total Felony 25 20 22 21 19 22 25 21 15 17 20 24 32 24 -25.0% 62 61 -1.6% 63 61 -3.5%
Misdemeanor Arrests within CityVTL 20 17 10 13 4 7 9 9 5 4 8 11 8 11 26 23 -11.5% 21 23 10.6%
Drug 7 3 1 4 3 7 6 2 1 1 7 6 4 6 10 14 40.0% 16 14 -13.6%Other 39 13 36 19 22 26 13 23 21 33 25 24 27 24 -11.1% 78 82 5.1% 82 82 -0.5%
Total Misdemeanor 66 33 47 36 29 40 28 34 27 38 40 41 39 41 5.1% 114 119 4.4% 119 119 -0.3%
Total Arrest 91 53 69 57 48 62 53 55 42 55 60 65 71 65 -8.5% 176 180 2.3% 183 180 -1.4%
Parolee Arrests within CityVFO 0 0 0 0 0 0 0 0 0 0 0 0 0 0 0 0 1 0 Drug 0 0 0 1 0 0 1 0 0 0 0 0 0 0 0 0 1 0 VTL 0 0 0 0 0 0 0 0 0 0 0 0 0 0 0 0 0 0
Other 0 1 0 0 1 1 0 3 0 1 1 0 0 0 0 2 0 2
Total Parolee Felonies 0 1 0 1 1 1 1 3 0 1 1 0 0 0 0 2 2 2 Percent of Total Felony 0.0% 5.0% 0.0% 4.8% 5.3% 4.5% 4.0% 14.3% 0.0% 5.9% 5.0% 0.0% 0.0% 0.0% 0.0% 3.3% 2.8% 3.3%
Total Parolee Misdemeanors 0 1 2 0 1 0 1 0 0 0 0 1 0 1 0 1 1 1 Percent of Total Misdemeanor 0.0% 3.0% 4.3% 0.0% 3.4% 0.0% 3.6% 0.0% 0.0% 0.0% 0.0% 2.4% 0.0% 2.4% 0.0% 0.8% 1.2% 0.8%
Total Parolee Arrest 0 2 2 1 2 1 2 3 0 1 1 1 0 1 0 3 3 3 Pecent of Total Arrest 0.0% 3.8% 2.9% 1.8% 4.2% 1.6% 3.8% 5.5% 0.0% 1.8% 1.7% 1.5% 0.0% 1.5% 0.0% 1.7% 1.8% 1.7%
Probationer Arrests within CityVFO 2 1 0 1 0 0 0 0 0 0 1 0 1 0 2 1 1 1 Drug 0 0 0 1 0 0 0 0 0 0 1 0 2 0 2 1 1 1 VTL 0 0 0 0 0 1 0 0 0 0 0 0 0 0 0 0 0 0
Other 0 1 0 0 1 1 1 1 4 0 0 0 2 0 2 0 2 0
Total Probationer Felonies 2 2 0 2 1 2 1 1 4 0 2 0 5 0 6 2 5 2 Percent of Total Felony 8.0% 10.0% 0.0% 9.5% 5.3% 9.1% 4.0% 4.8% 26.7% 0.0% 10.0% 0.0% 15.6% 0.0% 9.7% 3.3% 7.3% 3.3%
Total Probationer Misdemeanors 4 1 3 0 1 4 1 2 2 3 1 1 3 1 8 5 6 5 Percent of Total Misdemeanor 6.1% 3.0% 6.4% 0.0% 3.4% 10.0% 3.6% 5.9% 7.4% 7.9% 2.5% 2.4% 7.7% 2.4% 7.0% 4.2% 5.0% 4.2%
Total Probationer Arrest 6 3 3 2 2 6 2 3 6 3 3 1 8 1 14 7 11 7 Pecent of Total Arrest 6.6% 5.7% 4.3% 3.5% 4.2% 9.7% 3.8% 5.5% 14.3% 5.5% 5.0% 1.5% 11.3% 1.5% 8.0% 3.9% 5.8% 3.9%
NOTE: Percentage change is not calculated when counts are fewer than 10 and the 5-year Average is rounded to the nearest whole number.
Village of Spring Valley ArrestsPreliminary data as of 4/20/2018
Year to Date Comparisons5 Year
Average% Change5 year vs.
20182018
1704
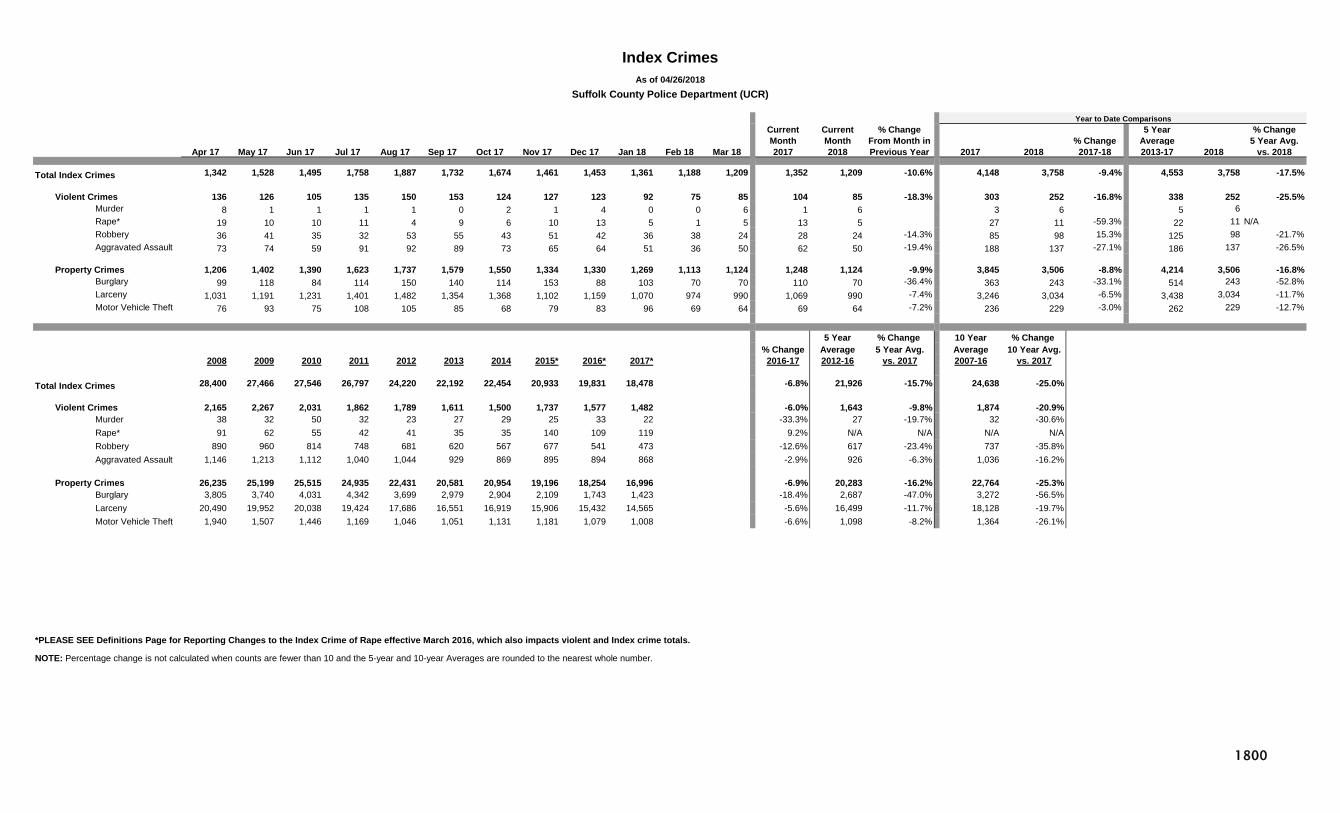
Current CurrentMonth Month
Apr 17 May 17 Jun 17 Jul 17 Aug 17 Sep 17 Oct 17 Nov 17 Dec 17 Jan 18 Feb 18 Mar 18 2017 2018 2013-17
Total Index Crimes 1,342 1,528 1,495 1,758 1,887 1,732 1,674 1,461 1,453 1,361 1,188 1,209 1,352 1,209 -10.6% 4,148 3,758 -9.4% 4,553 3,758 -17.5%
Violent Crimes 136 126 105 135 150 153 124 127 123 92 75 85 104 85 -18.3% 303 252 -16.8% 338 252 -25.5%Murder 8 1 1 1 1 0 2 1 4 0 0 6 1 6 3 6 5 6 Rape* 19 10 10 11 4 9 6 10 13 5 1 5 13 5 27 11 -59.3% 22 11 N/ARobbery 36 41 35 32 53 55 43 51 42 36 38 24 28 24 -14.3% 85 98 15.3% 125 98 -21.7%Aggravated Assault 73 74 59 91 92 89 73 65 64 51 36 50 62 50 -19.4% 188 137 -27.1% 186 137 -26.5%
Property Crimes 1,206 1,402 1,390 1,623 1,737 1,579 1,550 1,334 1,330 1,269 1,113 1,124 1,248 1,124 -9.9% 3,845 3,506 -8.8% 4,214 3,506 -16.8%Burglary 99 118 84 114 150 140 114 153 88 103 70 70 110 70 -36.4% 363 243 -33.1% 514 243 -52.8%Larceny 1,031 1,191 1,231 1,401 1,482 1,354 1,368 1,102 1,159 1,070 974 990 1,069 990 -7.4% 3,246 3,034 -6.5% 3,438 3,034 -11.7%Motor Vehicle Theft 76 93 75 108 105 85 68 79 83 96 69 64 69 64 -7.2% 236 229 -3.0% 262 229 -12.7%
5 Year % Change 10 Year % Change % Change Average 5 Year Avg. Average 10 Year Avg.
2008 2009 2010 2011 2012 2013 2014 2015* 2016* 2017* 2016-17 2012-16 vs. 2017 2007-16 vs. 2017
Total Index Crimes 28,400 27,466 27,546 26,797 24,220 22,192 22,454 20,933 19,831 18,478 -6.8% 21,926 -15.7% 24,638 -25.0%
Violent Crimes 2,165 2,267 2,031 1,862 1,789 1,611 1,500 1,737 1,577 1,482 -6.0% 1,643 -9.8% 1,874 -20.9%Murder 38 32 50 32 23 27 29 25 33 22 -33.3% 27 -19.7% 32 -30.6%Rape* 91 62 55 42 41 35 35 140 109 119 9.2% N/A N/A N/A N/ARobbery 890 960 814 748 681 620 567 677 541 473 -12.6% 617 -23.4% 737 -35.8%Aggravated Assault 1,146 1,213 1,112 1,040 1,044 929 869 895 894 868 -2.9% 926 -6.3% 1,036 -16.2%
Property Crimes 26,235 25,199 25,515 24,935 22,431 20,581 20,954 19,196 18,254 16,996 -6.9% 20,283 -16.2% 22,764 -25.3%Burglary 3,805 3,740 4,031 4,342 3,699 2,979 2,904 2,109 1,743 1,423 -18.4% 2,687 -47.0% 3,272 -56.5%Larceny 20,490 19,952 20,038 19,424 17,686 16,551 16,919 15,906 15,432 14,565 -5.6% 16,499 -11.7% 18,128 -19.7%Motor Vehicle Theft 1,940 1,507 1,446 1,169 1,046 1,051 1,131 1,181 1,079 1,008 -6.6% 1,098 -8.2% 1,364 -26.1%
*PLEASE SEE Definitions Page for Reporting Changes to the Index Crime of Rape effective March 2016, which also impacts violent and Index crime totals.
NOTE: Percentage change is not calculated when counts are fewer than 10 and the 5-year and 10-year Averages are rounded to the nearest whole number.
As of 04/26/2018
Index Crimes
Suffolk County Police Department (UCR)
Year to Date Comparisons
% Change 2017-182017 2018
% Change From Month in Previous Year
5 Year Average
% Change5 Year Avg.
vs. 20182018
1800
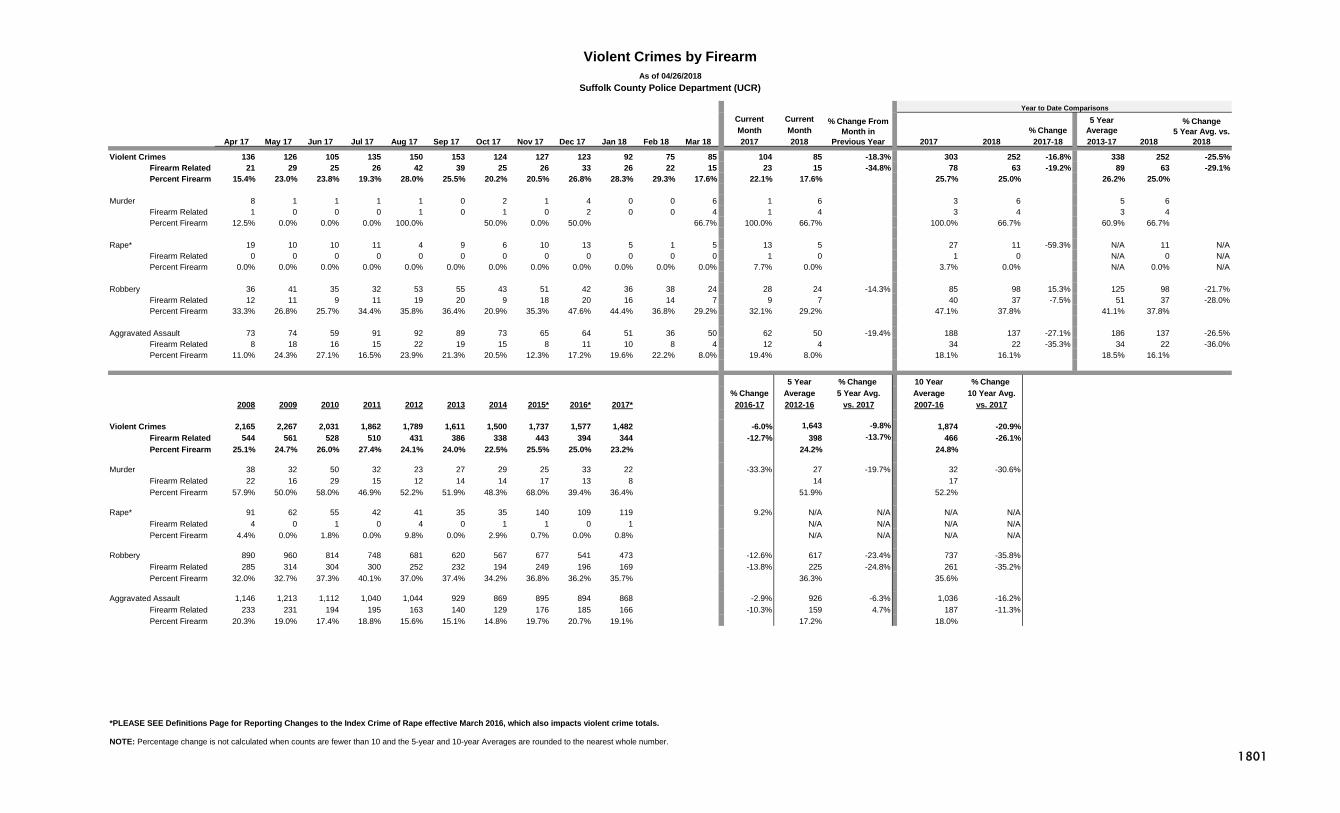
Current CurrentMonth Month % Change
Apr 17 May 17 Jun 17 Jul 17 Aug 17 Sep 17 Oct 17 Nov 17 Dec 17 Jan 18 Feb 18 Mar 18 2017 2018 2017 2018 2017-18 2013-17
Violent Crimes 136 126 105 135 150 153 124 127 123 92 75 85 104 85 -18.3% 303 252 -16.8% 338 252 -25.5%Firearm Related 21 29 25 26 42 39 25 26 33 26 22 15 23 15 -34.8% 78 63 -19.2% 89 63 -29.1%Percent Firearm 15.4% 23.0% 23.8% 19.3% 28.0% 25.5% 20.2% 20.5% 26.8% 28.3% 29.3% 17.6% 22.1% 17.6% 25.7% 25.0% 26.2% 25.0%
Murder 8 1 1 1 1 0 2 1 4 0 0 6 1 6 3 6 5 6
Firearm Related 1 0 0 0 1 0 1 0 2 0 0 4 1 4 3 4 3 4 Percent Firearm 12.5% 0.0% 0.0% 0.0% 100.0% 50.0% 0.0% 50.0% 66.7% 100.0% 66.7% 100.0% 66.7% 60.9% 66.7%
Rape* 19 10 10 11 4 9 6 10 13 5 1 5 13 5 27 11 -59.3% N/A 11 N/AFirearm Related 0 0 0 0 0 0 0 0 0 0 0 0 1 0 1 0 N/A 0 N/APercent Firearm 0.0% 0.0% 0.0% 0.0% 0.0% 0.0% 0.0% 0.0% 0.0% 0.0% 0.0% 0.0% 7.7% 0.0% 3.7% 0.0% N/A 0.0% N/A
Robbery 36 41 35 32 53 55 43 51 42 36 38 24 28 24 -14.3% 85 98 15.3% 125 98 -21.7%Firearm Related 12 11 9 11 19 20 9 18 20 16 14 7 9 7 40 37 -7.5% 51 37 -28.0%Percent Firearm 33.3% 26.8% 25.7% 34.4% 35.8% 36.4% 20.9% 35.3% 47.6% 44.4% 36.8% 29.2% 32.1% 29.2% 47.1% 37.8% 41.1% 37.8%
Aggravated Assault 73 74 59 91 92 89 73 65 64 51 36 50 62 50 -19.4% 188 137 -27.1% 186 137 -26.5%Firearm Related 8 18 16 15 22 19 15 8 11 10 8 4 12 4 34 22 -35.3% 34 22 -36.0%Percent Firearm 11.0% 24.3% 27.1% 16.5% 23.9% 21.3% 20.5% 12.3% 17.2% 19.6% 22.2% 8.0% 19.4% 8.0% 18.1% 16.1% 18.5% 16.1%
5 Year % Change 10 Year % Change % Change Average 5 Year Avg. Average 10 Year Avg.
2008 2009 2010 2011 2012 2013 2014 2015* 2016* 2017* 2016-17 2012-16 vs. 2017 2007-16 vs. 2017
Violent Crimes 2,165 2,267 2,031 1,862 1,789 1,611 1,500 1,737 1,577 1,482 -6.0% 1,643 -9.8% 1,874 -20.9%Firearm Related 544 561 528 510 431 386 338 443 394 344 -12.7% 398 -13.7% 466 -26.1%Percent Firearm 25.1% 24.7% 26.0% 27.4% 24.1% 24.0% 22.5% 25.5% 25.0% 23.2% 24.2% 24.8%
Murder 38 32 50 32 23 27 29 25 33 22 -33.3% 27 -19.7% 32 -30.6%Firearm Related 22 16 29 15 12 14 14 17 13 8 14 17 Percent Firearm 57.9% 50.0% 58.0% 46.9% 52.2% 51.9% 48.3% 68.0% 39.4% 36.4% 51.9% 52.2%
Rape* 91 62 55 42 41 35 35 140 109 119 9.2% N/A N/A N/A N/AFirearm Related 4 0 1 0 4 0 1 1 0 1 N/A N/A N/A N/APercent Firearm 4.4% 0.0% 1.8% 0.0% 9.8% 0.0% 2.9% 0.7% 0.0% 0.8% N/A N/A N/A N/A
Robbery 890 960 814 748 681 620 567 677 541 473 -12.6% 617 -23.4% 737 -35.8%Firearm Related 285 314 304 300 252 232 194 249 196 169 -13.8% 225 -24.8% 261 -35.2%Percent Firearm 32.0% 32.7% 37.3% 40.1% 37.0% 37.4% 34.2% 36.8% 36.2% 35.7% 36.3% 35.6%
Aggravated Assault 1,146 1,213 1,112 1,040 1,044 929 869 895 894 868 -2.9% 926 -6.3% 1,036 -16.2%Firearm Related 233 231 194 195 163 140 129 176 185 166 -10.3% 159 4.7% 187 -11.3%Percent Firearm 20.3% 19.0% 17.4% 18.8% 15.6% 15.1% 14.8% 19.7% 20.7% 19.1% 17.2% 18.0%
*PLEASE SEE Definitions Page for Reporting Changes to the Index Crime of Rape effective March 2016, which also impacts violent crime totals.
NOTE: Percentage change is not calculated when counts are fewer than 10 and the 5-year and 10-year Averages are rounded to the nearest whole number.
Violent Crimes by FirearmAs of 04/26/2018
Suffolk County Police Department (UCR)
% Change From Month in
Previous Year
5 Year Average
% Change5 Year Avg. vs.
20182018
Year to Date Comparisons
1801

Current CurrentMonth Month % Change
Apr 17 May 17 Jun 17 Jul 17 Aug 17 Sep 17 Oct 17 Nov 17 Dec 17 Jan 18 Feb 18 Mar 18 2017 2018 2017 2018 2017-18 2013-17
Shooting Incidents Involving Injury 2 6 8 2 6 6 7 5 3 2 3 4 5 4 16 9 12 9
Shooting Victims (Persons Hit) 3 7 8 2 10 6 7 5 4 2 3 5 5 5 17 10 -41.2% 13 10 -25.4%
Individuals Killed by Gun Violence 1 0 0 0 1 0 1 0 2 0 0 4 1 4 3 4 3 4
5 Year % Change % Change Average 5 Year Avg.
Totals 2009 2010 2011 2012 2013 2014 2015 2016 2017 2016-17 2012-16 vs. 2017
Shooting Incidents Involving Injury 84 81 77 53 57 65 74 72 61 -15.3% 64 -5.0%
Shooting Victims (Persons Hit) 91 104 96 55 70 70 85 87 69 -20.7% 73 -6.0%
Individuals Killed by Gun Violence 16 29 15 12 14 14 17 13 8 14
NOTE: Percentage change is not calculated when counts are fewer than 10 and the 5-year Average is rounded to the nearest whole number.
Firearm Activity As of 04/06/2018
Suffolk County Police Department
Year to Date Comparisons
% Change From Month in Previous Year
5 Year Average
% Change5 Year Avg.
vs. 20182018
1802

% Change % ChangeFrom Current Current From Month % Change
Previous Month Month in Previous YTD YTD in Apr 17 May 17 Jun 17 Jul 17 Aug 17 Sep 17 Oct 17 Nov 17 Dec 17 Jan 18 Feb 18 Mar 18 Month 2017 2018 Year 2017 2018 YTD
Total Aggravated Assaults 73 74 59 91 92 89 73 65 64 51 36 50 38.9% 62 50 -19.4% 188 137 -27.1%Victims of DV-Related Aggravated Assaults 25 21 15 33 32 25 22 27 20 14 12 14 16.7% 18 14 -22.2% 63 40 -36.5%Percent DV-Related (Aggravated Assaults) 34.2% 28.4% 25.4% 36.3% 34.8% 28.1% 30.1% 41.5% 31.3% 27.5% 33.3% 28.0% 29.0% 28.0% 33.5% 29.2% Intimate Partner Victims 9 7 7 5 0 1 1 1 1 0 0 0 10 0 30 0
Intimate Partner - Female Victim 5 5 7 5 0 1 0 1 0 0 0 0 6 0 20 0 Intimate Partner - Male Victim 4 2 0 0 0 0 1 0 1 0 0 0 4 0 10 0
Other Family Victim 16 14 8 28 32 24 21 26 19 14 12 14 16.7% 8 14 33 40 21.2%
Total Simple Assaults 804 845 894 916 814 795 867 745 773 721 696 730 4.9% 711 730 2.7% 2,108 2,147 1.9%Victims of DV-Related Simple Assaults 371 375 411 455 390 367 407 348 397 359 367 361 -1.6% 325 361 11.1% 1,006 1,087 8.1%Percent DV-Related (Simple Assaults) 46.1% 44.4% 46.0% 49.7% 47.9% 46.2% 46.9% 46.7% 51.4% 49.8% 52.7% 49.5% 45.7% 49.5% 47.7% 50.6% Intimate Partner Victims 205 199 203 37 17 9 15 12 9 11 10 11 10.0% 160 11 -93.1% 475 32 -93.3%
Intimate Partner - Female Victim 161 162 166 28 13 8 13 10 6 9 7 8 129 8 375 24 -93.6%Intimate Partner - Male Victim 44 37 37 9 4 1 2 2 3 2 3 3 31 3 100 8
Other Family Victim 166 176 208 418 373 358 392 336 388 348 357 350 -2.0% 165 350 112.1% 531 1,055 98.7%
% Change2009 2010 2011 2012 2013 2014 2015 2016 2017 16 vs. 17
Total Aggravated Assaults 1,213 1,112 1,040 1,044 929 869 895 894 868 -2.9%Victims of DV-Related Aggravated Assaults 298 279 233 304 251 233 243 238 283 18.9%Percent DV-Related (Aggravated Assaults) 24.6% 25.1% 22.4% 29.1% 27.0% 26.8% 27.2% 26.6% 32.6% Intimate Partner Victims 100 98 119 125 100 93 116 107 62 -42.1%
Intimate Partner - Female Victim 59 61 86 83 62 61 83 80 44 -45.0%Intimate Partner - Male Victim 41 37 33 42 38 32 33 27 18 -33.3%
Other Family Victim 198 181 114 179 151 140 127 131 221 68.7%
Total Simple Assaults 12,265 13,032 11,709 11,610 11,610 10,380 9,972 9,717 9,561 -1.6%Victims of DV-Related Simple Assaults 5,434 5,365 5,236 5,035 5,310 4,886 4,772 4,586 4,527 -1.3%Percent DV-Related (Simple Assaults) 44.3% 41.2% 44.7% 43.4% 45.7% 47.1% 47.9% 47.2% 47.3% Intimate Partner Victims 2,128 1,895 2,994 2,656 2,832 2,596 2,577 2,397 1,181 -50.7%
Intimate Partner - Female Victim 1,667 1,535 2,428 2,129 2,222 2,038 2,038 1,899 942 -50.4%Intimate Partner - Male Victim 461 360 566 527 610 558 539 498 239 -52.0%
Other Family Victim 3,306 3,470 2,242 2,379 2,478 2,290 2,195 2,189 3,346 52.9%
Intimate Partner (Female/Male): includes spouse, ex-spouse, and those in an intimate relationship (including dating or formerly dating relationships, whether or not the intimate partners had ever lived together).
Other Family: includes sibling, child, grandparent, grandchild, in-law, stepparent, stepsibling, and other family blood and in-law relationships
*Percent change is not calculated where counts are less than 10.
Domestic Violence VictimsAs of 04/26/2018
Suffolk County Police Department (UCR)
1803
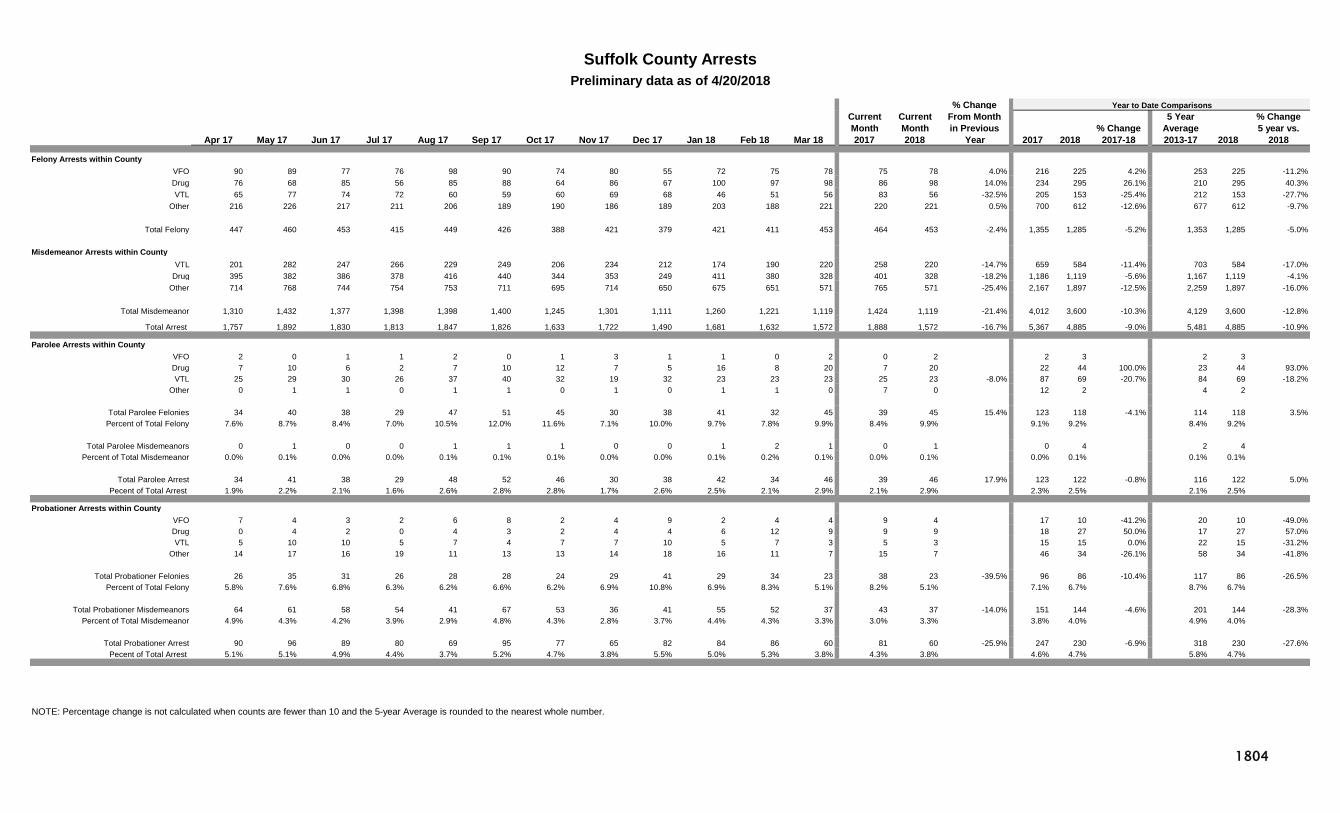
% ChangeCurrent Current From MonthMonth Month in Previous % Change
Apr 17 May 17 Jun 17 Jul 17 Aug 17 Sep 17 Oct 17 Nov 17 Dec 17 Jan 18 Feb 18 Mar 18 2017 2018 Year 2017 2018 2017-18 2013-17
Felony Arrests within CountyVFO 90 89 77 76 98 90 74 80 55 72 75 78 75 78 4.0% 216 225 4.2% 253 225 -11.2%Drug 76 68 85 56 85 88 64 86 67 100 97 98 86 98 14.0% 234 295 26.1% 210 295 40.3%VTL 65 77 74 72 60 59 60 69 68 46 51 56 83 56 -32.5% 205 153 -25.4% 212 153 -27.7%
Other 216 226 217 211 206 189 190 186 189 203 188 221 220 221 0.5% 700 612 -12.6% 677 612 -9.7%
Total Felony 447 460 453 415 449 426 388 421 379 421 411 453 464 453 -2.4% 1,355 1,285 -5.2% 1,353 1,285 -5.0%
Misdemeanor Arrests within CountyVTL 201 282 247 266 229 249 206 234 212 174 190 220 258 220 -14.7% 659 584 -11.4% 703 584 -17.0%
Drug 395 382 386 378 416 440 344 353 249 411 380 328 401 328 -18.2% 1,186 1,119 -5.6% 1,167 1,119 -4.1%Other 714 768 744 754 753 711 695 714 650 675 651 571 765 571 -25.4% 2,167 1,897 -12.5% 2,259 1,897 -16.0%
Total Misdemeanor 1,310 1,432 1,377 1,398 1,398 1,400 1,245 1,301 1,111 1,260 1,221 1,119 1,424 1,119 -21.4% 4,012 3,600 -10.3% 4,129 3,600 -12.8%
Total Arrest 1,757 1,892 1,830 1,813 1,847 1,826 1,633 1,722 1,490 1,681 1,632 1,572 1,888 1,572 -16.7% 5,367 4,885 -9.0% 5,481 4,885 -10.9%
Parolee Arrests within CountyVFO 2 0 1 1 2 0 1 3 1 1 0 2 0 2 2 3 2 3 Drug 7 10 6 2 7 10 12 7 5 16 8 20 7 20 22 44 100.0% 23 44 93.0%VTL 25 29 30 26 37 40 32 19 32 23 23 23 25 23 -8.0% 87 69 -20.7% 84 69 -18.2%
Other 0 1 1 0 1 1 0 1 0 1 1 0 7 0 12 2 4 2
Total Parolee Felonies 34 40 38 29 47 51 45 30 38 41 32 45 39 45 15.4% 123 118 -4.1% 114 118 3.5%Percent of Total Felony 7.6% 8.7% 8.4% 7.0% 10.5% 12.0% 11.6% 7.1% 10.0% 9.7% 7.8% 9.9% 8.4% 9.9% 9.1% 9.2% 8.4% 9.2%
Total Parolee Misdemeanors 0 1 0 0 1 1 1 0 0 1 2 1 0 1 0 4 2 4 Percent of Total Misdemeanor 0.0% 0.1% 0.0% 0.0% 0.1% 0.1% 0.1% 0.0% 0.0% 0.1% 0.2% 0.1% 0.0% 0.1% 0.0% 0.1% 0.1% 0.1%
Total Parolee Arrest 34 41 38 29 48 52 46 30 38 42 34 46 39 46 17.9% 123 122 -0.8% 116 122 5.0%Pecent of Total Arrest 1.9% 2.2% 2.1% 1.6% 2.6% 2.8% 2.8% 1.7% 2.6% 2.5% 2.1% 2.9% 2.1% 2.9% 2.3% 2.5% 2.1% 2.5%
Probationer Arrests within CountyVFO 7 4 3 2 6 8 2 4 9 2 4 4 9 4 17 10 -41.2% 20 10 -49.0%Drug 0 4 2 0 4 3 2 4 4 6 12 9 9 9 18 27 50.0% 17 27 57.0%VTL 5 10 10 5 7 4 7 7 10 5 7 3 5 3 15 15 0.0% 22 15 -31.2%
Other 14 17 16 19 11 13 13 14 18 16 11 7 15 7 46 34 -26.1% 58 34 -41.8%
Total Probationer Felonies 26 35 31 26 28 28 24 29 41 29 34 23 38 23 -39.5% 96 86 -10.4% 117 86 -26.5%Percent of Total Felony 5.8% 7.6% 6.8% 6.3% 6.2% 6.6% 6.2% 6.9% 10.8% 6.9% 8.3% 5.1% 8.2% 5.1% 7.1% 6.7% 8.7% 6.7%
Total Probationer Misdemeanors 64 61 58 54 41 67 53 36 41 55 52 37 43 37 -14.0% 151 144 -4.6% 201 144 -28.3%Percent of Total Misdemeanor 4.9% 4.3% 4.2% 3.9% 2.9% 4.8% 4.3% 2.8% 3.7% 4.4% 4.3% 3.3% 3.0% 3.3% 3.8% 4.0% 4.9% 4.0%
Total Probationer Arrest 90 96 89 80 69 95 77 65 82 84 86 60 81 60 -25.9% 247 230 -6.9% 318 230 -27.6%Pecent of Total Arrest 5.1% 5.1% 4.9% 4.4% 3.7% 5.2% 4.7% 3.8% 5.5% 5.0% 5.3% 3.8% 4.3% 3.8% 4.6% 4.7% 5.8% 4.7%
NOTE: Percentage change is not calculated when counts are fewer than 10 and the 5-year Average is rounded to the nearest whole number.
Suffolk County ArrestsPreliminary data as of 4/20/2018
Year to Date Comparisons5 Year
Average% Change5 year vs.
20182018
1804

Current CurrentMonth Month
Apr 17 May 17 Jun 17 Jul 17 Aug 17 Sep 17 Oct 17 Nov 17 Dec 17 Jan 18 Feb 18 Mar 18 2017 2018 2013-17
Total Index Crimes 478 475 464 523 506 557 580 516 516 383 340 325 408 325 -20.3% 1,211 1,048 -13.5% 1,376 1,048 -23.9%
Violent Crimes 82 85 96 78 83 91 92 79 87 61 60 57 74 57 -23.0% 236 178 -24.6% 230 178 -22.6%Murder 3 0 4 2 1 2 2 0 4 0 2 0 0 0 2 2 5 2 Rape* 6 10 5 4 6 13 11 3 9 10 7 8 13 8 31 25 -19.4% 20 25 N/ARobbery 24 21 23 9 29 19 24 29 33 24 15 13 29 13 -55.2% 73 52 -28.8% 78 52 -33.2%Aggravated Assault 49 54 64 63 47 57 55 47 41 27 36 36 32 36 12.5% 130 99 -23.8% 127 99 -22.3%
Property Crimes 396 390 368 445 423 466 488 437 429 322 280 268 334 268 -19.8% 975 870 -10.8% 1,146 870 -24.1%Burglary 83 95 95 112 113 121 111 95 95 59 43 50 80 50 -37.5% 225 152 -32.4% 270 152 -43.6%Larceny 282 270 242 297 281 304 350 319 286 228 207 189 227 189 -16.7% 670 624 -6.9% 805 624 -22.5%Motor Vehicle Theft 31 25 31 36 29 41 27 23 48 35 30 29 27 29 7.4% 80 94 17.5% 71 94 31.7%
5 Year % Change 10 Year % Change % Change Average 5 Year Avg. Average 10 Year Avg.
2008 2009 2010 2011 2012 2013 2014 2015* 2016* 2017* 2016-17 2012-16 vs. 2017 2007-16 vs. 2017
Total Index Crimes 7,531 7,122 6,999 6,577 7,348 7,665 6,898 6,229 5,714 5,826 2.0% 6,771 -14.0% 6,948 -16.2%
Violent Crimes 1,366 1,343 1,291 1,302 1,372 1,192 1,143 1,142 1,063 1,009 -5.1% 1,182 -14.7% 1,265 -20.2%Murder 24 18 15 11 14 21 20 22 30 20 -33.3% 21 -6.5% 19 3.1%Rape* 71 70 68 63 75 75 49 77 68 98 44.1% N/A N/A N/A N/ARobbery 419 403 377 388 454 400 406 359 329 284 -13.7% 390 -27.1% 398 -28.7%Aggravated Assault 852 852 831 840 829 696 668 684 636 607 -4.6% 703 -13.6% 779 -22.1%
Property Crimes 6,165 5,779 5,708 5,275 5,976 6,473 5,755 5,087 4,651 4,817 3.6% 5,588 -13.8% 5,683 -15.2%Burglary 1,938 1,946 2,174 1,705 1,896 1,781 1,404 1,194 1,021 1,145 12.1% 1,459 -21.5% 1,684 -32.0%Larceny 3,725 3,495 3,167 3,261 3,698 4,298 3,986 3,577 3,290 3,301 0.3% 3,770 -12.4% 3,612 -8.6%Motor Vehicle Theft 502 338 367 309 382 394 365 316 340 371 9.1% 359 3.2% 387 -4.2%
*PLEASE SEE Definitions Page for Reporting Changes to the Index Crime of Rape effective March 2016, which also impacts violent and Index crime totals.
NOTE: Percentage change is not calculated when counts are fewer than 10 and the 5-year and 10-year Averages are rounded to the nearest whole number.
As of 04/30/2018
Index Crimes
Syracuse City Police Department (UCR)
Year to Date Comparisons
% Change 2017-182017 2018
% Change From Month in Previous Year
5 Year Average
% Change5 Year Avg.
vs. 20182018
1900

Current CurrentMonth Month % Change
Apr 17 May 17 Jun 17 Jul 17 Aug 17 Sep 17 Oct 17 Nov 17 Dec 17 Jan 18 Feb 18 Mar 18 2017 2018 2017 2018 2017-18 2013-17
Violent Crimes 82 85 96 78 83 91 92 79 87 61 60 57 74 57 -23.0% 236 178 -24.6% 230 178 -22.6%Firearm Related 11 10 19 20 15 18 22 20 26 17 14 7 7 7 37 38 2.7% 52 38 -26.6%Percent Firearm 13.4% 11.8% 19.8% 25.6% 18.1% 19.8% 23.9% 25.3% 29.9% 27.9% 23.3% 12.3% 9.5% 12.3% 15.7% 21.3% 22.5% 21.3%
Murder 3 0 4 2 1 2 2 0 4 0 2 0 0 0 2 2 5 2
Firearm Related 2 0 4 2 0 2 2 0 4 0 1 0 0 0 2 1 3 1 Percent Firearm 66.7% 100.0% 100.0% 0.0% 100.0% 100.0% 100.0% 50.0% 100.0% 50.0% 69.6% 50.0%
Rape* 6 10 5 4 6 13 11 3 9 10 7 8 13 8 31 25 -19.4% N/A 25 N/AFirearm Related 0 0 0 0 0 0 0 0 0 0 3 0 0 0 1 3 N/A 3 N/APercent Firearm 0.0% 0.0% 0.0% 0.0% 0.0% 0.0% 0.0% 0.0% 0.0% 0.0% 42.9% 0.0% 0.0% 0.0% 3.2% 12.0% N/A 12.0% N/A
Robbery 24 21 23 9 29 19 24 29 33 24 15 13 29 13 -55.2% 73 52 -28.8% 78 52 -33.2%Firearm Related 5 2 4 2 5 5 5 13 12 11 5 1 3 1 14 17 21.4% 24 17 -29.2%Percent Firearm 20.8% 9.5% 17.4% 22.2% 17.2% 26.3% 20.8% 44.8% 36.4% 45.8% 33.3% 7.7% 10.3% 7.7% 19.2% 32.7% 30.8% 32.7%
Aggravated Assault 49 54 64 63 47 57 55 47 41 27 36 36 32 36 12.5% 130 99 -23.8% 127 99 -22.3%Firearm Related 4 8 11 16 10 11 15 7 10 6 5 6 4 6 20 17 -15.0% 24 17 -28.6%Percent Firearm 8.2% 14.8% 17.2% 25.4% 21.3% 19.3% 27.3% 14.9% 24.4% 22.2% 13.9% 16.7% 12.5% 16.7% 15.4% 17.2% 18.7% 17.2%
5 Year % Change 10 Year % Change % Change Average 5 Year Avg. Average 10 Year Avg.
2008 2009 2010 2011 2012 2013 2014 2015* 2016* 2017* 2016-17 2012-16 vs. 2017 2007-16 vs. 2017
Violent Crimes 1,366 1,343 1,291 1,302 1,372 1,192 1,143 1,142 1,063 1,009 -5.1% 1,182 -14.7% 1,265 -20.2%Firearm Related 258 270 314 264 301 262 265 244 258 198 -23.3% 266 -25.6% 275 -28.1%Percent Firearm 18.9% 20.1% 24.3% 20.3% 21.9% 22.0% 23.2% 21.4% 24.3% 19.6% 22.5% 21.8%
Murder 24 18 15 11 14 21 20 22 30 20 -33.3% 21 -6.5% 19 3.1%Firearm Related 14 10 12 5 11 14 14 16 18 18 0.0% 15 23.3% 12 46.3%Percent Firearm 58.3% 55.6% 80.0% 45.5% 78.6% 66.7% 70.0% 72.7% 60.0% 90.0% 69.6% 63.5%
Rape* 71 70 68 63 75 75 49 77 68 98 44.1% N/A N/A N/A N/AFirearm Related 5 2 1 0 3 2 2 1 1 1 N/A N/A N/A N/APercent Firearm 7.0% 2.9% 1.5% 0.0% 4.0% 2.7% 4.1% 1.3% 1.5% 1.0% N/A N/A N/A N/A
Robbery 419 403 377 388 454 400 406 359 329 284 -13.7% 390 -27.1% 398 -28.7%Firearm Related 94 125 121 115 138 112 123 91 90 67 -25.6% 111 -39.5% 115 -41.6%Percent Firearm 22.4% 31.0% 32.1% 29.6% 30.4% 28.0% 30.3% 25.3% 27.4% 23.6% 28.3% 28.8%
Aggravated Assault 852 852 831 840 829 696 668 684 636 607 -4.6% 703 -13.6% 779 -22.1%Firearm Related 145 133 180 144 149 134 126 136 149 112 -24.8% 139 -19.3% 146 -23.5%Percent Firearm 17.0% 15.6% 21.7% 17.1% 18.0% 19.3% 18.9% 19.9% 23.4% 18.5% 19.9% 18.9%
*PLEASE SEE Definitions Page for Reporting Changes to the Index Crime of Rape effective March 2016, which also impacts violent crime totals.
NOTE: Percentage change is not calculated when counts are fewer than 10 and the 5-year and 10-year Averages are rounded to the nearest whole number.
Violent Crimes by FirearmAs of 04/30/2018
Syracuse City Police Department (UCR)
% Change From Month in
Previous Year
5 Year Average
% Change5 Year Avg. vs.
20182018
Year to Date Comparisons
1901
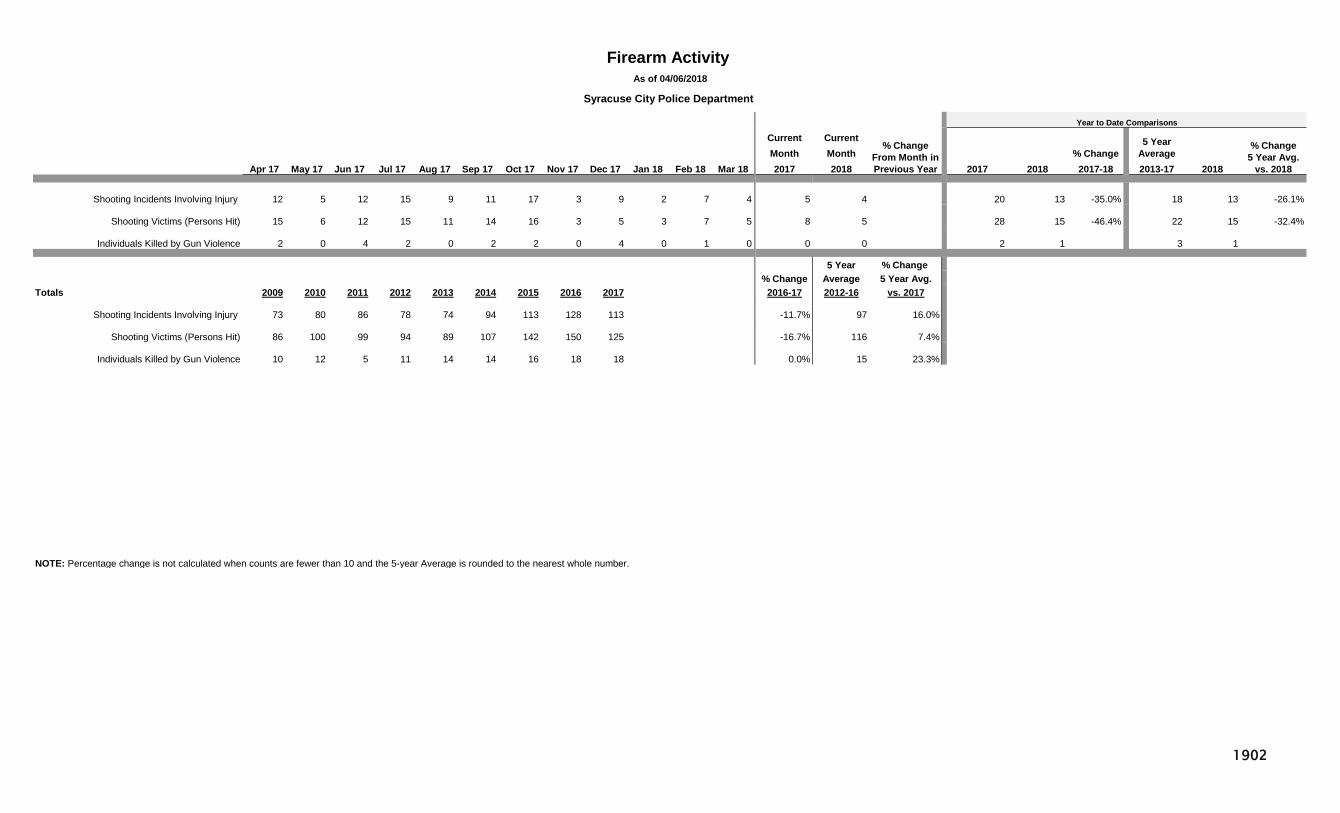
Current CurrentMonth Month % Change
Apr 17 May 17 Jun 17 Jul 17 Aug 17 Sep 17 Oct 17 Nov 17 Dec 17 Jan 18 Feb 18 Mar 18 2017 2018 2017 2018 2017-18 2013-17
Shooting Incidents Involving Injury 12 5 12 15 9 11 17 3 9 2 7 4 5 4 20 13 -35.0% 18 13 -26.1%
Shooting Victims (Persons Hit) 15 6 12 15 11 14 16 3 5 3 7 5 8 5 28 15 -46.4% 22 15 -32.4%
Individuals Killed by Gun Violence 2 0 4 2 0 2 2 0 4 0 1 0 0 0 2 1 3 1
5 Year % Change % Change Average 5 Year Avg.
Totals 2009 2010 2011 2012 2013 2014 2015 2016 2017 2016-17 2012-16 vs. 2017
Shooting Incidents Involving Injury 73 80 86 78 74 94 113 128 113 -11.7% 97 16.0%
Shooting Victims (Persons Hit) 86 100 99 94 89 107 142 150 125 -16.7% 116 7.4%
Individuals Killed by Gun Violence 10 12 5 11 14 14 16 18 18 0.0% 15 23.3%
NOTE: Percentage change is not calculated when counts are fewer than 10 and the 5-year Average is rounded to the nearest whole number.
Firearm Activity As of 04/06/2018
Syracuse City Police Department
Year to Date Comparisons
% Change From Month in Previous Year
5 Year Average
% Change5 Year Avg.
vs. 20182018
1902

% Change % ChangeFrom Current Current From Month % Change
Previous Month Month in Previous YTD YTD in Apr 17 May 17 Jun 17 Jul 17 Aug 17 Sep 17 Oct 17 Nov 17 Dec 17 Jan 18 Feb 18 Mar 18 Month 2017 2018 Year 2017 2018 YTD
Total Aggravated Assaults 49 54 64 63 47 57 55 47 41 27 36 36 0.0% 32 36 12.5% 130 99 -23.8%Victims of DV-Related Aggravated Assaults 26 15 19 15 10 21 13 22 15 7 14 11 -21.4% 13 11 -15.4% 36 32 -11.1%Percent DV-Related (Aggravated Assaults) 53.1% 27.8% 29.7% 23.8% 21.3% 36.8% 23.6% 46.8% 36.6% 25.9% 38.9% 30.6% 40.6% 30.6% 27.7% 32.3% Intimate Partner Victims 21 10 14 9 8 15 11 11 9 7 9 9 8 9 24 25 4.2%
Intimate Partner - Female Victim 17 9 11 5 7 10 5 3 5 5 5 7 6 7 18 17 -5.6%Intimate Partner - Male Victim 4 1 3 4 1 5 6 8 4 2 4 2 2 2 6 8
Other Family Victim 5 5 5 6 2 6 2 11 6 0 5 2 5 2 12 7
Total Simple Assaults 218 239 253 234 224 223 250 208 217 163 190 182 -4.2% 181 182 0.6% 582 535 -8.1%Victims of DV-Related Simple Assaults 164 189 202 178 173 171 182 159 175 131 161 140 -13.0% 145 140 -3.4% 449 432 -3.8%Percent DV-Related (Simple Assaults) 75.2% 79.1% 79.8% 76.1% 77.2% 76.7% 72.8% 76.4% 80.6% 80.4% 84.7% 76.9% 80.1% 76.9% 77.1% 80.7% Intimate Partner Victims 122 147 153 131 120 128 131 131 138 89 120 102 -15.0% 112 102 -8.9% 324 311 -4.0%
Intimate Partner - Female Victim 102 115 116 102 101 107 108 109 113 76 91 87 -4.4% 88 87 -1.1% 268 254 -5.2%Intimate Partner - Male Victim 20 32 37 29 19 21 23 22 25 13 29 15 -48.3% 24 15 -37.5% 56 57 1.8%
Other Family Victim 42 42 49 47 53 43 51 28 37 42 41 38 -7.3% 33 38 15.2% 125 121 -3.2%
% Change2009 2010 2011 2012 2013 2014 2015 2016 2017 16 vs. 17
Total Aggravated Assaults 852 831 840 829 696 668 684 636 607 -4.6%Victims of DV-Related Aggravated Assaults 213 201 207 246 203 204 205 186 192 3.2%Percent DV-Related (Aggravated Assaults) 25.0% 24.2% 24.6% 29.7% 29.2% 30.5% 30.0% 29.2% 31.6% Intimate Partner Victims 33 35 28 107 103 116 89 113 132 16.8%
Intimate Partner - Female Victim 21 24 16 52 56 71 57 73 90 23.3%Intimate Partner - Male Victim 12 11 12 55 47 45 32 40 42 5.0%
Other Family Victim 180 166 179 139 100 88 116 73 60 -17.8%
Total Simple Assaults 3,548 3,799 3,909 3,646 3,300 2,888 2,844 2,478 2,648 6.9%Victims of DV-Related Simple Assaults 2,137 2,306 2,422 2,533 2,280 2,050 2,050 1,823 2,042 12.0%Percent DV-Related (Simple Assaults) 60.2% 60.7% 62.0% 69.5% 69.1% 71.0% 72.1% 73.6% 77.1% Intimate Partner Victims 422 366 375 1,316 1,220 1,134 1,134 1,174 1,525 29.9%
Intimate Partner - Female Victim 337 270 269 1,084 998 932 932 954 1,241 30.1%Intimate Partner - Male Victim 85 96 106 232 222 202 202 220 284 29.1%
Other Family Victim 1,715 1,940 2,047 1,217 1,060 916 916 649 517 -20.3%
Intimate Partner (Female/Male): includes spouse, ex-spouse, and those in an intimate relationship (including dating or formerly dating relationships, whether or not the intimate partners had ever lived together).
Other Family: includes sibling, child, grandparent, grandchild, in-law, stepparent, stepsibling, and other family blood and in-law relationships
*Percent change is not calculated where counts are less than 10.
Domestic Violence VictimsAs of 04/30/2018
Syracuse City Police Department (UCR)
1903
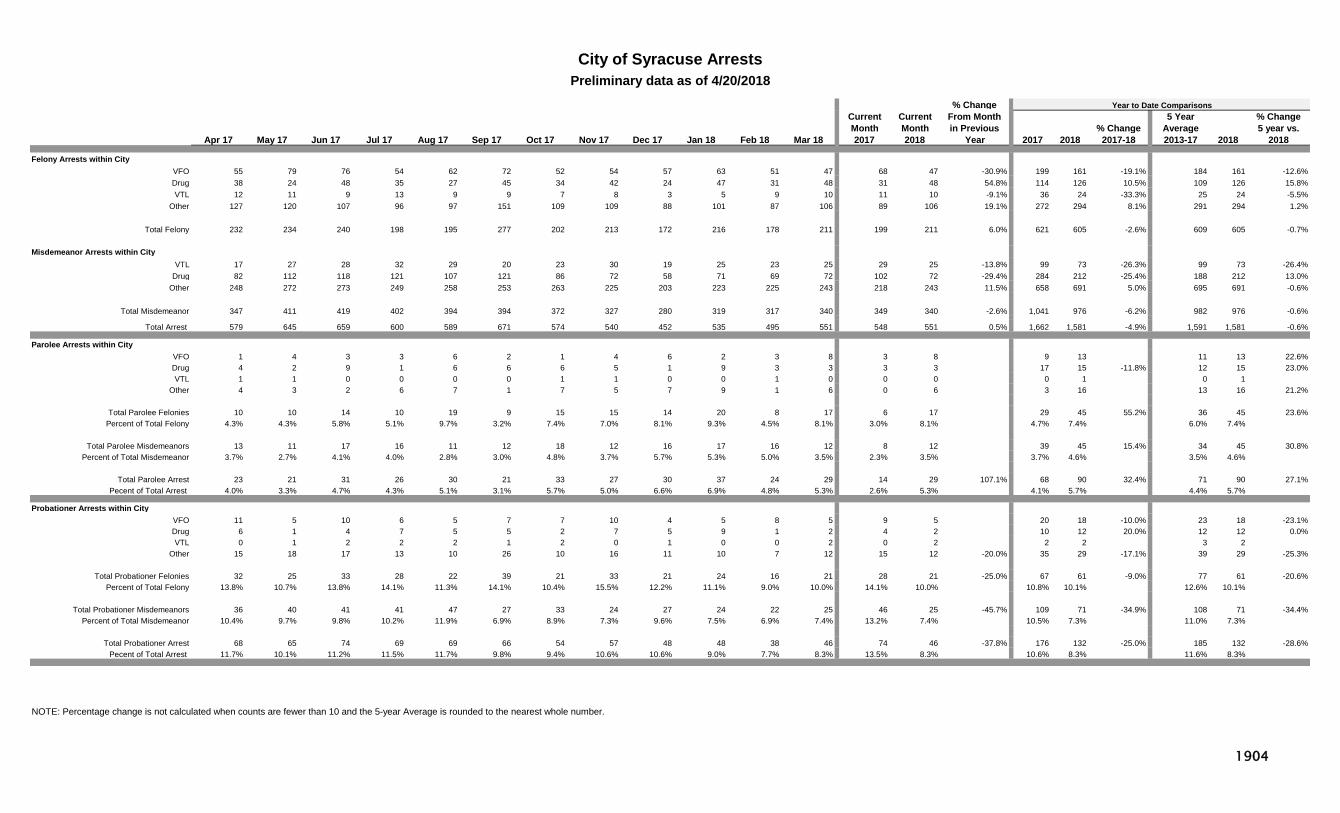
% ChangeCurrent Current From MonthMonth Month in Previous % Change
Apr 17 May 17 Jun 17 Jul 17 Aug 17 Sep 17 Oct 17 Nov 17 Dec 17 Jan 18 Feb 18 Mar 18 2017 2018 Year 2017 2018 2017-18 2013-17
Felony Arrests within CityVFO 55 79 76 54 62 72 52 54 57 63 51 47 68 47 -30.9% 199 161 -19.1% 184 161 -12.6%Drug 38 24 48 35 27 45 34 42 24 47 31 48 31 48 54.8% 114 126 10.5% 109 126 15.8%VTL 12 11 9 13 9 9 7 8 3 5 9 10 11 10 -9.1% 36 24 -33.3% 25 24 -5.5%
Other 127 120 107 96 97 151 109 109 88 101 87 106 89 106 19.1% 272 294 8.1% 291 294 1.2%
Total Felony 232 234 240 198 195 277 202 213 172 216 178 211 199 211 6.0% 621 605 -2.6% 609 605 -0.7%
Misdemeanor Arrests within CityVTL 17 27 28 32 29 20 23 30 19 25 23 25 29 25 -13.8% 99 73 -26.3% 99 73 -26.4%
Drug 82 112 118 121 107 121 86 72 58 71 69 72 102 72 -29.4% 284 212 -25.4% 188 212 13.0%Other 248 272 273 249 258 253 263 225 203 223 225 243 218 243 11.5% 658 691 5.0% 695 691 -0.6%
Total Misdemeanor 347 411 419 402 394 394 372 327 280 319 317 340 349 340 -2.6% 1,041 976 -6.2% 982 976 -0.6%
Total Arrest 579 645 659 600 589 671 574 540 452 535 495 551 548 551 0.5% 1,662 1,581 -4.9% 1,591 1,581 -0.6%
Parolee Arrests within CityVFO 1 4 3 3 6 2 1 4 6 2 3 8 3 8 9 13 11 13 22.6%Drug 4 2 9 1 6 6 6 5 1 9 3 3 3 3 17 15 -11.8% 12 15 23.0%VTL 1 1 0 0 0 0 1 1 0 0 1 0 0 0 0 1 0 1
Other 4 3 2 6 7 1 7 5 7 9 1 6 0 6 3 16 13 16 21.2%
Total Parolee Felonies 10 10 14 10 19 9 15 15 14 20 8 17 6 17 29 45 55.2% 36 45 23.6%Percent of Total Felony 4.3% 4.3% 5.8% 5.1% 9.7% 3.2% 7.4% 7.0% 8.1% 9.3% 4.5% 8.1% 3.0% 8.1% 4.7% 7.4% 6.0% 7.4%
Total Parolee Misdemeanors 13 11 17 16 11 12 18 12 16 17 16 12 8 12 39 45 15.4% 34 45 30.8%Percent of Total Misdemeanor 3.7% 2.7% 4.1% 4.0% 2.8% 3.0% 4.8% 3.7% 5.7% 5.3% 5.0% 3.5% 2.3% 3.5% 3.7% 4.6% 3.5% 4.6%
Total Parolee Arrest 23 21 31 26 30 21 33 27 30 37 24 29 14 29 107.1% 68 90 32.4% 71 90 27.1%Pecent of Total Arrest 4.0% 3.3% 4.7% 4.3% 5.1% 3.1% 5.7% 5.0% 6.6% 6.9% 4.8% 5.3% 2.6% 5.3% 4.1% 5.7% 4.4% 5.7%
Probationer Arrests within CityVFO 11 5 10 6 5 7 7 10 4 5 8 5 9 5 20 18 -10.0% 23 18 -23.1%Drug 6 1 4 7 5 5 2 7 5 9 1 2 4 2 10 12 20.0% 12 12 0.0%VTL 0 1 2 2 2 1 2 0 1 0 0 2 0 2 2 2 3 2
Other 15 18 17 13 10 26 10 16 11 10 7 12 15 12 -20.0% 35 29 -17.1% 39 29 -25.3%
Total Probationer Felonies 32 25 33 28 22 39 21 33 21 24 16 21 28 21 -25.0% 67 61 -9.0% 77 61 -20.6%Percent of Total Felony 13.8% 10.7% 13.8% 14.1% 11.3% 14.1% 10.4% 15.5% 12.2% 11.1% 9.0% 10.0% 14.1% 10.0% 10.8% 10.1% 12.6% 10.1%
Total Probationer Misdemeanors 36 40 41 41 47 27 33 24 27 24 22 25 46 25 -45.7% 109 71 -34.9% 108 71 -34.4%Percent of Total Misdemeanor 10.4% 9.7% 9.8% 10.2% 11.9% 6.9% 8.9% 7.3% 9.6% 7.5% 6.9% 7.4% 13.2% 7.4% 10.5% 7.3% 11.0% 7.3%
Total Probationer Arrest 68 65 74 69 69 66 54 57 48 48 38 46 74 46 -37.8% 176 132 -25.0% 185 132 -28.6%Pecent of Total Arrest 11.7% 10.1% 11.2% 11.5% 11.7% 9.8% 9.4% 10.6% 10.6% 9.0% 7.7% 8.3% 13.5% 8.3% 10.6% 8.3% 11.6% 8.3%
NOTE: Percentage change is not calculated when counts are fewer than 10 and the 5-year Average is rounded to the nearest whole number.
City of Syracuse ArrestsPreliminary data as of 4/20/2018
Year to Date Comparisons5 Year
Average% Change5 year vs.
20182018
1904

Current CurrentMonth Month
Apr 17 May 17 Jun 17 Jul 17 Aug 17 Sep 17 Oct 17 Nov 17 Dec 17 Jan 18 Feb 18 Mar 18 2017 2018 2013-17
Total Index Crimes 174 173 182 201 200 176 186 167 166 140 107 139 125 139 11.2% 458 386 -15.7% 487 386 -20.7%
Violent Crimes 35 43 22 30 33 28 26 28 27 24 20 21 24 21 -12.5% 79 65 -17.7% 80 65 -18.5%Murder 0 0 0 1 0 0 0 0 4 0 0 0 1 0 1 0 1 0 Rape* 2 3 3 1 4 5 2 4 2 3 0 2 3 2 5 5 5 5 N/ARobbery 14 15 5 9 13 7 10 7 11 10 7 5 7 5 23 22 -4.3% 29 22 -23.1%Aggravated Assault 19 25 14 19 16 16 14 17 10 11 13 14 13 14 7.7% 50 38 -24.0% 45 38 -15.9%
Property Crimes 139 130 160 171 167 148 160 139 139 116 87 118 101 118 16.8% 379 321 -15.3% 407 321 -21.1%Burglary 29 25 38 33 37 31 42 23 33 25 10 22 21 22 4.8% 79 57 -27.8% 102 57 -43.9%Larceny 101 100 116 130 121 105 113 109 98 84 74 90 72 90 25.0% 279 248 -11.1% 281 248 -11.9%Motor Vehicle Theft 9 5 6 8 9 12 5 7 8 7 3 6 8 6 21 16 -23.8% 24 16 -33.3%
5 Year % Change 10 Year % Change % Change Average 5 Year Avg. Average 10 Year Avg.
2008 2009 2010 2011 2012 2013 2014 2015* 2016* 2017* 2016-17 2012-16 vs. 2017 2007-16 vs. 2017
Total Index Crimes 2,755 2,689 2,775 2,689 2,714 2,357 2,551 2,441 2,154 2,083 -3.3% 2,443 -14.7% 2,567 -18.9%
Violent Crimes 392 349 423 371 334 372 369 428 362 351 -3.0% 373 -5.9% 375 -6.3%Murder 5 3 2 0 7 1 7 9 3 6 5 4 Rape* 19 17 22 23 14 15 19 25 25 31 24.0% N/A N/A N/A N/ARobbery 152 154 137 112 111 145 110 149 102 114 11.8% 123 -7.6% 130 -12.5%Aggravated Assault 216 175 262 236 202 211 233 245 232 200 -13.8% 225 -11.0% 220 -9.2%
Property Crimes 2,363 2,340 2,352 2,318 2,380 1,985 2,182 2,013 1,792 1,732 -3.3% 2,070 -16.3% 2,193 -21.0%Burglary 600 608 656 775 593 593 540 433 394 370 -6.1% 511 -27.5% 577 -35.9%Larceny 1,650 1,612 1,551 1,442 1,685 1,305 1,512 1,476 1,308 1,272 -2.8% 1,457 -12.7% 1,499 -15.1%Motor Vehicle Theft 113 120 145 101 102 87 130 104 90 90 0.0% 103 -12.3% 117 -22.7%
*PLEASE SEE Definitions Page for Reporting Changes to the Index Crime of Rape effective March 2016, which also impacts violent and Index crime totals.
NOTE: Percentage change is not calculated when counts are fewer than 10 and the 5-year and 10-year Averages are rounded to the nearest whole number.
As of 04/18/2018
Index Crimes
Troy City Police Department (UCR)
Year to Date Comparisons
% Change 2017-182017 2018
% Change From Month in Previous Year
5 Year Average
% Change5 Year Avg.
vs. 20182018
2000
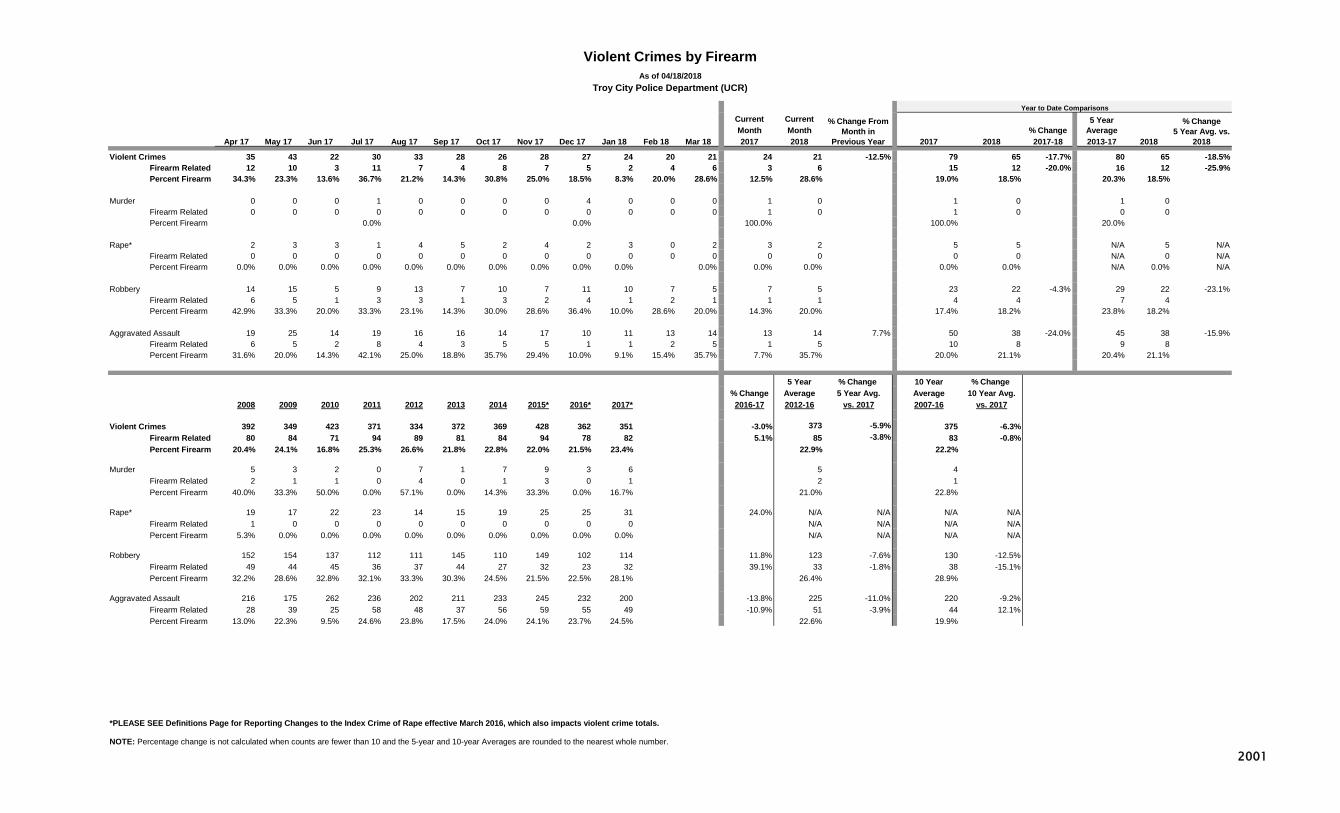
Current CurrentMonth Month % Change
Apr 17 May 17 Jun 17 Jul 17 Aug 17 Sep 17 Oct 17 Nov 17 Dec 17 Jan 18 Feb 18 Mar 18 2017 2018 2017 2018 2017-18 2013-17
Violent Crimes 35 43 22 30 33 28 26 28 27 24 20 21 24 21 -12.5% 79 65 -17.7% 80 65 -18.5%Firearm Related 12 10 3 11 7 4 8 7 5 2 4 6 3 6 15 12 -20.0% 16 12 -25.9%Percent Firearm 34.3% 23.3% 13.6% 36.7% 21.2% 14.3% 30.8% 25.0% 18.5% 8.3% 20.0% 28.6% 12.5% 28.6% 19.0% 18.5% 20.3% 18.5%
Murder 0 0 0 1 0 0 0 0 4 0 0 0 1 0 1 0 1 0
Firearm Related 0 0 0 0 0 0 0 0 0 0 0 0 1 0 1 0 0 0 Percent Firearm 0.0% 0.0% 100.0% 100.0% 20.0%
Rape* 2 3 3 1 4 5 2 4 2 3 0 2 3 2 5 5 N/A 5 N/AFirearm Related 0 0 0 0 0 0 0 0 0 0 0 0 0 0 0 0 N/A 0 N/APercent Firearm 0.0% 0.0% 0.0% 0.0% 0.0% 0.0% 0.0% 0.0% 0.0% 0.0% 0.0% 0.0% 0.0% 0.0% 0.0% N/A 0.0% N/A
Robbery 14 15 5 9 13 7 10 7 11 10 7 5 7 5 23 22 -4.3% 29 22 -23.1%Firearm Related 6 5 1 3 3 1 3 2 4 1 2 1 1 1 4 4 7 4 Percent Firearm 42.9% 33.3% 20.0% 33.3% 23.1% 14.3% 30.0% 28.6% 36.4% 10.0% 28.6% 20.0% 14.3% 20.0% 17.4% 18.2% 23.8% 18.2%
Aggravated Assault 19 25 14 19 16 16 14 17 10 11 13 14 13 14 7.7% 50 38 -24.0% 45 38 -15.9%Firearm Related 6 5 2 8 4 3 5 5 1 1 2 5 1 5 10 8 9 8 Percent Firearm 31.6% 20.0% 14.3% 42.1% 25.0% 18.8% 35.7% 29.4% 10.0% 9.1% 15.4% 35.7% 7.7% 35.7% 20.0% 21.1% 20.4% 21.1%
5 Year % Change 10 Year % Change % Change Average 5 Year Avg. Average 10 Year Avg.
2008 2009 2010 2011 2012 2013 2014 2015* 2016* 2017* 2016-17 2012-16 vs. 2017 2007-16 vs. 2017
Violent Crimes 392 349 423 371 334 372 369 428 362 351 -3.0% 373 -5.9% 375 -6.3%Firearm Related 80 84 71 94 89 81 84 94 78 82 5.1% 85 -3.8% 83 -0.8%Percent Firearm 20.4% 24.1% 16.8% 25.3% 26.6% 21.8% 22.8% 22.0% 21.5% 23.4% 22.9% 22.2%
Murder 5 3 2 0 7 1 7 9 3 6 5 4 Firearm Related 2 1 1 0 4 0 1 3 0 1 2 1 Percent Firearm 40.0% 33.3% 50.0% 0.0% 57.1% 0.0% 14.3% 33.3% 0.0% 16.7% 21.0% 22.8%
Rape* 19 17 22 23 14 15 19 25 25 31 24.0% N/A N/A N/A N/AFirearm Related 1 0 0 0 0 0 0 0 0 0 N/A N/A N/A N/APercent Firearm 5.3% 0.0% 0.0% 0.0% 0.0% 0.0% 0.0% 0.0% 0.0% 0.0% N/A N/A N/A N/A
Robbery 152 154 137 112 111 145 110 149 102 114 11.8% 123 -7.6% 130 -12.5%Firearm Related 49 44 45 36 37 44 27 32 23 32 39.1% 33 -1.8% 38 -15.1%Percent Firearm 32.2% 28.6% 32.8% 32.1% 33.3% 30.3% 24.5% 21.5% 22.5% 28.1% 26.4% 28.9%
Aggravated Assault 216 175 262 236 202 211 233 245 232 200 -13.8% 225 -11.0% 220 -9.2%Firearm Related 28 39 25 58 48 37 56 59 55 49 -10.9% 51 -3.9% 44 12.1%Percent Firearm 13.0% 22.3% 9.5% 24.6% 23.8% 17.5% 24.0% 24.1% 23.7% 24.5% 22.6% 19.9%
*PLEASE SEE Definitions Page for Reporting Changes to the Index Crime of Rape effective March 2016, which also impacts violent crime totals.
NOTE: Percentage change is not calculated when counts are fewer than 10 and the 5-year and 10-year Averages are rounded to the nearest whole number.
Violent Crimes by FirearmAs of 04/18/2018
Troy City Police Department (UCR)
% Change From Month in
Previous Year
5 Year Average
% Change5 Year Avg. vs.
20182018
Year to Date Comparisons
2001

Current CurrentMonth Month % Change
Apr 17 May 17 Jun 17 Jul 17 Aug 17 Sep 17 Oct 17 Nov 17 Dec 17 Jan 18 Feb 18 Mar 18 2017 2018 2017 2018 2017-18 2013-17
Shooting Incidents Involving Injury 1 1 0 2 2 0 2 0 0 1 1 0 1 0 2 2 2 2
Shooting Victims (Persons Hit) 1 1 0 2 2 0 2 0 0 1 1 0 1 0 2 2 2 2
Individuals Killed by Gun Violence 0 0 0 0 0 0 0 0 0 0 0 0 1 0 1 0 0 0
5 Year % Change % Change Average 5 Year Avg.
Totals 2009 2010 2011 2012 2013 2014 2015 2016 2017 2016-17 2012-16 vs. 2017
Shooting Incidents Involving Injury 9 14 10 11 7 11 13 7 10 10
Shooting Victims (Persons Hit) 9 14 14 11 9 16 17 7 10 12 -16.7%
Individuals Killed by Gun Violence 1 1 0 4 0 1 3 0 1 2
NOTE: Percentage change is not calculated when counts are fewer than 10 and the 5-year Average is rounded to the nearest whole number.
Firearm Activity As of 04/06/2018
Troy City Police Department
Year to Date Comparisons
% Change From Month in Previous Year
5 Year Average
% Change5 Year Avg.
vs. 20182018
2002

% Change % ChangeFrom Current Current From Month % Change
Previous Month Month in Previous YTD YTD in Apr 17 May 17 Jun 17 Jul 17 Aug 17 Sep 17 Oct 17 Nov 17 Dec 17 Jan 18 Feb 18 Mar 18 Month 2017 2018 Year 2017 2018 YTD
Total Aggravated Assaults 19 25 14 19 16 16 14 17 10 11 13 14 7.7% 13 14 7.7% 50 38 -24.0%Victims of DV-Related Aggravated Assaults 4 3 4 1 1 2 5 6 2 6 4 6 5 6 9 16 Percent DV-Related (Aggravated Assaults) 21.1% 12.0% 28.6% 5.3% 6.3% 12.5% 35.7% 35.3% 20.0% 54.5% 30.8% 42.9% 38.5% 42.9% 18.0% 42.1% Intimate Partner Victims* 3 3 4 1 1 2 5 4 1 1 3 6 2 6 6 10
Intimate Partner - Female Victim 3 3 2 1 0 2 4 3 1 1 2 4 2 4 4 7 Intimate Partner - Male Victim 0 0 2 0 1 0 1 1 0 0 1 2 0 2 2 3
Other Family Victim 1 0 0 0 0 0 0 2 1 5 1 0 3 0 3 6
Total Simple Assaults 114 127 89 116 91 91 104 85 72 88 57 96 68.4% 71 96 35.2% 250 241 -3.6%Victims of DV-Related Simple Assaults** 48 76 47 82 65 56 56 48 45 54 29 51 75.9% 49 51 4.1% 109 134 22.9%Percent DV-Related (Simple Assaults) 42.1% 59.8% 52.8% 70.7% 71.4% 61.5% 53.8% 56.5% 62.5% 61.4% 50.9% 53.1% 69.0% 53.1% 43.6% 55.6% Intimate Partner Victims 31 58 35 55 48 39 38 40 35 36 22 43 95.5% 35 43 22.9% 78 101 29.5%
Intimate Partner - Female Victim 22 51 28 48 43 31 32 36 30 29 19 32 68.4% 27 32 18.5% 63 80 27.0%Intimate Partner - Male Victim 9 7 7 7 5 8 6 4 5 7 3 11 8 11 15 21 40.0%
Other Family Victim 17 18 12 27 17 17 18 8 10 18 7 8 14 8 31 33 6.5%
% Change2009 2010 2011 2012 2013 2014 2015 2016 2017 16 vs. 17
Total Aggravated Assaults 175 262 236 202 211 233 245 232 200 -13.8%Victims of DV-Related Aggravated Assaults 13 21 19 25 54 54 72 57 37 -35.1%Percent DV-Related (Aggravated Assaults) 7.4% 8.0% 8.1% 12.4% 25.6% 23.2% 29.4% 24.6% 18.5% Intimate Partner Victims* 3 5 5 3 38 41 49 46 30 -34.8%
Intimate Partner - Female Victim 3 5 5 0 26 31 29 32 23 -28.1%Intimate Partner - Male Victim 0 0 0 3 12 10 20 14 7
Other Family Victim 10 16 14 22 16 13 23 11 7
Total Simple Assaults 1,145 1,174 1,370 1,428 1,362 1,388 1,378 1,212 1,139 -6.0%Victims of DV-Related Simple Assaults 129 116 141 181 400 504 552 382 632 65.4%Percent DV-Related (Simple Assaults) 11.3% 9.9% 10.3% 12.7% 29.4% 36.3% 40.1% 31.5% 55.5% Intimate Partner Victims* 36 30 49 52 280 354 392 289 457 58.1%
Intimate Partner - Female Victim 27 23 39 42 209 268 286 217 384 77.0%Intimate Partner - Male Victim 9 7 10 10 71 86 106 72 73 1.4%
Other Family Victim 93 86 92 129 120 150 160 93 175 88.2%
Note: Troy started including boyfriend/girlfriend within the intimate partner category in May 2013.
Intimate Partner (Female/Male): includes spouse, ex-spouse, and those in an intimate relationship (including dating or formerly dating relationships, whether or not the intimate partners had ever lived together).
Other Family: includes sibling, child, grandparent, grandchild, in-law, stepparent, stepsibling, and other family blood and in-law relationships
*Percent change is not calculated where counts are less than 10.**Troy City PD is currently reviewing Simple Assault DV Victim data for February and March 2017.
Domestic Violence VictimsAs of 04/18/2018
Troy City Police Department (UCR)
2003
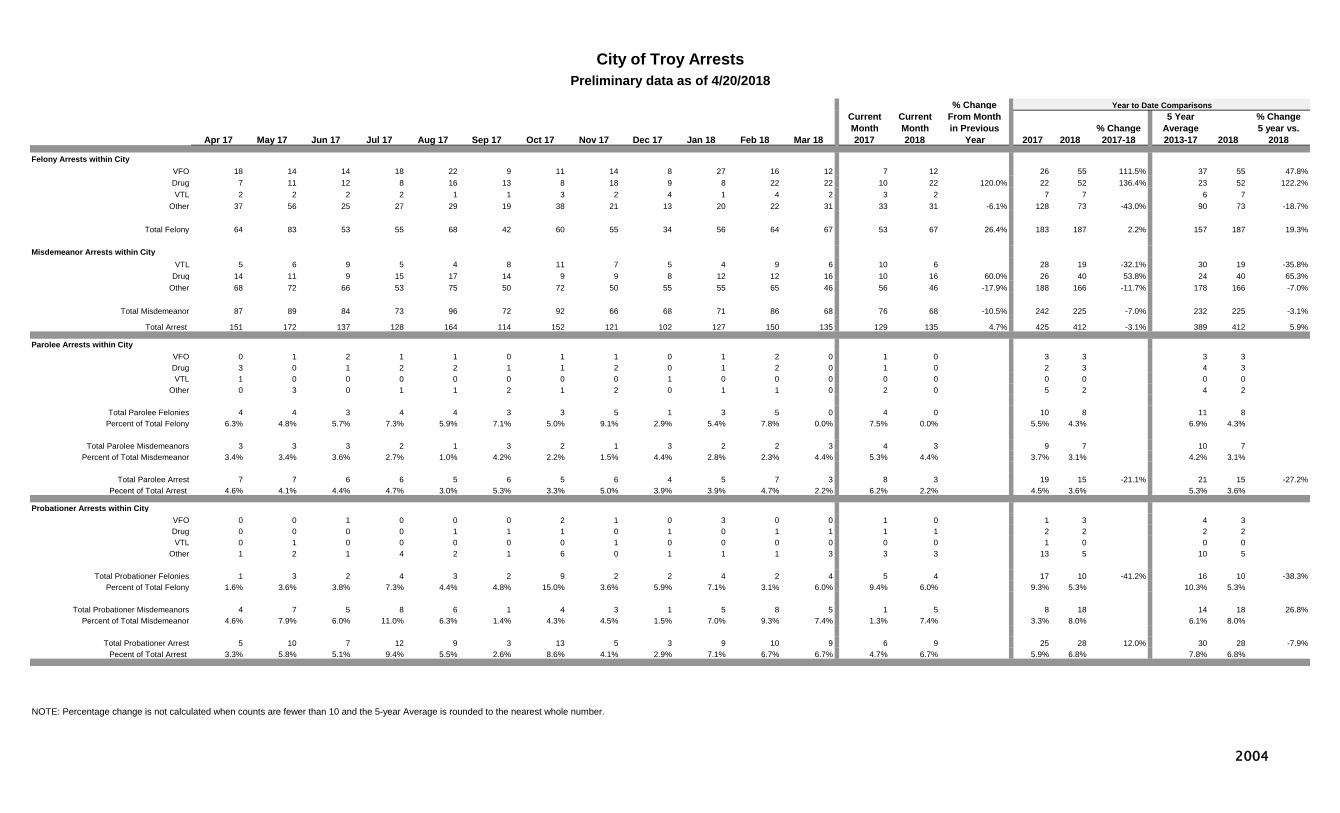
% ChangeCurrent Current From MonthMonth Month in Previous % Change
Apr 17 May 17 Jun 17 Jul 17 Aug 17 Sep 17 Oct 17 Nov 17 Dec 17 Jan 18 Feb 18 Mar 18 2017 2018 Year 2017 2018 2017-18 2013-17
Felony Arrests within CityVFO 18 14 14 18 22 9 11 14 8 27 16 12 7 12 26 55 111.5% 37 55 47.8%Drug 7 11 12 8 16 13 8 18 9 8 22 22 10 22 120.0% 22 52 136.4% 23 52 122.2%VTL 2 2 2 2 1 1 3 2 4 1 4 2 3 2 7 7 6 7
Other 37 56 25 27 29 19 38 21 13 20 22 31 33 31 -6.1% 128 73 -43.0% 90 73 -18.7%
Total Felony 64 83 53 55 68 42 60 55 34 56 64 67 53 67 26.4% 183 187 2.2% 157 187 19.3%
Misdemeanor Arrests within CityVTL 5 6 9 5 4 8 11 7 5 4 9 6 10 6 28 19 -32.1% 30 19 -35.8%
Drug 14 11 9 15 17 14 9 9 8 12 12 16 10 16 60.0% 26 40 53.8% 24 40 65.3%Other 68 72 66 53 75 50 72 50 55 55 65 46 56 46 -17.9% 188 166 -11.7% 178 166 -7.0%
Total Misdemeanor 87 89 84 73 96 72 92 66 68 71 86 68 76 68 -10.5% 242 225 -7.0% 232 225 -3.1%
Total Arrest 151 172 137 128 164 114 152 121 102 127 150 135 129 135 4.7% 425 412 -3.1% 389 412 5.9%
Parolee Arrests within CityVFO 0 1 2 1 1 0 1 1 0 1 2 0 1 0 3 3 3 3 Drug 3 0 1 2 2 1 1 2 0 1 2 0 1 0 2 3 4 3 VTL 1 0 0 0 0 0 0 0 1 0 0 0 0 0 0 0 0 0
Other 0 3 0 1 1 2 1 2 0 1 1 0 2 0 5 2 4 2
Total Parolee Felonies 4 4 3 4 4 3 3 5 1 3 5 0 4 0 10 8 11 8 Percent of Total Felony 6.3% 4.8% 5.7% 7.3% 5.9% 7.1% 5.0% 9.1% 2.9% 5.4% 7.8% 0.0% 7.5% 0.0% 5.5% 4.3% 6.9% 4.3%
Total Parolee Misdemeanors 3 3 3 2 1 3 2 1 3 2 2 3 4 3 9 7 10 7 Percent of Total Misdemeanor 3.4% 3.4% 3.6% 2.7% 1.0% 4.2% 2.2% 1.5% 4.4% 2.8% 2.3% 4.4% 5.3% 4.4% 3.7% 3.1% 4.2% 3.1%
Total Parolee Arrest 7 7 6 6 5 6 5 6 4 5 7 3 8 3 19 15 -21.1% 21 15 -27.2%Pecent of Total Arrest 4.6% 4.1% 4.4% 4.7% 3.0% 5.3% 3.3% 5.0% 3.9% 3.9% 4.7% 2.2% 6.2% 2.2% 4.5% 3.6% 5.3% 3.6%
Probationer Arrests within CityVFO 0 0 1 0 0 0 2 1 0 3 0 0 1 0 1 3 4 3 Drug 0 0 0 0 1 1 1 0 1 0 1 1 1 1 2 2 2 2 VTL 0 1 0 0 0 0 0 1 0 0 0 0 0 0 1 0 0 0
Other 1 2 1 4 2 1 6 0 1 1 1 3 3 3 13 5 10 5
Total Probationer Felonies 1 3 2 4 3 2 9 2 2 4 2 4 5 4 17 10 -41.2% 16 10 -38.3%Percent of Total Felony 1.6% 3.6% 3.8% 7.3% 4.4% 4.8% 15.0% 3.6% 5.9% 7.1% 3.1% 6.0% 9.4% 6.0% 9.3% 5.3% 10.3% 5.3%
Total Probationer Misdemeanors 4 7 5 8 6 1 4 3 1 5 8 5 1 5 8 18 14 18 26.8%Percent of Total Misdemeanor 4.6% 7.9% 6.0% 11.0% 6.3% 1.4% 4.3% 4.5% 1.5% 7.0% 9.3% 7.4% 1.3% 7.4% 3.3% 8.0% 6.1% 8.0%
Total Probationer Arrest 5 10 7 12 9 3 13 5 3 9 10 9 6 9 25 28 12.0% 30 28 -7.9%Pecent of Total Arrest 3.3% 5.8% 5.1% 9.4% 5.5% 2.6% 8.6% 4.1% 2.9% 7.1% 6.7% 6.7% 4.7% 6.7% 5.9% 6.8% 7.8% 6.8%
NOTE: Percentage change is not calculated when counts are fewer than 10 and the 5-year Average is rounded to the nearest whole number.
City of Troy ArrestsPreliminary data as of 4/20/2018
Year to Date Comparisons5 Year
Average% Change5 year vs.
20182018
2004

Current CurrentMonth Month
Apr 17 May 17 Jun 17 Jul 17 Aug 17 Sep 17 Oct 17 Nov 17 Dec 17 Jan 18 Feb 18 Mar 18 2017 2018 2013-17
Total Index Crimes 176 176 173 234 245 188 202 210 182 146 125 171 169 171 1.2% 537 442 -17.7% 508 442 -13.0%
Violent Crimes 22 32 28 26 27 17 42 32 23 25 18 24 35 24 -31.4% 88 67 -23.9% 74 67 -9.0%Murder 0 0 0 0 0 0 1 0 0 1 0 2 0 2 2 3 2 3 Rape* 2 2 2 3 5 2 5 6 4 5 0 2 4 2 11 7 9 7 N/ARobbery 6 4 5 4 8 3 6 7 5 5 5 8 7 8 30 18 -40.0% 23 18 -22.4%Aggravated Assault 14 26 21 19 14 12 30 19 14 14 13 12 24 12 -50.0% 45 39 -13.3% 39 39 -0.5%
Property Crimes 154 144 145 208 218 171 160 178 159 121 107 147 134 147 9.7% 449 375 -16.5% 435 375 -13.7%Burglary 29 25 34 39 46 42 28 28 29 19 18 17 16 17 6.3% 76 54 -28.9% 76 54 -29.1%Larceny 117 115 109 160 164 122 126 143 127 99 81 121 112 121 8.0% 360 301 -16.4% 341 301 -11.8%Motor Vehicle Theft 8 4 2 9 8 7 6 7 3 3 8 9 6 9 13 20 53.8% 17 20 17.6%
5 Year % Change 10 Year % Change % Change Average 5 Year Avg. Average 10 Year Avg.
2008 2009 2010 2011 2012 2013 2014 2015* 2016* 2017* 2016-17 2012-16 vs. 2017 2007-16 vs. 2017
Total Index Crimes 3,259 3,061 3,138 2,883 3,115 2,890 2,775 2,556 2,652 2,323 -12.4% 2,798 -17.0% 2,965 -21.6%
Violent Crimes 478 477 416 383 406 361 390 357 387 337 -12.9% 380 -11.4% 409 -17.6%Murder 4 5 2 4 1 7 6 6 3 3 5 4 Rape* 20 18 25 17 23 27 22 52 46 42 -8.7% N/A N/A N/A N/ARobbery 181 149 146 103 127 102 125 87 115 78 -32.2% 111 -29.9% 128 -39.0%Aggravated Assault 273 305 243 259 255 225 237 212 223 214 -4.0% 230 -7.1% 250 -14.3%
Property Crimes 2,781 2,584 2,722 2,500 2,709 2,529 2,385 2,199 2,265 1,986 -12.3% 2,417 -17.8% 2,556 -22.3%Burglary 732 506 576 614 589 449 432 443 435 376 -13.6% 470 -19.9% 553 -32.0%Larceny 1,929 2,001 2,065 1,811 2,018 1,998 1,846 1,662 1,751 1,543 -11.9% 1,855 -16.8% 1,905 -19.0%Motor Vehicle Theft 120 77 81 75 102 82 107 94 79 67 -15.2% 93 -27.8% 98 -31.6%
*PLEASE SEE Definitions Page for Reporting Changes to the Index Crime of Rape effective March 2016, which also impacts violent and Index crime totals.
NOTE: Percentage change is not calculated when counts are fewer than 10 and the 5-year and 10-year Averages are rounded to the nearest whole number.
As of 04/03/2018
Index Crimes
Utica City Police Department (IBR)
Year to Date Comparisons
% Change 2017-182017 2018
% Change From Month in Previous Year
5 Year Average
% Change5 Year Avg.
vs. 20182018
2100

Current CurrentMonth Month % Change
Apr 17 May 17 Jun 17 Jul 17 Aug 17 Sep 17 Oct 17 Nov 17 Dec 17 Jan 18 Feb 18 Mar 18 2017 2018 2017 2018 2017-18 2013-17
Violent Crimes 22 32 28 26 27 17 42 32 23 25 18 24 35 24 -31.4% 88 67 -23.9% 74 67 -9.0%Firearm Related 6 4 6 3 7 4 11 8 5 8 0 7 7 7 22 15 -31.8% 21 15 -27.2%Percent Firearm 27.3% 12.5% 21.4% 11.5% 25.9% 23.5% 26.2% 25.0% 21.7% 32.0% 0.0% 29.2% 20.0% 29.2% 25.0% 22.4% 28.0% 22.4%
Murder 0 0 0 0 0 0 1 0 0 1 0 2 0 2 2 3 2 3
Firearm Related 0 0 0 0 0 0 1 0 0 0 0 1 0 1 1 1 1 1 Percent Firearm 100.0% 0.0% 50.0% 50.0% 50.0% 33.3% 50.0% 33.3%
Rape* 2 2 2 3 5 2 5 6 4 5 0 2 4 2 11 7 N/A 7 N/AFirearm Related 0 0 0 0 0 0 0 0 0 0 0 0 0 0 0 0 N/A 0 N/APercent Firearm 0.0% 0.0% 0.0% 0.0% 0.0% 0.0% 0.0% 0.0% 0.0% 0.0% 0.0% 0.0% 0.0% 0.0% 0.0% N/A 0.0% N/A
Robbery 6 4 5 4 8 3 6 7 5 5 5 8 7 8 30 18 -40.0% 23 18 -22.4%Firearm Related 2 1 2 0 4 2 0 2 1 2 0 3 3 3 10 5 9 5 Percent Firearm 33.3% 25.0% 40.0% 0.0% 50.0% 66.7% 0.0% 28.6% 20.0% 40.0% 0.0% 37.5% 42.9% 37.5% 33.3% 27.8% 39.7% 27.8%
Aggravated Assault 14 26 21 19 14 12 30 19 14 14 13 12 24 12 -50.0% 45 39 -13.3% 39 39 -0.5%Firearm Related 4 3 4 3 3 2 10 6 4 6 0 3 4 3 11 9 10 9 Percent Firearm 28.6% 11.5% 19.0% 15.8% 21.4% 16.7% 33.3% 31.6% 28.6% 42.9% 0.0% 25.0% 16.7% 25.0% 24.4% 23.1% 26.5% 23.1%
5 Year % Change 10 Year % Change % Change Average 5 Year Avg. Average 10 Year Avg.
2008 2009 2010 2011 2012 2013 2014 2015* 2016* 2017* 2016-17 2012-16 vs. 2017 2007-16 vs. 2017
Violent Crimes 478 477 416 383 406 361 390 357 387 337 -12.9% 380 -11.4% 409 -17.6%Firearm Related 138 127 95 84 73 80 141 96 94 76 -19.1% 97 -21.5% 104 -27.0%Percent Firearm 28.9% 26.6% 22.8% 21.9% 18.0% 22.2% 36.2% 26.9% 24.3% 22.6% 25.5% 25.4%
Murder 4 5 2 4 1 7 6 6 3 3 5 4 Firearm Related 3 3 1 2 1 5 3 2 2 2 3 3 Percent Firearm 75.0% 60.0% 50.0% 50.0% 100.0% 71.4% 50.0% 33.3% 66.7% 66.7% 64.3% 63.6%
Rape* 20 18 25 17 23 27 22 52 46 42 -8.7% N/A N/A N/A N/AFirearm Related 0 0 0 0 0 0 0 0 1 0 N/A N/A N/A N/APercent Firearm 0.0% 0.0% 0.0% 0.0% 0.0% 0.0% 0.0% 0.0% 2.2% 0.0% N/A N/A N/A N/A
Robbery 181 149 146 103 127 102 125 87 115 78 -32.2% 111 -29.9% 128 -39.0%Firearm Related 53 50 36 21 31 28 60 41 28 24 -14.3% 38 -36.2% 38 -37.3%Percent Firearm 29.3% 33.6% 24.7% 20.4% 24.4% 27.5% 48.0% 47.1% 24.3% 30.8% 34.3% 30.4%
Aggravated Assault 273 305 243 259 255 225 237 212 223 214 -4.0% 230 -7.1% 250 -14.3%Firearm Related 82 74 58 61 41 47 78 53 63 50 -20.6% 56 -11.3% 63 -20.8%Percent Firearm 30.0% 24.3% 23.9% 23.6% 16.1% 20.9% 32.9% 25.0% 28.3% 23.4% 24.6% 25.3%
*PLEASE SEE Definitions Page for Reporting Changes to the Index Crime of Rape effective March 2016, which also impacts violent crime totals.
NOTE: Percentage change is not calculated when counts are fewer than 10 and the 5-year and 10-year Averages are rounded to the nearest whole number.
Violent Crimes by FirearmAs of 04/03/2018
Utica City Police Department (IBR)
% Change From Month in
Previous Year
5 Year Average
% Change5 Year Avg. vs.
20182018
Year to Date Comparisons
2101
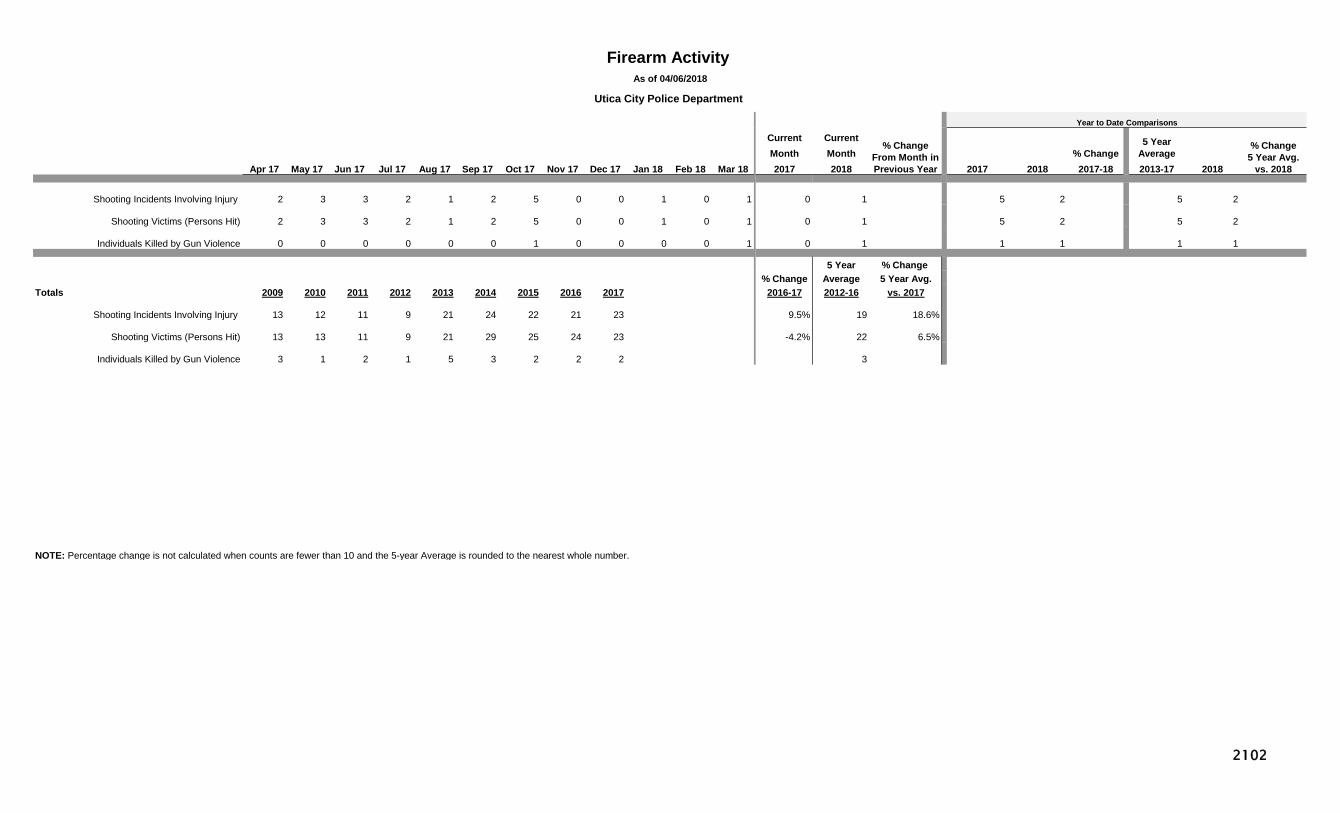
Current CurrentMonth Month % Change
Apr 17 May 17 Jun 17 Jul 17 Aug 17 Sep 17 Oct 17 Nov 17 Dec 17 Jan 18 Feb 18 Mar 18 2017 2018 2017 2018 2017-18 2013-17
Shooting Incidents Involving Injury 2 3 3 2 1 2 5 0 0 1 0 1 0 1 5 2 5 2
Shooting Victims (Persons Hit) 2 3 3 2 1 2 5 0 0 1 0 1 0 1 5 2 5 2
Individuals Killed by Gun Violence 0 0 0 0 0 0 1 0 0 0 0 1 0 1 1 1 1 1
5 Year % Change % Change Average 5 Year Avg.
Totals 2009 2010 2011 2012 2013 2014 2015 2016 2017 2016-17 2012-16 vs. 2017
Shooting Incidents Involving Injury 13 12 11 9 21 24 22 21 23 9.5% 19 18.6%
Shooting Victims (Persons Hit) 13 13 11 9 21 29 25 24 23 -4.2% 22 6.5%
Individuals Killed by Gun Violence 3 1 2 1 5 3 2 2 2 3
NOTE: Percentage change is not calculated when counts are fewer than 10 and the 5-year Average is rounded to the nearest whole number.
Firearm Activity As of 04/06/2018
Utica City Police Department
Year to Date Comparisons
% Change From Month in Previous Year
5 Year Average
% Change5 Year Avg.
vs. 20182018
2102

% Change % ChangeFrom Current Current From Month % Change
Previous Month Month in Previous YTD YTD in Apr 17 May 17 Jun 17 Jul 17 Aug 17 Sep 17 Oct 17 Nov 17 Dec 17 Jan 18 Feb 18 Mar 18 Month 2017 2018 Year 2017 2018 YTD
Total Aggravated Assaults 14 26 21 19 14 12 30 19 14 14 13 12 -7.7% 24 12 -50.0% 45 39 -13.3%Victims of DV-Related Aggravated Assaults 3 7 4 6 4 6 10 8 6 3 2 3 10 3 13 8 Percent DV-Related (Aggravated Assaults) 21.4% 26.9% 19.0% 31.6% 28.6% 50.0% 33.3% 42.1% 42.9% 21.4% 15.4% 25.0% 41.7% 25.0% 28.9% 20.5% Intimate Partner Victims 2 6 3 5 2 4 6 4 3 3 2 0 4 0 7 5
Intimate Partner - Female Victim 1 5 3 2 1 3 6 2 3 2 2 0 4 0 6 4 Intimate Partner - Male Victim 1 1 0 3 1 1 0 2 0 1 0 0 0 0 1 1
Other Family Victim 1 1 1 1 2 2 4 4 3 0 0 3 6 3 6 3
Total Simple Assaults 133 149 154 143 146 156 122 89 93 97 96 114 18.8% 126 114 -9.5% 414 307 -25.8%Victims of DV-Related Simple Assaults 67 103 87 80 90 83 78 46 53 61 66 72 9.1% 75 72 -4.0% 247 199 -19.4%Percent DV-Related (Simple Assaults) 50.4% 69.1% 56.5% 55.9% 61.6% 53.2% 63.9% 51.7% 57.0% 62.9% 68.8% 63.2% 59.5% 63.2% 59.7% 64.8% Intimate Partner Victims 52 80 67 65 73 66 62 39 40 46 48 50 4.2% 53 50 -5.7% 186 144 -22.6%
Intimate Partner - Female Victim 41 69 57 52 57 52 53 33 30 36 44 38 -13.6% 43 38 -11.6% 140 118 -15.7%Intimate Partner - Male Victim 11 11 10 13 16 14 9 6 10 10 4 12 10 12 20.0% 46 26 -43.5%
Other Family Victim 15 23 20 15 17 17 16 7 13 15 18 22 22.2% 22 22 0.0% 61 55 -9.8%
% Change2009 2010 2011 2012 2013 2014 2015 2016 2017 16 vs. 17
Total Aggravated Assaults 305 243 259 255 225 237 212 223 214 -4.0%Victims of DV-Related Aggravated Assaults 67 78 71 77 61 57 56 65 67 3.1%Percent DV-Related (Aggravated Assaults) 22.0% 32.1% 27.4% 30.2% 27.1% 24.1% 26.4% 29.1% 31.3% Intimate Partner Victims 37 40 46 46 41 38 32 44 42 -4.5%
Intimate Partner - Female Victim 30 26 30 24 27 28 24 36 32 -11.1%Intimate Partner - Male Victim 7 14 16 22 14 10 8 8 10
Other Family Victim 30 38 25 31 20 19 24 21 25 19.0%
Total Simple Assaults 1,831 1,934 1,776 1,828 1,604 1,550 1,533 1,700 1,599 -5.9%Victims of DV-Related Simple Assaults 741 897 903 984 883 908 942 1,046 934 -10.7%Percent DV-Related (Simple Assaults) 40.5% 46.4% 50.8% 53.8% 55.0% 58.6% 61.4% 61.5% 58.4% Intimate Partner Victims 598 668 641 729 688 658 686 802 730 -9.0%
Intimate Partner - Female Victim 498 555 527 605 557 537 581 637 584 -8.3%Intimate Partner - Male Victim 100 113 114 124 131 121 105 165 146 -11.5%
Other Family Victim 143 229 262 255 195 250 256 244 204 -16.4%
Note: Utica IBR data is "crunched" into UCR domestic violence crime categories and relationships.
Intimate Partner (Female/Male): includes spouse, ex-spouse, and those in an intimate relationship (including dating or formerly dating relationships, whether or not the intimate partners had ever lived together).
Other Family: includes sibling, child, grandparent, grandchild, in-law, stepparent, stepsibling, and other family blood and in-law relationships
*Percent change is not calculated where counts are less than 10.
Domestic Violence VictimsAs of 04/03/2018
Utica City Police Department (IBR)
2103

% ChangeCurrent Current From MonthMonth Month in Previous % Change
Apr 17 May 17 Jun 17 Jul 17 Aug 17 Sep 17 Oct 17 Nov 17 Dec 17 Jan 18 Feb 18 Mar 18 2017 2018 Year 2017 2018 2017-18 2013-17
Felony Arrests within CityVFO 16 11 13 6 19 10 13 8 12 5 9 19 15 19 26.7% 52 33 -36.5% 34 33 -1.8%Drug 13 14 19 18 26 19 15 13 11 11 14 7 12 7 43 32 -25.6% 36 32 -12.1%VTL 1 1 2 3 3 1 2 2 8 4 3 4 2 4 4 11 6 11
Other 21 24 26 27 27 26 26 29 17 25 16 30 39 30 -23.1% 108 71 -34.3% 69 71 2.3%
Total Felony 51 50 60 54 75 56 56 52 48 45 42 60 68 60 -11.8% 207 147 -29.0% 145 147 1.2%
Misdemeanor Arrests within CityVTL 3 6 5 5 10 3 2 7 3 1 0 4 5 4 19 5 26 5
Drug 35 23 41 32 35 39 33 28 27 21 24 31 34 31 -8.8% 94 76 -19.1% 68 76 11.4%Other 110 116 119 118 156 129 111 104 115 103 81 105 121 105 -13.2% 376 289 -23.1% 327 289 -11.7%
Total Misdemeanor 148 145 165 155 201 171 146 139 145 125 105 140 160 140 -12.5% 489 370 -24.3% 422 370 -12.3%
Total Arrest 199 195 225 209 276 227 202 191 193 170 147 200 228 200 -12.3% 696 517 -25.7% 567 517 -8.8%
Parolee Arrests within CityVFO 0 0 0 0 0 2 1 1 0 1 0 1 1 1 4 2 3 2 Drug 2 2 4 2 5 6 3 3 1 1 2 1 2 1 8 4 6 4 VTL 0 0 0 0 0 0 0 0 0 0 0 0 0 0 0 0 0 0
Other 1 0 1 2 2 1 1 0 3 1 0 0 3 0 5 1 3 1
Total Parolee Felonies 3 2 5 4 7 9 5 4 4 3 2 2 6 2 17 7 12 7 Percent of Total Felony 5.9% 4.0% 8.3% 7.4% 9.3% 16.1% 8.9% 7.7% 8.3% 6.7% 4.8% 3.3% 8.8% 3.3% 8.2% 4.8% 8.4% 4.8%
Total Parolee Misdemeanors 16 6 13 7 8 2 9 7 6 5 5 4 6 4 20 14 -30.0% 21 14 -33.3%Percent of Total Misdemeanor 10.8% 4.1% 7.9% 4.5% 4.0% 1.2% 6.2% 5.0% 4.1% 4.0% 4.8% 2.9% 3.8% 2.9% 4.1% 3.8% 5.0% 3.8%
Total Parolee Arrest 19 8 18 11 15 11 14 11 10 8 7 6 12 6 37 21 -43.2% 33 21 -36.7%Pecent of Total Arrest 9.5% 4.1% 8.0% 5.3% 5.4% 4.8% 6.9% 5.8% 5.2% 4.7% 4.8% 3.0% 5.3% 3.0% 5.3% 4.1% 5.9% 4.1%
Probationer Arrests within CityVFO 0 2 4 0 0 2 1 0 1 1 2 3 0 3 1 6 1 6 Drug 2 0 2 2 2 0 0 1 1 0 1 1 3 1 7 2 3 2 VTL 0 0 1 0 1 0 0 0 0 1 0 0 0 0 0 1 0 1
Other 3 4 2 3 3 3 3 5 0 2 2 0 1 0 11 4 6 4
Total Probationer Felonies 5 6 9 5 6 5 4 6 2 4 5 4 4 4 19 13 -31.6% 10 13 25.0%Percent of Total Felony 9.8% 12.0% 15.0% 9.3% 8.0% 8.9% 7.1% 11.5% 4.2% 8.9% 11.9% 6.7% 5.9% 6.7% 9.2% 8.8% 7.2% 8.8%
Total Probationer Misdemeanors 8 15 12 6 10 8 6 13 6 5 4 9 14 9 32 18 -43.8% 28 18 -35.3%Percent of Total Misdemeanor 5.4% 10.3% 7.3% 3.9% 5.0% 4.7% 4.1% 9.4% 4.1% 4.0% 3.8% 6.4% 8.8% 6.4% 6.5% 4.9% 6.6% 4.9%
Total Probationer Arrest 13 21 21 11 16 13 10 19 8 9 9 13 18 13 -27.8% 51 31 -39.2% 38 31 -18.8%Pecent of Total Arrest 6.5% 10.8% 9.3% 5.3% 5.8% 5.7% 5.0% 9.9% 4.1% 5.3% 6.1% 6.5% 7.9% 6.5% 7.3% 6.0% 6.7% 6.0%
NOTE: Percentage change is not calculated when counts are fewer than 10 and the 5-year Average is rounded to the nearest whole number.
City of Utica ArrestsPreliminary data as of 4/20/2018
Year to Date Comparisons5 Year
Average% Change5 year vs.
20182018
2104
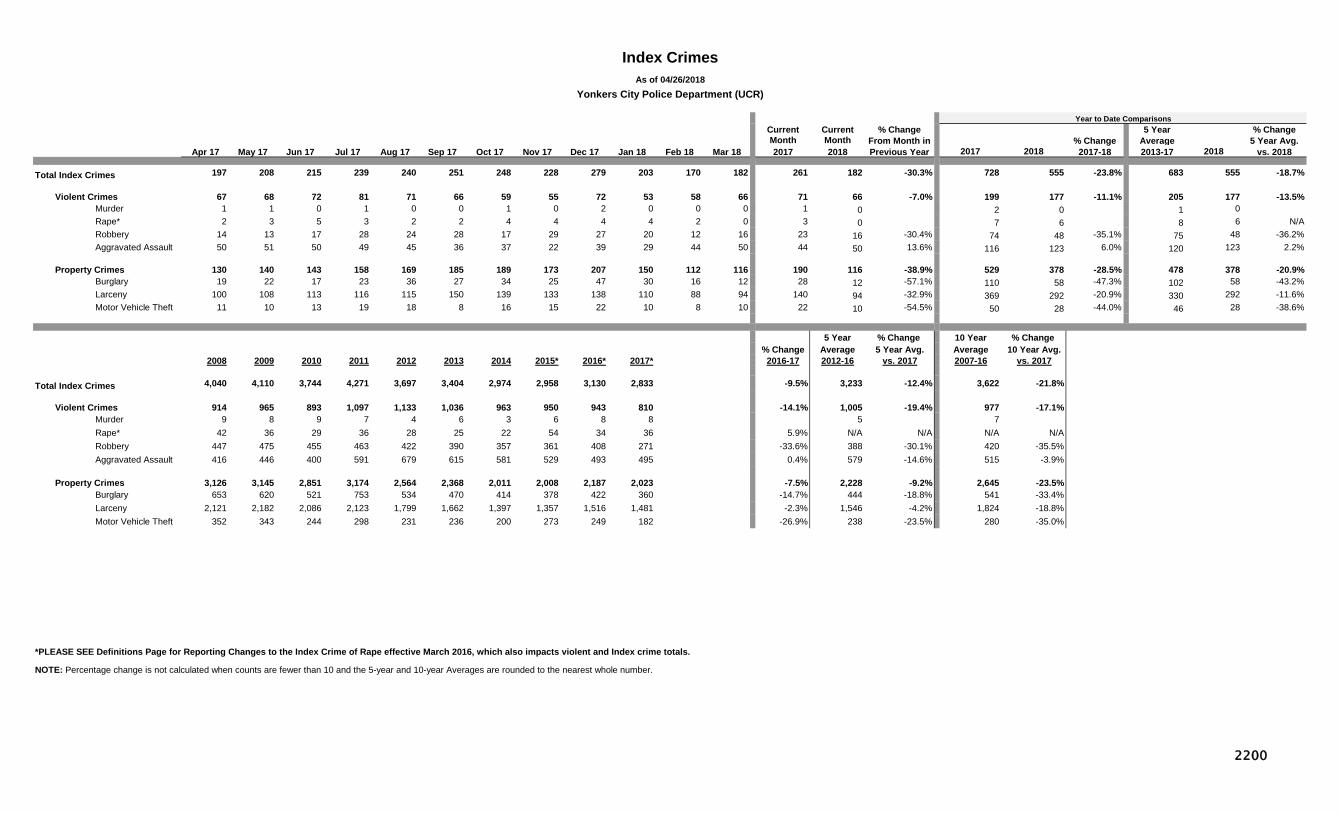
Current CurrentMonth Month
Apr 17 May 17 Jun 17 Jul 17 Aug 17 Sep 17 Oct 17 Nov 17 Dec 17 Jan 18 Feb 18 Mar 18 2017 2018 2013-17
Total Index Crimes 197 208 215 239 240 251 248 228 279 203 170 182 261 182 -30.3% 728 555 -23.8% 683 555 -18.7%
Violent Crimes 67 68 72 81 71 66 59 55 72 53 58 66 71 66 -7.0% 199 177 -11.1% 205 177 -13.5%Murder 1 1 0 1 0 0 1 0 2 0 0 0 1 0 2 0 1 0 Rape* 2 3 5 3 2 2 4 4 4 4 2 0 3 0 7 6 8 6 N/ARobbery 14 13 17 28 24 28 17 29 27 20 12 16 23 16 -30.4% 74 48 -35.1% 75 48 -36.2%Aggravated Assault 50 51 50 49 45 36 37 22 39 29 44 50 44 50 13.6% 116 123 6.0% 120 123 2.2%
Property Crimes 130 140 143 158 169 185 189 173 207 150 112 116 190 116 -38.9% 529 378 -28.5% 478 378 -20.9%Burglary 19 22 17 23 36 27 34 25 47 30 16 12 28 12 -57.1% 110 58 -47.3% 102 58 -43.2%Larceny 100 108 113 116 115 150 139 133 138 110 88 94 140 94 -32.9% 369 292 -20.9% 330 292 -11.6%Motor Vehicle Theft 11 10 13 19 18 8 16 15 22 10 8 10 22 10 -54.5% 50 28 -44.0% 46 28 -38.6%
5 Year % Change 10 Year % Change % Change Average 5 Year Avg. Average 10 Year Avg.
2008 2009 2010 2011 2012 2013 2014 2015* 2016* 2017* 2016-17 2012-16 vs. 2017 2007-16 vs. 2017
Total Index Crimes 4,040 4,110 3,744 4,271 3,697 3,404 2,974 2,958 3,130 2,833 -9.5% 3,233 -12.4% 3,622 -21.8%
Violent Crimes 914 965 893 1,097 1,133 1,036 963 950 943 810 -14.1% 1,005 -19.4% 977 -17.1%Murder 9 8 9 7 4 6 3 6 8 8 5 7 Rape* 42 36 29 36 28 25 22 54 34 36 5.9% N/A N/A N/A N/ARobbery 447 475 455 463 422 390 357 361 408 271 -33.6% 388 -30.1% 420 -35.5%Aggravated Assault 416 446 400 591 679 615 581 529 493 495 0.4% 579 -14.6% 515 -3.9%
Property Crimes 3,126 3,145 2,851 3,174 2,564 2,368 2,011 2,008 2,187 2,023 -7.5% 2,228 -9.2% 2,645 -23.5%Burglary 653 620 521 753 534 470 414 378 422 360 -14.7% 444 -18.8% 541 -33.4%Larceny 2,121 2,182 2,086 2,123 1,799 1,662 1,397 1,357 1,516 1,481 -2.3% 1,546 -4.2% 1,824 -18.8%Motor Vehicle Theft 352 343 244 298 231 236 200 273 249 182 -26.9% 238 -23.5% 280 -35.0%
*PLEASE SEE Definitions Page for Reporting Changes to the Index Crime of Rape effective March 2016, which also impacts violent and Index crime totals.
NOTE: Percentage change is not calculated when counts are fewer than 10 and the 5-year and 10-year Averages are rounded to the nearest whole number.
As of 04/26/2018
Index Crimes
Yonkers City Police Department (UCR)
Year to Date Comparisons
% Change 2017-182017 2018
% Change From Month in Previous Year
5 Year Average
% Change5 Year Avg.
vs. 20182018
2200
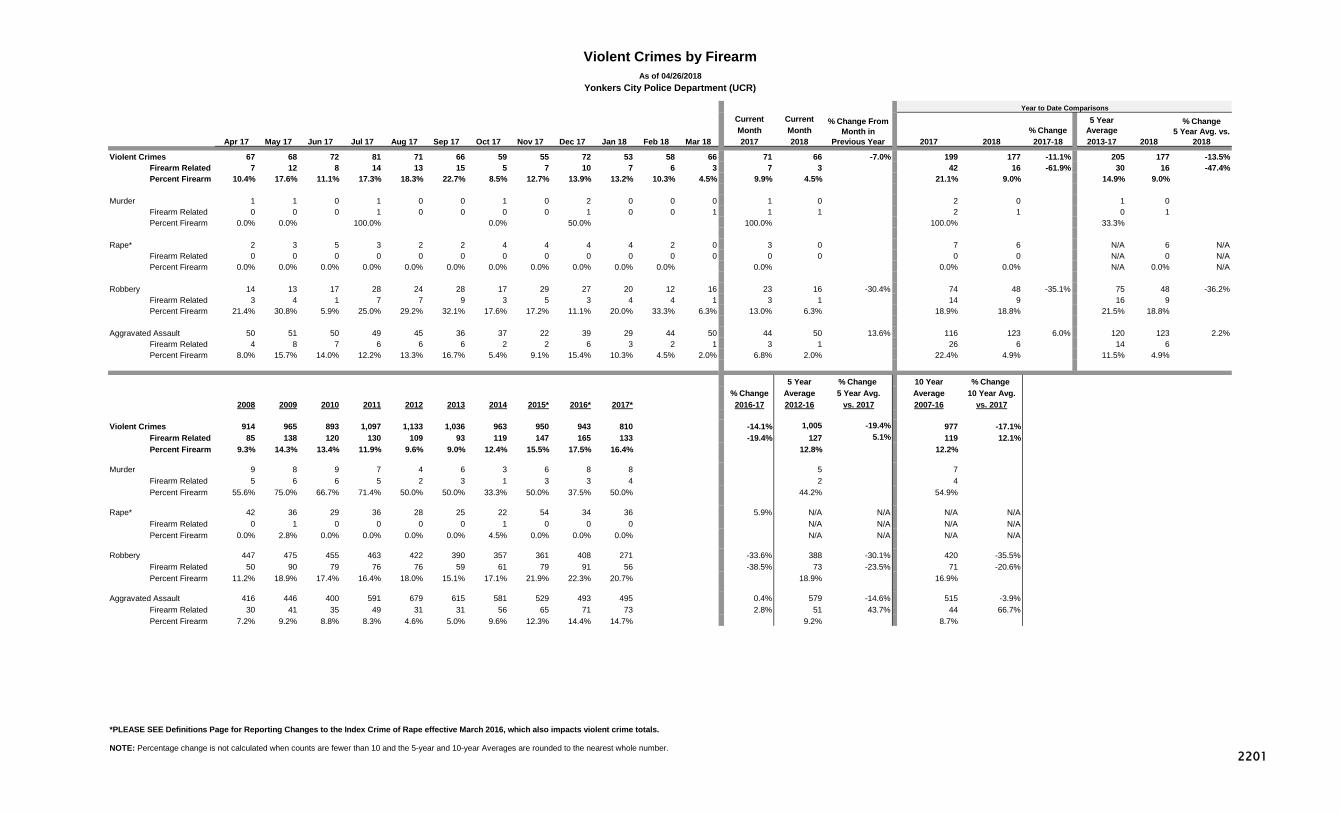
Current CurrentMonth Month % Change
Apr 17 May 17 Jun 17 Jul 17 Aug 17 Sep 17 Oct 17 Nov 17 Dec 17 Jan 18 Feb 18 Mar 18 2017 2018 2017 2018 2017-18 2013-17
Violent Crimes 67 68 72 81 71 66 59 55 72 53 58 66 71 66 -7.0% 199 177 -11.1% 205 177 -13.5%Firearm Related 7 12 8 14 13 15 5 7 10 7 6 3 7 3 42 16 -61.9% 30 16 -47.4%Percent Firearm 10.4% 17.6% 11.1% 17.3% 18.3% 22.7% 8.5% 12.7% 13.9% 13.2% 10.3% 4.5% 9.9% 4.5% 21.1% 9.0% 14.9% 9.0%
Murder 1 1 0 1 0 0 1 0 2 0 0 0 1 0 2 0 1 0
Firearm Related 0 0 0 1 0 0 0 0 1 0 0 1 1 1 2 1 0 1 Percent Firearm 0.0% 0.0% 100.0% 0.0% 50.0% 100.0% 100.0% 33.3%
Rape* 2 3 5 3 2 2 4 4 4 4 2 0 3 0 7 6 N/A 6 N/AFirearm Related 0 0 0 0 0 0 0 0 0 0 0 0 0 0 0 0 N/A 0 N/APercent Firearm 0.0% 0.0% 0.0% 0.0% 0.0% 0.0% 0.0% 0.0% 0.0% 0.0% 0.0% 0.0% 0.0% 0.0% N/A 0.0% N/A
Robbery 14 13 17 28 24 28 17 29 27 20 12 16 23 16 -30.4% 74 48 -35.1% 75 48 -36.2%Firearm Related 3 4 1 7 7 9 3 5 3 4 4 1 3 1 14 9 16 9 Percent Firearm 21.4% 30.8% 5.9% 25.0% 29.2% 32.1% 17.6% 17.2% 11.1% 20.0% 33.3% 6.3% 13.0% 6.3% 18.9% 18.8% 21.5% 18.8%
Aggravated Assault 50 51 50 49 45 36 37 22 39 29 44 50 44 50 13.6% 116 123 6.0% 120 123 2.2%Firearm Related 4 8 7 6 6 6 2 2 6 3 2 1 3 1 26 6 14 6 Percent Firearm 8.0% 15.7% 14.0% 12.2% 13.3% 16.7% 5.4% 9.1% 15.4% 10.3% 4.5% 2.0% 6.8% 2.0% 22.4% 4.9% 11.5% 4.9%
5 Year % Change 10 Year % Change % Change Average 5 Year Avg. Average 10 Year Avg.
2008 2009 2010 2011 2012 2013 2014 2015* 2016* 2017* 2016-17 2012-16 vs. 2017 2007-16 vs. 2017
Violent Crimes 914 965 893 1,097 1,133 1,036 963 950 943 810 -14.1% 1,005 -19.4% 977 -17.1%Firearm Related 85 138 120 130 109 93 119 147 165 133 -19.4% 127 5.1% 119 12.1%Percent Firearm 9.3% 14.3% 13.4% 11.9% 9.6% 9.0% 12.4% 15.5% 17.5% 16.4% 12.8% 12.2%
Murder 9 8 9 7 4 6 3 6 8 8 5 7 Firearm Related 5 6 6 5 2 3 1 3 3 4 2 4 Percent Firearm 55.6% 75.0% 66.7% 71.4% 50.0% 50.0% 33.3% 50.0% 37.5% 50.0% 44.2% 54.9%
Rape* 42 36 29 36 28 25 22 54 34 36 5.9% N/A N/A N/A N/AFirearm Related 0 1 0 0 0 0 1 0 0 0 N/A N/A N/A N/APercent Firearm 0.0% 2.8% 0.0% 0.0% 0.0% 0.0% 4.5% 0.0% 0.0% 0.0% N/A N/A N/A N/A
Robbery 447 475 455 463 422 390 357 361 408 271 -33.6% 388 -30.1% 420 -35.5%Firearm Related 50 90 79 76 76 59 61 79 91 56 -38.5% 73 -23.5% 71 -20.6%Percent Firearm 11.2% 18.9% 17.4% 16.4% 18.0% 15.1% 17.1% 21.9% 22.3% 20.7% 18.9% 16.9%
Aggravated Assault 416 446 400 591 679 615 581 529 493 495 0.4% 579 -14.6% 515 -3.9%Firearm Related 30 41 35 49 31 31 56 65 71 73 2.8% 51 43.7% 44 66.7%Percent Firearm 7.2% 9.2% 8.8% 8.3% 4.6% 5.0% 9.6% 12.3% 14.4% 14.7% 9.2% 8.7%
*PLEASE SEE Definitions Page for Reporting Changes to the Index Crime of Rape effective March 2016, which also impacts violent crime totals.
NOTE: Percentage change is not calculated when counts are fewer than 10 and the 5-year and 10-year Averages are rounded to the nearest whole number.
Violent Crimes by FirearmAs of 04/26/2018
Yonkers City Police Department (UCR)
% Change From Month in
Previous Year
5 Year Average
% Change5 Year Avg. vs.
20182018
Year to Date Comparisons
2201

Current CurrentMonth Month % Change
Apr 17 May 17 Jun 17 Jul 17 Aug 17 Sep 17 Oct 17 Nov 17 Dec 17 Jan 18 Feb 18 Mar 18 2017 2018 2017 2018 2017-18 2013-17
Shooting Incidents Involving Injury 2 1 1 5 3 3 1 1 2 2 0 2 2 2 9 4 6 4
Shooting Victims (Persons Hit) 2 1 2 6 3 4 1 1 2 2 0 2 2 2 9 4 6 4
Individuals Killed by Gun Violence 0 0 0 1 0 0 0 0 1 0 0 1 1 1 2 1 0 1
5 Year % Change % Change Average 5 Year Avg.
Totals 2009 2010 2011 2012 2013 2014 2015 2016 2017 2016-17 2012-16 vs. 2017
Shooting Incidents Involving Injury 43 31 21 8 12 27 34 35 28 -20.0% 23 20.7%
Shooting Victims (Persons Hit) 54 43 25 9 14 34 39 38 31 -18.4% 27 15.7%
Individuals Killed by Gun Violence 6 6 5 2 3 1 3 3 4 2
NOTE: Percentage change is not calculated when counts are fewer than 10 and the 5-year Average is rounded to the nearest whole number.
Firearm Activity As of 04/06/2018
Yonkers City Police Department
Year to Date Comparisons
% Change From Month in Previous Year
5 Year Average
% Change5 Year Avg.
vs. 20182018
2202

% Change % ChangeFrom Current Current From % Change
Previous Month Month in Previous YTD YTD in Apr 17 May 17 Jun 17 Jul 17 Aug 17 Sep 17 Oct 17 Nov 17 Dec 17 Jan 18 Feb 18 Mar 18 Month 2017 2018 Year 2017 2018 YTD
Total Aggravated Assaults 50 51 50 49 45 36 37 22 39 29 44 50 13.6% 44 50 13.6% 116 123 6.0%Victims of DV-Related Aggravated Assaults 16 10 8 13 12 8 10 5 8 10 10 11 10.0% 13 11 -15.4% 33 31 -6.1%Percent DV-Related (Aggravated Assaults) 32.0% 19.6% 16.0% 26.5% 26.7% 22.2% 27.0% 22.7% 20.5% 34.5% 22.7% 22.0% 29.5% 22.0% 28.4% 25.2% Intimate Partner Victims 10 6 4 7 8 8 7 5 4 8 9 6 7 6 24 23 -4.2%
Intimate Partner - Female Victim 9 4 4 7 6 4 5 4 3 8 8 5 6 5 20 21 5.0%Intimate Partner - Male Victim 1 2 0 0 2 4 2 1 1 0 1 1 1 1 4 2
Other Family Victim 6 4 4 6 4 0 3 0 4 2 1 5 6 5 9 8
Total Simple Assaults 55 69 60 57 47 50 54 54 47 43 46 56 21.7% 55 56 1.8% 167 145 -13.2%Victims of DV-Related Simple Assaults 28 28 27 28 18 21 20 21 25 13 18 17 -5.6% 29 17 -41.4% 80 48 -40.0%Percent DV-Related (Simple Assaults) 50.9% 40.6% 45.0% 49.1% 38.3% 42.0% 37.0% 38.9% 53.2% 30.2% 39.1% 30.4% 52.7% 30.4% 47.9% 33.1% Intimate Partner Victims 24 22 24 19 13 21 15 18 22 9 16 13 -18.8% 20 13 -35.0% 61 38 -37.7%
Intimate Partner - Female Victim 21 18 23 19 12 19 14 15 20 8 12 11 -8.3% 18 11 -38.9% 57 31 -45.6%Intimate Partner - Male Victim 3 4 1 0 1 2 1 3 2 1 4 2 2 2 4 7
Other Family Victim 4 6 3 9 5 0 5 3 3 4 2 4 9 4 19 10 -47.4%
% Change2009 2010 2011 2012 2013 2014 2015 2016 2017 16 vs. 17
Total Aggravated Assaults 446 400 591 679 615 581 529 493 495 0.4%Victims of DV-Related Aggravated Assaults 70 95 116 126 150 121 108 127 123 -3.1%Percent DV-Related (Aggravated Assaults) 15.7% 23.8% 19.6% 18.6% 24.4% 20.8% 20.4% 25.8% 24.8% Intimate Partner Victims 39 62 88 87 118 85 80 83 83 0.0%
Intimate Partner - Female Victim 32 50 63 63 87 61 62 61 66 8.2%Intimate Partner - Male Victim 7 12 25 24 31 24 18 22 17 -22.7%
Other Family Victim 31 33 28 39 32 36 28 44 40 -9.1%
Total Simple Assaults 738 1,135 1,087 1,008 908 779 809 669 660 -1.3%Victims of DV-Related Simple Assaults 351 556 439 451 401 379 412 255 296 16.1%Percent DV-Related (Simple Assaults) 47.6% 49.0% 40.4% 44.7% 44.2% 48.7% 50.9% 38.1% 44.8% Intimate Partner Victims 288 442 351 369 326 296 336 211 239 13.3%
Intimate Partner - Female Victim 257 410 309 292 296 264 310 193 218 13.0%Intimate Partner - Male Victim 31 32 42 77 30 32 26 18 21 16.7%
Other Family Victim 63 114 88 82 75 83 76 44 57 29.5%
Intimate Partner (Female/Male): includes spouse, ex-spouse, and those in an intimate relationship (including dating or formerly dating relationships, whether or not the intimate partners had ever lived together).
Other Family: includes sibling, child, grandparent, grandchild, in-law, stepparent, stepsibling, and other family blood and in-law relationships
*Percent change is not calculated where counts are less than 10.
Domestic Violence VictimsAs of 04/26/2018
Yonkers City Police Department (UCR)
2203
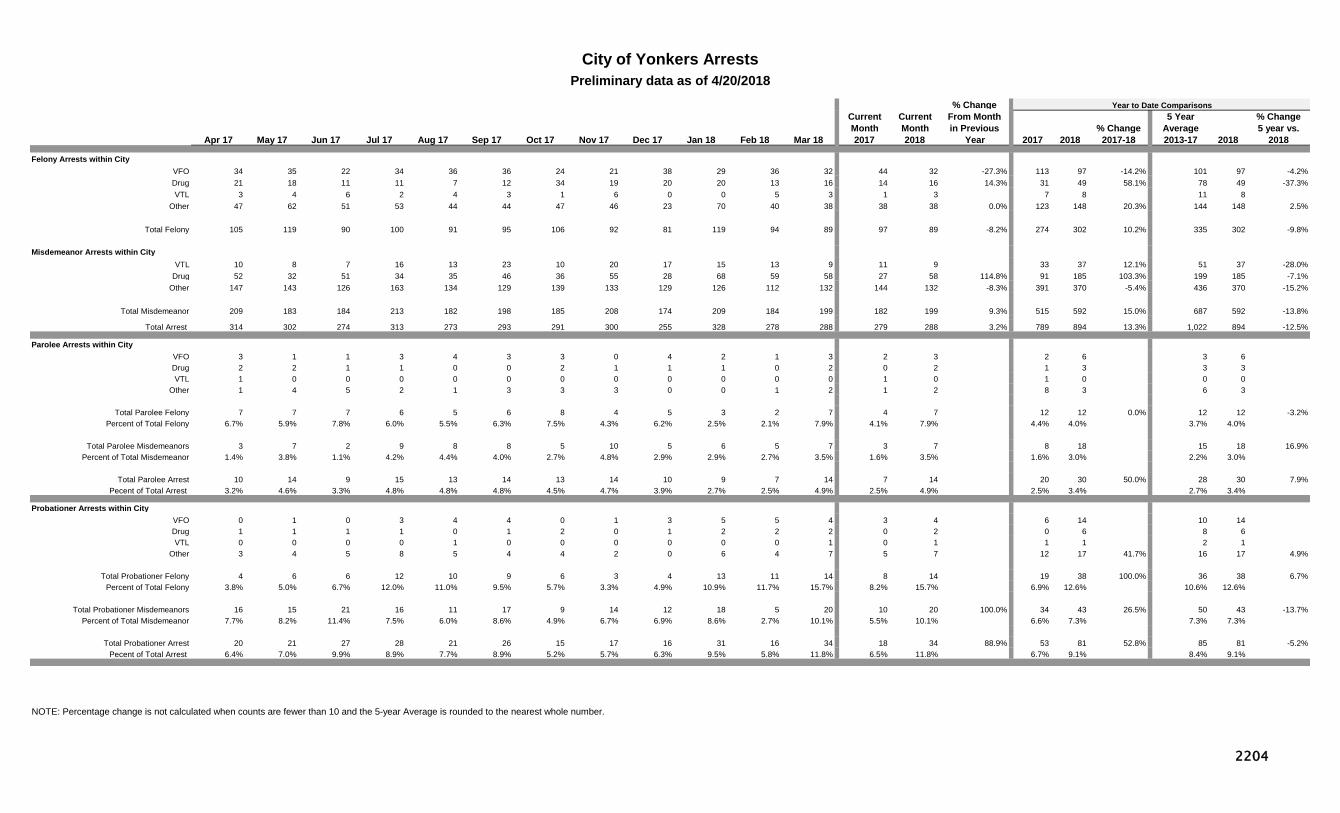
% ChangeCurrent Current From MonthMonth Month in Previous % Change
Apr 17 May 17 Jun 17 Jul 17 Aug 17 Sep 17 Oct 17 Nov 17 Dec 17 Jan 18 Feb 18 Mar 18 2017 2018 Year 2017 2018 2017-18 2013-17
Felony Arrests within CityVFO 34 35 22 34 36 36 24 21 38 29 36 32 44 32 -27.3% 113 97 -14.2% 101 97 -4.2%Drug 21 18 11 11 7 12 34 19 20 20 13 16 14 16 14.3% 31 49 58.1% 78 49 -37.3%VTL 3 4 6 2 4 3 1 6 0 0 5 3 1 3 7 8 11 8
Other 47 62 51 53 44 44 47 46 23 70 40 38 38 38 0.0% 123 148 20.3% 144 148 2.5%
Total Felony 105 119 90 100 91 95 106 92 81 119 94 89 97 89 -8.2% 274 302 10.2% 335 302 -9.8%
Misdemeanor Arrests within CityVTL 10 8 7 16 13 23 10 20 17 15 13 9 11 9 33 37 12.1% 51 37 -28.0%
Drug 52 32 51 34 35 46 36 55 28 68 59 58 27 58 114.8% 91 185 103.3% 199 185 -7.1%Other 147 143 126 163 134 129 139 133 129 126 112 132 144 132 -8.3% 391 370 -5.4% 436 370 -15.2%
Total Misdemeanor 209 183 184 213 182 198 185 208 174 209 184 199 182 199 9.3% 515 592 15.0% 687 592 -13.8%
Total Arrest 314 302 274 313 273 293 291 300 255 328 278 288 279 288 3.2% 789 894 13.3% 1,022 894 -12.5%
Parolee Arrests within CityVFO 3 1 1 3 4 3 3 0 4 2 1 3 2 3 2 6 3 6 Drug 2 2 1 1 0 0 2 1 1 1 0 2 0 2 1 3 3 3 VTL 1 0 0 0 0 0 0 0 0 0 0 0 1 0 1 0 0 0
Other 1 4 5 2 1 3 3 3 0 0 1 2 1 2 8 3 6 3
Total Parolee Felony 7 7 7 6 5 6 8 4 5 3 2 7 4 7 12 12 0.0% 12 12 -3.2%Percent of Total Felony 6.7% 5.9% 7.8% 6.0% 5.5% 6.3% 7.5% 4.3% 6.2% 2.5% 2.1% 7.9% 4.1% 7.9% 4.4% 4.0% 3.7% 4.0%
Total Parolee Misdemeanors 3 7 2 9 8 8 5 10 5 6 5 7 3 7 8 18 15 18 16.9%Percent of Total Misdemeanor 1.4% 3.8% 1.1% 4.2% 4.4% 4.0% 2.7% 4.8% 2.9% 2.9% 2.7% 3.5% 1.6% 3.5% 1.6% 3.0% 2.2% 3.0%
Total Parolee Arrest 10 14 9 15 13 14 13 14 10 9 7 14 7 14 20 30 50.0% 28 30 7.9%Pecent of Total Arrest 3.2% 4.6% 3.3% 4.8% 4.8% 4.8% 4.5% 4.7% 3.9% 2.7% 2.5% 4.9% 2.5% 4.9% 2.5% 3.4% 2.7% 3.4%
Probationer Arrests within CityVFO 0 1 0 3 4 4 0 1 3 5 5 4 3 4 6 14 10 14 Drug 1 1 1 1 0 1 2 0 1 2 2 2 0 2 0 6 8 6 VTL 0 0 0 0 1 0 0 0 0 0 0 1 0 1 1 1 2 1
Other 3 4 5 8 5 4 4 2 0 6 4 7 5 7 12 17 41.7% 16 17 4.9%
Total Probationer Felony 4 6 6 12 10 9 6 3 4 13 11 14 8 14 19 38 100.0% 36 38 6.7%Percent of Total Felony 3.8% 5.0% 6.7% 12.0% 11.0% 9.5% 5.7% 3.3% 4.9% 10.9% 11.7% 15.7% 8.2% 15.7% 6.9% 12.6% 10.6% 12.6%
Total Probationer Misdemeanors 16 15 21 16 11 17 9 14 12 18 5 20 10 20 100.0% 34 43 26.5% 50 43 -13.7%Percent of Total Misdemeanor 7.7% 8.2% 11.4% 7.5% 6.0% 8.6% 4.9% 6.7% 6.9% 8.6% 2.7% 10.1% 5.5% 10.1% 6.6% 7.3% 7.3% 7.3%
Total Probationer Arrest 20 21 27 28 21 26 15 17 16 31 16 34 18 34 88.9% 53 81 52.8% 85 81 -5.2%Pecent of Total Arrest 6.4% 7.0% 9.9% 8.9% 7.7% 8.9% 5.2% 5.7% 6.3% 9.5% 5.8% 11.8% 6.5% 11.8% 6.7% 9.1% 8.4% 9.1%
NOTE: Percentage change is not calculated when counts are fewer than 10 and the 5-year Average is rounded to the nearest whole number.
City of Yonkers ArrestsPreliminary data as of 4/20/2018
Year to Date Comparisons5 Year
Average% Change5 year vs.
20182018
2204
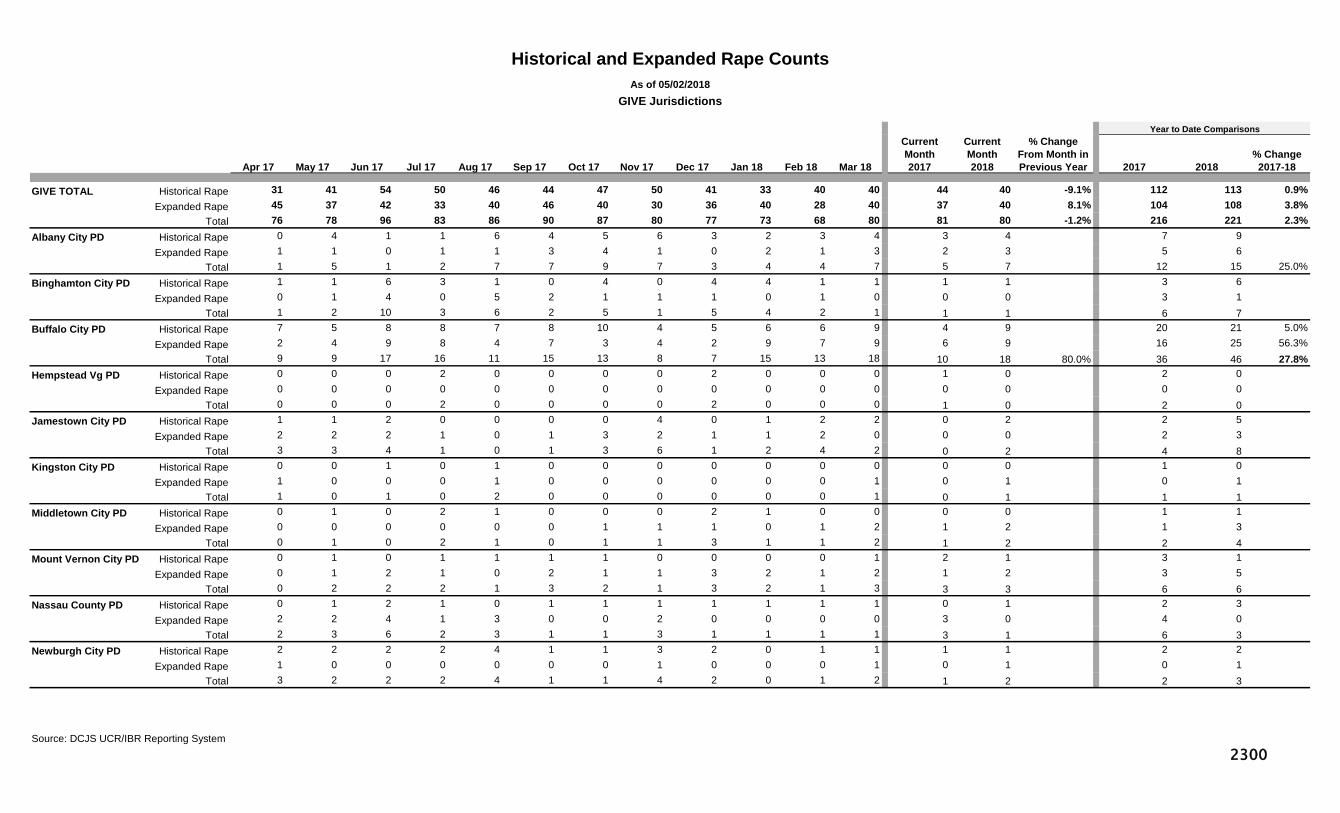
Current CurrentMonth Month
Apr 17 May 17 Jun 17 Jul 17 Aug 17 Sep 17 Oct 17 Nov 17 Dec 17 Jan 18 Feb 18 Mar 18 2017 2018
GIVE TOTAL Historical Rape 31 41 54 50 46 44 47 50 41 33 40 40 44 40 -9.1% 112 113 0.9%Expanded Rape 45 37 42 33 40 46 40 30 36 40 28 40 37 40 8.1% 104 108 3.8%
Total 76 78 96 83 86 90 87 80 77 73 68 80 81 80 -1.2% 216 221 2.3%Albany City PD Historical Rape 0 4 1 1 6 4 5 6 3 2 3 4 3 4 7 9
Expanded Rape 1 1 0 1 1 3 4 1 0 2 1 3 2 3 5 6 Total 1 5 1 2 7 7 9 7 3 4 4 7 5 7 12 15 25.0%
Binghamton City PD Historical Rape 1 1 6 3 1 0 4 0 4 4 1 1 1 1 3 6 Expanded Rape 0 1 4 0 5 2 1 1 1 0 1 0 0 0 3 1
Total 1 2 10 3 6 2 5 1 5 4 2 1 1 1 6 7 Buffalo City PD Historical Rape 7 5 8 8 7 8 10 4 5 6 6 9 4 9 20 21 5.0%
Expanded Rape 2 4 9 8 4 7 3 4 2 9 7 9 6 9 16 25 56.3%Total 9 9 17 16 11 15 13 8 7 15 13 18 10 18 80.0% 36 46 27.8%
Hempstead Vg PD Historical Rape 0 0 0 2 0 0 0 0 2 0 0 0 1 0 2 0 Expanded Rape 0 0 0 0 0 0 0 0 0 0 0 0 0 0 0 0
Total 0 0 0 2 0 0 0 0 2 0 0 0 1 0 2 0 Jamestown City PD Historical Rape 1 1 2 0 0 0 0 4 0 1 2 2 0 2 2 5
Expanded Rape 2 2 2 1 0 1 3 2 1 1 2 0 0 0 2 3 Total 3 3 4 1 0 1 3 6 1 2 4 2 0 2 4 8
Kingston City PD Historical Rape 0 0 1 0 1 0 0 0 0 0 0 0 0 0 1 0 Expanded Rape 1 0 0 0 1 0 0 0 0 0 0 1 0 1 0 1
Total 1 0 1 0 2 0 0 0 0 0 0 1 0 1 1 1 Middletown City PD Historical Rape 0 1 0 2 1 0 0 0 2 1 0 0 0 0 1 1
Expanded Rape 0 0 0 0 0 0 1 1 1 0 1 2 1 2 1 3 Total 0 1 0 2 1 0 1 1 3 1 1 2 1 2 2 4
Mount Vernon City PD Historical Rape 0 1 0 1 1 1 1 0 0 0 0 1 2 1 3 1 Expanded Rape 0 1 2 1 0 2 1 1 3 2 1 2 1 2 3 5
Total 0 2 2 2 1 3 2 1 3 2 1 3 3 3 6 6 Nassau County PD Historical Rape 0 1 2 1 0 1 1 1 1 1 1 1 0 1 2 3
Expanded Rape 2 2 4 1 3 0 0 2 0 0 0 0 3 0 4 0 Total 2 3 6 2 3 1 1 3 1 1 1 1 3 1 6 3
Newburgh City PD Historical Rape 2 2 2 2 4 1 1 3 2 0 1 1 1 1 2 2 Expanded Rape 1 0 0 0 0 0 0 1 0 0 0 1 0 1 0 1
Total 3 2 2 2 4 1 1 4 2 0 1 2 1 2 2 3
Source: DCJS UCR/IBR Reporting System
Historical and Expanded Rape CountsAs of 05/02/2018
GIVE Jurisdictions
% Change From Month in Previous Year
Year to Date Comparisons
% Change 2017-182017 2018
2300

Current CurrentMonth Month
Apr 17 May 17 Jun 17 Jul 17 Aug 17 Sep 17 Oct 17 Nov 17 Dec 17 Jan 18 Feb 18 Mar 18 2017 2018
Niagara Falls City PD Historical Rape 2 1 1 3 1 3 1 3 1 0 2 2 1 2 5 4
Expanded Rape 3 2 2 3 1 0 1 1 0 0 3 0 2 0 2 3 Total 5 3 3 6 2 3 2 4 1 0 5 2 3 2 7 7
Poughkeepsie City PD Historical Rape 1 2 2 0 1 1 3 1 0 0 2 0 2 0 3 2
Expanded Rape 1 1 3 1 0 2 3 0 3 0 0 1 0 1 0 1 Total 2 3 5 1 1 3 6 1 3 0 2 1 2 1 3 3
Rochester City PD Historical Rape 7 7 9 10 10 3 2 10 3 8 12 6 7 6 12 26 116.7%
Expanded Rape 6 6 2 5 9 8 6 5 5 6 2 3 3 3 16 11 -31.3%Total 13 13 11 15 19 11 8 15 8 14 14 9 10 9 28 37 32.1%
Schenectady City PD Historical Rape 1 3 2 3 1 5 0 2 3 1 2 2 5 2 10 5
Expanded Rape 1 0 4 2 5 4 4 3 1 2 7 6 0 6 4 15 Total 2 3 6 5 6 9 4 5 4 3 9 8 5 8 14 20 42.9%
Spring Valley Vg PD Historical Rape 0 0 1 2 0 2 2 2 1 0 0 4 0 4 1 4
Expanded Rape 3 1 2 0 2 1 2 0 1 0 1 2 0 2 5 3 Total 3 1 3 2 2 3 4 2 2 0 1 6 0 6 6 7
Suffolk County PD Historical Rape 3 1 3 7 2 2 1 0 2 1 0 0 8 0 13 1
Expanded Rape 16 9 7 4 2 7 5 5 11 4 1 5 5 5 14 10 -28.6%Total 19 10 10 11 4 9 6 5 13 5 1 5 13 5 27 11 -59.3%
Syracuse City PD Historical Rape 3 7 5 2 3 7 9 3 5 3 7 5 4 5 14 15 7.1%
Expanded Rape 3 3 0 2 3 6 2 0 4 7 0 3 9 3 17 10 -41.2%Total 6 10 5 4 6 13 11 3 9 10 7 8 13 8 31 25 -19.4%
Troy City PD Historical Rape 0 2 3 1 3 4 2 4 1 2 0 0 1 0 2 2
Expanded Rape 2 1 0 0 1 1 0 0 1 1 0 2 2 2 3 3 Total 2 3 3 1 4 5 2 4 2 3 0 2 3 2 5 5
Utica City PD Historical Rape 1 1 1 0 2 1 2 4 2 1 0 2 2 2 4 3
Expanded Rape 1 1 1 3 3 1 3 2 2 4 0 0 2 0 7 4 Total 2 2 2 3 5 2 5 6 4 5 0 2 4 2 11 7
Yonkers City PD Historical Rape 2 1 5 2 2 1 3 3 4 2 1 0 2 0 5 3
Expanded Rape 0 2 0 1 0 1 1 1 0 2 1 0 1 0 2 3 Total 2 3 5 3 2 2 4 4 4 4 2 0 3 0 7 6
Source: DCJS UCR/IBR Reporting System Source: DCJS UCR/IBR Reporting System
Historical and Expanded Rape CountsAs of 05/02/2018
GIVE Jurisdictions
% Change From Month in Previous Year
Year to Date Comparisons
% Change 2017-182017 2018
2301

ANNUAL CRIME AND ARREST ACTIVITY
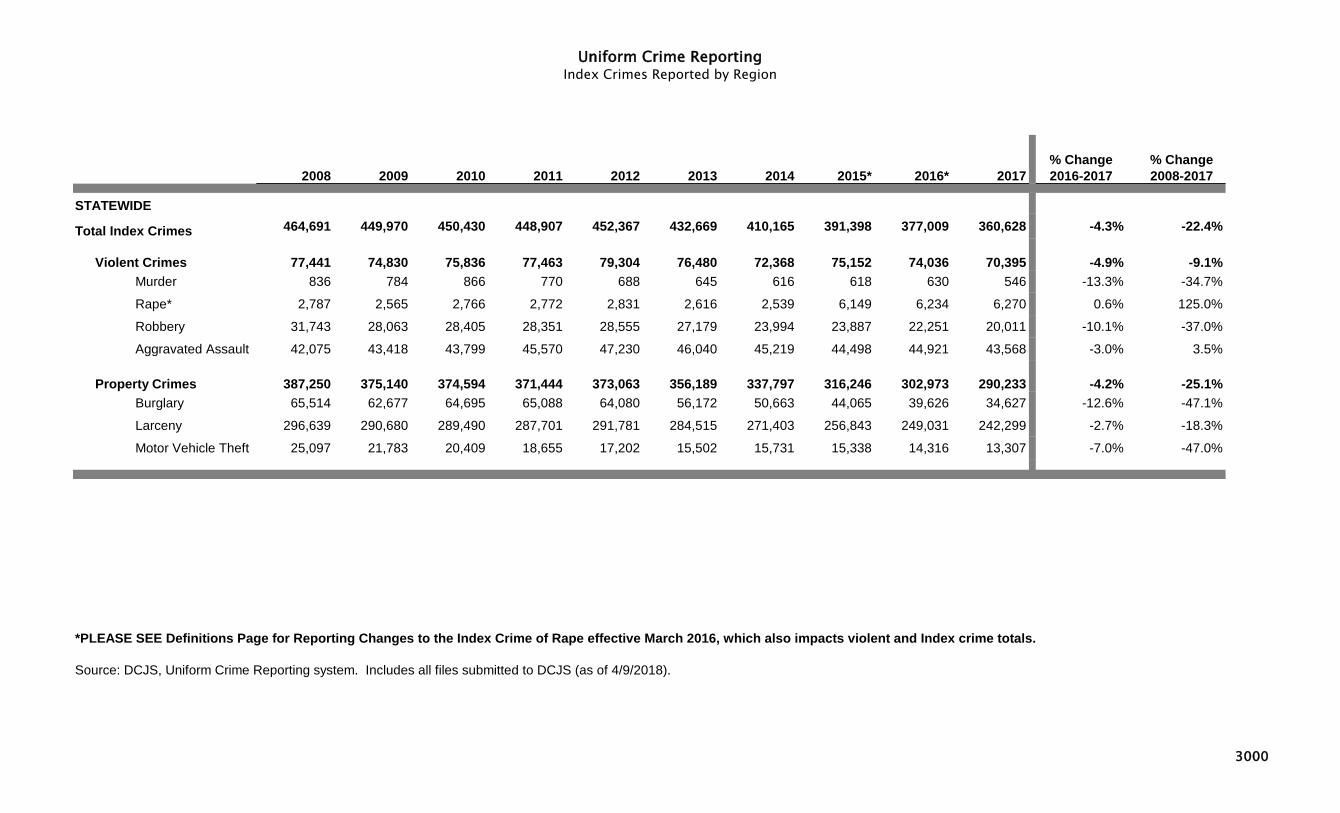
Uniform Crime Reporting Index Crimes Reported by Region
2008 2009 2010 2011 2012 2013 2014 2015* 2016* 2017% Change 2016-2017
% Change 2008-2017
STATEWIDE
Total Index Crimes 464,691 449,970 450,430 448,907 452,367 432,669 410,165 391,398 377,009 360,628 -4.3% -22.4%
Violent Crimes 77,441 74,830 75,836 77,463 79,304 76,480 72,368 75,152 74,036 70,395 -4.9% -9.1%Murder 836 784 866 770 688 645 616 618 630 546 -13.3% -34.7%
Rape* 2,787 2,565 2,766 2,772 2,831 2,616 2,539 6,149 6,234 6,270 0.6% 125.0%
Robbery 31,743 28,063 28,405 28,351 28,555 27,179 23,994 23,887 22,251 20,011 -10.1% -37.0%
Aggravated Assault 42,075 43,418 43,799 45,570 47,230 46,040 45,219 44,498 44,921 43,568 -3.0% 3.5%
Property Crimes 387,250 375,140 374,594 371,444 373,063 356,189 337,797 316,246 302,973 290,233 -4.2% -25.1%Burglary 65,514 62,677 64,695 65,088 64,080 56,172 50,663 44,065 39,626 34,627 -12.6% -47.1%
Larceny 296,639 290,680 289,490 287,701 291,781 284,515 271,403 256,843 249,031 242,299 -2.7% -18.3%
Motor Vehicle Theft 25,097 21,783 20,409 18,655 17,202 15,502 15,731 15,338 14,316 13,307 -7.0% -47.0%
*PLEASE SEE Definitions Page for Reporting Changes to the Index Crime of Rape effective March 2016, which also impacts violent and Index crime totals.
Source: DCJS, Uniform Crime Reporting system. Includes all files submitted to DCJS (as of 4/9/2018).
3000

Uniform Crime Reporting Index Crimes Reported by Region
2008 2009 2010 2011 2012 2013 2014 2015* 2016* 2017*% Change 2016-2017
% Change 2008-2017
NEW YORK CITYTotal Index Crimes 198,419 188,357 188,104 191,666 195,753 194,355 185,191 179,948 174,402 171,248 -1.8% -13.7%
Violent Crimes 48,430 46,357 48,489 51,209 52,993 52,384 49,444 50,088 49,124 46,433 -5.5% -4.1%Murder 523 471 536 515 419 335 333 352 335 292 -12.8% -44.2%Rape* 890 832 1,036 1,092 1,162 1,112 1,070 2,244 2,372 2,375 0.1% N/ARobbery 22,186 18,597 19,608 19,773 20,201 19,170 16,581 16,946 15,544 13,995 -10.0% -36.9%Aggravated Assault 24,831 26,457 27,309 29,829 31,211 31,767 31,460 30,546 30,873 29,771 -3.6% 19.9%
Property Crimes 149,989 142,000 139,615 140,457 142,760 141,971 135,747 129,860 125,278 124,815 -0.4% -16.8%Burglary 19,867 18,780 17,926 18,159 18,635 16,606 15,916 14,098 12,041 11,104 -7.8% -44.1%Larceny 117,682 112,526 111,370 112,864 115,935 117,931 112,107 108,376 106,868 107,976 1.0% -8.2%Motor Vehicle Theft 12,440 10,694 10,319 9,434 8,190 7,434 7,724 7,386 6,369 5,735 -10.0% -53.9%
NON-NEW YORK CITY 2008 2009 2010 2011 2012 2013 2014 2015* 2016* 2017*Total Index Crimes 266,272 261,613 262,326 257,241 256,614 238,314 224,974 211,450 202,607 189,380 -6.5% -28.9%
Violent Crimes 29,011 28,473 27,347 26,254 26,311 24,096 22,924 25,064 24,912 23,962 -3.8% -17.4%Murder 313 313 330 255 269 310 283 266 295 254 -13.9% -18.8%Rape* 1,897 1,733 1,730 1,680 1,669 1,504 1,469 3,905 3,862 3,895 0.9% N/ARobbery 9,557 9,466 8,797 8,578 8,354 8,009 7,413 6,941 6,707 6,016 -10.3% -37.1%Aggravated Assault 17,244 16,961 16,490 15,741 16,019 14,273 13,759 13,952 14,048 13,797 -1.8% -20.0%
Property Crimes 237,261 233,140 234,979 230,987 230,303 214,218 202,050 186,386 177,695 165,418 -6.9% -30.3%Burglary 45,647 43,897 46,769 46,929 45,445 39,566 34,747 29,967 27,585 23,523 -14.7% -48.5%Larceny 178,957 178,154 178,120 174,837 175,846 166,584 159,296 148,467 142,163 134,323 -5.5% -24.9%Motor Vehicle Theft 12,657 11,089 10,090 9,221 9,012 8,068 8,007 7,952 7,947 7,572 -4.7% -40.2%
Region as a Percent of Total Crime 2008 2009 2010 2011 2012 2013 2014 2015 2016 2017
New York City 42.7% 41.9% 41.8% 42.7% 43.3% 44.9% 45.2% 46.0% 46.3% 47.5% 0.6% 6.7%
Non-New York City 57.3% 58.1% 58.2% 57.3% 56.7% 55.1% 54.8% 54.0% 53.7% 52.5% -0.5% -5.1%
*PLEASE SEE Definitions Page for Reporting Changes to the Index Crime of Rape effective March 2016, which also impacts violent and Index crime totals.
Source: DCJS, Uniform Crime Reporting system. Includes all crime reports submitted to DCJS (as of 4/9/2018).
Note: The new Penal Law charges of Strangulation 1st (PL 121.13) and 2nd (PL 121.12), which were enacted in November 2010, are classified as aggravated assaults for crime reporting purposes. Prior to enactment, a significant number of incidents now classified as Strangulation 2nd (PL 121.12) would have been classified within the UCR as simple assaults. The New York City Police Department estimates that 60% of the City's overall increase in aggravated assault in 2011 is due to this change in classification.
3001
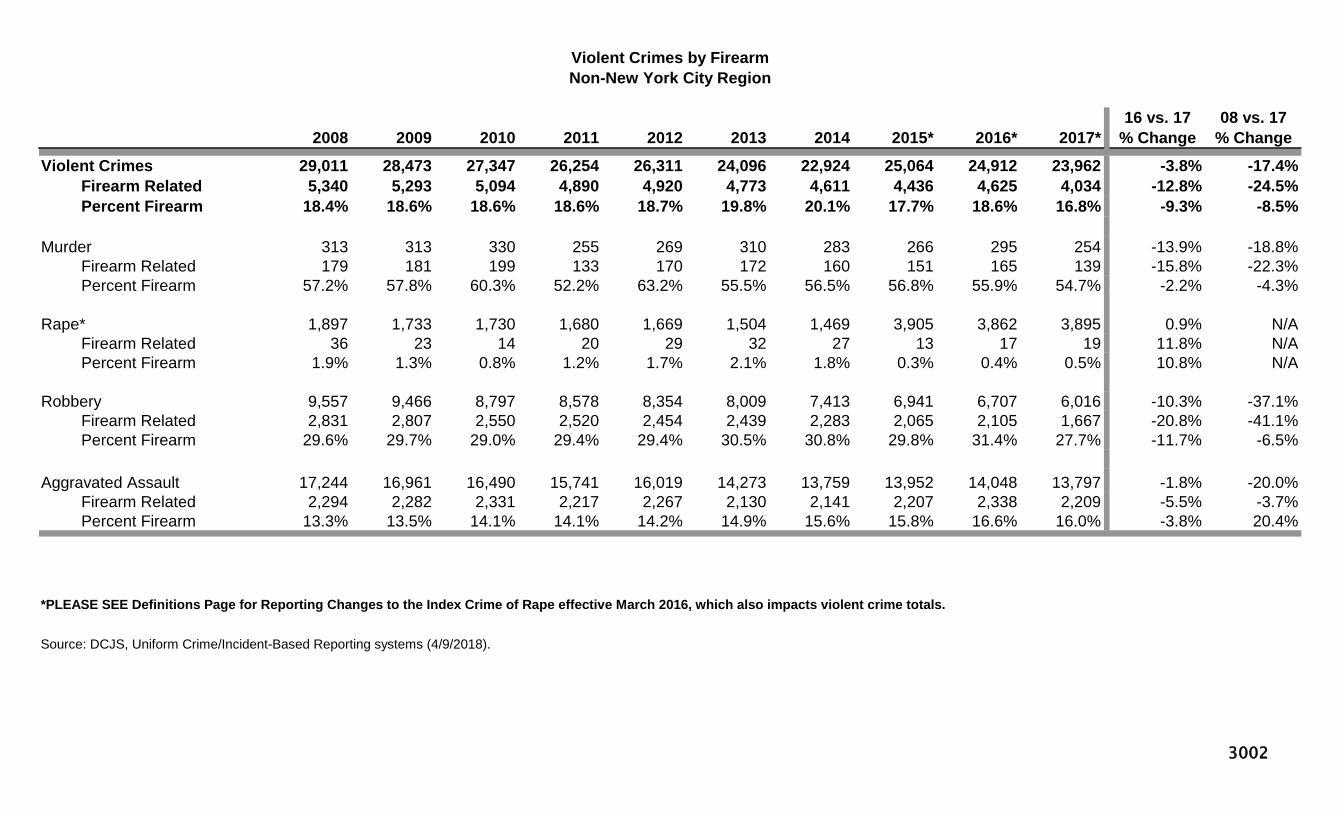
16 vs. 17 08 vs. 172008 2009 2010 2011 2012 2013 2014 2015* 2016* 2017* % Change % Change
Violent Crimes 29,011 28,473 27,347 26,254 26,311 24,096 22,924 25,064 24,912 23,962 -3.8% -17.4%Firearm Related 5,340 5,293 5,094 4,890 4,920 4,773 4,611 4,436 4,625 4,034 -12.8% -24.5%Percent Firearm 18.4% 18.6% 18.6% 18.6% 18.7% 19.8% 20.1% 17.7% 18.6% 16.8% -9.3% -8.5%
Murder 313 313 330 255 269 310 283 266 295 254 -13.9% -18.8%Firearm Related 179 181 199 133 170 172 160 151 165 139 -15.8% -22.3%Percent Firearm 57.2% 57.8% 60.3% 52.2% 63.2% 55.5% 56.5% 56.8% 55.9% 54.7% -2.2% -4.3%
Rape* 1,897 1,733 1,730 1,680 1,669 1,504 1,469 3,905 3,862 3,895 0.9% N/AFirearm Related 36 23 14 20 29 32 27 13 17 19 11.8% N/APercent Firearm 1.9% 1.3% 0.8% 1.2% 1.7% 2.1% 1.8% 0.3% 0.4% 0.5% 10.8% N/A
Robbery 9,557 9,466 8,797 8,578 8,354 8,009 7,413 6,941 6,707 6,016 -10.3% -37.1%Firearm Related 2,831 2,807 2,550 2,520 2,454 2,439 2,283 2,065 2,105 1,667 -20.8% -41.1%Percent Firearm 29.6% 29.7% 29.0% 29.4% 29.4% 30.5% 30.8% 29.8% 31.4% 27.7% -11.7% -6.5%
Aggravated Assault 17,244 16,961 16,490 15,741 16,019 14,273 13,759 13,952 14,048 13,797 -1.8% -20.0%Firearm Related 2,294 2,282 2,331 2,217 2,267 2,130 2,141 2,207 2,338 2,209 -5.5% -3.7%Percent Firearm 13.3% 13.5% 14.1% 14.1% 14.2% 14.9% 15.6% 15.8% 16.6% 16.0% -3.8% 20.4%
*PLEASE SEE Definitions Page for Reporting Changes to the Index Crime of Rape effective March 2016, which also impacts violent crime totals.
Source: DCJS, Uniform Crime/Incident-Based Reporting systems (4/9/2018).
Violent Crimes by FirearmNon-New York City Region
3002
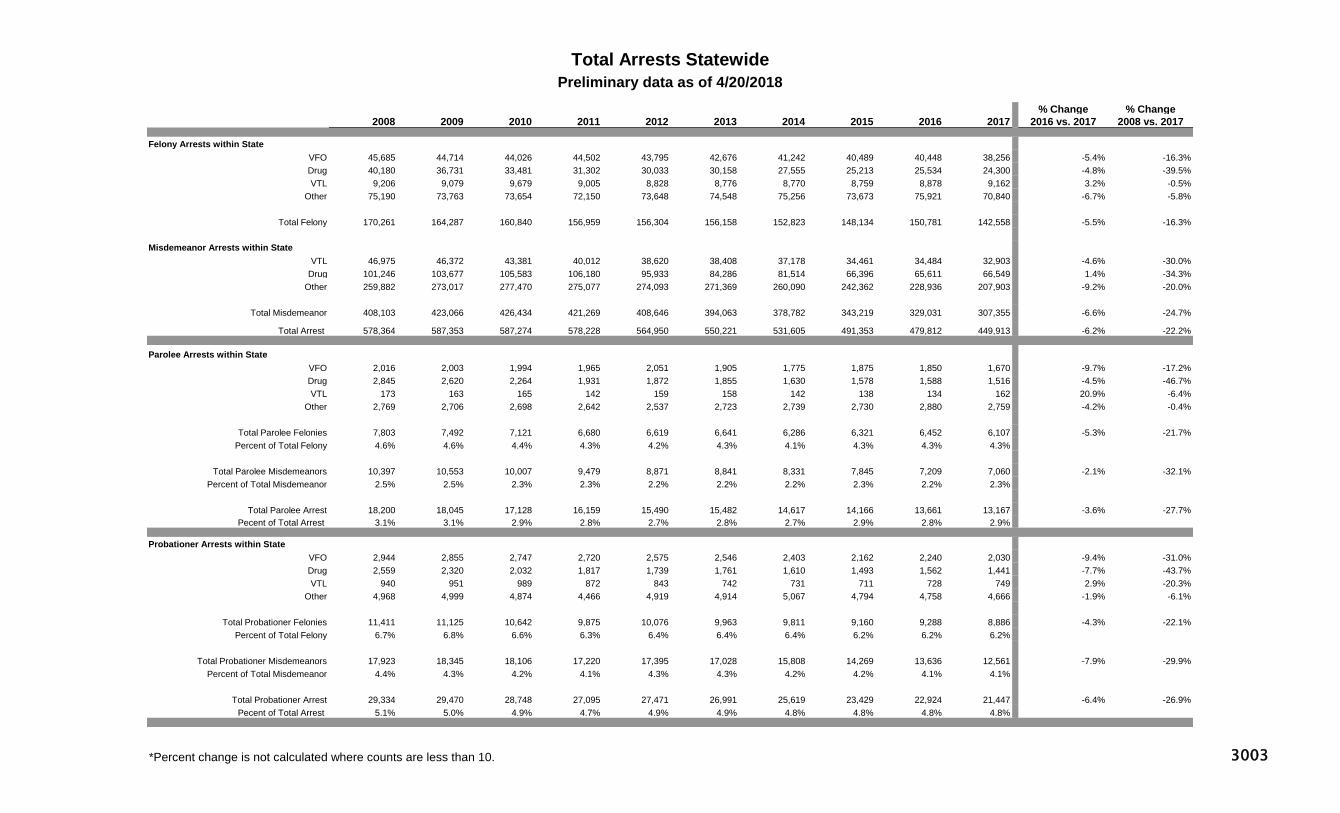
% Change % Change2008 2009 2010 2011 2012 2013 2014 2015 2016 2017 2016 vs. 2017 2008 vs. 2017
Felony Arrests within StateVFO 45,685 44,714 44,026 44,502 43,795 42,676 41,242 40,489 40,448 38,256 -5.4% -16.3%Drug 40,180 36,731 33,481 31,302 30,033 30,158 27,555 25,213 25,534 24,300 -4.8% -39.5%VTL 9,206 9,079 9,679 9,005 8,828 8,776 8,770 8,759 8,878 9,162 3.2% -0.5%
Other 75,190 73,763 73,654 72,150 73,648 74,548 75,256 73,673 75,921 70,840 -6.7% -5.8%
Total Felony 170,261 164,287 160,840 156,959 156,304 156,158 152,823 148,134 150,781 142,558 -5.5% -16.3%
Misdemeanor Arrests within StateVTL 46,975 46,372 43,381 40,012 38,620 38,408 37,178 34,461 34,484 32,903 -4.6% -30.0%
Drug 101,246 103,677 105,583 106,180 95,933 84,286 81,514 66,396 65,611 66,549 1.4% -34.3%Other 259,882 273,017 277,470 275,077 274,093 271,369 260,090 242,362 228,936 207,903 -9.2% -20.0%
Total Misdemeanor 408,103 423,066 426,434 421,269 408,646 394,063 378,782 343,219 329,031 307,355 -6.6% -24.7%
Total Arrest 578,364 587,353 587,274 578,228 564,950 550,221 531,605 491,353 479,812 449,913 -6.2% -22.2%
Parolee Arrests within StateVFO 2,016 2,003 1,994 1,965 2,051 1,905 1,775 1,875 1,850 1,670 -9.7% -17.2%Drug 2,845 2,620 2,264 1,931 1,872 1,855 1,630 1,578 1,588 1,516 -4.5% -46.7%VTL 173 163 165 142 159 158 142 138 134 162 20.9% -6.4%
Other 2,769 2,706 2,698 2,642 2,537 2,723 2,739 2,730 2,880 2,759 -4.2% -0.4%
Total Parolee Felonies 7,803 7,492 7,121 6,680 6,619 6,641 6,286 6,321 6,452 6,107 -5.3% -21.7%Percent of Total Felony 4.6% 4.6% 4.4% 4.3% 4.2% 4.3% 4.1% 4.3% 4.3% 4.3%
Total Parolee Misdemeanors 10,397 10,553 10,007 9,479 8,871 8,841 8,331 7,845 7,209 7,060 -2.1% -32.1%Percent of Total Misdemeanor 2.5% 2.5% 2.3% 2.3% 2.2% 2.2% 2.2% 2.3% 2.2% 2.3%
Total Parolee Arrest 18,200 18,045 17,128 16,159 15,490 15,482 14,617 14,166 13,661 13,167 -3.6% -27.7%Pecent of Total Arrest 3.1% 3.1% 2.9% 2.8% 2.7% 2.8% 2.7% 2.9% 2.8% 2.9%
Probationer Arrests within StateVFO 2,944 2,855 2,747 2,720 2,575 2,546 2,403 2,162 2,240 2,030 -9.4% -31.0%Drug 2,559 2,320 2,032 1,817 1,739 1,761 1,610 1,493 1,562 1,441 -7.7% -43.7%VTL 940 951 989 872 843 742 731 711 728 749 2.9% -20.3%
Other 4,968 4,999 4,874 4,466 4,919 4,914 5,067 4,794 4,758 4,666 -1.9% -6.1%
Total Probationer Felonies 11,411 11,125 10,642 9,875 10,076 9,963 9,811 9,160 9,288 8,886 -4.3% -22.1%Percent of Total Felony 6.7% 6.8% 6.6% 6.3% 6.4% 6.4% 6.4% 6.2% 6.2% 6.2%
Total Probationer Misdemeanors 17,923 18,345 18,106 17,220 17,395 17,028 15,808 14,269 13,636 12,561 -7.9% -29.9%Percent of Total Misdemeanor 4.4% 4.3% 4.2% 4.1% 4.3% 4.3% 4.2% 4.2% 4.1% 4.1%
Total Probationer Arrest 29,334 29,470 28,748 27,095 27,471 26,991 25,619 23,429 22,924 21,447 -6.4% -26.9%Pecent of Total Arrest 5.1% 5.0% 4.9% 4.7% 4.9% 4.9% 4.8% 4.8% 4.8% 4.8%
*Percent change is not calculated where counts are less than 10.
Total Arrests StatewidePreliminary data as of 4/20/2018
3003

% Change % Change2008 2009 2010 2011 2012 2013 2014 2015 2016 2017 2016 vs. 2017 2008 vs. 2017
Felony Arrests within NYCVFO 28,327 27,148 26,991 27,634 27,307 26,975 26,548 26,383 26,449 24,834 -6.1% -12.3%Drug 28,762 25,913 22,749 21,143 19,601 19,457 17,141 15,424 14,833 13,350 -10.0% -53.6%VTL 1,608 1,685 1,611 1,375 1,452 1,865 1,923 1,654 1,911 2,074 8.5% 29.0%
Other 41,227 40,565 40,342 38,727 39,318 42,010 43,600 42,971 45,231 40,075 -11.4% -2.8%
Total Felony 99,924 95,311 91,693 88,879 87,678 90,307 89,212 86,432 88,424 80,333 -9.2% -19.6%
Misdemeanor Arrests within NYCVTL 9,308 9,159 8,563 7,600 8,018 9,253 8,897 6,857 6,860 6,535 -4.7% -29.8%
Drug 80,309 83,126 83,764 84,080 70,984 58,894 56,946 41,936 39,576 37,189 -6.0% -53.7%Other 143,855 152,700 158,528 156,881 156,742 158,348 154,956 142,464 132,766 115,563 -13.0% -19.7%
Total Misdemeanor 233,472 244,985 250,855 248,561 235,744 226,495 220,799 191,257 179,202 159,287 -11.1% -31.8%
Total Arrest 333,396 340,296 342,548 337,440 323,422 316,802 310,011 277,689 267,626 239,620 -10.5% -28.1%
Parolee Arrests within NYCVFO 1,292 1,266 1,260 1,252 1,329 1,192 1,097 1,196 1,225 1,083 -11.6% -16.2%Drug 2,044 1,807 1,520 1,321 1,246 1,174 956 907 859 748 -12.9% -63.4%VTL 36 38 39 24 32 34 40 39 23 35 52.2% -2.8%
Other 1,751 1,686 1,642 1,649 1,577 1,728 1,598 1,733 1,811 1,686 -6.9% -3.7%
Total Parolee Felonies 5,123 4,797 4,461 4,246 4,184 4,128 3,691 3,875 3,918 3,552 -9.3% -30.7%Percent of Total Felony 5.1% 5.0% 4.9% 4.8% 4.8% 4.6% 4.1% 4.5% 4.4% 4.4%
Total Parolee Misdemeanors 7,189 7,250 6,788 6,413 5,789 5,647 5,232 4,828 4,465 4,061 -9.0% -43.5%Percent of Total Misdemeanor 3.1% 3.0% 2.7% 2.6% 2.5% 2.5% 2.4% 2.5% 2.5% 2.5%
Total Parolee Arrest 12,312 12,047 11,249 10,659 9,973 9,775 8,923 8,703 8,383 7,613 -9.2% -38.2%Pecent of Total Arrest 3.7% 3.5% 3.3% 3.2% 3.1% 3.1% 2.9% 3.1% 3.1% 3.2%
Probationer Arrests within NYCVFO 1,351 1,224 1,231 1,215 1,209 1,251 1,230 1,114 1,167 1,081 -7.4% -20.0%Drug 1,493 1,265 1,047 953 891 869 760 733 731 667 -8.8% -55.3%VTL 120 121 103 106 101 123 128 115 137 120 -12.4% 0.0%
Other 1,758 1,765 1,710 1,601 1,765 1,830 2,113 2,086 2,118 2,001 -5.5% 13.8%
Total Probationer Felonies 4,722 4,375 4,091 3,875 3,966 4,073 4,231 4,048 4,153 3,869 -6.8% -18.1%Percent of Total Felony 4.7% 4.6% 4.5% 4.4% 4.5% 4.5% 4.7% 4.7% 4.7% 4.8%
Total Probationer Misdemeanors 7,427 7,536 7,638 7,199 7,176 6,939 6,623 5,801 5,619 4,736 -15.7% -36.2%Percent of Total Misdemeanor 3.2% 3.1% 3.0% 2.9% 3.0% 3.1% 3.0% 3.0% 3.1% 3.0%
Total Probationer Arrest 12,149 11,911 11,729 11,074 11,142 11,012 10,854 9,849 9,772 8,605 -11.9% -29.2%Pecent of Total Arrest 3.6% 3.5% 3.4% 3.3% 3.4% 3.5% 3.5% 3.5% 3.7% 3.6%
*Percent change is not calculated where counts are less than 10.
Total Arrests New York City Preliminary data as of 4/20/2018
3004
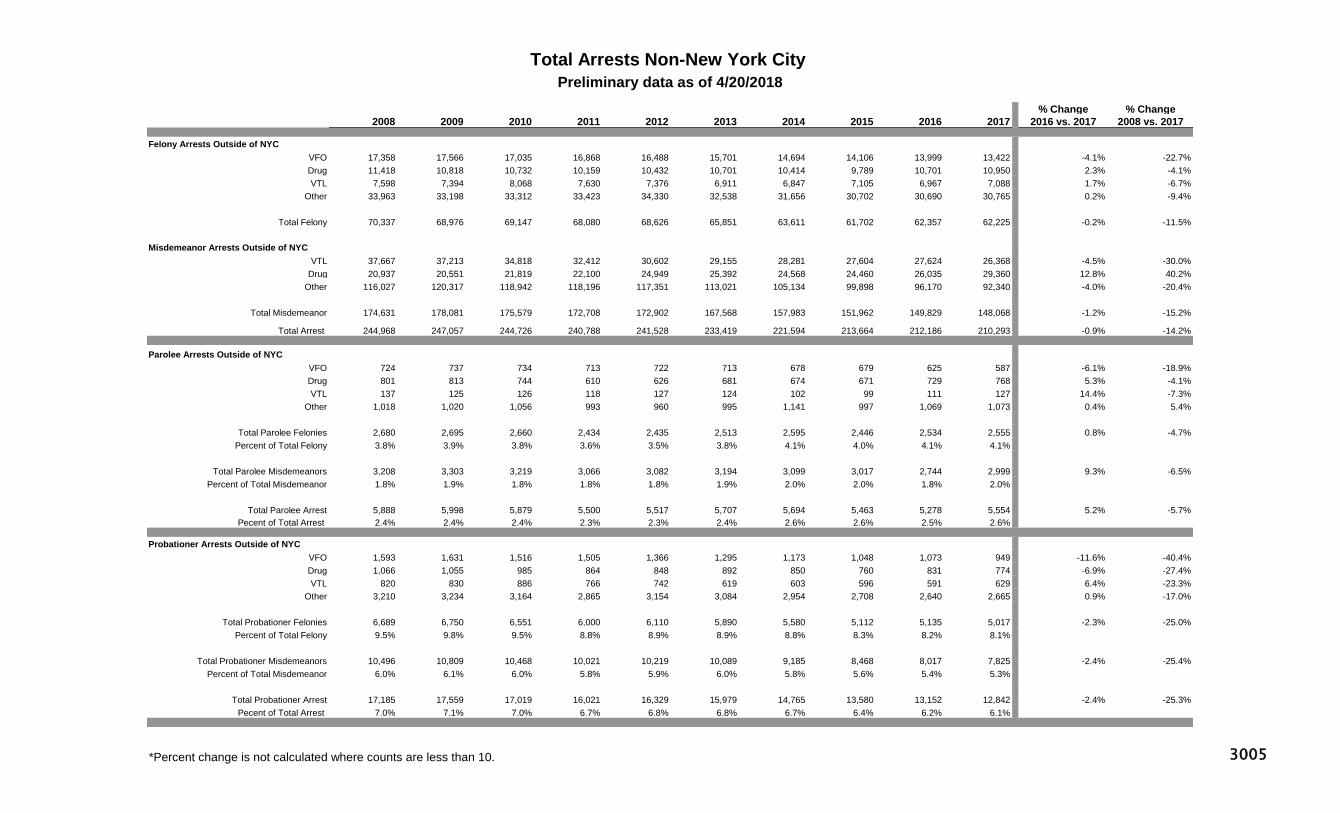
% Change % Change2008 2009 2010 2011 2012 2013 2014 2015 2016 2017 2016 vs. 2017 2008 vs. 2017
Felony Arrests Outside of NYCVFO 17,358 17,566 17,035 16,868 16,488 15,701 14,694 14,106 13,999 13,422 -4.1% -22.7%Drug 11,418 10,818 10,732 10,159 10,432 10,701 10,414 9,789 10,701 10,950 2.3% -4.1%VTL 7,598 7,394 8,068 7,630 7,376 6,911 6,847 7,105 6,967 7,088 1.7% -6.7%
Other 33,963 33,198 33,312 33,423 34,330 32,538 31,656 30,702 30,690 30,765 0.2% -9.4%
Total Felony 70,337 68,976 69,147 68,080 68,626 65,851 63,611 61,702 62,357 62,225 -0.2% -11.5%
Misdemeanor Arrests Outside of NYCVTL 37,667 37,213 34,818 32,412 30,602 29,155 28,281 27,604 27,624 26,368 -4.5% -30.0%
Drug 20,937 20,551 21,819 22,100 24,949 25,392 24,568 24,460 26,035 29,360 12.8% 40.2%Other 116,027 120,317 118,942 118,196 117,351 113,021 105,134 99,898 96,170 92,340 -4.0% -20.4%
Total Misdemeanor 174,631 178,081 175,579 172,708 172,902 167,568 157,983 151,962 149,829 148,068 -1.2% -15.2%
Total Arrest 244,968 247,057 244,726 240,788 241,528 233,419 221,594 213,664 212,186 210,293 -0.9% -14.2%
Parolee Arrests Outside of NYCVFO 724 737 734 713 722 713 678 679 625 587 -6.1% -18.9%Drug 801 813 744 610 626 681 674 671 729 768 5.3% -4.1%VTL 137 125 126 118 127 124 102 99 111 127 14.4% -7.3%
Other 1,018 1,020 1,056 993 960 995 1,141 997 1,069 1,073 0.4% 5.4%
Total Parolee Felonies 2,680 2,695 2,660 2,434 2,435 2,513 2,595 2,446 2,534 2,555 0.8% -4.7%Percent of Total Felony 3.8% 3.9% 3.8% 3.6% 3.5% 3.8% 4.1% 4.0% 4.1% 4.1%
Total Parolee Misdemeanors 3,208 3,303 3,219 3,066 3,082 3,194 3,099 3,017 2,744 2,999 9.3% -6.5%Percent of Total Misdemeanor 1.8% 1.9% 1.8% 1.8% 1.8% 1.9% 2.0% 2.0% 1.8% 2.0%
Total Parolee Arrest 5,888 5,998 5,879 5,500 5,517 5,707 5,694 5,463 5,278 5,554 5.2% -5.7%Pecent of Total Arrest 2.4% 2.4% 2.4% 2.3% 2.3% 2.4% 2.6% 2.6% 2.5% 2.6%
Probationer Arrests Outside of NYCVFO 1,593 1,631 1,516 1,505 1,366 1,295 1,173 1,048 1,073 949 -11.6% -40.4%Drug 1,066 1,055 985 864 848 892 850 760 831 774 -6.9% -27.4%VTL 820 830 886 766 742 619 603 596 591 629 6.4% -23.3%
Other 3,210 3,234 3,164 2,865 3,154 3,084 2,954 2,708 2,640 2,665 0.9% -17.0%
Total Probationer Felonies 6,689 6,750 6,551 6,000 6,110 5,890 5,580 5,112 5,135 5,017 -2.3% -25.0%Percent of Total Felony 9.5% 9.8% 9.5% 8.8% 8.9% 8.9% 8.8% 8.3% 8.2% 8.1%
Total Probationer Misdemeanors 10,496 10,809 10,468 10,021 10,219 10,089 9,185 8,468 8,017 7,825 -2.4% -25.4%Percent of Total Misdemeanor 6.0% 6.1% 6.0% 5.8% 5.9% 6.0% 5.8% 5.6% 5.4% 5.3%
Total Probationer Arrest 17,185 17,559 17,019 16,021 16,329 15,979 14,765 13,580 13,152 12,842 -2.4% -25.3%Pecent of Total Arrest 7.0% 7.1% 7.0% 6.7% 6.8% 6.8% 6.7% 6.4% 6.2% 6.1%
*Percent change is not calculated where counts are less than 10.
Total Arrests Non-New York City Preliminary data as of 4/20/2018
3005
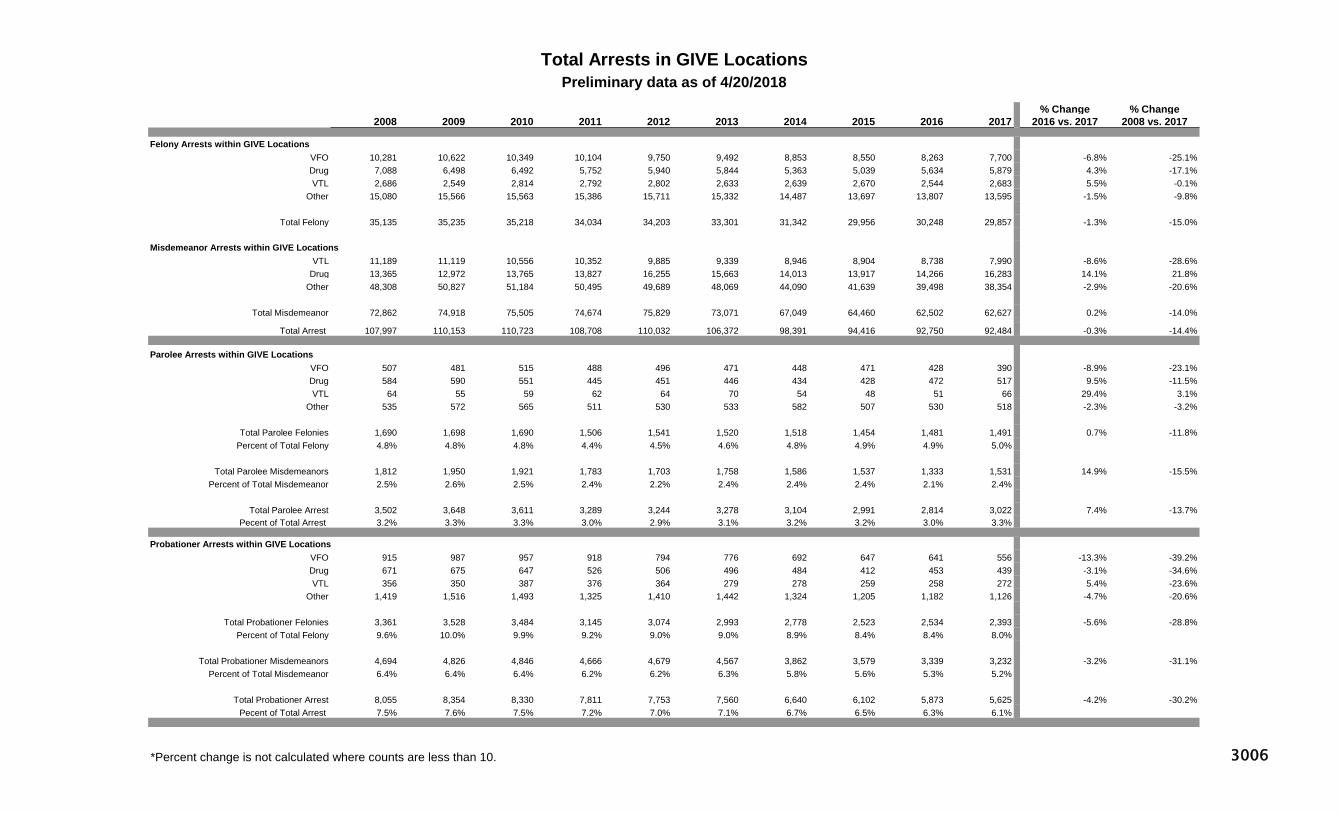
% Change % Change2008 2009 2010 2011 2012 2013 2014 2015 2016 2017 2016 vs. 2017 2008 vs. 2017
Felony Arrests within GIVE LocationsVFO 10,281 10,622 10,349 10,104 9,750 9,492 8,853 8,550 8,263 7,700 -6.8% -25.1%Drug 7,088 6,498 6,492 5,752 5,940 5,844 5,363 5,039 5,634 5,879 4.3% -17.1%VTL 2,686 2,549 2,814 2,792 2,802 2,633 2,639 2,670 2,544 2,683 5.5% -0.1%
Other 15,080 15,566 15,563 15,386 15,711 15,332 14,487 13,697 13,807 13,595 -1.5% -9.8%
Total Felony 35,135 35,235 35,218 34,034 34,203 33,301 31,342 29,956 30,248 29,857 -1.3% -15.0%
Misdemeanor Arrests within GIVE LocationsVTL 11,189 11,119 10,556 10,352 9,885 9,339 8,946 8,904 8,738 7,990 -8.6% -28.6%
Drug 13,365 12,972 13,765 13,827 16,255 15,663 14,013 13,917 14,266 16,283 14.1% 21.8%Other 48,308 50,827 51,184 50,495 49,689 48,069 44,090 41,639 39,498 38,354 -2.9% -20.6%
Total Misdemeanor 72,862 74,918 75,505 74,674 75,829 73,071 67,049 64,460 62,502 62,627 0.2% -14.0%
Total Arrest 107,997 110,153 110,723 108,708 110,032 106,372 98,391 94,416 92,750 92,484 -0.3% -14.4%
Parolee Arrests within GIVE LocationsVFO 507 481 515 488 496 471 448 471 428 390 -8.9% -23.1%Drug 584 590 551 445 451 446 434 428 472 517 9.5% -11.5%VTL 64 55 59 62 64 70 54 48 51 66 29.4% 3.1%
Other 535 572 565 511 530 533 582 507 530 518 -2.3% -3.2%
Total Parolee Felonies 1,690 1,698 1,690 1,506 1,541 1,520 1,518 1,454 1,481 1,491 0.7% -11.8%Percent of Total Felony 4.8% 4.8% 4.8% 4.4% 4.5% 4.6% 4.8% 4.9% 4.9% 5.0%
Total Parolee Misdemeanors 1,812 1,950 1,921 1,783 1,703 1,758 1,586 1,537 1,333 1,531 14.9% -15.5%Percent of Total Misdemeanor 2.5% 2.6% 2.5% 2.4% 2.2% 2.4% 2.4% 2.4% 2.1% 2.4%
Total Parolee Arrest 3,502 3,648 3,611 3,289 3,244 3,278 3,104 2,991 2,814 3,022 7.4% -13.7%Pecent of Total Arrest 3.2% 3.3% 3.3% 3.0% 2.9% 3.1% 3.2% 3.2% 3.0% 3.3%
Probationer Arrests within GIVE LocationsVFO 915 987 957 918 794 776 692 647 641 556 -13.3% -39.2%Drug 671 675 647 526 506 496 484 412 453 439 -3.1% -34.6%VTL 356 350 387 376 364 279 278 259 258 272 5.4% -23.6%
Other 1,419 1,516 1,493 1,325 1,410 1,442 1,324 1,205 1,182 1,126 -4.7% -20.6%
Total Probationer Felonies 3,361 3,528 3,484 3,145 3,074 2,993 2,778 2,523 2,534 2,393 -5.6% -28.8%Percent of Total Felony 9.6% 10.0% 9.9% 9.2% 9.0% 9.0% 8.9% 8.4% 8.4% 8.0%
Total Probationer Misdemeanors 4,694 4,826 4,846 4,666 4,679 4,567 3,862 3,579 3,339 3,232 -3.2% -31.1%Percent of Total Misdemeanor 6.4% 6.4% 6.4% 6.2% 6.2% 6.3% 5.8% 5.6% 5.3% 5.2%
Total Probationer Arrest 8,055 8,354 8,330 7,811 7,753 7,560 6,640 6,102 5,873 5,625 -4.2% -30.2%Pecent of Total Arrest 7.5% 7.6% 7.5% 7.2% 7.0% 7.1% 6.7% 6.5% 6.3% 6.1%
*Percent change is not calculated where counts are less than 10.
Total Arrests in GIVE LocationsPreliminary data as of 4/20/2018
3006

Jurisdiction 2017 Population Count Rate Count Rate Count Rate Count Rate
Albany City PD 98,174 4,277 435.7 878 89.4 121 12.3 3,399 346.2
Binghamton City PD 45,399 2,342 515.9 361 79.5 49 10.8 1,981 436.4
Buffalo City PD 256,169 12,437 485.5 2,610 101.9 777 30.3 9,827 383.6
Hempstead Vg PD 55,807 925 165.7 332 59.5 58 10.4 593 106.3
Jamestown City PD 29,562 1,075 363.6 196 66.3 22 7.4 879 297.3
Kingston City PD 23,110 522 225.9 73 31.6 10 4.3 449 194.3
Middletown City PD 27,607 761 275.7 103 37.3 21 7.6 658 238.3
Mount Vernon City PD 68,507 1,731 252.7 437 63.8 94 13.7 1,294 188.9
Nassau County PD 1,069,880 11,216 104.8 1,113 10.4 131 1.2 10,103 94.4
Newburgh City PD 28,080 1,094 389.6 347 123.6 68 24.2 747 266.0
Niagara Falls City PD 48,385 2,880 595.2 544 112.4 147 30.4 2,336 482.8
Poughkeepsie City PD 30,159 821 272.2 215 71.3 41 13.6 606 200.9
Rochester City PD 208,591 9,807 470.2 1,872 89.7 632 30.3 7,935 380.4
Schenectady City PD 64,710 2,635 407.2 577 89.2 92 14.2 2,058 318.0
Spring Valley Vg PD 32,795 524 159.8 133 40.6 6 1.8 390 118.9
Suffolk County PD 1,333,228 18,478 138.6 1,482 11.1 344 2.6 16,996 127.5
Syracuse City PD 143,069 5,826 407.2 1,009 70.5 198 13.8 4,817 336.7
Troy City PD 49,644 2,083 419.6 351 70.7 82 16.5 1,732 348.9
Utica City PD 60,395 2,323 384.6 337 55.8 76 12.6 1,986 328.8
Yonkers City PD 201,554 2,833 140.6 810 40.2 133 6.6 2,023 100.4
New York City 8,616,333 171,248 198.7 46,433 53.9 4,747 5.5 124,815 144.9
Source: DCJS UCR/IBR Reporting System
2017 Index Crime Counts and Rates Per 10,000 PopulationBy GIVE Jurisdiction
As of 05/02/2018
Index Crime Violent Crime Violent Crime by
Firearm Property Crime
3007