new zealand and christchurch - satellite eye
TRANSCRIPT

NEW ZEALAND AND CHRISTCHURCH Juerg Lichtenegger INTRODUCTION ...................................................................................................................... 1 BACKGROUND ........................................................................................................................ 1
New Zealand in a brief Overview .......................................................................................... 1 History .................................................................................................................................... 2 Deforestation .......................................................................................................................... 2 Climate ................................................................................................................................... 3 Geology .................................................................................................................................. 3 Christchurch ........................................................................................................................... 4
Exercises ..................................................................................................................................... 4 Exercises using prints ............................................................................................................. 4
New Zealand – Overview ............................................................................................. 5 Banks Peninsula ............................................................................................................ 8 Lyttelton ......................................................................................................................... 10 Christchurch ................................................................................................................. 12
Exercise using LEOWorks ................................................................................................... 15 New Zealand – Overview ........................................................................................... 15 Banks Peninsula .......................................................................................................... 18 Lyttelton ......................................................................................................................... 20 Christchurch ................................................................................................................. 22
Links ......................................................................................................................................... 25
INTRODUCTION Before heading to the Antarctica, the expedition vessel visited the port of Lyttelton near Christchurch in New Zealand. On this occasion several satellite images from past and present have been acquired. They are used here to bring you this area closer, known as the antipode of Europe - in terms of Latitude and Longitude. Is it like Europe? Discover the difference and its beauty!
BACKGROUND The expedition ship has made a 4 day stop between the 8th and the 11th January 2007 at Lyttelton, the harbour of Christchurch in New Zealand. In a brief work let us look at this country and this town, to Christchurch and its surroundings, especially with the help of images from space.
New Zealand in a brief Overview New Zealand consists of two large islands, North Island and South Island, plus several smaller ones of which Stewart Island is the largest and often referred to as 'our third island'. North and South Islands are separated by the 32km wide Cook Strait. To the north and east lies the Pacific Ocean and in the west lies the Tasman Sea.

The total land area is 270,535 km2, about the size of Italy or the United Kingdom. But the population is only 4.1 million against 57.3 million for Italy or 60.2 million for the UK. Land use can be broken down to approximately: forested 23% - meadows and pastures 50% - agricultural and under permanent cultivation 15% and others (settlements, high mountain areas). Sheep and cattle graze on the rich farmland around Hamilton and New Plymouth in North Island and around Dunedin and Invercargill on South Island.
North Island is volcanically active with a central plateau. South Island has the high snow covered mountain peaks and glaciers of the Southern Alps, a range running almost 500 km along the Island (see Fig. 2a).
History The population is mostly of European descent, with the indigenous Maori being the largest minority. Non-Maori Polynesian and Asian people are also significant minorities, especially in the cities. New Zealand is one of the most recently settled major land areas. Polynesian settlers arrived in their waka (boats) some time between the 11th century and the 13th century to establish the indigenous Maori culture. The first Europeans known to have reached New Zealand were led by Abel Janszoon Tasman, who sailed up the west coasts of the South and North Islands in 1642. To legitimize the British annexation in 1839, Lieutenant Governor William Hobson negotiated the Treaty of Waitangi with northern Maori tribes. The Treaty has come to be seen as the founding document of New Zealand. European settlement progressed more rapidly than anyone anticipated, and settlers soon outnumbered Maori. Self-government was granted to the settler population in 1852. New Zealand became an independent dominion on 26 September 1907, by Royal Proclamation.
Deforestation Since human settlement approximately 700–800 years ago, the indigenous forests, which once covered about 85 percent of the land area, have been reduced from some 23 million hectares to approximately 6.2 million or 23 percent of the land area - mostly confined to mountainous areas and to some low-lying parts of the West Coast, Southland and Northland. In most areas lowland forests have been reduced to fragments and will need considerable expansion if biodiversity within them is to be sustained. Grasslands covered 1–2 million hectares (roughly 5 percent of the land area) before humans arrived but expanded to almost 8 million hectares as a result of deforestation by early Maori fires. Further deforestation in the past 100 years by farmers and timber millers has extended the grassland area to 14 million hectares – over 50 percent of the total land area.

Climate New Zealand's climate is complex and varies from warm subtropical in the far north to cool temperate climates in the far south, with severe alpine conditions in the mountainous areas. Mountain chains extending the length of New Zealand provide a barrier for the prevailing westerly winds, dividing the country into dramatically different climate regions. The West Coast of the South Island is the wettest area of New Zealand, whereas the area to the east of the mountains, just over 100 km away, is the driest. Fig 2a shows the highest part of the Southern Alps: Mount Cook top left and in front the drastically retreating rock-covered Hooker Glacier leaving a lake in front. The also debris-covered Mueller Glacier front with its terminal lake and ice floes is seen in the mid-ground of Fig 2a.
Fig-2a-Mont-Cook_S.jpg Fig.2a Mount Cook. Copyright J.Lichtenegger. Click to see a larger image. Most areas of New Zealand have between 600 and 1600 mm of rainfall, spread throughout the year with a dry period during the summer. Over the northern and central part of New Zealand more rainfall falls in winter than in summer, whereas for much of the southern part of New Zealand, winter is the season of least rainfall. Mean annual temperatures range from 10°C in the south to 16°C in the north of New Zealand. The coldest month is usually July and the warmest month is usually January or February. In New Zealand generally there are relatively small variations between summer and winter temperatures, although inland and to the east of the ranges the variation is greater (up to 14°C). Temperatures also drop about 0.7°C for every 100 m of altitude.
Geology New Zealand lies at the edge of both the Australian and Pacific tectonic plates. To the northeast of New Zealand, and underneath North Island, the Pacific Plate is moving towards, and being subducted below the Australian Plate. To the south of New Zealand, and underneath Fiordland (southwestcoast), the two plates are also moving toward each other but here the Australian Plate is being subducted under the Pacific Plate. The Australian and Pacific Plates generally don't move smoothly past each other. They move in a series of small rapid motions each of which is accompanied by one or more earthquakes. These earthquakes occur where the Pacific Plate is being subducted under the Australian Plate.

As the Pacific Plate is subducted below North Island, the part of the Australian Plate that makes up the central North Island is stretched and has, over many millions of years, become thinner than normal crust. Water released from the Pacific Plate deep under North Island combines with the hot rock of the Australian Plate at about 100km depth and causes a small amount of that rock to melt. This molten rock rises to the surface through the thinned crust and is either erupted from volcanoes like Ruapehu, Tongariro and Ngaruhoe or sits within the crust and heats it, and the water it contains, up causing geothermal activity.
Christchurch Maori people (chiefly the Ngai-tahu tribe) had occupied the area (now know as Canterbury) for several centuries prior to the European arrival. However, by the time European settlement began in the 1840s, around 500 Maori remained in Canterbury. Christchurch, its many old stone buildings, tree-filled parks and meandering streams give the city the air of an English town—just as the city's founders had intended. Indeed, the London-based Canterbury Association envisioned Christchurch as an English utopia in the South Pacific. By 1848, preparations were underway for the arrival at nearby Lyttelton Harbour of the first four ships of carefully selected settlers by the Canterbury Association. Land had been purchased from local Maori, and a path over the Port Hills separating the bay from Christchurch was constructed. The first of the four ships, the Charlotte Jane, sailed into Lyttelton Harbour on December 16, 1850. The scattered buildings, muddy tracks presented a less than romantic impression to the settlers. But in less than a year, settlers were able to write of "tidy and weather-tight" houses, and "gardens and cultivation all the way along and New Zealand's first railway, the Christchurch-Ferrymead line, began operations in 1863. Settlers flooded into Canterbury area and the economy boomed. The Estuary and the Heathcote and Avon rivers provided navigable waterways for small ships into the city. Fuelled by produce, especially wool, from the vast farmlands of Canterbury, Christchurch grew into a prosperous commercial city. Throughout the 20th century Christchurch grew and thrived. The city's founders may have dreamed of a conservative community, but in recent decades Christchurch has matured into a relaxed, cosmopolitan city. A stroll through Cathedral Square or along Worcester Boulevard is confirmation of Christchurch's growing sophistication and diverse population of over 300,000 people.
Exercises
Exercises using prints For this exercise you can download all 13 images in one file here or select them below. Christchurch_images.zip

You will need to study the images either on the screen or on paper. The package contain the following images: Fig1 NewZeeland.jpg Fig 2 MERIS_RR_050113_753.jpg Fig 3 NewZealand_MERIS_FR_060910_2132.jpg Fig 5 Christchurch_Banks_SPOT_870208_enhanced.jpg Fig 7 Lyttelton_PROBA_060910_2247_panchromatic.jpg Fig 8 Lyttelton_SPOT_980601_panchromatic.jpg Fig 11 Christchurch_ASAR_RGB_VV_VH_ratio_070110.jpg Fig 15 Christchurch_town_SPOT_870208_false_colour_enhanced.jpg Fig 16 Christchurch_town_SPOT_980601_panchromatic_enhanced.jpg
New Zealand – Overview
Open your atlas and spot the country and nation New Zealand. Describe it briefly. What are the characteristics of it? Look up the names of the islands the seas around and of the main towns. What is the name of the capital? Find the approximate position of it in Latitude and Longitude. What is the time difference in Latitude and Longitude between your country and New Zealand? How far away is New Zealand from the International Date Line? What is special with this line? The Cook Islands belonging also to New Zealand are beyond this line. Find these islands in your Atlas! What is now the date and time in your country, in Wellington and in Rarotonga on the Cook Islands? Let us gain a further overview of New Zealand. Take the print of Fig.1 and keep your atlas available. With the help of both Fig.1 and your atlas, describe the topography of the islands. What is the meaning of the colours in Fig.1. Produce an “approximate” legend of the colours.

Fig1-NewZeeland_S.jpg Fig.1 New Zeeland topography. Click to see a larger imge. Describe the plains and the mountains and work out the differences between the North and South Island. What could be the cone-like mountains in the North? Inspect carefully the South Island: there is a straight abrupt slope running along the west coast. Explain this extraordinary geological feature. Describe the inherent danger and consequences! Take the print of Fig.2 (satellite image provided by ESA/ENVISAT). It shows New Zealand during a typical weather situation. A humid air mass has reached the islands from the west. Observe also the photograph Fig.2a, taken from a high point east of the Southern Alps. Observe the clouds and name the cloud type, typical for such a “Foehn” weather situation. Why is the eastern part of South Island cloud free on the satellite image Fig.2? Explain the climatic situation on both sides of the Southern Alps.

Fig-2-MERIS_RR_050113_753_S.jpg Fig.2 New Zeeland MERIS image of 20050113 natural colour. Click to see a larger imge.
Fig-2a-Mont-Cook_S.jpg Fig.2a Mount Cook. Copyright J.Lichtenegger. Click to see a larger image. Consider the latitudinal extension of New Zealand and compare it with Europe. Compare the climatic situation in both regions and look up the climatic zones covered in your atlas. Is there any difference with respect to the latitudes? Explain the reason!

Fig-3-NewZealand_MERIS_FR_0_S.jpg Fig.3 Central New Zealand MERIS image of 20060910 natural colour. Click to see a larger image. Take the print of Fig.3 (image provided by ENVISAT) and locate the shown area in your atlas and with respect to Fig.1. Locate the cities of Wellington and Christchurch. Observe the colours of the image which are the natural colours of the landscape. Can you attribute the land cover to vegetation? Distinguish between dry and green grassland, agriculture and forest. Having studied the Background Information, can you imagine the land cover of this island before the arrival of humans? Explain the situation nowadays! Also observe the coast line of Fig.3. Explain the colours of the water and the vortices.
Banks Peninsula

Fig 4 Bank Peninsula Geology 6my_S.jpg Fig.4 Geology of Bank Peninsula. Click to see a larger image.
Fig 5 Christchurch_Banks_SPOT_870208_enhanced_S.jpg Fig.5 Christchurch and Bank Peninsula SPOT_19870208 false colour infrared. Click to see a larger image.
Take print Fig.4 (Geological situation of the Banks Peninsula about 6 million years ago) and Fig.5 (false colour infrared image from the SPOT satellite). Where is Fig.5 located with respect to Fig.3? What type of mountains do you identify on Fig.4? Can you give a brief explanation of the sequences in the geological history. Rocks or layers of each significant geological event are given a different colour. Indicate the colours from the oldest to the youngest event. Observe Fig.5 which is the situation today. Identify Christchurch and Lyttelton and the hills between as well as the roundish Banks Peninsula. Explain the morphology. Why are there so many fjords and bays? Observe the vegetation. Consider that the image was acquired in the dry season. What kind of vegetation is represented by the red colour.

Fig-6-MtBrandley_S.jpg Fig.6 Mount Brandley and Lyttleton Harbor Bay. Copyright J.Lichtenegger. Click to see a larger image. Before humans arrived some 700 years ago, the area was forested. Why has it been cleared and what is the use of the land today? To answer this question observe the photograph Fig.6, taken from Mount Brandley. It is a view over the western hills of Banks with the Lyttelton Harbor Bay, the town, the Port Hills in the mid ground and in the very distance the partly snow covered Southern Alps. You might wonder that the harbor of Christchurch is that distant and also across hills! Find the answer yourself by observing the access of the city to the sea. Judge the rivermouth as potential waterway to the city - for large ships!
Lyttelton
The expedition ship of Galathea3 stayed in this harbor from 8 to 11 January 2007.
Fig 7 Lyttelton_PROBA_060910_2247_panchromatic_S.jpg Fig. 7 PROBA image from 10th September 2006. Click to see a larger image. Take the print Fig.7 (image of PROBA satellite of 10 Sept 2006). Try to identify the different features of the harbour
piers cranes ships containers fuel tanks etc.
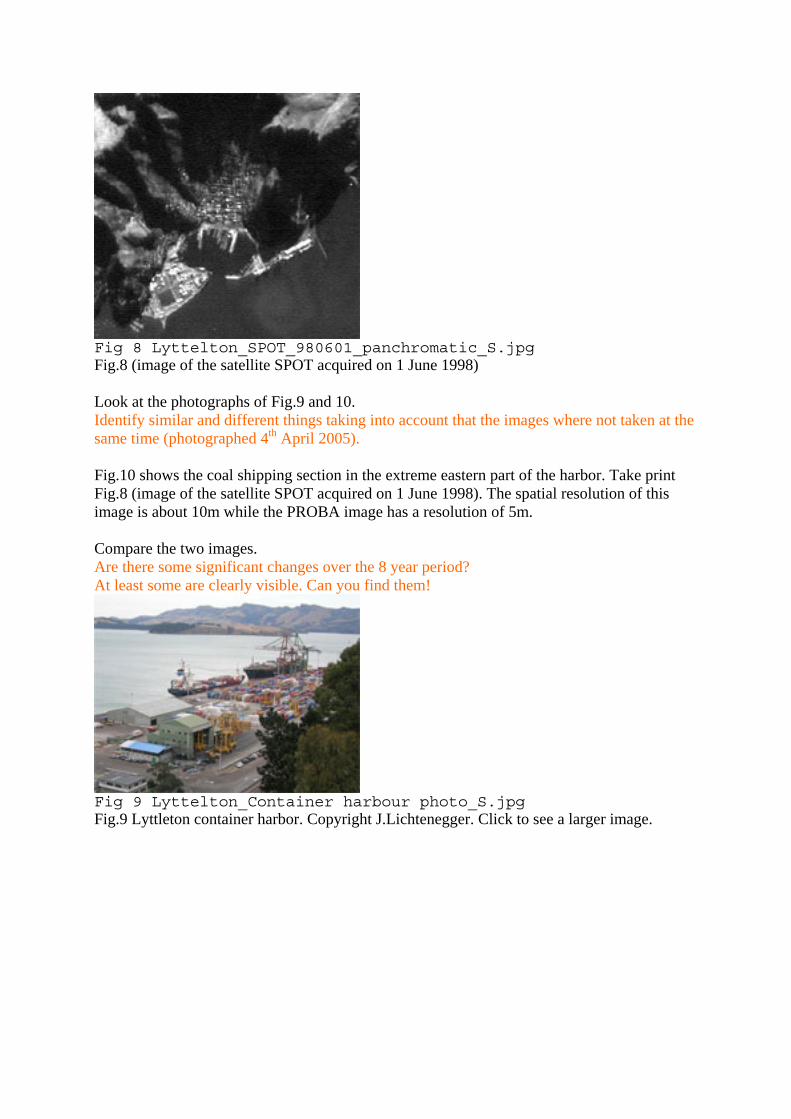
Fig 8 Lyttelton_SPOT_980601_panchromatic_S.jpg Fig.8 (image of the satellite SPOT acquired on 1 June 1998) Look at the photographs of Fig.9 and 10. Identify similar and different things taking into account that the images where not taken at the same time (photographed 4th April 2005). Fig.10 shows the coal shipping section in the extreme eastern part of the harbor. Take print Fig.8 (image of the satellite SPOT acquired on 1 June 1998). The spatial resolution of this image is about 10m while the PROBA image has a resolution of 5m. Compare the two images. Are there some significant changes over the 8 year period? At least some are clearly visible. Can you find them!
Fig 9 Lyttelton_Container harbour photo_S.jpg Fig.9 Lyttleton container harbor. Copyright J.Lichtenegger. Click to see a larger image.
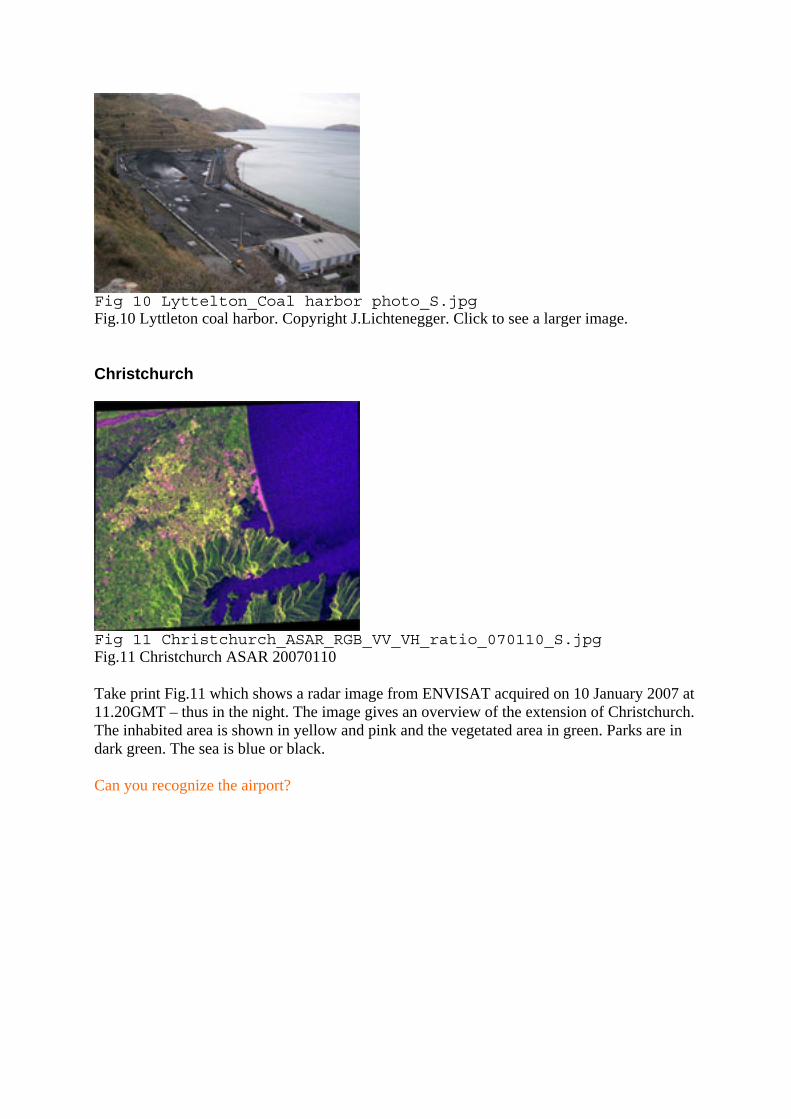
Fig 10 Lyttelton_Coal harbor photo_S.jpg Fig.10 Lyttleton coal harbor. Copyright J.Lichtenegger. Click to see a larger image.
Christchurch
Fig 11 Christchurch_ASAR_RGB_VV_VH_ratio_070110_S.jpg Fig.11 Christchurch ASAR 20070110 Take print Fig.11 which shows a radar image from ENVISAT acquired on 10 January 2007 at 11.20GMT – thus in the night. The image gives an overview of the extension of Christchurch. The inhabited area is shown in yellow and pink and the vegetated area in green. Parks are in dark green. The sea is blue or black. Can you recognize the airport?
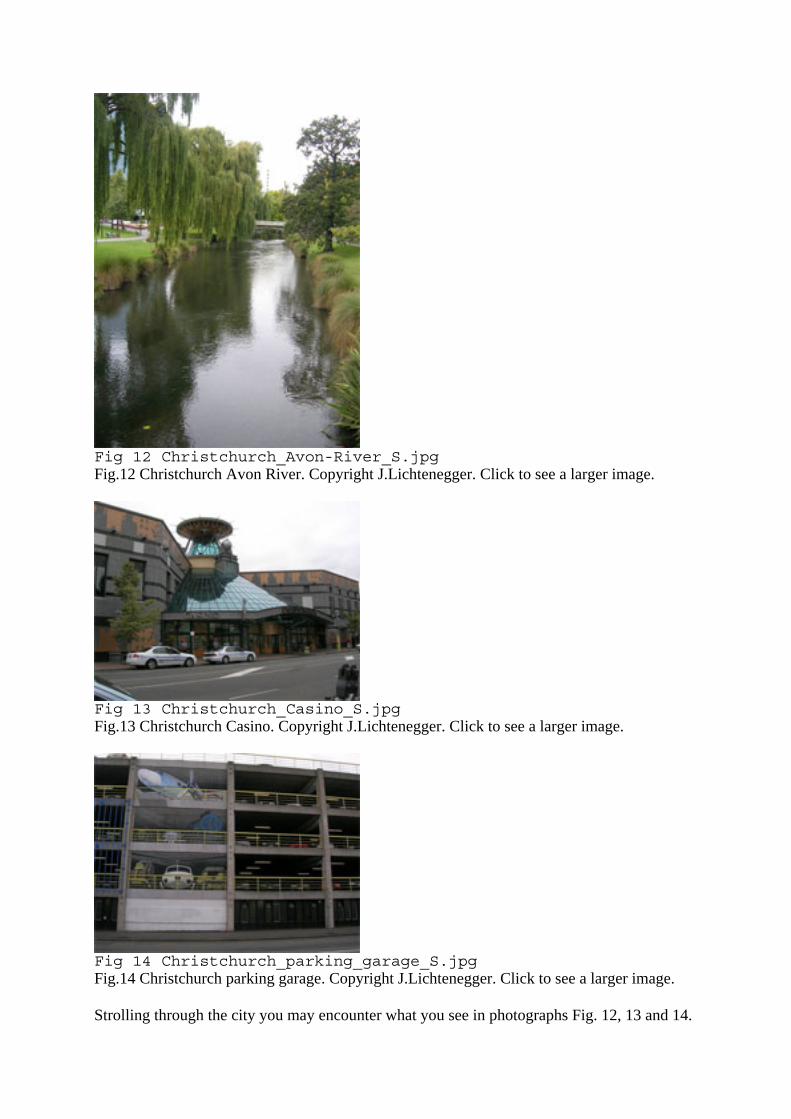
Fig 12 Christchurch_Avon-River_S.jpg Fig.12 Christchurch Avon River. Copyright J.Lichtenegger. Click to see a larger image.
Fig 13 Christchurch_Casino_S.jpg Fig.13 Christchurch Casino. Copyright J.Lichtenegger. Click to see a larger image.
Fig 14 Christchurch_parking_garage_S.jpg Fig.14 Christchurch parking garage. Copyright J.Lichtenegger. Click to see a larger image. Strolling through the city you may encounter what you see in photographs Fig. 12, 13 and 14.
Inspect the radar image further. Can you find Lyttelton? The image was acquired while the expedition ship was in the port. However the very bright spot visible in the harbor is probably produced by a strong echo from the fuel tanks. At the moment the satellite took the image the ship was on the opposite pier and can be seen there as a yellow spot. In order to perceive better the topography in the image, turn it 90 degrees clockwise. You have noticed that the radar displays the hills somehow leaning towards west (in this case).
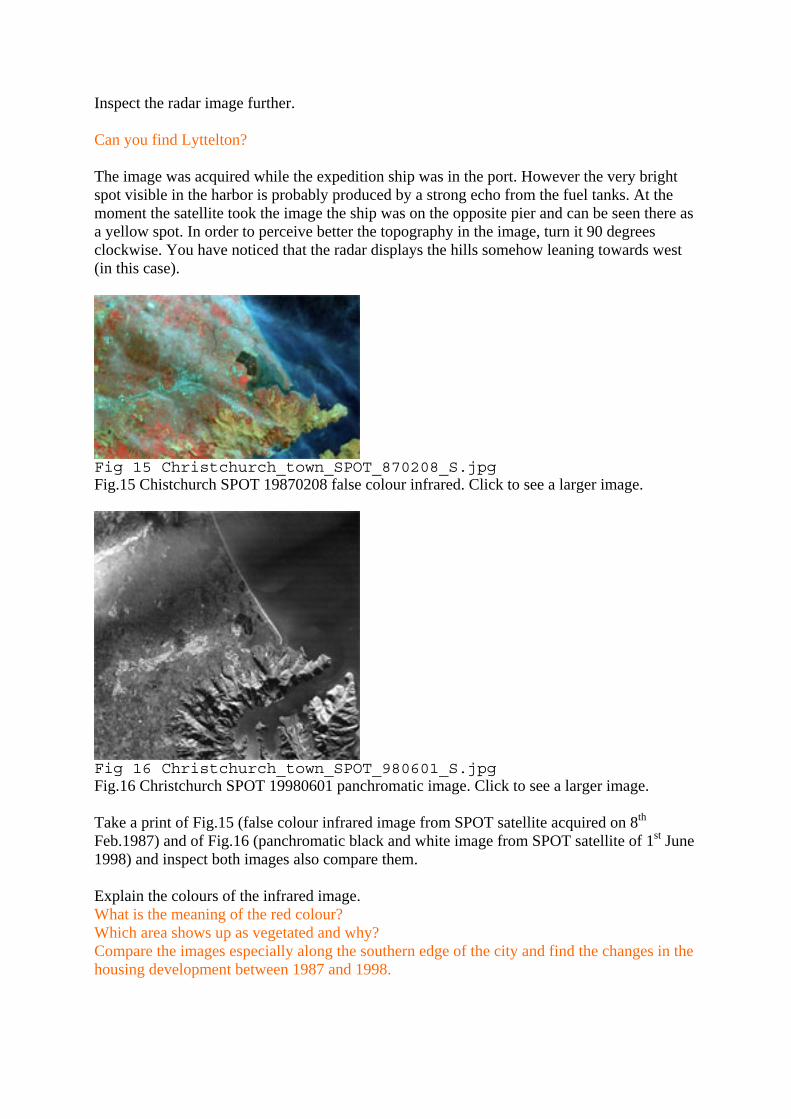
Fig 15 Christchurch_town_SPOT_870208_S.jpg Fig.15 Chistchurch SPOT 19870208 false colour infrared. Click to see a larger image.
Fig 16 Christchurch_town_SPOT_980601_S.jpg Fig.16 Christchurch SPOT 19980601 panchromatic image. Click to see a larger image. Take a print of Fig.15 (false colour infrared image from SPOT satellite acquired on 8th Feb.1987) and of Fig.16 (panchromatic black and white image from SPOT satellite of 1st June 1998) and inspect both images also compare them. Explain the colours of the infrared image. What is the meaning of the red colour? Which area shows up as vegetated and why? Compare the images especially along the southern edge of the city and find the changes in the housing development between 1987 and 1998.
Exercise using LEOWorks The exercises below require knowledge on the image processing software LEOWorks developed by ESA for educational use. You can download the LEOWorks and the LEOWorks Tutorial at the Eduspace web site. http://www.eduspace.esa.int/eduspace/subtopics/default.asp?document=6 For this exercise you can download all 9 images in one file here, 21Mb. Christchurch_files.zip The package contain the following images: Fig 1 NewZeeland.tif Fig 2 MERIS_RR_050113_753.tif Fig 3 NewZealand_MERIS_FR_060910_2132.tif Fig 5 Christchurch_Banks_SPOT_870208_enhanced.jpg Fig 7 Lyttelton_PROBA_060910_2247_panchromatic.jpg Fig 8 Lyttelton_SPOT_980601_panchromatic.jpg Fig 11 Christchurch_ASAR_RGB_VV_VH_ratio_070110.tif Fig 15 Christchurch_town_870208_false_colour.jpg Fig 16 Christchurch_town_SPOT_980601_panchromatic.jpg
New Zealand – Overview
Open your atlas and spot the country and nation New Zealand. Describe it briefly. What are the characteristics of it? Look up the names of the islands the seas around and of the main towns. What is the name of the capital? Find the approximate position of it in Latitude and Longitude. What is the time difference in Latitude and Longitude between your country and New Zealand? How far away is New Zealand from the International Date Line? What is special with this line? The Cook Islands belonging also to New Zealand are beyond this line. Find these islands in your Atlas! What is now the date and time in your country, in Wellington and in Rarotonga on the Cook Islands? LEOWorks software allows to improve the contrast using interactive stretching and to inspect details using zooming. Also Fig.10 is a geocoded image. Use it to look up the geographical coordinates of the harbour of Lyttelton! I am not so sure of Fig. 10? It is a photo of the harbour.
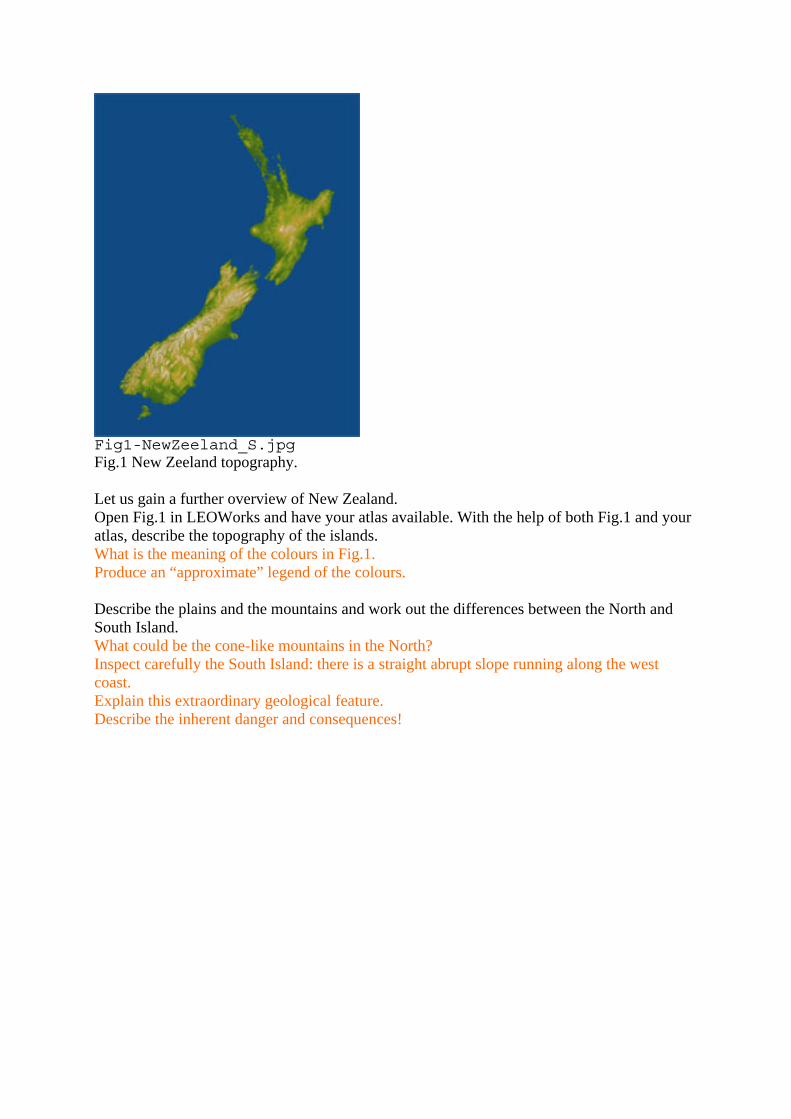
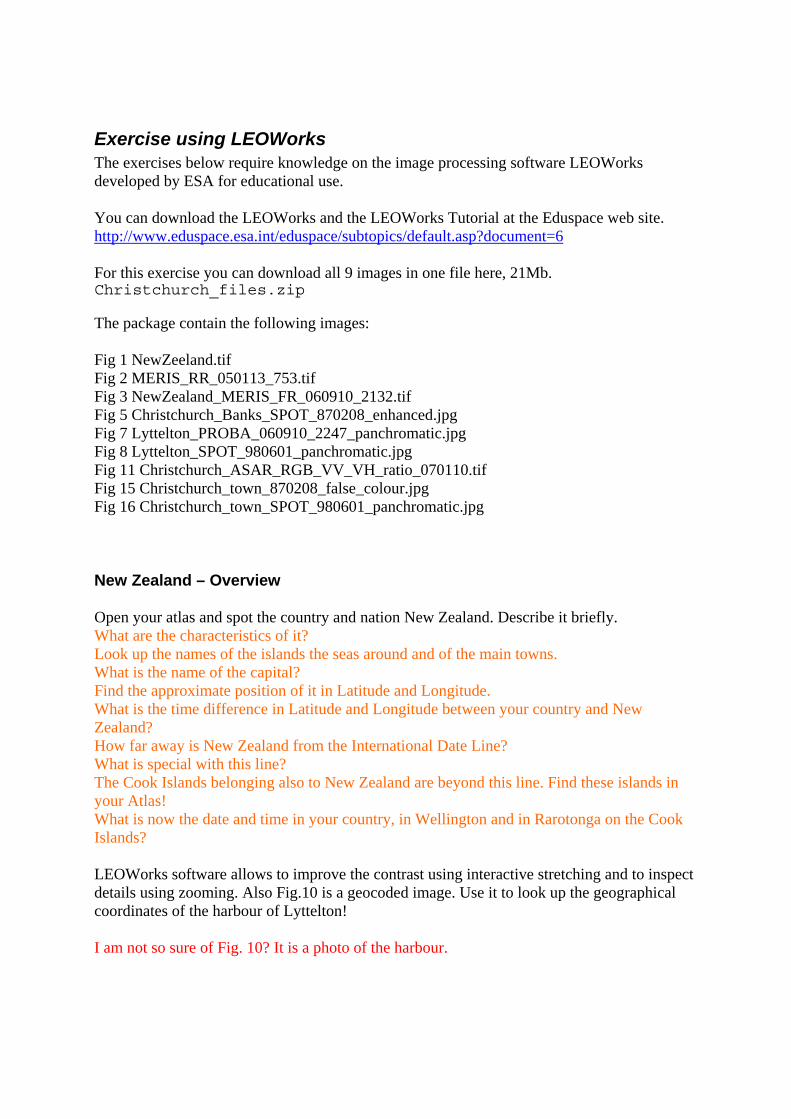
Fig1-NewZeeland_S.jpg Fig.1 New Zeeland topography. Let us gain a further overview of New Zealand. Open Fig.1 in LEOWorks and have your atlas available. With the help of both Fig.1 and your atlas, describe the topography of the islands. What is the meaning of the colours in Fig.1. Produce an “approximate” legend of the colours. Describe the plains and the mountains and work out the differences between the North and South Island. What could be the cone-like mountains in the North? Inspect carefully the South Island: there is a straight abrupt slope running along the west coast. Explain this extraordinary geological feature. Describe the inherent danger and consequences!
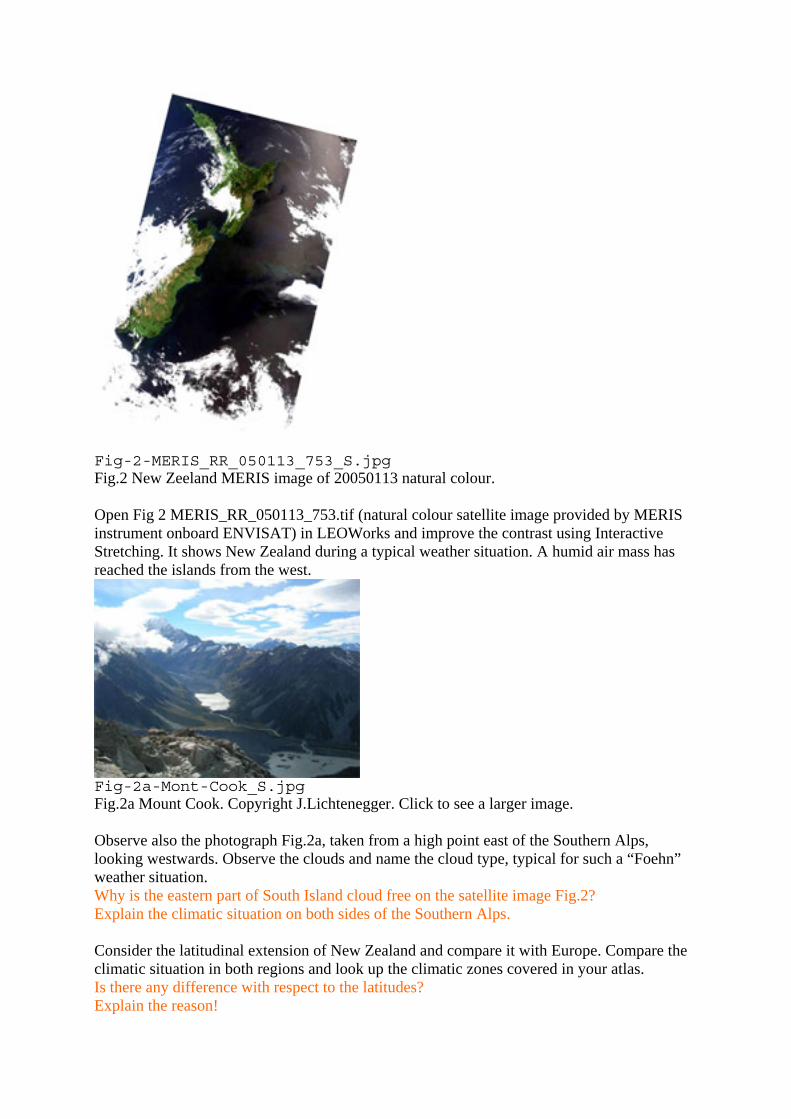
Fig-2-MERIS_RR_050113_753_S.jpg Fig.2 New Zeeland MERIS image of 20050113 natural colour. Open Fig 2 MERIS_RR_050113_753.tif (natural colour satellite image provided by MERIS instrument onboard ENVISAT) in LEOWorks and improve the contrast using Interactive Stretching. It shows New Zealand during a typical weather situation. A humid air mass has reached the islands from the west.
Fig-2a-Mont-Cook_S.jpg Fig.2a Mount Cook. Copyright J.Lichtenegger. Click to see a larger image. Observe also the photograph Fig.2a, taken from a high point east of the Southern Alps, looking westwards. Observe the clouds and name the cloud type, typical for such a “Foehn” weather situation. Why is the eastern part of South Island cloud free on the satellite image Fig.2? Explain the climatic situation on both sides of the Southern Alps. Consider the latitudinal extension of New Zealand and compare it with Europe. Compare the climatic situation in both regions and look up the climatic zones covered in your atlas. Is there any difference with respect to the latitudes? Explain the reason!

Fig 3 NewZealand_MERIS_FR_060910_2132.tif Fig.3 Central New Zealand MERIS image of 20060910 natural colour. Open Fig 3 NewZealand_MERIS_FR_060910_2132.tif (image provided by ENVISAT and acquired on 10th Sept. 2006 at 21.32GMT) and locate the area shown in your atlas and also on Fig.1. Zoom in as necessary and locate the cities of Wellington and Christchurch. Observe the colours of the image which are the natural colours of the landscape. Can you attribute the land cover to vegetation? Distinguish between dry and green grassland, agriculture and forest. Having studied the Background Information (above), can you imagine the land cover of this island before the arrival of humans? Explain the situation nowadays! Also observe the coast line of Fig.3. Explain the colours of the water and the vortices.
Banks Peninsula

Fig 4 Bank Peninsula Geology 6my_S.jpg Fig.4 Geology of Bank Peninsula. Click to see a larger image.
Fig 5 Christchurch_Banks_SPOT_870208_enhanced_S.jpg Fig.5 Christchurch and Bank Peninsula SPOT_19870208 false colour infrared. Study Fig.4 (Geological situation of the Banks Peninsula about 6 million years ago) and open Fig 5 Christchurch_Banks_SPOT_870208_enhanced.jpg (false colour infrared image) from the SPOT satellite, acquired 8th February 1987). Where is Fig.5 located with respect to Fig.3? What type of mountains do you identify on Fig.4? Can you give a brief explanation of the sequences in the geological history. Rocks or layers of each significant event are given a different colour. Indicate the colours from the oldest to the youngest event. Observe Fig.5 which is the situation today. Identify Christchurch and Lyttelton and the hills between as well as the roundish Banks Peninsula. Explain the morphology. Why are there so many fjords and bays? Observe the vegetation. Consider that the image was acquired in the dry season. What vegetation is represented by the red colour. Before humans arrived some 700 years ago, the area was forested. Why has it been cleared and what is the use of the land today?

Fig-6-MtBrandley_S.jpg Fig.6 Mount Brandley and Lyttleton Harbor Bay. Copyright J.Lichtenegger. Click to see a larger image. To answer this question observe the photograph Fig.6, taken from Mount Brandley. It is a view over the western hills of Banks with the Lyttelton Harbour Bay, the town, the Port Hills in the mid ground and in the very distance the partly snow covered Southern Alps. You might wonder that the harbour of Christchurch is that distant and also across hills! Find the answer yourself by observing the access of the city to the sea. Judge the rivermouth as a potential waterway to the city - for large ships!
Lyttelton
The expeditionship of Galathea3 stayed in this harbor from 8 to 11 January 2007.
Fig 7 Lyttelton_PROBA_060910_2247_panchromatic_S.jpg Fig. 7 PROBA image from 10th September 2006.
Open Fig 7 Lyttelton_PROBA_060910_2247_panchromatic.jpg (image of PROBA satellite of 10 Sept 2006) in LEOWorks.
Try to identify the different features of the harbour piers cranes ships containers fuel tanks etc.

Fig 9 Lyttelton_Container harbour photo_S.jpg Fig.9 Lyttleton container harbor. Copyright J.Lichtenegger. Click to see a larger image.
Fig 10 Lyttelton_Coal harbor photo_S.jpg
Fig.10 Lyttleton coal harbor. Copyright J.Lichtenegger. Click to see a larger image.
Look at the photographs of Fig.9 and 10 and identify both similar and different features as the images where not taken at the same time (photographed 4th April 2005) as the PROBA image. Fig.10 shows the coal shipping section in the extreme eastern part of the harbor. The coal is transported by daily trains from the West Coast Region’s large-scale opencast mines of the Buller and Greymouth coalfields with high quality bituminous coal production. Exportation goes mainly to Japan and India. But coal is not the most important product exported from New Zealand. Look at the statistic data of exported products (use link below).
Fig 8 Lyttelton_SPOT_980601_panchromatic_S.jpg

Fig.8 (image of the satellite SPOT acquired on 1 June 1998)
Open Fig 8 Lyttelton_SPOT_980601_panchromatic.jpg (image of the satellite SPOT acquired on 1 June 1998) in LEOWorks. The spatial resolution of this image is about 10m while the PROBA image has a resolution of 5m. Compare the two images. Are there some significant changes over the 8 year period? At least some are clearly visible. Can you find them!
Christchurch
Fig 11 Christchurch_ASAR_RGB_VV_VH_ratio_070110_S.jpg Fig 11 Christchurch_ASAR_RGB_VV_VH_ratio_070110.tif Open Fig 11 Christchurch_ASAR_RGB_VV_VH_ratio_070110.tif in LEOWorks (geocoded radar image from ENVISAT acquired on 10 January 2007 at 11.20GMT – thus in the night). The image gives an overview of the extension of Christchurch. The inhabited area is shown in yellow and pink and the vegetated area in green. Parks are in dark green. The sea is blue or black. Can you recognize the airport?

Fig 12 Christchurch_Avon-River_S.jpg Fig.12 Christchurch Avon River. Copyright J.Lichtenegger. Click to see a larger image.
Fig 13 Christchurch_Casino_S.jpg Fig.13 Christchurch Casino. Copyright J.Lichtenegger. Click to see a larger image.
Fig 14 Christchurch_parking_garage_S.jpg Fig.14 Christchurch parking garage. Copyright J.Lichtenegger. Click to see a larger image.

Strolling through the city you may encounter what you see in photographs Fig. 12, 13 and 14. Inspect the radar image further. Can you find Lyttelton? The image was acquired while the expedition ship was in the port. However the very bright spot visible in the harbour is probably produced by a strong echo from the fuel tanks. At the moment the satellite took the image the ship was on the opposite pier and can be seen there as a yellow spot. You can find the exact position of the ship consulting The Satellite Eye of Galathea 3 web site http://galathea.oersted.dtu.dk/GE_e.html. Click the globe that leads you to open Google Earth. Click on “Route with data” (Google Earth needs to be installed). Find New Zealand and Lyttleton and the location of the ship at the time of the acquisition of the radar data. You may see a point at the pier representing the ship. Radar images have a “strange” image geometry. In order to perceive better the topography in the image, turn it 90 degrees clockwise. Use the Image – Rotate function for this. You have noticed that the radar displays the hills somehow leaning towards west (in this case).
Fig 15 Christchurch_town_SPOT_870208_S.jpg Fig.15 Chistchurch SPOT 19870208 false colour infrared. Open Fig 15 Christchurch_town_870208_false_colour.jpg (false colour infrared image from SPOT satellite acquired on 8th Feb.1987), improve the contrast using Interactive stretching.
Fig 16 Christchurch_town_SPOT_980601_S.jpg Fig.16 Christchurch SPOT 19980601 panchromatic image. Open also Fig 16 Christchurch_town_SPOT_980601_S.jpg (panchromatic black and white image from SPOT satellite of 1st June 1998) and inspect both images also confronting them. Explain the colours of the infrared image. What is the meaning of the red colour? Which area shows up as vegetated and why?
Compare the images especially along the southern edge of the city and find the changes in the housing development between 1987 and 1998. You might wonder that the harbour of Christchurch is that distant and also across hills! Find the answer yourself by observing in Fig. 15 the access of the city to the sea. Judge the rivermouth as potential waterway to the city - for large ships!
Links General information http://en.wikipedia.org/wiki/New_Zealand Climate http://www.niwascience.co.nz/edu/resources/climate/overview/index.html Geology: http://sci.waikato.ac.nz/evolution/geologicalHistory.shtml amd http://www.otago.ac.nz/geology/af/alpinefault.htm, New Zealand statistics: http://www.stats.govt.nz/products-and-services/new-zealand-in-profile-2006/default.htm History of Christchurch: http://uk.holidaysguide.yahoo.com/p-travelguide-48807-christchurch_history-i