new zealand primary school principals’ - nzei health and well-being... · new zealand primary...
TRANSCRIPT

1
New Zealand Primary School Principals’ Occupational Health and Wellbeing
Survey 2016 Data
January, 2017
Prepared by Philip Riley

2
Produced and Published by:
Institute for Positive Psychology and Education
Australian Catholic University
Fitzroy, Victoria, Australia, 3605
Printed January, 2017
© Copyright 2017
NOT FOR RESALE. All material in this document is protected by copyright. Use of
these materials including copying or resale may infringe copyright unless written
permission has been obtained from the copyright owners. Enquiries should be made to
the publisher.

3
Acknowlegements
Projects on this scale do not happen without a number of dedicated people’s support. I
am indebted to NZEI Te Riu Roa who have commissioned and fully funded the
production of this research project. I would also like to thank all of the members the
NZEI Te Riu Roa Principals’ Council who tested the pilot version of the survey and
provided very useful feedback. Their collective determination to make the research as
relevant as possible to stakeholders at all levels of the system is true leadership of the
profession. NZEI Te Riu Roa have also provided the essential function of facilitated
access to the survey for the principals and deputy/assistant principals in their
jurisdictions. Special thanks go to President Louise Green, National Secretary Paul
Goulter, and especially National Office Campaign Lead Jane Porter. The project
manager, research assistant and PhD student, Aimee Maxwell, worked tirelessly to
tight deadlines once again. For Web development and report construction thanks go to
Jason Cleeland. A big thank you also goes to the members of the project consultative
committee, who each contributed many hours of thought, travel for meetings and
invaluable questions and discussion. It is a much better product for their efforts.
Philip Riley, PhD, MAPS
January, 2017
Contact Information www.principalhealth.org Chief Investigator: Associate Professor Philip Riley
NZEI Te Riu Roa Liaison: Jane Porter
Technical Support and Project Management: Aimee Maxwell
Research Assistance: Carol Brown

4
Table of Contents List of Tables ............................................................................................................................ 5 List of Figures .......................................................................................................................... 6
Introduction .......................................................................................................................... 7 Background ...................................................................................................................... 7
Project Aims ............................................................................................................................. 8 Participant Care ...................................................................................................................... 8 Chief Investigator ................................................................................................................... 9 The Survey ................................................................................................................................ 9 Innovation ................................................................................................................................10 Occupational Health, Safety and Wellbeing ............................................................10 Research Questions ...........................................................................................................11
Results Overview ............................................................................................................ 12 New Zealand’s Primary School Principals: A Snapshot ............................ 12 Recommendations ..................................................................................................... 13
Recommendation A: Improving Professional Support .......................................13 Recommendation B. Professional Learning to Build Social Capital ............14 Recommendation C. Review the work practices of Principals and deputy/assistant principals in light of the Job Demands-Resources Model
of organizational health .....................................................................................................14
Detailed Results .............................................................................................................. 16 Ethical Considerations .......................................................................................................16 Response Rates ...................................................................................................................16 Representativeness of the data ....................................................................................16 Reliability ..................................................................................................................................17
Participants ................................................................................................................... 17 Gender ......................................................................................................................................17 Age ..............................................................................................................................................17 School Demographics ........................................................................................................18 Roles and Responsibilities ..............................................................................................19
Workload ........................................................................................................................ 20 Hours at Work ........................................................................................................................20 Interpretation of Work hours ...........................................................................................23 Work Pressures ....................................................................................................................24 Interpretation of Sources of Stress ..............................................................................27 Levels of Autonomy in Carrying Out the Role ........................................................28 Interpretation of Autonomy results ...............................................................................29 Level of Confidence in Carrying Out Role ................................................................29 Interpretation of Confidence results ............................................................................30
Self-Rated Physical and Psychological Functioning .................................. 31 Interpretation of self-rated psychological functioning ............................... 33
Sources of Support .............................................................................................................33 Interpretation of Sources of Support Results .........................................................36
COPSOQ-II Subscale Scores ................................................................................... 375
Copenhagen PsychoSocial Questionnaire – II .................................................. 38 Demands at work ........................................................................................................ 38
International Trends ............................................................................................................38

5
2016 Data in Detail ..............................................................................................................39 Results ......................................................................................................................................39
Work-individual Interface ........................................................................................ 46 International Trends ............................................................................................................46 2016 Data in Detail ..............................................................................................................47 Results ......................................................................................................................................47
Values at the Workplace .......................................................................................... 48 International Trends ............................................................................................................48 2016 Data in Detail ..............................................................................................................49 Results ......................................................................................................................................49
Health and Wellbeing ................................................................................................ 51 International Trends ............................................................................................................51 2016 Data in Detail ..............................................................................................................52 Results ......................................................................................................................................53
Assessment of Quality of Life ................................................................................... 54 Interpretation: Assessment of Quality of Life. ........................................................55
Positive and Negative Affect Scale (PANAS) ...................................................... 55
Passion ............................................................................................................................... 56 Interpretation of Passion Scales ...................................................................................56
Social Capital ................................................................................................................... 58 Introduction ................................................................................................................... 58
2016 Data in Detail ..............................................................................................................58
References......................................................................................................................... 59
List of Tables
Table 1. Participant minimum, maximum and mean age ............................................ 17 Table 2. Māori electorate ............................................................................................. 18 Table 3. Ugrade and enrolment numbers ..................................................................... 18 Table 4. School decile .................................................................................................. 18 Table 5. School type and funding category ................................................................. 18 Table 6. School language type ..................................................................................... 18 Table 7. Leadership position held by year and gender reported by percentage ........... 19 Table 8. Average hours worked per week during school terms ................................... 20 Table 9. Average hours worked per week during gazetted school holidays ................ 21 Table 10. Comparison of average hours worked in per week during school holidays by
role ........................................................................................................................ 22 Table 11. Sources of stress ........................................................................................... 24 Table 12. Sources of stress by Role ............................................................................. 26 Table 13. Perceived levels of autonomy to carry out the leadership role .................... 28 Table 14. Perceived levels of confidence to carry out the leadership role................... 30 Table 15. Self-rated physical and psychological functioning, plus mean annual
medical checkups. ................................................................................................. 31 Table 16. Self-rated psychological functioning ........................................................... 31 Table 17. Self-rated psychological functioning disaggregated by role ........................ 31

6
Table 18 Self rated psychological functioning disaggregated by gender .................... 32 Table 19. Self rated psychological functioning disaggregated by School Type. ......... 32 Table 20. Sources of support for all participants shown as percentage of participants
who report being supported by each support person. ........................................... 33 Table 21. Copenhagen Psychosocial Questionnaire-II subscale scores ....................... 37 Table 22. Assessment of Quality of Life (AQoL-8D) mean scores by subscales and
super-dimensions .................................................................................................. 54
List of Figures
Figure 1. Leadership position held by gender .............................................................. 19 Figure 2. Average hours worked per week during school terms ................................. 20 Figure 3. Average hours worked per week during gazetted school holidays .............. 21 Figure 4. Comparison of average hours worked in per week during school holidays by
role ........................................................................................................................ 22
Figure 5. Sources of Stress 25
Figure 6. Perceived levels of autonomy to carry out the leadership role ..................... 29 Figure 7. Level of confidence to perform various leadership tasks ............................. 30 Figure 8. Self rated psychological functioning disaggregated by role ......................... 32 Figure 9. Self rated psychological functioning disaggregated by Gender. .................. 32 Figure 10. Self rated psychological functioning disaggregated by school type........... 33 Figure 11. Sources of support for all participants ........................................................ 34 Figure 12. Sources of Support disaggregated by gender. ........... Error! Bookmark not
defined. Figure 13. Assessment of Quality of Life (AQoL-8D) mean scores by subscales and
super-dimensions .................................................................................................. 54

7
Introduction
Background
The project has been a response to the perceived health threats created by the current
raft of education reforms that are migrating around the world through global
educational reform movements (GERM: Sahlberg, 2015). New Zealand has been
recently caught up in GERM reforms and this prompted NZEI Te Riu Roa to
commission the research here. The research is a replication of research that has been
running in Australia since 2011, and Ireland since 2014, allowing direct comparisons
from the first year of data collection.
In the UK, where schools have been increasingly accountable for results via the
publication of league tables, Phillips and Sen (2011) reported that, “work related
stress was higher in education than across all other industries… with work-related
mental ill-health… almost double the rate for all industry” (p. 177-8). A significant
stressor has been the increased emphasis by governments on accountability for
uniform curriculum delivery along with the devolution of administrative tasks from
central to local control. An extensive review of schools and school leadership in 25
countries the OECD reported,
School leaders’ roles have changed from practicing teachers with added
responsibilities to full-time professional managers of human, financial
and other resources accountable for their results. This
has meant that more and more tasks have been added to the
job description: instructional leadership, staff evaluation,
budget management, performance assessment,
accountability, and community relations, to name some of
the most prominent ones. In this environment, the range of
knowledge and skills that effective school leaders need
today is daunting: curricular, pedagogical, student and
adult learning in addition to managerial and financial
skills, abilities in group dynamics, interpersonal relations
and communications. (Matthews, et al., 2007).
The work practices (role demands) imposed by these changes further increase work
volume and public accountability and decrease principals’ and deputy/assistant
principals’ decision latitude through externally imposed reporting deadlines.
Extensive research on similar professional populations, middle ranking public
servants in the UK, reported in more than 100 Whitehall I and II studies found
adverse health outcomes including decreased life expectancy results from high role
demand and concurrent low decision latitude. Principals and deputy/assistant
principals experiencing concurrent low decision latitude and high [role] demands
cannot moderate the stress caused by the high demands through time management or
learning new skills, and so become subject to high stress at work and are at increased
risk of disease. (Kuper & Marmot, 2003, p. 147)

8
More disturbing is that under these conditions younger people appear to be at greater
risk of coronary heart disease than their older colleagues (Kuper & Marmot, 2003).
This longitudinal research project has been designed to collect baseline data and
monitor the health and wellbeing of New Zealand’s primary school principals and
deputy/assistant principals and to contribute to the development of work practices
designed to minimize the adverse health impacts on the individuals.
Project Aims
The aim of this research project is to conduct a longitudinal study monitoring school
principals and deputy/assistant principals’ health and wellbeing annually, in differing
school types, levels and size. These organizational differences will be monitored
along with lifestyle choices such as exercise and diet and the professional and
personal social support networks available to individuals. The turnover of principals
and deputy/assistant principals within schools will allow investigations of moderator
effects, such as years of experience prior to taking up the role. The longitudinal study
will allow the mapping of health outcomes on each of these dimensions over time.
Participant Care
Voluntary participation was sought by email invitation from NZEI Te Riu Roa
allowing the organisation to keep membership information secure from the
researchers. No personal information of members was provided to the researchers.
Principals and deputy/assistant principals who accepted the invitation to participate
voluntarily provided contact details to the researchers to be used for subsequent
invitations to participate in annual updates. This information was not provided to
NZEI Te Riu Roa, thus keeping the researchers, participants and NZEI Te Riu Roa at
arm’s length, to protect the privacy of the participants. Participants were also asked to
provide contact details for an alternative contact person, to be used if the participants’
contact details change between annual surveys. The invitation included a recruitment
flyer (available at: www.principalhealth.org/nz.info.php) outlining the study and a
hyperlink to the survey website. The invitations and reminder emails were sent out
regularly, approximately two weeks apart while the survey was open. The survey
website opened for 12 weeks to collect each wave of data, at the end of September
and closed mid-November, 2016. When participants chose to take the survey they
were directed firstly to the Explanatory Statement on the project website. By clicking
the “next” box at the end of the statement the survey commenced. All principals and
deputy/assistant principals who registered to take the survey will be contacted
annually and invited to complete an update survey.
Each survey participant received a comprehensive, individual report from his/her own
survey responses. Participants were advised in the Explanatory Statement to seek
individual help such as counselling if they experienced distress following the survey.
Survey results returned to participants included contact details of local support
agencies and providers tailored to the individual’s needs resulting from their survey
responses. The Chief Investigator was available to arrange individual assistance for
participants if required.

9
Chief Investigator
Associate Professor Philip Riley, from Australian Catholic University, a registered
psychologist with the Australian Health Practitioner Regulation Agency oversaw the
project. He is a former school principal and is also the Chief Investigator for The
Australian and Irish Principals and Deputy Principals Health and Wellbeing Surveys.
The Survey
Workplace changes brought about either by changing community attitudes or
government policy affect all schools and all school principals and deputy/assistant
principals yet no systematic, longitudinal measurements of the effects these changes
have on the occupational health and safety of school principals in New Zealand been
conducted until now. This research project will collect data and monitor the health,
safety and wellbeing of school principals and deputy/assistant principals annually.
This report covers the first wave of data collection, which was limited to primary
principals for logistical reasons. We hope to include secondary principals in
subsequent data collection waves.
This survey is the first independent, national research project undertaken to take
baseline measurements and compare the occupational risks of all school principals
and deputy/assistant principals longitudinally. Over time it will be used to monitor the
efficacy of stress reduction interventions, for individuals and policy changes imposed
on principals and deputy/assistant principals.
The survey captured three types of information drawn from existing robust and widely
used instruments. First, comprehensive school demographic items drawn from the
Trends in International Mathematics and Science Study (TIMSS) (Williams, et al.,
2007), Program for International Student Assessment (PISA) (Thomson, et al., 2011),
and the International Confederation of Principals surveys were used to capture
differences in occupational health and safety (OH&S) associated with the diversity of
school settings and types. Second, personal demographic and historical information
was captured. Third, principals and deputy/assistant principals’ quality of life and
psychosocial coping were investigated, by employing four measures, the Assessment
of Quality of Life – 8D (AQoL-8D: Richardson, et al., 2009; Richardson, Iezzi &
Maxwell, 2014), The Copenhagen PsychoSocial Questionnaire – II (COPSOQ-II:
Pejtersen, et al., 2010), The Positive and Negative Affect Schedule (PANAS: Watson,
Clark, & Tellegen, 1988) and the Dualistic Model of Passion (Vallerand, 2015).
Alcohol use was measured using The Alcohol Use Disorders Identification Test
(AUDIT: Babour et al., 2001), developed for the World Health Organization. The
combination of items from these instruments allows opportunities for comprehensive
analysis of variation in both OH&S and wellbeing as a function of school type, sector
differences and the personal attributes of the principals themselves.
Finally, it is envisaged that aggregated survey information could be used to seed focus
group discussions of school principals and deputy/assistant principals across the
country. Focus groups could then develop primary interventions (policy changes) to
reduce occupational stress at the source. Proven secondary interventions designed to

10
help individuals better cope with stress, such as those developed for trainee doctors
(Hassed, de Lisle, Sullivan, & Pier, 2009), could also be trialed with volunteer
principals and deputy/assistant principals and evaluated through the annual survey.
This conceptual framework, combining primary and secondary occupational health
and injury prevention interventions with evidenced-based assessment, has proven
robust over hundreds of studies and is considered best practice for improving
workplace safety (LaMontagne, et al., 2007).
Innovation
This research project is innovative at both the individual and the organizational level.
The project involved the design and implementation of new information access
systems and feedback mechanisms (connected to sophisticated automatic analysis
tools) for school leaders, affording them instant health and wellbeing checkups
tailored to their specific work context, and eventually, instant intervention strategies
for dealing with the complexity of their roles. In this way the survey also has the
capacity to act as an intervention. Principals who complete the survey received
interactive feedback on 43 separate dimensions of occupational health, safety and
wellbeing, through a dedicated secure website, affording instant health and wellbeing
checkups tailored to their specific work context. The survey provides detailed
feedback which might prompt principals to make changes to their behaviour. In future
iterations of the survey it is hoped that we can incorporate feedback to individuals
using like-group comparisons. For example, individual principals and deputy/assistant
principals will be able to compare their results with a matched group of principals and
deputy/assistant principals in similar circumstances on a range of categories. These
include: small/medium/large schools; primary/secondary/ special; urban, suburban,
regional, rural and remote locations; low/high Socio Economic Status; indices of
happiness, stress, job satisfaction, exercise, social support, coping and quality of life.
The instant benefit to individuals is likely to increase both participation rates and the
veracity of the information they submit. The aggregated data will be made available to
government, employer bodies, Department of Education and Skills, Management
bodies, unions and other interested parties through these annual reports.
Occupational Health, Safety and Wellbeing
The occupational health and safety literature categorizes interventions to improve
workplaces into three types: primary, secondary and tertiary (LaMontagne, et al.,
2007). Primary interventions are organizational, systematic approaches targeted
toward prevention of exposure to stressors in the workplace. Secondary interventions
are designed to help individuals better cope with the stressors they encounter, such as
relaxation and mindfulness training. Tertiary interventions are designed to lessen the
impact of stress related problems post occurrence through treatment or management
of symptoms and rehabilitation. The Principal Health and Wellbeing Survey and
evidence-based interventions to reduce stress related disease will provide significant
social and economic benefit to the country. Psychosocial work conditions have a
significant impact on health outcomes (Head, et al., 2007; Kuper & Marmot, 2003;
Marmot, 2006), while physical and psychological wellbeing have a significant effect
on job performance (Lyubomirsky, et al., 2005). Price Waterhouse Coopers have

11
recently conducted a Return on Investment (RoI) for addressing mental health in
Australian workplaces. They found that the impact of not addressing it amounted to
$10.6 billion annually (see, http://www.headsup.org.au/creating-a-mentally-healthy-
workplace/the-business-case). However, they also reported that every dollar spent on
addressing the issue returned $2.30. The annual updates of the survey can be used to
monitor the RoI and effectiveness of stress reduction interventions.
Research Questions
The specific research questions guiding the initial survey were:
Can recognizable occupational health, safety and wellbeing subgroups of principals
and deputy/assistant principals be identified through the survey? These groups may be
inferred from a number of criteria including: Sector; Location (Urban, Rural, Isolated,
Off-shore Island); Type (State, State Integrated, Private, Maori/Immersion
(Kura/wharekura)); Background (Family of Origin, School Education); Person
Factors (Gender, Family of Procreation, Social Support, Educational Level); Role
Factors (Hours worked, number and type of teachers, students and parents, resources,
professional support); Occupational Constraints.
Do(es) any group(s) thrive in the role?
Do(es) any group(s) only just survive in the role?
Do(es) any group(s) show signs of adverse health, safety, and wellbeing outcomes.
Do(es) any factors affect these group(s), and in what ways?
Are changes to educational policy or policy implementation suggested by the results?
12
Results Overview
The participants in the survey have very demanding jobs. They spend very long hours
at work, both during term time and during term breaks. The number of hours worked
appears to have no relation to salary. They appear dedicated to the task of running
schools as effectively as possible for its own intrinsic reward. The details of the
personal costs of their work, their occupational health, safety and wellbeing are a
complex mix of personal and environmental factors: from those who appear to thrive
in the job to those who are perhaps just surviving.
For most of the results reported the data is presented firstly in broad outline and then
by demographic group (School Type, Geolocation Gender, Role). Where the diversity
of experience is best represented visually graphs have been used.
New Zealand’s Primary School Principals: A Snapshot
There were 398 primary principals (69.3%), 145 deputies (25.3%), and
31assistants (5.4%) who took part. Overall 20% of the nation’s primary
principals took part, but it is difficult to determine what percentage of deputies
and assistants participated. It is impossible to calculate the number of
assistants/deputies in the country as they are not in all schools, and many large
schools have more than one deputy/assistant, so no divisor exists to make the
calculation. However, the raw numbers suggest a good proportion of those
eligible to take part did.
The gender breakdown for the whole sample is 69.9% female and 30.1% male.
66% worked in Urban locations, 31.45 Rural, 1.7% in Isolated, and 0.3% in
Off-shore locations.
Average age is 52.17 years, ranging from 29 – 79 years.
Of all participants, 11.3% were Māori.
Most leaders had been in their current role for 7.29 years and leadership roles
for ~14.46 years, following ~10 more years in teaching.
Approximately 72% work upwards of 51 hours per week during term with
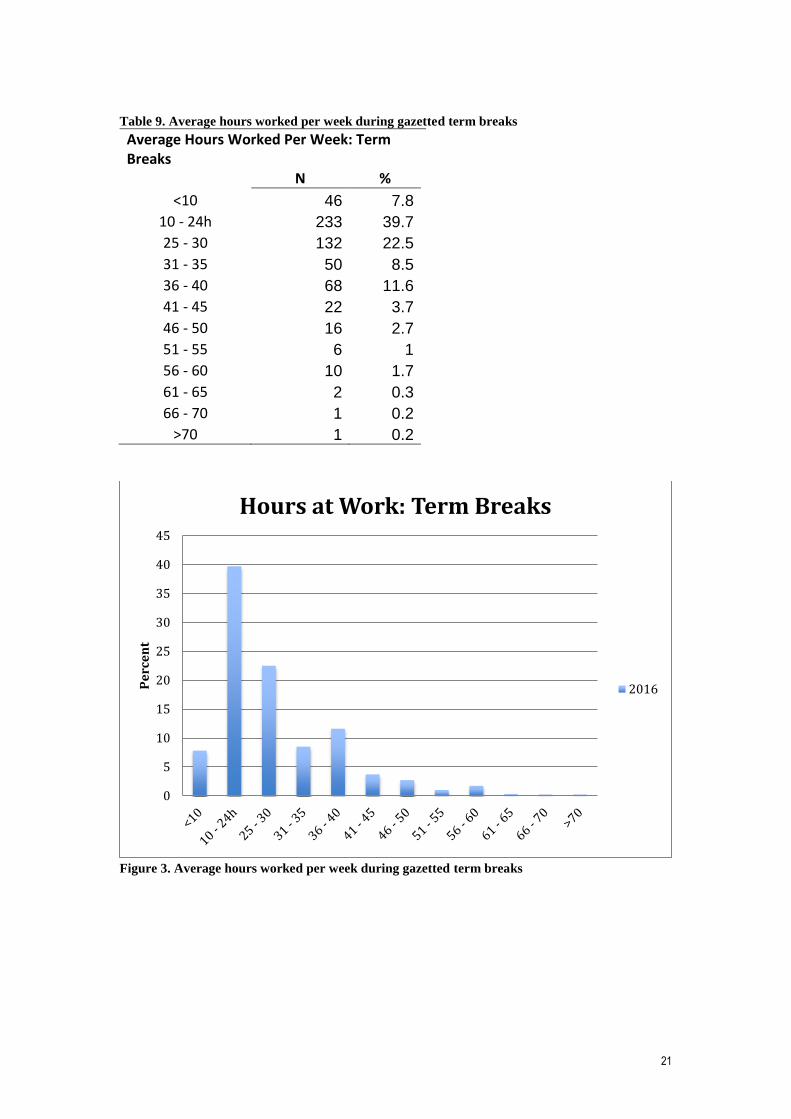
25% working upwards of 61 hours per week. During term breaks, ~92% work
upwards of 10 hours per week, and 52% worked >25 hours per week.
They are generally positive about their job and report higher job satisfaction
than the population
Most maintain a healthy alcohol intake, and do not use it to manage stress.
Principals experience high levels of emotional demands and emotional labour
when compared to the general population. This is correlated with higher levels
of burnout and stress symptoms (difficulty sleeping, somatic symptoms)
The greatest source of stress for all principals and deputies/assistants is the
sheer quantity of work, closely followed by a lack of time to focus on teaching
and learning.
The quantitative demands mean Work-family conflict is far too high, at 2.2
times the rate of the general population.

13
School leaders report 1.7 times the rate of burnout experienced by the general
population. Urban leaders report significantly lower rates of burnout. Females
report statistically significantly higher scores than males.
Stress is reported at 1.8 times the general population rate.
Sleeping troubles is reported at 2.4 times the general population rate. Chronic
sleep deprivation predicts a number of long-term health issues, including
memory difficulties, obesity and depression. Urban leaders report significantly
lower rates of sleeping difficulties. Females report statistically significantly
higher scores than males.
Somatic stress is reported at 1.4 times the general population rate. Females
report statistically significantly higher scores than males.
Cognitive stress school leaders report 1.8 times the rate of Cognitive Stress
compared to the general population.
Depressive symptoms are reported for school leaders at 1.8 times the rate of
the general population.
Self-efficacy school leaders report 1.1 times the level of self-efficacy
compared to the general population. Urban leaders report significantly higher
levels.
Despite having many predictive attributes for high scores on health and
wellbeing (COPSOQ-II) and quality of life (Assessment of Quality of Life-
8D) measures, collectively principals and deputy/assistant principals score less
than the general population on all positive measures (self-rated health;
happiness; mental health; coping; relationships; self-worth; personal wellbeing
index) and higher on all negative measures (burnout; stress; sleeping troubles;
depressive symptoms; somatic stress symptoms; cognitive stress symptoms).
The differences are detailed in the full report.
Recommendations
The recommendations are grouped under thematic headings that emerged from the
data analysis. While there are particular challenges to the occupational health, safety
and wellbeing of principals and deputy/assistant principals which result from
contextual and geographical determinates, the recommendations below relate to more
general occupational conditions found across the country. The recommendations are
relatively straightforward and consistent with evidence from other countries showing
that professional support for principals provides many benefits that flow through to
improved student learning outcomes.
Recommendation A: Improving Professional Support
Professional support is a strong predictor of coping with the stresses of the role (job
demands). No principals and deputy/assistant principals should feel unsupported in
the face of growing job complexity, increased scrutiny stress from public
accountability and decreased control over the ways in which the accountability targets
are met. Yet they report virtually no support from their employer. Those who do feel
supported largely find it outside of their professional life.
14
The evidence from the social capital analysis point to the benefits of professional
support for all principals and deputy/assistant principals. Those who receive the least
have the greatest challenges to maintain their mental health. The principals and
deputy/assistant principals identified as coping least well with their daily tasks had the
lowest levels of professional support from colleagues and superiors while those who
coped the best reported the highest levels of professional support. This is an area of
improvement that would be relatively easy for education systems to improve.
Some suggestions follow:
Provide opportunities for principals and deputy/assistant principals to engage
in professional support networks on a regular basis.
Networks would need to be determined locally, contextually and formally, and
provide opportunities for informal support alongside formal support, outlined
in Recommendation B.
A provision of time for principals and deputy/assistant principals to build and
maintain professional support networks would be needed.
This could be augmented by experienced principal mentors, perhaps retired
principals, visiting schools to provide support in the form of professional
conversations (“agenda-less” meetings) allowing school principals and
deputy/assistant principals time to discuss the day-to-day functioning of their
schools with a sympathetic, experienced colleague.
Recommendation B. Professional Learning to Build Social Capital
Systematic attention needs to be paid to the professional learning of principals and
deputy/assistant principals, as targeted professional support. The data reveals a
perception disconnection between principals, deputies and assistants with regard to
social capital in schools. The three groups cannot be concurrently correct. This may
be due to inconsistency in information. Principals are privy to information that the
others sometimes are not able to know. However, there is a need for skill development
in the emotional and relational aspects of the leadership role outlined in
Recommendation A, for example dealing with the highs and lows associated with the
emotional investment of parents in their children. In-service provision of education on
the emotional aspects of teaching, learning, organizational function, emotional labour,
dealing with difficulties and conflicts in the workplace, employee assistance
programs, debriefing self and others would be a great benefit.
Recommendation C. Review the work practices of Principals and
deputy/assistant principals in light of the Job Demands-Resources Model
of organizational health
Stress and psychological risk at work can be conceptualised through the balance of
job demands (e.g., workload, time pressures, physical environment, emotional labour)
and job resources (e.g., feedback, rewards, control, job security, support). The Job
Demands-Resources model (Demerouti, Bakker, Nachreiner, & Schaufeli, 2001)
along with the Conservation of Resources theory (Hobfoll, 1989 (Halbesleben, 2006;
Hobfoll & Freedy, 1993) posit that work demands and available resources need to be
15
in balance for good psychological health at work. High job demands lead to
exhaustion while low job resources lead to disengagement, both symptoms of job
burnout. However, high job resources buffer job demands, reducing their negative
impact on individuals. Principals and deputies/assistants report very high demands,
out of balance with available resources to buffer the demands.
The US Department of Health and Human Services found the costs of working too
much include:
Working >10 hours a day led to a 60% increased risk of cardiovascular disease
10% of those working 50–60 hours a week report relationship problems, and
30% for those working more than 60 hours.
Working >40 hours per week is associated with
o increased alcohol and tobacco consumption
o unhealthy weight gain in men
o depression in women
Little productive work occurs after 50 hours per week.
In white collar jobs, productivity declines by as much as 25% when workers
put in 60 hours or more.
Working >60 hours per week led to 23% higher injury hazard rate (Caruso,
Hitchcock, Dick, Russo, & Schmit, 2004).
With 75% of New Zealand school leaders working >50 hours per week and 25%
working >60 hours, too many participants are working too many hours. And it is also
taking a toll on their greatest support group; their families. When job demands are this
high, they need to be balanced with significant resources to buffer the demands.
Therefore, all stakeholders need to be consulted about ways in which this can be
achieved. Obvious, but unlikely to be funded, examples of reducing job demands
would be job sharing. However, working groups tasked with addressing the issues of
job demands may identify lower cost and equally effective solutions to job sharing.
What is clear is that this level of demand is dangerous to the long-term health and
wellbeing of principals who find consistently that the resources available to them are
not concomitant with the demands. The cost to the nation of the mental health
challenges produced by this kind of work culture is high. Price Waterhouse Coopers
have recently conducted a Return on Investment for addressing mental health in the
Australian context. They found that the impact of not addressing mental health issues
amounted to $10.6 billion annually (see, http://www.headsup.org.au/creating-a-
mentally-healthy-workplace/the-business-case). However, they also reported that
every dollar spent on addressing the issue returned $2.30. Addressing the problem in
schools is also a good investment for the future of the nation, as it will save money in
the long term.

16
Detailed Results
Ethical Considerations
New Zealand has 1,951 primary schools and therefore the same number of principals.
It is more difficult to ascertain the number of deputy/assistant/ principals across the
country. Gathering a comprehensive set of data for each individual, including contact
information allowing for annual follow-up participation, confronted the researchers
with many ethical issues that needed to be dealt with before the survey could
commence. Our main concern was protection of identity: that no participant could
ever be identified from any of his or her responses to the survey in any year it was
taken. While this is a relatively simple procedure for the aggregated results, a
significant output for the survey annually is the production of a detailed individual
report for each participant. The aim of this report is to allow each individual to track
his or her own occupational health, safety and wellbeing, both over time, and in
comparison to other principals and deputy/assistant principals. As researchers, we are
interested in analyzing aggregated results, but wanted the survey to be as useful a tool
as possible to the individual participants.
A number of protocols were developed to provide arm’s length distance between the
researchers and participants. Individual, detailed reports to each participant were
constructed automatically, by applying algorithms to each individual’s responses.
This provided total scores on each subscale of the survey. This, in turn ensured that
the individual reports were not seen by any of the researchers. The individual reports
were provided to each participant via a secure, password-protected website. The
researchers used de-identified data sets to conduct specific analyses on the aggregated
data.
Response Rates
For the initial survey invitations and reminder emails were sent out by NZEI Te Riu
Roa to their members. This kept the researchers at arms-length from the participants.
The researchers therefore do not know an essential element for determining the actual
response rate to the survey: how many principals and deputy/assistant/assistant
principals actually received an invitation to participate. This makes it impossible to
determine the actual response rate as there is no divisor for the calculation. In total,
728 people registered to take the survey and 561 competed it (77% response rate).
There were 398 principals (69.3%), 145 deputies (25.3%), and 31assistants (5.4%)
who took part. Overall 20% of the nation’s primary and area school principals took
part, but it is difficult to determine what percentage of deputies and assistants
participated.
Representativeness of the data
The data reported is a good representative sample of principals and deputy/assistant
principals from across the country, with the exception of composite schools. If New
Zealand follows the trend in other countries the representativeness will improve with
every wave of data collection.

17
Reliability
The reliability of each of the scales and subscales used were checked for internal
consistency of responses. All scales were robust. The detailed reports are available at
www.principalhealth.org/au/reports
Participants
Gender
The gender breakdown for the whole sample is 69.9% female and 30.1% male.
Age
Table 1. Participant minimum, maximum and mean age
Age
Mean Youngest Oldest SD
2016 52.17 29 73 8.53

18
School Demographics
Table 2. Māori electorate
Māori electorate N %
Unknown 136 18.7
Hauraki-Waikato 47 6.5
Ikaroa-Rawhiti 69 9.5
Not Applicable 1 0.1
Tamaki Makaurau 65 8.9
Te Tai Hauauru 98 13.5
Te Tai Tokerau 79 10.9
Te Tai Tonga 202 27.7
Waiariki 31 4.3
Total 728 100
Table 3. Ugrade and enrolment numbers
Ugrade N %
1 63 10
2 67 10.7
3 87 13.9
4 179 28.5
5 152 24.2
6 48 7.7
7 20 3.2
8 6 1
9 2 0.3
10-16 3 0.6
Total 627 100
Min Max Mean SD
Enrolment 0 1009 264 185
Table 4. School decile
School Decile N %
0 1.2 1.5
1 52 8.7
2 55 9.2
3 56 9.3
4 66 11
5 56 9.3
6 40 6.7
7 61 10.1
8 66 11
9 64 10.6
10 76 12.6
Unknown 127 17.4
Total 601 100 Table 5. School type and funding category
School Type N %
Full primary 271 43
Contributing primary 279 44.3
Composite/area school 13 2.1
Special school 18 2.9
Intermediate/middle school 49 7.8
Total 630 100
Targeted Funding Category
Category N %
1 34 61.8
2 9 16.4
3 5 9.1
4 3 5.5
5 3 5.5
6 1 1.8
Total 55 100
Table 6. School language type
School language type N %
English medium 568 90.7
Full Māori immersion 7 1.1
English medium with a Māori immersion unit or class(es) 49 7.8 English medium with a language unit or class(es) other than Māori 2 0.3
Total 626 100
19
Roles and Responsibilities
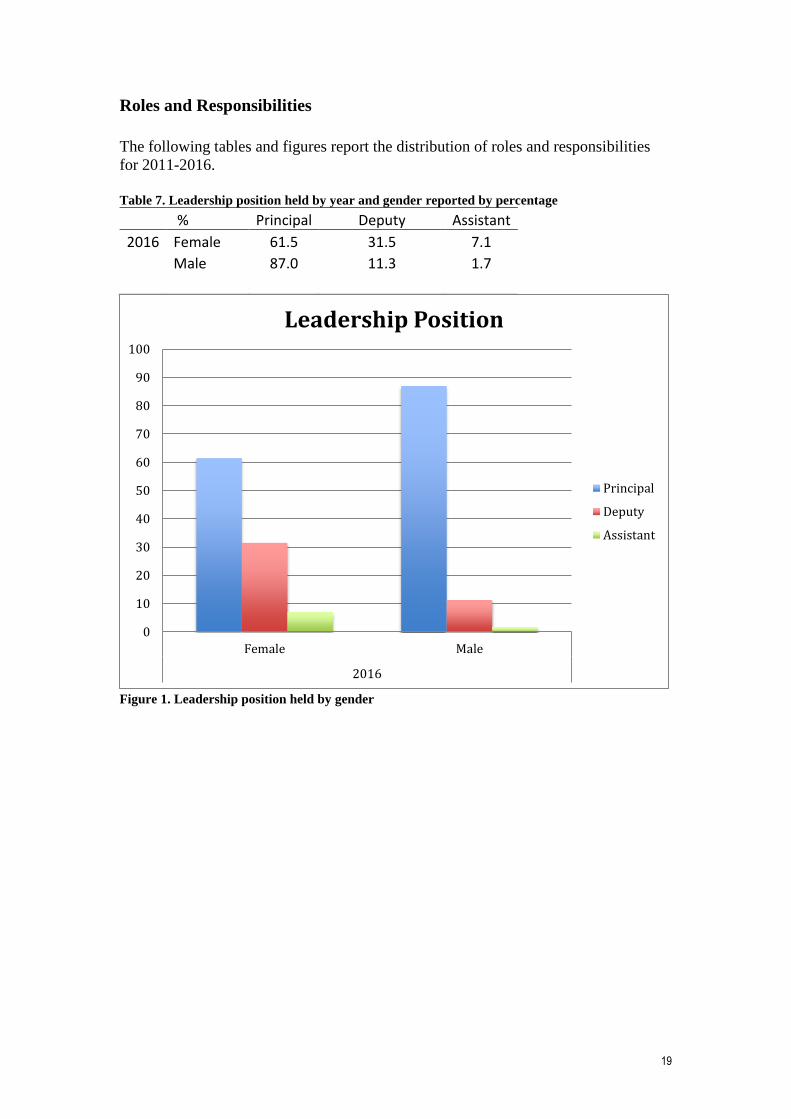
The following tables and figures report the distribution of roles and responsibilities
for 2011-2016.
Table 7. Leadership position held by year and gender reported by percentage
% Principal Deputy Assistant
2016 Female 61.5 31.5 7.1
Male 87.0 11.3 1.7
Figure 1. Leadership position held by gender
0
10
20
30
40
50
60
70
80
90
100
Female Male
2016
Leadership Position
Principal
Deputy
Assistant

20
Workload
Hours at Work
Note this includes APs and DPs working part-time hours.
Table 8. Average hours worked per week during school terms
Average Hours Worked Per Week: Term
N %
<10 10 1.7
10 - 24h 43 7.3
25 - 30 17 2.9
31 - 35 8 1.4
36 - 40 3 0.5
41 - 45 20 3.4
46 - 50 66 11.2
51 - 55 110 18.7
56 - 60 164 27.9
61 - 65 78 13.3
66 - 70 45 7.7
>70 23 3.9
Figure 2. Average hours worked per week during school terms
0
5
10
15
20
25
30
Pe
rce
nt
Hours at Work: Terms
21
Table 9. Average hours worked per week during gazetted term breaks
Average Hours Worked Per Week: Term Breaks
N %
<10 46 7.8
10 - 24h 233 39.7
25 - 30 132 22.5
31 - 35 50 8.5
36 - 40 68 11.6
41 - 45 22 3.7
46 - 50 16 2.7
51 - 55 6 1
56 - 60 10 1.7
61 - 65 2 0.3
66 - 70 1 0.2
>70 1 0.2
Figure 3. Average hours worked per week during gazetted term breaks
0
5
10
15
20
25
30
35
40
45
Pe
rce
nt
Hours at Work: Term Breaks
2016

22
Table 10. Comparison of average hours worked in per week during term breaks by role
Average hours worked per week: Term breaks
Hours Principal Deputy Assistant
<10 5 10.6 25.8
10 - 24h 39.4 43 32.3
25 - 30 22.9 23.9 12.9
31 - 35 9.5 5.6 6.5
36 - 40 12.6 10.6 9.7
41 - 45 4.5 1.4 6.5
46 - 50 3 1.4 0
51 - 55 0.8 1.4 0
56 - 60 1.8 1.4 3.2
61 - 65 0 0.7 3.2
66 - 70 0.3 0 0
>70 0.3 0 0
Figure 4. Comparison of average hours worked in per week during term breaks by role
0
5
10
15
20
25
30
35
40
45
50
Per
cen
t
Average Hours worked per week: Term Breaks
Deputy Assistant Principal

23
Interpretation of Work hours
Role
A one-way between groups analysis of variance (ANOVA) was conducted to explore
the differences in reported average hours at work by role. Principals’, deputy’s and
assistants’ reported work hours during terms were statistically significantly different F
(2,113) = 77.602, p <.001. Despite reaching statistical significance, the actual
difference in mean scores was very small. The effect size, calculated using eta
squared, was .21. Post hoc comparisons using the Tukey HSD test indicated that the
mean score for principals (M = 8.84, SD = 1.72; ~53 hours per week) was
significantly higher than deputies (M = 6.46, SD = 3.17; ~47 hours per week), and
assistants (M = 5.65, SD = 3.10; ~43 hours per week). Deputies and assistants scores
did not significantly differ.
Location & School Type
There were no significant differences between participants by location, or school type.
Gender
Reported average work hours during terms were statistically significantly different by
gender F (1,585) = 4.377, p = .037. Despite reaching statistical significance, the actual
difference in mean scores was very small. The effect size, calculated using eta
squared, was .01. Post hoc comparisons using the Tukey HSD test indicated that the
mean score for males (M = 8.32, SD = 2.09; ~52 hours per week) was significantly
higher than females (M = 7.83, SD = 2.81; ~49 hours per week).
There were no significant differences between any participants’ hours at work during
term by school decile and no differences between any groups during term breaks.

24
Work Pressures
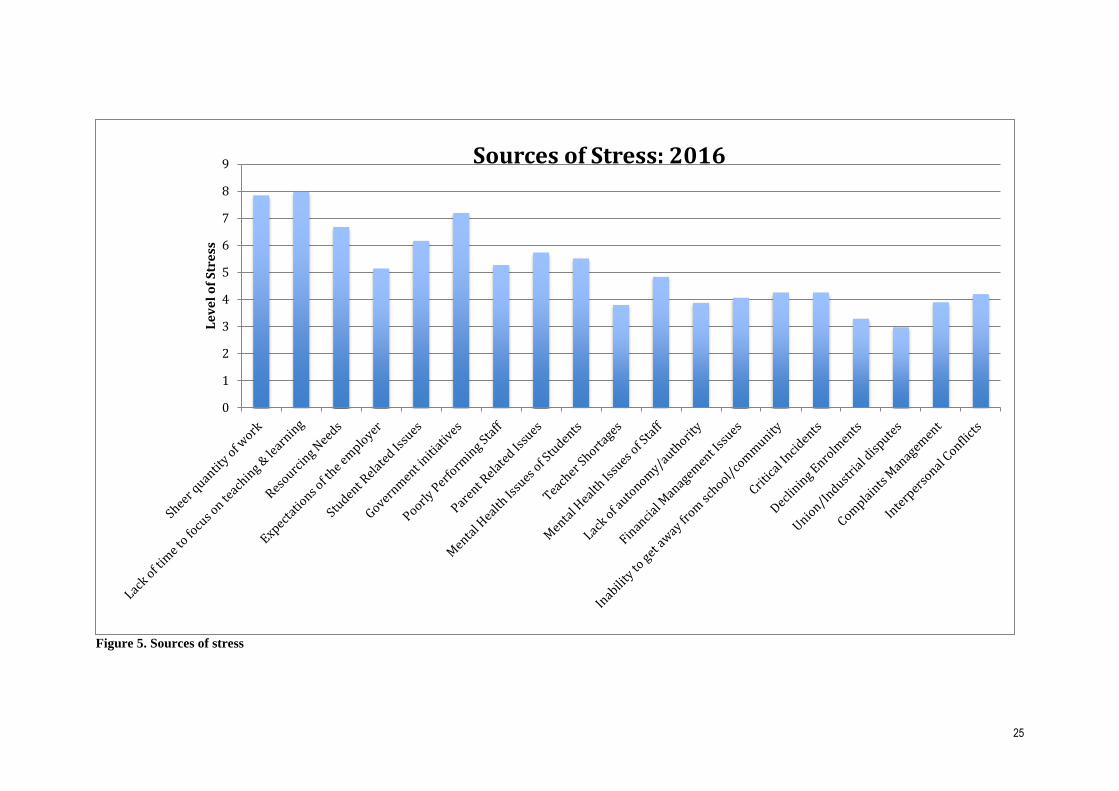
Table 11. Sources of stress
Sources of Stress Minimum Maximum Mean Std Dev
Sheer quantity of work 1 10 7.84 2.21
Lack of time to focus on teaching & learning 1 10 7.97 2.03
Resourcing Needs 1 10 6.67 2.58
Expectations of the employer 1 10 5.14 2.76
Student Related Issues 1 10 6.16 2.55
Government initiatives 1 10 7.19 2.34
Poorly Performing Staff 1 10 5.27 2.96
Parent Related Issues 1 10 5.73 2.59
Mental Health Issues of Students 1 10 5.51 2.81
Teacher Shortages 1 10 3.79 2.81
Mental Health Issues of Staff 1 10 4.83 2.64
Lack of autonomy/authority 1 10 3.87 2.68
Financial Management Issues 1 10 4.06 2.65
Inability to get away from school/community 1 10 4.25 2.95
Critical Incidents 1 10 4.25 2.83
Declining Enrolments 1 10 3.28 3.02
Union/Industrial disputes 1 10 2.97 2.51
Complaints Management 1 10 3.89 2.76
Interpersonal Conflicts 1 10 4.19 2.80
25
Figure 5. Sources of stress
0
1
2
3
4
5
6
7
8
9
Le
ve
l o
f S
tre
ss
Sources of Stress: 2016
26
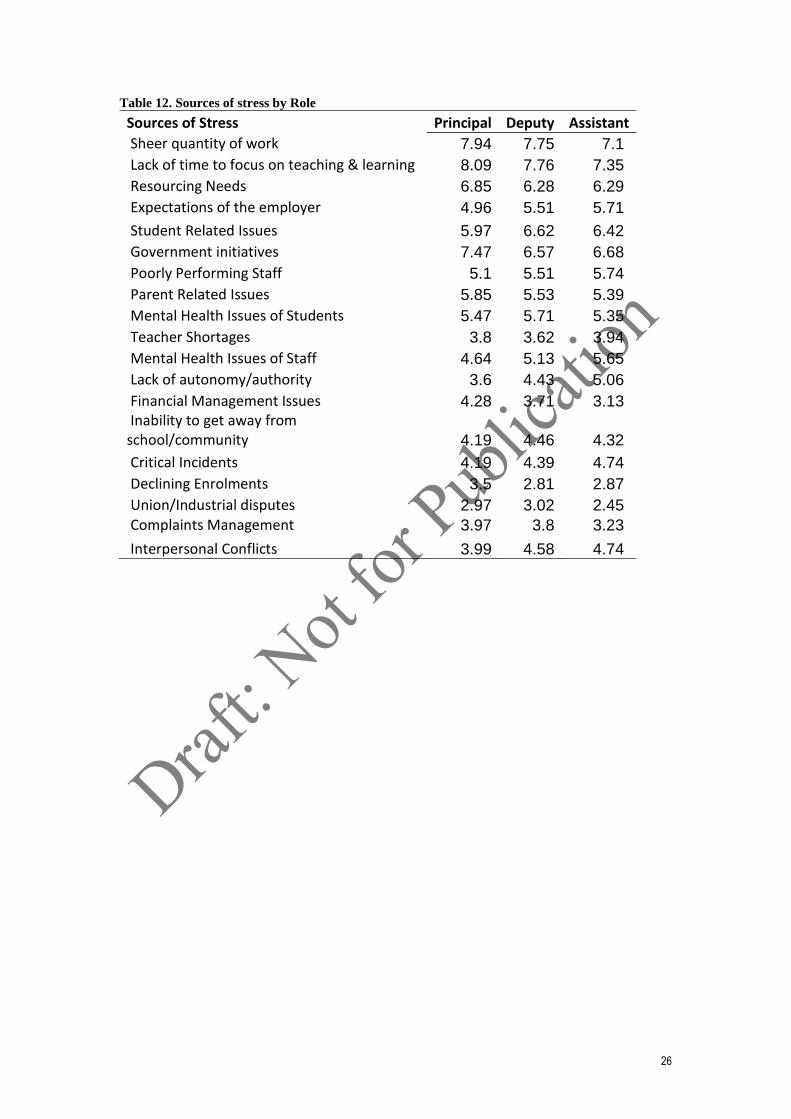
Table 12. Sources of stress by Role
Sources of Stress Principal Deputy Assistant
Sheer quantity of work 7.94 7.75 7.1
Lack of time to focus on teaching & learning 8.09 7.76 7.35
Resourcing Needs 6.85 6.28 6.29
Expectations of the employer 4.96 5.51 5.71
Student Related Issues 5.97 6.62 6.42
Government initiatives 7.47 6.57 6.68
Poorly Performing Staff 5.1 5.51 5.74
Parent Related Issues 5.85 5.53 5.39
Mental Health Issues of Students 5.47 5.71 5.35
Teacher Shortages 3.8 3.62 3.94
Mental Health Issues of Staff 4.64 5.13 5.65
Lack of autonomy/authority 3.6 4.43 5.06
Financial Management Issues 4.28 3.71 3.13
Inability to get away from school/community 4.19 4.46 4.32
Critical Incidents 4.19 4.39 4.74
Declining Enrolments 3.5 2.81 2.87
Union/Industrial disputes 2.97 3.02 2.45
Complaints Management 3.97 3.8 3.23
Interpersonal Conflicts 3.99 4.58 4.74

27
Interpretation of Sources of Stress
The three most significant stressors for all participants were “Sheer quantity of work”, “Lack
of time to focus on teaching and learning” and “Government Initiatives”. These are of course
all related to the increasing accountability environment witnessed across the western world
through the Global Educational Reform Movement (GERM). The figures reported here are
very similar to both the Australian and Irish health and wellbeing surveys
(www.principalhealth.org). There were no significant differences on both these sources of
stress between participants when disaggregated by gender, or role. However, Deputies and
Assistants reported higher levels of stress for internal issues such as “Mental health issues of
staff”, “Interpersonal conflicts” and “lack of autonomy/authority, probably reflecting their
job descriptions while principals were more stressed by the external pressure of “Government
initiatives”.
Differences in stressors by role
Government Initiatives
Principals’, deputy’s and assistants’ ratings were statistically significantly different F (2,113)
= 7.3, p = .001. Despite reaching statistical significance, the actual difference in mean scores
was quite small. The effect size, calculated using eta squared, was .03. Post hoc comparisons
using the Tukey HSD test indicated that the mean score for principals (M = 7.47, SD = 2.17)
was significantly higher than deputies (M = 6.57, SD = 2.56), but not significantly different
from assistants (M = 6.68, SD = 2.54). Deputies and assistants scores did not significantly
differ.
Mental Health Issues of Staff
Principals’, deputy’s and assistants’ ratings were statistically significantly different F (2,567)
= 3.44, p = .033. Despite reaching statistical significance, the actual difference in mean
scores was quite small. The effect size, calculated using eta squared, was .01. Post hoc
comparisons using the Tukey HSD test indicated that the mean score for principals (M =
4.64, SD = 2.62) did not significantly differ from deputies (M = 6.57, SD = 2.56) or assistants
(M = 6.68, SD = 2.54).
Lack of Autonomy/Authority
Principals’, deputy’s and assistants’ ratings were statistically significantly different F (2,92) =
6.922, p = .002. Despite reaching statistical significance, the actual difference in mean scores
was quite small. The effect size, calculated using eta squared, was .03. Post hoc comparisons
using the Tukey HSD test indicated that the mean score for principals (M = 3.60, SD = 2.52)
was significantly lower than deputies (M = 4.43, SD = 2.87) and assistants (M = 5.06, SD =
3.21). Deputies and assistants scores did not significantly differ.
Differences in stressors by school type
There are many differences in perceived stress when disaggregated by school type.
Composite/Area school participants reported significantly higher stress from “Resourcing
Needs”, “Expectations of the employer”,”Poorly Performing Staff”, “Mental Health Issues of
Students”, “Teacher Shortages”, “Mental Health Issues of Staff”, “Lack of
autonomy/authority”, “Inability to get away from school/community’ “Critical Incidents”,
28
“Declining Enrolments”, “Union/Industrial disputes”, “Complaints Management” and
“Interpersonal Conflicts”, when compared to their urban and rural colleages. This may reflect
the differences between schools who also have secondary level students but there is not
sufficient information from one round of data collection to make strong interpretations of
these differences. All other differences between school type are relatively small despite some
reaching statistical significance. This finding suggests that there are particular pressures faced
by Composite/Area schools that need attention of regulatory authorities. When read in
conjunction with the income statistics, it is likely that money is not a significant motivator for
principals, and this reflects previous research that suggests there is a ceiling effect of salary
that once achieved flattens out. Principals, are very motivated to do the right thing for the
students under their care and this is reflected in the levels of stress that directly relate to
procedures that prevent them from carrying out their mission of teaching and learning, due to
administrative requirements.
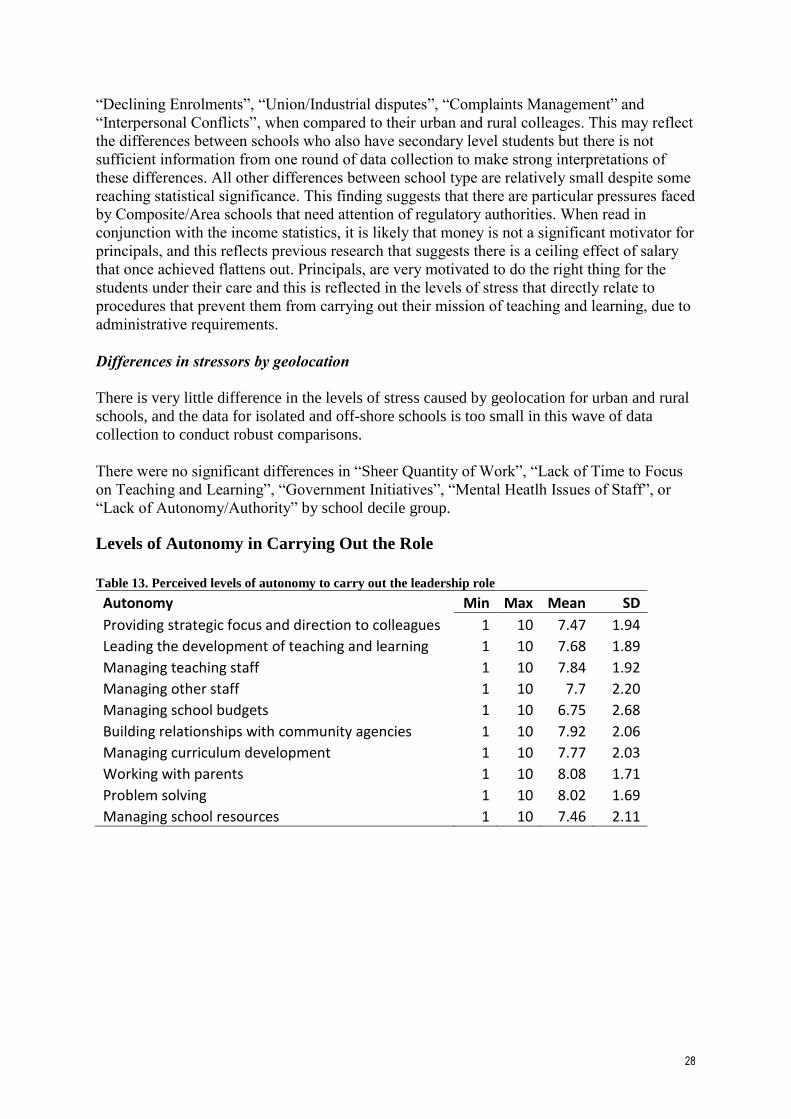
Differences in stressors by geolocation
There is very little difference in the levels of stress caused by geolocation for urban and rural
schools, and the data for isolated and off-shore schools is too small in this wave of data
collection to conduct robust comparisons.
There were no significant differences in “Sheer Quantity of Work”, “Lack of Time to Focus
on Teaching and Learning”, “Government Initiatives”, “Mental Heatlh Issues of Staff”, or
“Lack of Autonomy/Authority” by school decile group.
Levels of Autonomy in Carrying Out the Role
Table 13. Perceived levels of autonomy to carry out the leadership role
Autonomy Min Max Mean SD
Providing strategic focus and direction to colleagues 1 10 7.47 1.94
Leading the development of teaching and learning 1 10 7.68 1.89
Managing teaching staff 1 10 7.84 1.92
Managing other staff 1 10 7.7 2.20
Managing school budgets 1 10 6.75 2.68
Building relationships with community agencies 1 10 7.92 2.06
Managing curriculum development 1 10 7.77 2.03
Working with parents 1 10 8.08 1.71
Problem solving 1 10 8.02 1.69
Managing school resources 1 10 7.46 2.11

29
Figure 6. Perceived levels of autonomy to carry out the leadership role
Interpretation of Autonomy results
A one-way between groups analysis of variance (ANOVA) was conducted to explore the
differences in perceived levels of autonomy by role. Principals’, deputy’s and assistants’
ratings of their level of autonomy were statistically significantly different F (2,149) =
133.906, p <.001. The effect size of the difference, calculated using eta squared, was .37
(small). Post hoc comparisons using the Tukey HSD test indicated that the mean score for
principals (M = 83.34, SD = 10.96) was significantly higher than deputies (M = 62.72, SD =
16.8) and assistants (M = 60.19, SD = 12.5). Deputies and assistants scores did not
significantly differ from each other. There were no differences in perceived autonomy when
compared by gender, school location, school decile or school type.
Level of Confidence in Carrying Out Role
1
2
3
4
5
6
7
8
9
10
Rat
ing
/10
Autonomy
2016

30
Table 14. Perceived levels of confidence to carry out the leadership role
Confidence Min Max Mean SD
Providing strategic focus and direction to colleagues 1 10 8.18 1.56
Leading the development of teaching and learning 1 10 8.17 1.58
Managing teaching staff 1 10 8.26 1.49
Managing other staff 1 10 8.26 1.55
Managing school budgets 1 10 7.64 2.24
Building relationships with community agencies 1 10 8.39 1.53
Managing curriculum development 1 10 6.83 2.13
Working with parents 2 10 8.25 1.39
Problem solving 1 10 8.48 1.27
Managing school resources 1 10 6.94 2.18
Figure 7. Level of confidence to perform various leadership tasks
Interpretation of Confidence results
A one-way between groups analysis of variance (ANOVA) was conducted to explore the
differences in perceived levels of Confidence by role. Principals’, deputy’s and assistants’
ratings of their level of confidence were statistically significantly different F (2,558) =
12.743, p <.001. However, the effect size of the difference, calculated using eta squared, was
quite small .04. Post hoc comparisons using the Tukey HSD test indicated that the mean
score for principals (M = 80.88, SD = 10.99) was significantly higher than deputies (M =
0
1
2
3
4
5
6
7
8
9
10
Confidence
2016

31
77.19, SD = 12.18) and assistants (M = 71.61, SD = 15.39). Deputies and assistants scores
also significantly differed from each other, p = .004. There were no differences in perceived
confidence when compared by gender, school location, or school type.
Consistent with the Demand-Control literature (Philips & Sen, 2011; Wildy, Clarke, Styles &
Becioglu, 2010), principals’ and deputy/assistant principals level of confidence in carrying
out their duties is directly correlated to the level of perceived autonomy. Greater autonomy is
associated with higher levels of confidence to perform the tasks satisfactorily.
There were no significant differences between school decile groups.
Self-Rated Physical and Psychological Functioning
Self-rated scores on the following items were judged by level of agreement (1=strongly
disagree, 5 neutral, 10 strongly agree). Scales were then constructed to produce an overall
psychological health, overall depression about the job and overall worry about the use of
alcohol and/or drugs to manage stress, for easier comparison between groups.
Table 15. Self-rated physical and psychological functioning, plus mean annual medical checkups.
Self-Rated Score Min Max Mean SD
Overall I maintain a satisfactory level of fitness 1 10 5.23 2.92
Overall I maintain a healthy diet 1 10 6.24 2.54
Overall I maintain a healthy weight 1 10 5.16 2.88
Frequency of medical checkups (annually) 1 10 2.18 1.37
I am frequently depressed about my job 1 10 3.44 2.71
I am frequently depressed about my job at certain times of the year 1 10 4.17 2.96
I am worried about the way I use alcohol to manage my stress 1 10 2.37 2.33
I am worried about the way I use prescribed medication to manage my stress 1 10 1.43 1.45
Table 16. Self-rated psychological functioning
Self-Rated Score Min Max Mean Std. Dev.
Psychological Health 1 9.25 2.85 1.77
Depression 1 10 3.80 2.67
Alcohol and Medical Use 1 10 1.90 1.54
Table 17. Self-rated psychological functioning disaggregated by role
Self Rated Score Principal Deputy Assistant
Psychological Health 2.84 2.80 3.17
Depression 3.68 3.96 4.47
Alcohol and Medical Use 2.00 1.64 1.87

32
Figure 8. Self rated psychological functioning disaggregated by role
Table 18. Self rated psychological functioning disaggregated by gender
Self Rated Score Min Max Mean Std. Dev.
Psychological Health 1 9.25 2.85 1.77
Depression 1 10 3.80 2.67
Alcohol and Medical Use 1 10 1.90 1.54
Figure 9. Self rated psychological functioning disaggregated by Gender.
Table 19. Self rated psychological functioning disaggregated by School Type.
Self Rated Score Full Prim Contributing Comp/Area Special Intermediate
Psychological Health 2.90 2.73 4.14 2.63 3.07
Depression 3.91 3.64 5.23 3.18 4.02
0
1
2
3
4
5
6
Psychological Health Depression Alcohol and Medical Use
Psychological Self Ratings
Principal Deputy Assisstant
0
1
1
2
2
3
3
4
4
5
Psychological Health Depression Alcohol and Medical Use
Psychological Self ratings
Female Male

33
Alcohol and Medical Use 1.89 1.81 3.05 2.07 2.11
Figure 10. Self rated psychological functioning disaggregated by school type
Interpretation of self-rated psychological functioning
A one-way between groups analysis of variance (ANOVA) was conducted to explore the
differences in perceived levels of psychological health by Location. Scores were statistically
significantly different F (3,568) = 4.52, p =.004. The effect size of the difference, calculated
using eta squared, was very small .02. Post hoc comparisons using the Tukey HSD test
indicated that the mean score for urban particpants (M = 2.69, SD = 1.68) was significantly
higher than their colleagues in isolated schools (M = 4.36, SD = 1.85) and approached
significance for rural participants (p=.052; M = 3.10, SD = 1.87). Other scores did not
significantly differ from each other. There were no differences in perceived autonomy when
compared by gender, role, or school decile or type.
Sources of Support
Participants responded “yes” or “no” to each support person by type. There was no limit to
the number of supporter types for any individual.
Table 20. Sources of support for all participants shown as percentage of participants who report being
supported by each support person.
%
Partner 84.12
Friend 69.63
Family member 54.28
Colleague in your workplace 64.92
School leader/colleague – professional relationship 62.83
School leader/colleague also a friend 50.79
0.00
1.00
2.00
3.00
4.00
5.00
6.00
Psychological Health Depression Alcohol and Medical Use
Psychological Self Ratings
Full Prim Contributing Comp/Area Special Intermediate

34
Supervisor/Line manager 1.92
Department/Employer 4.01
Professional Association 16.58
Medical Practitioner 10.47
Psychologist /Counsellor 5.58
Figure 11. Sources of support for all participants
0
10
20
30
40
50
60
70
80
90
Per
cen
t
Sources of Support
35
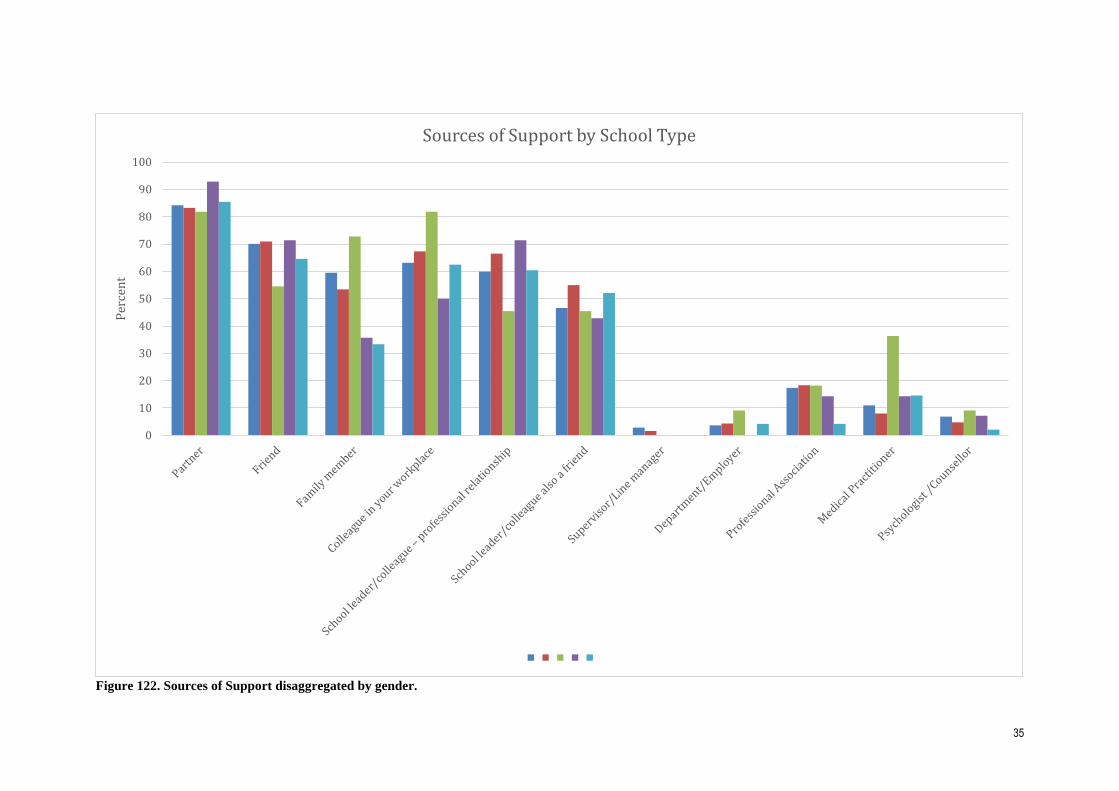
Figure 122. Sources of Support disaggregated by gender.
0
10
20
30
40
50
60
70
80
90
100
Per
cen
t
Sources of Support by School Type

36
Interpretation of Sources of Support Results
Despite the logic of grouping support sources for comparison, it was found that each support
source is unrelated statistically to any other support source, in common with both the
Australian and Irish principals. Therefore, it is not practical to create higher order factors for
comparison. However, the tables and graphs show large differences in support when
disaggregated in various ways shown above. The types of support vary but the overall level
of support is relatively similar for each group.
Geolocation
Not surprisingly, isolated and off-shore school participants rely more on partners and family
members than colleagues in the workplace. Rural schools also show this trend but to a lesser
extent.
Gender
As with both the Australian and Irish surveys there are some specific gender differences
which probably relate to more general trends in society than the job itself. More men report
support from their partners than women but less from other family members and friends
Role
The major difference here is the level of support by professional associations with more
principals than deputies or assistants receiving it
School Type and Decile
The results for school type and need further examination, as no logical patterns emerge from
these data.

37
COPSOQ-II Subscale Scores The Copenhagen PsychoSocial Questionnaire – II (COPSOQ-II: Pejtersen, Kristensen, Borg,
& Bjorner, 2010) was developed in response to the need for a validated and standardized
instrument that would accurately measure a broad range of psychosocial factors across many
occupations. It has seven scales, each containing between 4-8 subscales. In most cases high
levels are healthy. The exceptions are Amount of Work, Work Pace, Emotional Demands,
Hiding Emotions, Role Conflicts, Job Insecurity, Work-Family Conflict, Family-Work
Conflict, Burnout, Stress, Sleeping Problems, Depressive Symptoms, Physical Symptoms of
Stress, and Cognitive Stress.
Table 2121. Copenhagen Psychosocial Questionnaire-II subscale scores
Scale Subscale Irish Aust New Zealand
Pop* 2014 2015 Min Max Mean SD
Demands at Work
Quantitative demands 40.2 63 57 0 100 61 20 Work pace 59.5 71 67 8 100 69 18 Cognitive demands 63.9 82 82 38 100 81 13 Emotional demands 40.7 68 70 13 100 67 16 Demands for hiding emotions 50.6 84 84 33 100 82 15
Work Organisation & Job Contents
Influence 49.8 55 63 0 100 61 17 Possibilities for development 65.9 79 84 31 100 83 14 Variation 60.4 65 66 13 100 69 15 Meaning of work 73.8 85 86 8 100 85 14 Commitment to the workplace 60.9 72 71 0 100 71 20
Interpersonal Relations & Leadership
Predictability 57.7 66 64 0 100 66 22 Recognition (Reward) 66.2 75 68 0 100 73 22 Role clarity 73.5 75 80 0 100 79 19 Role conflicts 42 50 49 0 100 44 21 Quality of leadership 55.3 46 54 0 100 55 23 Social support from colleagues: Inside school 57.3 54 59 0 100 58 19 Social support from colleagues: Outside school 53 53 0 100 51 22 Social support from supervisor 61.6 53 51 0 100 54 24 Social community at work 78.7 81 77 0 100 79 16
Work - Individual Interface
Job satisfaction 65.3 69 76 0 100 72 19 Work–family conflict 33.5 72 69 0 100 73 23 Family–work conflict 7.6 10 10 0 100 8 17
Values at the Workplace
Trust regarding management 67 83 74 0 100 78 16 Mutual trust between employees 68.6 75 71 0 100 74 19 Justice 59.2 76 72 0 100 71 18 Social inclusiveness 67.5 76 74 0 100 81 19
Health & Wellbeing
Self-rated health 66 62 61 0 100 65 23
Burnout 34.1 60 54 6 100 58 22
Stress 26.7 51 46 0 100 48 21
Sleeping troubles 21.3 47 47 0 100 50 26
Depressive symptoms 21 33 28 0 100 29 20
Somatic stress symptoms 17.8 25 22 0 75 24 17
Cognitive stress symptoms 17.8 33 28 0 100 31 20
Self-efficacy 67.5 65 72 28 100 74 15 *Population Scores (Pejtersen, et al, 2010)

38
Copenhagen PsychoSocial Questionnaire – II
Demands at work
International Trends
0
10
20
30
40
50
60
70
80
90
100
Quantitative demands Work pace Cognitive demands Emotional demands Demands for hidingemotions
Demands at Work
New Zealand Australia Ireland Population

39
2016 Data in Detail
Scale Subscales Population Critical NZ Location Role Gender School Type
Value Off Full Comp
M SD Low High ALL Urban Rural Isolated Shore Prin Dep Ass F M Prim Contrib Area Special Inter
Demands at Work Quantitative demands 40.20 20.50 29.95 50.45 60.65 59.09 63.87 59.03 65.63 61.50 58.66 57.26 61.00 59.86 59.94 60.72 64.20 58.04 64.36
Work pace 59.50 19.10 49.95 69.05 68.63 67.64 70.26 76.85 66.67 69.71 66.23 66.13 69.28 67.14 67.61 69.11 63.64 64.88 72.87
Cognitive demands 63.90 18.70 54.55 73.25 81.39 80.70 82.51 86.81 84.38 82.73 79.35 74.60 81.15 81.93 81.76 80.97 78.98 75.89 84.18
Emotional demands 40.70 24.30 28.55 52.85 66.76 66.30 67.62 69.44 62.50 67.70 65.09 61.09 66.61 67.11 67.43 65.14 74.43 63.84 70.48
Demands for hiding emotions 50.60 20.80 40.20 61.00 82.26 81.44 83.65 88.89 79.17 82.65 81.73 80.91 82.13 82.57 82.86 81.29 93.94 80.95 81.91
*Mean ±.5SD
Quantitative demands deal with how much one has to achieve in one’s work. They can be assessed as an incongruity between the
amount of tasks and the time available to perform the tasks in a satisfactory manner.
Work pace deals with the speed at which tasks have to be performed. It is a measure of the intensity of work.
Cognitive demands deal with demands involving the cognitive abilities of the worker. This is the only subscale of Demands where
higher scores are better.
Emotional demands occur when the worker has to deal with or is confronted with other people’s feelings at work. Other people
comprise both people not employed at the work place, e.g. parents and students, and people employed at the work place, like colleagues,
superiors or subordinates.
Demands for hiding emotions occur when principals have to conceal her or his own feelings at work from other people. Other people
comprise both people not employed at the work place, e.g. parents and students, and people employed at the work place, like colleagues,
superiors or subordinates. The scale shows the amount of time individuals spend in surface acting (pretending an emotion that is not felt)
or down-regulating (hiding) felt emotions.
Results
Trends All demands experienced by principals in New Zealand are very similar to their Australian and Irish colleagues, above the
critical high value indicating the demands are higher than the general population.
Quantitative demands No significant differences were reported for any of the comparison groups.
Work pace No significant differences were reported for any of the comparison groups.
Cognitive demands All groups exceeded the critical high score indicating that the role provides significantly high levels of cognitive
demands. This is a positive finding. Principals scores were statistically significantly higher than deputies and assistants.
Emotional demands the high scores confirm the role is highly emotionally charged in school types.
Demands for hiding emotions the high scores confirm the role requires a great deal of skill in dealing with one’s own and others
emotions in all school types.

40
International Trends
0
10
20
30
40
50
60
70
80
90
100
Influence Possibilities for development Variation Meaning of work Commitment to the workplace
Work Organisation & Job Contents
New Zealand Australia Ireland Population

41
2016 Data in detail
Scale Subscales Population Critical NZ Location Role Gender School Type
Value Off Full Comp
M SD Low High ALL Urban Rural Isolated Shore Prin Dep Ass F M Prim Contrib Area Special Inter
Work Organisation & Job Contents
Influence 49.80 21.20 39.20 60.40 60.58 61.38 59.05 58.33 59.38 64.26 53.43 48.59 59.52 62.96 59.22 61.55 59.66 64.29 60.90
Possibilities for development 65.90 17.60 57.10 74.70 82.88 83.00 82.65 81.94 84.38 85.05 77.96 77.02 83.87 80.64 82.01 83.66 86.36 83.48 82.31
Variation 60.40 21.40 49.70 71.10 68.51 69.00 67.79 63.89 62.50 69.32 66.94 67.34 69.53 66.21 68.67 68.42 70.45 70.54 67.29
Meaning of work 73.80 15.80 65.90 81.70 85.05 85.20 84.84 80.56 95.83 86.54 81.30 82.80 85.48 84.10 85.34 85.14 85.61 88.10 82.09
Commitment to the workplace 60.90 20.40 50.70 71.10 70.64 72.17 68.13 56.25 78.13 72.71 65.56 67.74 71.12 69.57 69.13 71.71 72.16 79.02 69.95
*Mean ±.5SD
Influence at work deals with the degree to which the employee can influence aspects of work itself, ranging from planning of work to
the order of tasks.
Possibilities for Development assesses if the tasks are challenging for the employee and if the tasks provide opportunities for learning
and thus opportunities for development not only in the job but also at the personal level. Lack of development can create apathy,
helplessness and passivity.
Variation of work deals with the degree to which work (tasks, work process) is varied, that is if tasks are or are not repetitive.
Meaning of Work concerns both the meaning of the aim of work tasks and the meaning of the context of work tasks. The aim is
“vertical”: that the work is related to a more general purpose, such as providing students with a good education. Context is “horizontal”:
that one can see how ones’ own work contributes to the overall product of the organisation.
Commitment to the Workplace deals with the degree to which one experiences being committed to ones’ workplace. It is not the work
by itself or the work group that is the focus here, but the organization in which one is employed.
Results
Trends All demands experienced by principals in New Zealand are very similar to their Australian and Irish colleagues, with many
scores well above the critical high value indicating the demands are higher than the general population.
Influence at work Principals report significantly more influence than either deputies or assistants. Males report statistically significantly
higher scores than females. Decile groups 6 and 7 report significantly less influence than the colleagues in other decile groups.
Possibilities for Development All groups’ average scores are above the critical high score indicating they have noticeably more
possibilities for developing than the general population. Principals report significantly higher scores than either deputies or assistants.
Males report statistically significantly higher scores than females.

42
Variation All groups were within half of one standard deviation of the general population suggesting their work is not noticeably more
or less varied than the general population. Males report statistically significantly higher scores than females.
Meaning of Work All groups report high average scores on this dimension. They therefore get noticeably more meaning from their work
than the general population. Principals report significantly higher scores than either deputies, but not assistants.
Commitment to the Workplace Principals report significantly higher scores than either deputies, but not assistants.
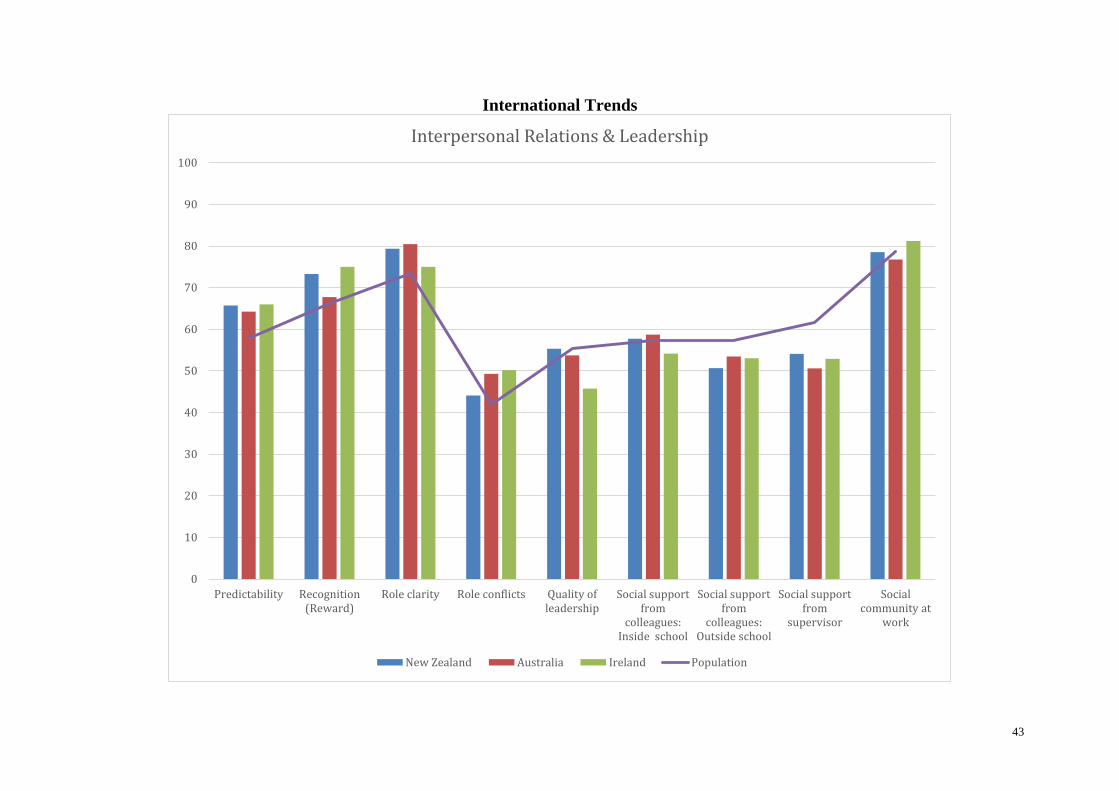
43
International Trends
0
10
20
30
40
50
60
70
80
90
100
Predictability Recognition(Reward)
Role clarity Role conflicts Quality ofleadership
Social supportfrom
colleagues:Inside school
Social supportfrom
colleagues:Outside school
Social supportfrom
supervisor
Socialcommunity at
work
Interpersonal Relations & Leadership
New Zealand Australia Ireland Population

44
2016 Data in Detail
Scales Subscales Population Critical NZ Location Role Gender School Type
Value Off Full Comp
M SD Low High ALL Urban Rural Isolated Shore Prin Dep Ass F M Prim Contrib Area Special Inter
Interpersonal Relations & Leadership
Predictability 57.70 20.90 47.25 68.15 65.75 65.63 66.04 65.63 62.50 68.49 60.28 60.08 65.40 66.55 64.41 67.12 65.91 68.27 64.36
Recognition (Reward) 66.20 19.90 56.25 76.15 73.28 73.40 73.80 62.04 54.17 76.88 65.80 61.83 72.28 75.52 73.09 73.59 75.76 82.14 70.21
Role clarity 73.50 16.40 65.30 81.70 79.36 79.42 79.03 82.41 83.33 83.74 70.49 67.47 79.28 79.52 78.54 80.19 80.30 85.71 77.13
Role conflicts 42.00 16.60 33.70 50.30 44.12 43.42 45.16 56.94 25.00 44.64 43.52 40.73 43.30 45.96 44.24 42.87 61.36 43.30 46.14
Quality of leadership 55.30 21.10 44.75 65.85 55.35 56.20 53.75 58.10 28.13 56.25 53.84 50.60 55.75 54.46 54.63 55.92 48.86 62.50 56.60
Social support from colleagues: Inside school*
57.30 19.70 47.45 67.15 57.72 59.07 55.77 46.30 33.33 57.06 59.07 57.80 58.97 54.90 57.82 57.83 54.55 57.14 57.62
Social support from colleagues: Outside school*
57.30 19.70 47.45 67.15 50.66 50.11 52.11 49.07 29.17 54.71 42.72 37.37 51.85 48.00 51.67 50.74 44.70 50.00 47.16
Social support from supervisor 61.60 22.40 50.40 72.80 54.11 55.15 52.84 43.52 25.00 55.05 52.13 51.44 54.42 53.40 53.51 54.20 59.85 64.88 52.59
Social community at work 78.70 18.90 69.25 88.15 78.55 78.57 78.75 74.07 75.00 80.39 74.88 74.46 78.45 78.76 79.17 78.41 68.94 81.55 77.72
*Mean ±.5SD
Predictability deals with the means to avoid uncertainty and insecurity. This is achieved if employees receive the relevant information at
the right time.
Recognition (Reward) deals with the recognition by the management of your effort at work.
Role Clarity deals with the employee's understanding of her or his role at work, e.g., content of tasks, expectations to be met and her or
his responsibilities.
Role Conflicts stem from two sources. The first source is about possible inherent conflicting demands within a specific task. The second
source is about possible conflicts when prioritising different tasks.
Quality of Leadership deals with the next higher managers’ leadership in different contexts and domains. For many principals this is a
regional leader, but may be interpreted by some as school board chairperson, particularly in the independent sector.
Social support from colleagues inside and outside the school deals with principals’ impressions of the possibility to obtain support
from colleagues if one should need it.
Social community at work concerns whether there is a feeling of being part of the group of employees at the workplace, e.g. if
employees relations are good and if they work well together.

45
Results
Trends New Zealand principals report significantly higher recognition than Australian principals and significantly lower role conflicts
than either their Australian and Irish colleagues
Predictability Only Special school participants reported average scores above the critical high score suggesting noticeably higher levels
of work predictability than the general population. Principals report significantly more predictability than deputies and assistant
principals.
Recognition (Reward) Only Special school participants reported average scores above the critical high score suggesting noticeably
higher levels of recognition than the general population. Principals report significantly more influence than assistants and deputies.
Role Clarity Isolated, Off-shore, Principals and Special School leaders reported noticeably higher levels of role clarity. Principals report
significantly more influence than either deputies or assistants.
Role Conflicts The groups who report on average noticeably higher levels of role conflict than the general population are Isolated and
Composite/Area leaders.
Quality of Leadership No group reported the quality of leadership (that they report to) as being noticeably different from the general
population. However, there were some significant differences within groups. Decile group 3 was significantly lower than Decile group 10
Social support from colleagues inside the school is reported at levels very close to the general population. Females report statistically
significantly higher scores than males.
Social support from colleagues outside the school is reported at levels very close to the general population. Principals report
significantly higher scores than either deputies or assistants. Females report statistically significantly higher scores than males.
Social community at work is also reported at levels very close to the general population. Principals report significantly more higher
scores than deputies but not assistant principals.

46
Work-individual Interface International Trends
0
10
20
30
40
50
60
70
80
90
100
Job satisfaction Work–family conflict Family–work conflict
Work-Individual Interface
New Zealand Australia Ireland Population

47
2016 Data in Detail
Scales Subscales Population Critical NZ Location Role Gender School Type
Value Off Full Comp
M SD Low High ALL Urban Rural Isolated Shore Prin Dep Ass F M Prim Contrib Area Special Inter
Work - Individual Interface
Job satisfaction 65.30 18.20 56.20 74.40 72.48 73.99 69.52 68.54 79.18 74.30 67.73 69.11 72.92 71.49 70.85 73.48 70.47 81.56 73.56
Work–family conflict 33.50 24.30 21.35 45.65 73.11 71.10 76.75 82.42 75.01 73.41 71.67 71.78 74.54 69.91 73.61 71.90 84.85 65.48 76.09
Family–work conflict 7.60 15.30 -0.05 15.25 8.45 8.35 8.33 14.82 8.33 8.31 8.27 9.14 7.11 11.42 9.28 7.69 6.06 14.28 7.24
*Mean ±.5SD
Job satisfaction deals with principals’ experience of satisfaction with various aspects of work.
Work-family conflict deals with the possible consequences of work on family/personal life. The focus is on two areas, namely conflict
regarding energy (mental and physical energy) and conflict regarding time.
Family-work conflict deals with the possible consequences of family/personal life on work. The focus is on two areas, namely conflict
regarding energy (mental and physical energy) and conflict regarding time.
Results
Trends New Zealand principals’ results are very similar to their Australian and Irish colleagues.
Job satisfaction Special school principals report the highest level of job satisfaction. Principals report significantly higher scores than
deputies but not assistant principals.
Work-family conflict is far too high, at 2.2 times the rate of the general population. Every group score is well above one standard
deviation higher than the general population rate. This result has serious implications for the long-term future of school leaders as their
work is creating significant family stress. This finding should be cause considerable concern for policy makers, as it relates directly to the
Quantitative Demands of the role. Females report statistically significantly higher scores than males.
Family-work conflict School leaders average scores are at the general population levels. Males report statistically significantly higher
scores than females.

48
Values at the Workplace International Trends
0
10
20
30
40
50
60
70
80
90
100
Trust regarding management Mutual trust between employees Justice Social inclusiveness
Values at the Workplace
New Zealand Australia Ireland Population

49
2016 Data in Detail
Scales Subscales Population Critical NZ Location Role Gender School Type
Value Off Full Comp
M SD Low High ALL Urban Rural Isolated Shore Prin Dep Ass F M Prim Contrib Area Special Inter
Values at the Workplace
Trust regarding management 67.00 17.70 58.15 75.85 78.11 77.73 78.80 78.01 85.42 81.70 70.32 70.21 77.74 78.93 77.61 79.01 69.13 81.70 77.40
Mutual trust between employees 68.60 16.90 60.15 77.05 74.19 74.34 73.85 77.08 62.50 77.67 68.02 66.36 73.70 75.30 74.78 74.59 68.33 68.75 73.02
Justice 59.20 17.70 50.35 68.05 71.40 70.35 73.44 75.69 62.50 76.55 60.63 58.26 70.52 73.37 71.40 71.70 64.20 76.79 70.65
Social inclusiveness 67.50 16.30 59.35 75.65 81.27 81.20 80.95 92.86 81.25 83.28 77.25 75.89 81.85 79.99 81.91 81.45 78.98 75.45 80.25
*Mean ±.5SD
Trust regarding management (Vertical Trust) deals with whether the employees can trust the management and vice versa. Vertical
trust can be observed in the communication between the management and the employees.
Mutual Trust between Employees (Horizontal trust) deals with whether the employees can trust each other in daily work or not. Trust
can be observed in the communication in the workplace; e.g. if one freely can express attitudes and feelings without fear of negative
reactions.
Justice deals with whether workers are treated fairly. Four aspects are considered: First the distribution of tasks and recognition, second
the process of sharing, third the handling of conflicts and fourth the handling of suggestions from the employees.
Social Inclusiveness deals with another aspect of organizational justice: how fairly people are treated in the workplace in relation to their
gender, race, age and ability.
Results
Trends All scores reported by principals in New Zealand are very similar to their Australian and Irish colleagues, with many scores well
above the critical high value indicating a more collaborative and just working environment than the general population. However, there
may be a disconnection between Principals views and those of Deputies and Assistants.
Trust regarding management (Vertical Trust) Principals report significantly higher scores than either deputies or assistants.
Mutual Trust between Employees (Horizontal trust) Principals report significantly more higher scores than deputies but not assistant
principals.
Justice Principals report significantly more higher scores than deputies and assistant principals. Males report statistically significantly
higher scores than females.

50
Social Inclusiveness All groups report noticeably higher levels of Social Inclusiveness than the general population. This implies that on
average schools remain noticeably more welcoming of differences than the norm. Principals report significantly more higher scores than
deputies but not assistant principals.

51
Health and WellbeingInternational Trends
0
10
20
30
40
50
60
70
80
90
100
Self-rated health Burnout Stress Sleeping troubles Depressivesymptoms
Somatic stresssymptoms
Cognitive stresssymptoms
Self-efficacy
Health &Wellbeing
New Zealand Australia Ireland Population

52
2016 Data in Detail
Scales Subscales Population Critical NZ Location Role Gender School Type
Value Off Full Comp
M SD Low High ALL Urban Rural Isolated Shore Prin Dep Ass F M Prim Contrib Area Special Inter
Health & Wellbeing Self-rated health 66.00 20.90 55.55 76.45 64.56 65.73 62.09 63.89 75.00 63.54 67.59 67.74 65.79 61.78 63.58 65.06 54.55 64.29 69.57
Burnout 34.10 18.20 25.00 43.20 58.16 55.73 62.36 72.22 65.63 58.07 57.04 57.66 59.43 55.32 59.65 57.66 60.80 49.55 54.76
Stress 26.70 17.70 17.85 35.55 47.88 46.24 50.86 57.64 37.50 46.97 49.03 50.00 48.82 45.76 49.02 46.76 52.84 40.63 48.51
Sleeping troubles 21.30 19.00 11.80 30.80 50.37 47.98 54.50 66.67 43.75 50.52 50.00 46.98 51.79 47.16 50.77 50.40 67.05 50.45 43.34
Depressive symptoms 21.00 16.50 12.75 29.25 28.57 27.05 31.25 36.11 34.38 28.34 27.36 34.07 29.03 27.55 29.73 27.23 36.36 29.91 27.85
Somatic stress symptoms 17.80 16.00 9.80 25.80 23.73 22.68 25.41 35.42 12.50 23.34 23.94 25.40 25.50 19.76 24.41 23.44 23.86 15.63 23.23
Cognitive stress symptoms 17.80 15.70 9.95 25.65 31.17 30.36 32.49 39.58 25.00 31.12 29.95 33.67 31.33 30.82 31.40 30.97 41.48 24.55 30.84
Self-efficacy 67.50 16.00 59.50 75.50 73.98 75.40 71.04 74.09 75.00 74.83 72.44 69.01 74.33 73.20 72.81 75.07 73.24 75.81 73.33
*Mean ±.5SD
General health is the person's assessment of her or his own general health. It is one global item, which has been used in numerous
questionnaires, and has been shown to predict many different endpoints including mortality, cardiovascular diseases, hospitalizations, use
of medicine, absence, and early retirement (Idler & Benyamini, 1997).
Burnout concerns the degree of physical and mental fatigue/exhaustion of the employee.
Stress is defined as a reaction of the individual, a combination of tension and unwillingness. As elevated stress levels over a longer
period are detrimental to health, it is necessary to determine long-term, or chronic stress.
Sleeping troubles deal with sleep length, determined by e.g. sleeping in, waking up, interruptions and of quality of sleep.
Somatic stress is defined as a physical health indicator of a sustained stress reaction of the individual.
Cognitive stress deals with cognitive indicators of a sustained stress reaction of the individual.
Depressive symptoms cover various aspects, which together indicate depression.
Self-efficacy is the extent of one’s belief in one’s own ability to complete tasks and reach goals. Here self-efficacy is understood as
global self-efficacy not distinguishing between specific domains of life.

53
Results
Trends New Zealand’s principals’ self-rated health is similar to the general population and Australian and Irish principals. This is despite
the fact that school leaders have all the attributes of a work group that should exceed the average. They come from stable families, are in
stable families, are well educated and well paid relative to the general population. Yet this is not reflected in their health scores.
General health Females report statistically significantly higher scores than males.
Burnout school leaders report 1.7 times the rate of burnout compared to the general population. Urban leaders report significantly lower
rates of burnout. Females report statistically significantly higher scores than males.
Stress is reported at 1.8 times the general population rate.
Sleeping troubles is reported at 2.4 times the general population rate. Chronic sleep deprivation predicts a number of long-term health
issues, including memory difficulties, obesity and depression. Urban leaders report significantly lower rates of sleeping difficulties.
Females report statistically significantly higher scores than males.
Somatic stress is reported at 1.4 times the general population rate. Females report statistically significantly higher scores than males.
Cognitive stress school leaders report 1.8 times the rate of Cognitive Stress compared to the general population.
Depressive symptoms are reported for school leaders at 1.8 times the rate of the general population.
Self-efficacy school leaders report 1.1 times the level of self-efficacy compared to the general population. Urban leaders report
significantly higher levels.

54
Assessment of Quality of Life
Note these figures are psychometric weighted utility scores, not econometric. For more
information on the construction of the instrument and population norms (currently under
construction) please visit http://www.aqol.com.au/choice-of-aqol-instrument/58.html.
Table 22 Assessment of Quality of Life (AQoL-8D) mean scores by subscales and super-dimensions
Population New Zealand
Total 91.97 93.3
Subscales Independent Living 91.97 93.3
Happiness 70.00 72.91
Mental Health 71.03 76.08
Coping 68.76 74.92
Relationships 82.10 84.85 Self Worth 77.53 81.71
Pain 82.18 84.5
Senses 81.97 87.79 Super Dimensions Physical 86.45 89.41
PsychoSocial 74.39 78.48
Figure 13. Assessment of Quality of Life (AQoL-8D) mean scores by subscales and super-dimensions
0.00
10.00
20.00
30.00
40.00
50.00
60.00
70.00
80.00
90.00
100.00
Assessment of Quality of Life - 8D

55
Interpretation: Assessment of Quality of Life.
Differences by Geolocation
A one-way between groups analysis of variance (ANOVA) was conducted to explore the
differences in Quality of Life super dimensions by geolocation. One statistically significant
difference was found for the psychosocial super dimension F (3,561) = 6.139, p < .001.
Despite reaching statistical significance, the actual difference in mean scores was quite small.
The effect size, calculated using eta squared, was .03. Post hoc comparisons using the Tukey
HSD test indicated that the mean score for Urban participants (M = 75.88, SD = 9.51) was
significantly higher than their Rural colleagues (M = 71.67, SD = 12.62).
Differences in prevalence by Role
No differences found.
Differences in prevalence by Gender
No differences found.
Differences in prevalence by school type
No differences found.
Differences in prevalence by school decile group
No differences found.
Positive and Negative Affect Scale (PANAS)
This brief scale is one of the most widely used self-report measures of individual’s positive
and negative activation, developed by Watson, Clark, and Tellegen (1988). PA measures
positive engagement with the environment and NA measures subjective distress and
unpleasurable engagement. Enthusiasm and alertness are indicative of high PA, lethargy and
sadness characterize low PA (Crawford & Henry, 2004).
PANAS Population* New Zealand
Mean SD Range Mean SD Range
Total PA 31.31 7.65 10-50 36.63 6.08 11-50
NA 16 5.9 10-42 19.25 6.64 10-47
Female PA 30.62 7.89 10-50 37.05 6.02 11-50
NA 16.68 6.37 10-42 19.14 6.44 10-44 Male PA 32.06 7.31 10-48 35.64 6.11 16-50
NA 15.2 5.23 10-42 19.51 7.1 10-47
*Crawford & Henry (2004) PA= Positive Affect; NA= Negative Affect
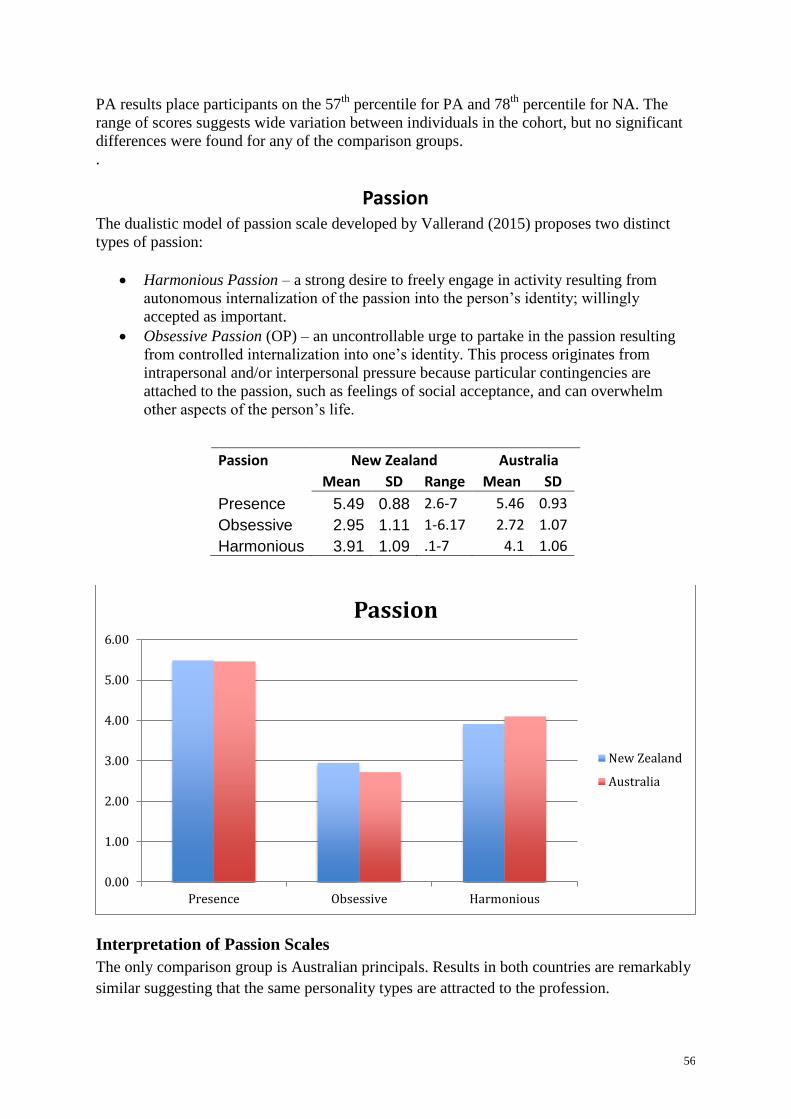
56
PA results place participants on the 57th
percentile for PA and 78th
percentile for NA. The
range of scores suggests wide variation between individuals in the cohort, but no significant
differences were found for any of the comparison groups.
.
Passion The dualistic model of passion scale developed by Vallerand (2015) proposes two distinct
types of passion:
Harmonious Passion – a strong desire to freely engage in activity resulting from
autonomous internalization of the passion into the person’s identity; willingly
accepted as important.
Obsessive Passion (OP) – an uncontrollable urge to partake in the passion resulting
from controlled internalization into one’s identity. This process originates from
intrapersonal and/or interpersonal pressure because particular contingencies are
attached to the passion, such as feelings of social acceptance, and can overwhelm
other aspects of the person’s life.
Passion New Zealand Australia
Mean SD Range Mean SD
Presence 5.49 0.88 2.6-7 5.46 0.93
Obsessive 2.95 1.11 1-6.17 2.72 1.07
Harmonious 3.91 1.09 .1-7 4.1 1.06
Interpretation of Passion Scales
The only comparison group is Australian principals. Results in both countries are remarkably
similar suggesting that the same personality types are attracted to the profession.
0.00
1.00
2.00
3.00
4.00
5.00
6.00
Presence Obsessive Harmonious
Passion
New Zealand
Australia

57
Differences in passion by Geolocation
A one-way between groups analysis of variance (ANOVA) was conducted to explore the
differences in Passion by Geolocation. Only one statistically significant difference was found.
This was for Harmonious Passion F (3,636) = 3.839, p = .01. Despite reaching statistical
significance, the actual difference in mean scores was quite small. The effect size, calculated
using eta squared, was .02. Post hoc comparisons using the Tukey HSD test indicated that the
mean score for Urban participants (M = 3.98, SD = 1.08) was significantly lower than their
Rural colleagues (M = 3.73, SD = 1.07).
Differences in prevalence by Role
Only one statistically significant difference was found. This was for the Presence of Passion
F (2,571) = 5.321, p = .005. Despite reaching statistical significance, the actual difference in
mean scores was quite small. The effect size, calculated using eta squared, was .02. Post hoc
comparisons using the Tukey HSD test indicated that the mean score for principals (M =
5.59, SD = .82) was significantly higher than deputies (M = 5.33, SD = .93), but not from
assistants (M = 5.36, SD = .99).
Differences in prevalence by Gender
An independent samples t-test was conducted to compare differences in passion for female
and male participants. There was a statistically significant difference in scores for Passion
Presence (females, M = 5.54, SD = .88; males, M = 5.34, SD = .84) t (665) = 2.72, p = .007.
The effect size of the difference, calculated using eta squared, was .08, representing a
moderate difference. There was also a significant difference for Obsessive Passion (females,
M = 3.0, SD = 1.11; males, M = 2.81, SD = 1.08) t (664) = 2.098, p = .037. The effect size of
the difference, calculated using eta squared, was .08, representing a moderate difference.
Differences in prevalence by school type
A one-way between groups analysis of variance (ANOVA) was conducted to explore the
differences in Passion by School Type. One statistically significant difference was found for
Obsessive Passion F (4,625) = 3.170, p = .014. The effect size, calculated using eta squared,
was small (.02). Post hoc comparisons using the Tukey HSD test indicated that the mean
score for composite/area schools (M = 3.81, SD = 1.45) was significantly higher than full
primary (M = 2.95, SD = 1.10) and contributing primary (M = 2.85, SD = 1.04).

58
Social Capital
Introduction
The following pages report on the construction of the metascale Social Capital. This has been constructed from the COPSOQ-II scales Trust in
Management (also known as Vertical Trust), Social Community at Work (also known as Horizontal Trust) and Justice. Together they represent
the level of Social Capital in each school. The Cronbach alpha reported for the whole scale is .88 suggesting the scale is robust. Results for this
metascale are reported in the same way as the previous scales.
2016 Data in Detail
Scale New Zealand Location Role Gender School Type
Off
Full
Comp/
Mean SD Urban Rural Isolated Shore Prin Dep Ass F M Prim Contrib Area Special Inter
Social Capital 76 14.07 75.53 77.00 75.93 74.31 79.55 68.61 67.36 75.55 77.02 76.03 76.37 67.42 80.01 75.26
Geolocation No significant differences exist.
Role Principals perceive significantly higher levels of social capital than either deputies or assistants.
Gender No significant differences exist.
School Type No significant differences exist.
The most interesting findings here relate to the spread of results across schools and the correlations with both positive and negative aspects of
worklife. Social capital is correlated with increased perceptions job satisfaction, general health, confidence, autonomy, increased hours at work
during term time, decreased hours at work during holidays and harmonious passion. Social capital is also correlated with decreased perceptions
of quantitative and emotional demands, work-family conflict, stress, burnout, cognitive and somatic stress symptoms, sleeping difficulties and
depressive symptoms.
The social capital results are consistent with a great deal of literature from both inside and outside the education sector. The clear message from
these results is for investment in people at all levels of the system. Building social capital will enhance all school functioning and produce a
healthier, and happier workforce.

59
References Antonio, D. M. S., & Salzfass, E. A. (2007). How we treat one another in school. Educational Leadership, 64(8), 32-38.
Brotheridge, C. M., & Lee, R. T. (2003). Development and validation of the Emotional Labour Scale. Journal of
Occupational and Organizational Psychology, 76(3), 365-379. doi:
http://dx.doi.org/10.1348/096317903769647229
Caruso, C. C., Hitchcock, E. M., Dick, R. B., Russo, J. M., & Schmit, J. M. (2004). Overtime and extended work shifts:
Recent findings on illnesses, injuries, and health behaviors. Cincinnati: U. S. Department of Health and Human
Services, Centers for Disease Control and Prevention, National Institute for Occupational Safety and Health.
Cummins, R. A., Eckersley, R., Pallant, J., vanVugt, J., & Misajon, R. (2003). Developing a national index of subjective
wellbeing: The Australian Unity Wellbeing Index. Social Indicators Research, 64(2), 159-190.
Dake, J. A., Price, J. H., Telljohann, S. K., Dake, J. A., Price, J. H., & Telljohann, S. K. (2003). The nature and extent of
bullying at school. Journal of School Health, 73(5), 173-180.
de Wet, C. (2010). The reasons for and the impact of principals and deputy/assistant principal-on-teacher bullying on the
victims' private and professional lives. [doi: DOI: 10.1016/j.tate.2010.05.005]. Teaching and Teacher Education,
26(7), 1450-1459.
Department of Education & Training. (2004). The privilege and the price: A study of principals and deputy/assistant
principals class workload and its impact on health and wellbeing. Melbourne: Department of Education and
Training.
Espelage, D., Anderman, E. M., Brown, V. E., Jones, A., Lane, K. L., McMahon, S. D., et al. (2013). Understanding and
preventing violence directed against teachers: Recommendations for a national research, practice, and policy
agenda. American Psychologist, advance on-line publication.
Hargreaves, A. (2013). The day of judgement. In M. Newberry, A. Gallant & P. Riley (Eds.), Emotion in schools:
Understanding how the hidden curriculum influences teaching, learning and social relationships (Vol. 18, pp. xv-
xx). Bingley: Emerald Group.
Hassed, C., de Lisle, S., Sullivan, G., & Pier, C. (2009). Enhancing the health of medical students: Outcomes of an
integrated mindfulness and lifestyle program. Advances in Health Sciences Education, 14(3), 387-398.
Hawthorne, G., Korn, S., & Richardson, J. (2012). Population norms for the AQoL derived from the 2007 Australian
national survey of mental health and wellbeing. Australian and New Zealand Journal of Public Health, 37(1), 7-
16. doi: 10.1111/1753-6405.12004
Head, J., Kivimaki, M., Siegrist, J., Ferrie, J. E., Vahtera, J., Shipley, M. J., et al. (2007). Effort-reward imbalance and
relational injustice at work predict sickness absence: The Whitehall II study. Journal of Psychosomatic Research,
63(4), 433-440.
Jan Hyld Pejtersen, Kristensen, T. S., Borg, V., & Bjorner, J. B. (2010). The second version of the Copenhagen Psychosocial
Questionnaire. Scandinavian Journal of Public Health, 38(Suppl 3), 8-24.
Kuper, H., & Marmot, M. (2003). Job strain, job demands, decision latitude, and risk of coronary heart disease within the
Whitehall II study. Journal of Epidemiology and Community Health, 57(2), 147-153.
LaMontagne, A. D., Keegel, T., Louie, A. M., Ostry, A., & Lansbergis, P. A. (2007). A systematic review of the job-stress
intervention evaluation literature, 1990–2005. International Journal of Occupational and Environmental Health,
13, 268–280.
Langan-Fox, J., & Cooper, C. L. (Eds.). (2011). Handbook of stress in the occupations. Cheltenham, UK: Edward Elgar
Publishing.
Lee, R. T., & Brotheridge, C. M. (2011). Words from the heart speak to the heart: A study of deep acting, faking, and hiding
among child care workers. Career Development International, 16(4), 401-420. doi: 10.1108/13620431111158805
Leithwood, K. (2006). Teacher working conditions that matter: Evidence for change. Toronto: Elementaty Teachers
Federation of Ontario.
Lyubomirsky, S., King, L., & Diener, E. (2005). The benefits of frequent positive affect: Does happiness lead to success?
Psychological Bulletin, 131(6), 803-855.
Mahendrarajah, S., Warr, P. G., & Australian National University. National Centre for Development Studies. (1989).
Efficient water allocation and technological change : village dams in Sri Lanka. Canberra: Australian National
University, Research School of Pacific Studies, Dept. of Economics and National Centre for Development Studies.
Marmot, M. G. (2006). Status syndrome: A challenge to medicine. [Editorial]. JAMA: Journal of the American Medical
Association, 295(11), 1304-1307.
Matthews, P., Moorman, H., & Nusche, D. (2007). School leadership development strategies: Building leadership capacity
in Victoria, Australia: OECD.
Pejtersen, J. H., Kristensen, T. S., Borg, V., & Bjorner, J. B. (2010). The second version of the Copenhagen Psychosocial
Questionnaire. Scandinavian Journal of Public Health, 38(Suppl 3), 8-24.
Phillips, S., & Sen, D. (2011). Stress in head teachers. In J. Langan-Fox & C. L. Cooper (Eds.), Handbook of stress in the
occupations (pp. 177-201). Cheltenham, UK: Edward Elgar Publishing.
Richardson, J., Khan, M., Iezzi, A., Sinha, K., Mihalopoulos, C., Herrman, H., et al. (2009). The AQoL-8D (PsyQoL) MAU
Instrument: Overview September 2009. Melbourne: Centre for Health Economics, Monash University.
Richardson, J., Iezzi., K. M. A., & Maxwell, A. (2014). Validity and reliability of the Assessment of Quality of Life
(AQoL)-8D multi-attribute utility instrument. The Patient - Patient-Centered Outcomes Research, 7(1), 85-96.
Riley, P., & Langan-Fox, J. (2013). Bullying, stress and health in school principals and deputy/assistant principals and
medical professionals: Experiences at the ‘front-line’. In R. Burke, C. L. Cooper & S. Fox (Eds.), Human frailties:
Wrong turns on the road to success. London: Gower.

60
Sahlberg, P. (2015). Finnish lessons 2.0: What can the world learn from educational change in Finland? New York:
Teachers College Press.
Thomson, S., Bortoli, L. D., Nicholas, M., Hillman, K., & Buckley, S. (2011). Challenges for Australian Education: Results
from PISA 2009. Camberwell: Australian Council for Educational Research.
Twemlow, S. W., Fonagy, P., & Sacco, F. C. (2001). An innovative psychodynamically influenced approach to reduce
school violence. Journal of the American Academy of Child & Adolescent Psychiatry, 40(3), 377-379.
Williams, T., Ferraro, D., Roey, S., Brenwald, S., Kastberg, D., Jocelyn, L., et al. (2007). TIMSS 2007 U.S. technical report
and user guide. Washington DC: National Center for Education Statistics, Institute of Education Sciences, U.S.
Department of Education.
Woolfolk Hoy, A. (2013). A reflection on the place of emotion in teaching and teacher education. In M. Newberry, A.
Gallant & P. Riley (Eds.), Emotion in schools: Understanding how the hidden curriculum influences teaching,
learning and social relationships (Vol. 18, pp. 255-270). Bingley: Emerald Group