newcastle city council report 2008 local government elections · newcastle city council report 2008...
TRANSCRIPT
REPORT ON THE 2008 LOCAL GOVERNMENT ELECTIONSNEWCASTLE CITY COUNCIL
Newcastle City Council Report
2008 Local Government Elections

REPORT ON THE 2008 LOCAL GOVERNMENT ELECTIONSNEWCASTLE CITY COUNCIL
2
General ManagerNewcastle City CouncilPO Box 489Newcastle NSW 2300
Dear General Manager
I am pleased to present to you a report on the conduct and administration of the 2008 Local Government Elections held for Newcastle City Council.
Yours sincerely
Colin BarryElectoral Commissioner
31 August 2009

REPORT ON THE 2008 LOCAL GOVERNMENT ELECTIONSNEWCASTLE CITY COUNCIL
3
Contents
LIST OF TABLES ...................................................................................................................... 4
LIST OF GRAPHS.................................................................................................................... 5
THE 2008 LOCAL GOVERNMENT ELECTIONS ....................................................................... 8
2008 NEWCASTLE CITY COUNCIL ELECTIONS ................................................................... 15
ELECTION PREPARATION.................................................................................................... 19
CONDUCT OF THE ELECTIONS ........................................................................................... 38
ELECTION CONCLUSION.................................................................................................... 67
FUTURE DIRECTION ............................................................................................................. 80
APPENDICES....................................................................................................................... 85

REPORT ON THE 2008 LOCAL GOVERNMENT ELECTIONSNEWCASTLE CITY COUNCIL
4
List of TablesTable 1: 2008 Local Government Elections Due, Contested and Uncontested ............. 9Table 2: 2008 Local Government Elections, Results of Referenda Questions, Frequencies. ................................................................................................................................ 16Table 3: 2008 Local Government Elections Braille Ballot paper, Elector Satisfaction –NSW (%)......................................................................................................................................... 23Table 4: 2008 Local Government Elections Returning Officer Office Satisfaction – NSW (%) .................................................................................................................................................. 29Table 5: 2008 Local Government Elections Returning Officer Training Satisfaction –NSW (%)......................................................................................................................................... 32Table 6: 2008 Local Government Elections Polling Place Manager Satisfaction with Training – NSW (%)....................................................................................................................... 33Table 7: 2008 Local Government Elections Election Official Satisfaction with Training –NSW (%)......................................................................................................................................... 33Table 8: 2008 Local Government Elections Candidate Information Satisfaction – NSW (%) .................................................................................................................................................. 34Table 9: 2008 Local Government Elections NSWEC advertising expenditure, $M – NSW........................................................................................................................................................ 35Table 10: 2008 Local Government Elections Election Arrangements – NSW.................. 40Table 11: 2008 Local Government Elections Statewide Candidates by Registered Political Party ............................................................................................................................... 42Table 12: By-elections by council, vacancies, candidates and enrolled electors, Saturday, 29 November 2008................................................................................................... 44Table 13: 2008 Local Government Elections Categories of Election Staff – NSW and Newcastle City Council............................................................................................................. 48Table 14: 2008 Local Government Elections Pre-poll Voting Centre Details.................. 49Table 15: 2008 Local Government Elections Satisfaction with Pre-poll Voting Centres –NSW (%)......................................................................................................................................... 50Table 16: 2008 Local Government Elections Satisfaction with the Pre-poll Voting Process – NSW (%)....................................................................................................................... 50Table 17: 2008 Local Government Elections Satisfaction with Postal Voting Process –NSW Overall (%) .......................................................................................................................... 51Table 18: 2008 Local Government Elections Electors’ Satisfaction with Polling Place Voting – NSW (%)......................................................................................................................... 55Table 19: 2008 Local Government Elections Satisfaction with Polling Places – NSW Overall (%).................................................................................................................................... 56Table 20: 2008 Local Government Elections Voter Participation ..................................... 60Table 21: 2008 Local Government Elections Results information satisfaction – NSW (%)........................................................................................................................................................ 62Table 22: 2008 Local Government Elections Non-voter Statistics Comparisons............ 63Table 23: 2008 Local Government Elections Non-voters by Region and Gender ........ 64Table 24: 2008 Local Government Elections Media Information Satisfaction – NSW (%)........................................................................................................................................................ 67Table 25: 2008 Local Government Elections Survey Participation ................................... 68Table 26: 2008 Local Government Elections Returning Officer Satisfaction – NSW (%)71Table 27: 2008 Local Government Elections Major Expenditure Items for NSW and Newcastle City Council............................................................................................................. 75Table 28: NSWEC Corporate Plan Measures and 2008 Local Government Elections Outcomes..................................................................................................................................... 78

REPORT ON THE 2008 LOCAL GOVERNMENT ELECTIONSNEWCASTLE CITY COUNCIL
5
List of GraphsGraph 1: 2008 Local Government Elections Elector Inquiry Centre Call Volumes ....... 20Graph 2: 2008 Local Government Elections Elector Inquiry Centre, Nature of Calls ... 21Graph 3: 2008 Local Government Elections TIS National calls received by language. July – December 2008 ............................................................................................................... 26Graph 4: 2008 Local Government Elections Age Range of Candidates ....................... 41Graph 5: 2008 Local Government Elections Metropolitan and Rural Candidates Breakdown by Gender.............................................................................................................. 42Graph 6: 2008 Local Government Elections Non-Voters by Age and Gender – NSW 65Graph 7: 2008 Local Government Elections Statewide Enrolment, Voter Total and Non-Voter Total by Age ............................................................................................................ 65Graph 8: 2008 Local Government Elections Statewide Valid Reasons for Failing to Vote............................................................................................................................................... 66Graph 9: 2008 Local Government Elections Election costs – Number of Electors by Location........................................................................................................................................ 76

REPORT ON THE 2008 LOCAL GOVERNMENT ELECTIONSNEWCASTLE CITY COUNCIL
6
Newcastle City Council
2008 Election Summary
Enrolment
Total Electors 104,022Female Electors 52.2%Male Electors 47.8%
Polling Booths
Pre-poll Voting Centres 1Polling Places 66Election Officials 364
Voter Participation
Formal Votes 80,084Informal Votes 6,285Total Votes 86,369Voter Participation 83.0%Rate of Informality 7.3%
Voting Methods Electors used
Ordinary 72,134Postal 3,455Pre-poll 4,211Declared Institution 140Section 50Silent 94
Councillor Election
Total Candidates 64Female Candidates 23Male Candidates 41
Successful Candidates
Newcastle First Ward CLAYDON, SharonBUMAN, AaronOSBORNE, Michael

REPORT ON THE 2008 LOCAL GOVERNMENT ELECTIONSNEWCASTLE CITY COUNCIL
7
Newcastle Second Ward CRAKANTHORP, TimLUKE, BradSHARPE, Scott
Newcastle Third Ward BOYD, GrahamNELMES, NuataliKING, Mike
Newcastle Fourth Ward JACKSON, MikeCONNELL, ShayneCOOK, Bob
Mayoral Election
Total Candidates 7Female Candidates 2Male Candidates 5
Successful Candidate
TATE, John

REPORT ON THE 2008 LOCAL GOVERNMENT ELECTIONSNEWCASTLE CITY COUNCIL
8
The 2008 Local Government Elections
Background
Local Government elections in New South Wales (NSW) are conducted on a quadrennial basis. On Saturday, 13 September 2008, elections were held for 148 councils across NSW with councils ranging in enrolment size from 875 (Urana Shire Council) to 172,838 (Blacktown City Council) electors and in area from 5.8km2
(Hunters Hill Council) to 53,511km2 (Central Darling Shire Council).
Local Government elections provide individuals with the opportunity to be involved in the democratic process at a community level as candidates and electors.
The 2008 Local Government Elections were a major event for the New South Wales Electoral Commission (NSWEC) involving many months of preparation and planning to provide councils, candidates and electors with high quality election services. The NSWEC conducted the election in accordance with the legislation and introduced new services to improve the election process and operations for all stakeholders. The Elections also represented the first time that elections at the Local Government level have been brought to the standard experienced, and expected, by stakeholders at State and Federal elections.
Over 4.5 million electors were enrolled to vote at the 2008 Local Government Elections across NSW, with 104,022 enrolled within Newcastle City Council’s area.
This is the first time that the NSWEC has provided councils with a comprehensive report on their election. It is an important analysis of key services and administrative arrangements and will provide useful planning material for the 2012 Local Government Elections.
This report reviews the practices and electoral processes undertaken at the 2008 Local Government Elections and provides a detailed review of the election conducted for Newcastle City Council.
Election Snapshot
The conduct of Local Government Elections across NSW presented significant logistical challenges for the NSWEC. As part of the 2008 Local Government Electionsthe NSWEC:
assisted the Australian Electoral Commission (AEC) in the management of the electoral roll for 4,544,395 electors;
dealt with 4,620 candidates for 1,474 mayoral and councillor positions; conducted 332 individual elections; managed 2,597 polling places; assisted electors to cast 3,529,220 votes; managed 90 Returning Officers in the field; and employed 13,684 election staff.

REPORT ON THE 2008 LOCAL GOVERNMENT ELECTIONSNEWCASTLE CITY COUNCIL
9
A total of 309 councillor elections were due to be conducted across NSW in 2008 (86 in undivided councils, 223 in divided councils). Of these, 271 councillor elections were contested (84 in undivided councils, 187 in divided councils). Twenty-eight mayoral elections were due to be conducted, however, due to The Council of the City of Botany Bay mayoral election being uncontested, 27 mayoral elections were conducted.
The following table sets out the councillor and mayoral elections of the 2008 Local Government Elections.
Table 1: 2008 Local Government Elections Due, Contested and Uncontested
Due Contested UncontestedCouncillor elections – Divided councils 223 187 36Councillor elections – Undivided councils 86 84 2Councillor elections – Total 309 271 38Mayoral elections 28 27 1
Referenda were conducted for 15 councils (with two councils holding two referenda) and 17 polls were conducted for eight councils.
Four councils were returned to democracy at the 2008 Local Government Elections (Liverpool City Council, Tweed Shire Council, Walgett Shire Council and Warringah Council) while four councils under administration did not go to election (Broken Hill City Council, Port Macquarie-Hastings Council, Shellharbour City Council and Wollongong City Council).
NSWEC Initiatives
The NSWEC introduced a number of initiatives at the 2008 Local Government Elections to provide increased access to election services and information for stakeholders. These initiatives specifically included:
a meeting between NSWEC and council staff to explain administrative arrangements for the elections;
an Elector Inquiry Centre; dedicated council and candidate information help desk; redesign of the NSWEC website to include dedicated 2008 Local Government
Elections information; candidate information seminars throughout NSW; mobile pre-poll voting in remote areas; Braille ballot papers for electors with a vision impairment; an Aboriginal Elector Information Strategy; election information brochures; printed and online voter information available in 24 community languages; independent review of the cost allocation methodology; an independent observation team to review the centralised count of the
ballot papers; a Virtual Tally Room with updated results from election night until the
declaration of the poll; a report to the NSW Parliament on the overall conduct of the elections; and individual reports to councils on the conduct of their elections.

REPORT ON THE 2008 LOCAL GOVERNMENT ELECTIONSNEWCASTLE CITY COUNCIL
10
NSWEC Historical Involvement in Local Government Elections
1987
The NSWEC, formerly the State Electoral Office (SEO), was first involved in the conduct of Local Government elections in 1987 following assent given to the Local Government (Elections) Amendment Act 1987 which transferred responsibility for council elections from the (then) Town and Shire Clerks to the Electoral Commissioner.
These changes occurred to facilitate consistency of interpretation and administration of electoral laws, greater uniformity with State election procedures; to utilise the expertise of the NSWEC and to raise the awareness in the community of the importance of Local Government elections
1987 – 1991
The 1987 and 1991 elections were conducted using Town and Shire Clerks as Returning Officers but under the direction of the Electoral Commissioner.
1993
1993 saw introduction of the new Local Government Act (1993). Town and Shire Clerks became General Managers and were placed on contracts.
1995 – 2004
Independent Returning Officers were appointed by the SEO for the 1995 elections with elections conducted from council premises and utilising council resources to assist and support Returning Officers. Formal training of Returning Officers was minimal and undertaken with the assumption that Returning Officers would be supported by experienced council staff. The costs of some services provided were offset by the use of council resources including accommodation and staff, and were not always separately identified. Councils were charged only for actual goods and an administration fee. As a result the true cost of elections was not clear for individual councils or for NSW overall.
Legislation
Local Government elections in NSW are conducted in accordance with the provisions set out in the Local Government Act 1993 (the Act) and the Local Government (General) Regulation 2005 (the Regulation). Under the Act the NSW Electoral Commissioner is responsible for the conduct and administration of all NSW Local Government elections in an accountable, impartial and independent manner.
In mid 2008 amendments were made to the Regulation to modernise the arrangements for the conduct of Local Government elections in NSW. These reforms applied to the 2008 Local Government Elections.
Some of the key amendments to the Regulation included:
the Electoral Commissioner rather than the council became responsible for election advertising;

REPORT ON THE 2008 LOCAL GOVERNMENT ELECTIONSNEWCASTLE CITY COUNCIL
11
Local Government elections advertised more broadly including on the NSWEC and council websites;
transfer of various advertising functions from councils and Returning Officers to the Electoral Commissioner;
allowing nomination proposals and withdrawals, certain applications and other materials to be facsimiled or emailed;
changing the date for the close of nominations and time by which nominations must be lodged or withdrawn;
allowing silent electors to vote by post as well as allowing silent electors, pregnant electors or electors with disabilities to pre-poll vote;
enabling pre-poll voting at mobile booths in remote Local Government areas; requiring an elector to vote for at least half the number of candidates of the
total number of vacancies; requiring certain information to be placed on the NSWEC’s website; and providing for ballot papers to be issued in Braille format.
Full Cost Recovery
All Local Government elections are conducted by the NSWEC on behalf of councils. In 2003/04 the NSW Government decided that all elections, other than the State election, were to be funded by full cost recovery. The NSWEC is required by law to provide Local Government elections and councils are required by law to pay for the cost of running their elections. The NSWEC is not provided with funding from the NSW Government to cover costs associated with Local Government elections other than receiving an advance to cover expenses incurred until recoupment of costs from councils enables repayment of the advance.
The Local Government Elections on Saturday, 13 September 2008 saw for the first time full cost recovery applied across NSW.
Further information on election costs is provided in the Election Costs section.
Election Timetable
The date on which the Local Government elections are to be held was previously set in the Act as the fourth Saturday in September every four years. In 2008, this date was Saturday, 27 September, however, due to a conflict with the start of the school holidays, and under the direction of the Minister for Local Government, election day was brought forward by two weeks to be held on Saturday, 13 September 2008.

REPORT ON THE 2008 LOCAL GOVERNMENT ELECTIONSNEWCASTLE CITY COUNCIL
12
Key election dates at the 2008 Local Government Elections are listed below:
Activity DateClose of rolls Monday, 4 August 2008Close of nominations Wednesday, 13 August 2008Pre-poll voting starts Monday, 1 September 2008Registration of how-to-vote material closes
Friday, 5 September 2008
Postal voting applications close Monday, 8 September 2008Declared Institution voting commences
Monday, 8 September 2008
Declared Institution voting concludes
Wednesday, 10 September 2008
Pre-poll voting finishes Friday, 12 September 2008Election day Saturday, 13 September 2008Return of postal votes closes Monday, 15 September 2008Distribution of preferences commences
Tuesday, 16 September 2008
Declaration of the poll for Newcastle City Council
23 September 2008

REPORT ON THE 2008 LOCAL GOVERNMENT ELECTIONSNEWCASTLE CITY COUNCIL
13
The Local Government Area of Newcastle City Council
Newcastle City Council occupies an area of 183 square kilometres and is surrounded by Lake Macquarie, Cessnock, Maitland and Port Stephens Councils.
The following tables give the demographic breakdown of the Newcastle City Council area1.
Age Number % NSW %0–17 29,413 20.8 24.018–29 26,817 18.9 15.730–44 29,370 20.7 21.745–59 27,243 19.2 19.960–74 16,682 11.8 12.075 or over 12,228 8.6 6.7
Total 141,753 100.0 100.0
Weekly individual income Number % NSW %Negative/Nil 6,672 6.2 8.6$1–$399 46,821 43.2 37.0$400–$799 26,249 24.2 25.4$800–$1,299 17,398 16.1 16.4$1,300–$1,599 5,332 4.9 5.1$1,600–$1,999 2,680 2.5 3.0$2,000 or more 3,133 2.9 4.5Total 108,285 100.0 100.0
Schooling: highest year completed
Number % NSW %
Did not go to school 994 0.9 1.3Year 8 or equivalent or below 8,026 7.5 7.4Year 10 or equivalent or below
44,866 42.2 37.6
Year 11 or equivalent 6,518 6.1 6.6Year 12 or equivalent 45,983 43.3 47.1Total 106,387 100.0 100.0
1 Source: 2006 Australian Bureau of Statistics census data

REPORT ON THE 2008 LOCAL GOVERNMENT ELECTIONSNEWCASTLE CITY COUNCIL
14
Birthplace Number % NSW %Australia 116,230 87.8 74.4Overseas 16,092 12.2 25.6Total 132,322 100.0 100.0Top 5 birthplaces other than Australia 1. United Kingdom 3,871 2.9 4.42. New Zealand 1,353 1.0 1.83. Italy 820 0.6 0.94. Former Yugoslav Republic of Macedonia (FYROM)
741 0.6 0.3
5. Germany 601 0.5 0.5
Language spoken at home Number % NSW %English only 124,442 92.4 78.7Speaks language other than English
10,174 7.6 21.3
Total 134,616 100.0 100.0Top 5 languages other than English1. Macedonian 1,300 1.0 0.52. Italian 1,039 0.8 1.43. Greek 929 0.7 1.44. Mandarin 592 0.4 1.65. Polish 469 0.3 0.3
Religion: top 5 responses Number % NSW %1. Catholic 36,945 28.9 31.32. Anglican 35,398 27.7 24.23. No Religion 23,093 18.1 0.64. Uniting Church 9,968 7.8 5.15. Presbyterian and Reformed 4,971 3.9 3.7

REPORT ON THE 2008 LOCAL GOVERNMENT ELECTIONSNEWCASTLE CITY COUNCIL
15
2008 Newcastle City Council Elections
Election of Councillors
Newcastle City Council is a divided council with four wards each with three councillors elected for a period of four years. The mayor of Newcastle City Council is included as a councillor. The total number of councillors for Newcastle City Councilis 13.
At the 2008 Local Government Elections 64 candidates contested the election for the position of councillor. Details of the candidates who stood for election at the 2008 Local Government Elections can be found at Appendix 4.
Councillors commence their role on the day that the election is declared and hold the position for a period of four years, until the day of the next Local Government elections.
Election of the Mayor
Twenty-seven councils in NSW held an election for the popularly elected mayor at the 2008 Local Government Elections, 16 were in rural councils and 11 in metropolitan councils. At the 2008 elections there was one uncontested mayoral election in The Council of the City of Botany Bay.
Upon election the mayor holds office for a period of four years, until the day of the next Local Government elections.
Popularly Elected Mayor
The mayor of Newcastle City Council is popularly elected by the electors on election day as a result of a constitutional referendum. At the 2008 Local Government Elections seven candidates stood for the position of mayor at Newcastle City Council. Details of the candidates who stood for election for the position of mayor at the 2008 Local Government Elections can be found at Appendix 4.
Referendum
Councils must seek the approval of the electors by holding a constitutional referendum prior to amending certain arrangements associated with the council structure. Voting on a referendum issue is compulsory for all electors enrolled in the Local Government Area.
Issues to be decided by constitutional referendum include:
the division of the council area into wards or the abolishment of wards; the election of the mayor by electors or by the elected councillors; increases or decreases in the number of councillors; or

REPORT ON THE 2008 LOCAL GOVERNMENT ELECTIONSNEWCASTLE CITY COUNCIL
16
to change the method of election of ward councillors.
Councils are bound by constitutional referendum outcomes until a change is approved at a subsequent constitutional referendum. At the 2008 Local Government Elections 15 councils conducted a referendum with a total of 17 referenda questions. Two councils had two referenda questions. 11 referendum questions were endorsed. For metropolitan councils, three of the five councils were successful in the questions put to their communities. The corresponding figure for non metropolitan councils was seven of ten councils.
In terms of the nature of the referenda questions, the following table shows the results by question type.
Table 2: 2008 Local Government Elections, Results of Referenda Questions, Frequencies.
Referendum Issue NumberNumber
endorsedPopularly elected mayor 7 5Change number of councillors(all to reduce numbers)
7 5
Change ward structure (2 to abolish; 1 to introduce) 3 1TOTAL 17 11
At the 2008 Local Government Elections Newcastle City Council did not hold a referendum.
Poll
Councils may seek direction from electors on any matter by conducting a poll. The results of polls do not bind council to any action but provide the council with information to assist in their decision making processes.
Eight councils across NSW conducted a poll at the 2008 Local Government Elections.
At the 2008 Local Government Elections Newcastle City Council did not hold a poll.
Method of Voting
Councillor Election
Section 285 of the Act prescribes that the voting system in a contested election of a councillor or councillors is to be:
optional preferential if the number of councillors to be elected is one or two; proportional representation if the number of councillors to be elected is three
or more.
The election of councillors for Newcastle City Council at the 2008 Local Government Elections was Proportional Representation (PR).

REPORT ON THE 2008 LOCAL GOVERNMENT ELECTIONSNEWCASTLE CITY COUNCIL
17
Proportional RepresentationProportional representation voting is used when three or more candidates are to be elected.
To Elect Three or More CandidatesIn proportional representation voting electors are required to mark their preferences for at least the number of candidates equal to half the number of vacancies.
In an election where there are three or more councillors to be elected, candidates can form a group on the ballot paper and can have a group voting square for above the line voting.
Where there are group voting squares on the ballot paper, electors can vote above the line by placing the number ‘1’ in one group voting square and can place consecutive numbers beginning with ‘2’ in as many other group voting squares as they wish. Placing a ‘1’ above the line in only one group voting square indicates preferences for all the candidates in that group, in their order on the ballot paper. The vote stops with the last candidate in that group and preferences do not continue to any other candidates on the ballot paper. Placing a ‘2’ and following consecutive numbers in group voting squares indicates preferences for the candidates in these groups in their order on the ballot paper.
Alternatively, electors can vote for individual candidates below the line by placing preferences next to the candidates of their choice for at least half the number of vacancies. The number of preferences required is shown in the directions for voting on the ballot paper. They may then continue numbering preferences to the extent they choose.
Where there are no group voting squares, electors can vote for individual candidates by placing preferences next to the candidates of their choice for at least half the number of vacancies. The number of preferences required is shown in the directions for voting on the ballot paper.
Mayoral election
The election of the popularly elected mayor is determined by Optional Preferential voting. Electors are required to mark their ballot paper by placing a ‘1’ in the square next to the candidate of their choice and may, if they wish, vote for other candidates by giving preferences for as many other candidates as they wish.
Referendum or Poll
For a referendum or poll electors are required to write ‘Yes’ or ‘No’ on their ballot paper.
Newcastle City Council Results Summary
Newcastle City Council election resulted in the election of the following candidates to the position of councillor:
Newcastle First Ward CLAYDON, SharonBUMAN, Aaron

REPORT ON THE 2008 LOCAL GOVERNMENT ELECTIONSNEWCASTLE CITY COUNCIL
18
OSBORNE, MichaelNewcastle Second Ward CRAKANTHORP, Tim
LUKE, BradSHARPE, Scott
Newcastle Third Ward BOYD, GrahamNELMES, NuataliKING, Mike
Newcastle Fourth Ward JACKSON, MikeCONNELL, ShayneCOOK, Bob
In the election for the position of mayor of Newcastle City Council, John Tate was elected by popular vote.

REPORT ON THE 2008 LOCAL GOVERNMENT ELECTIONSNEWCASTLE CITY COUNCIL
19
Election Preparation
Initiatives for the 2008 Local Government Elections
The NSWEC implemented a number of initiatives in 2008 which have previously not been available at Local Government elections. These initiatives proved to be positive introductions and beneficial to both the NSWEC and a variety of stakeholders throughout the election process.
NSWEC Visit with Council
Between Monday, 6 August and Monday, 29 October 2007 the NSWEC visited all councils in NSW having an election. The visits were designed primarily to:
provide councils with information regarding the levels of service the NSWEC would be providing, including the initiatives NSWEC would be putting in place;
give councils the opportunity to have input into the level of services providedand to provide a clear understanding of the cost of those services; and
provide councils with information on election costing; and timing of a fully itemised budget estimate.
On Tuesday, 21 August 2007, NSWEC staff met with staff from Newcastle City Councilto discuss election services for the 2008 Local Government Elections.
Issues discussed at the meeting included the total service approach to be adopted by the NSWEC and a range of practical proposals, such as council’s provision of office accommodation and the optional election information brochure, to reduce the cost of the election. A list of agenda items is available at Appendix 1. The areas which involved in-depth discussion at the majority of councils were the proposed budget, the appointment of the Returning Officer, the provision of Returning Officeraccommodation and vote counting.
Elector Inquiry Centre
The NSWEC established an Elector Inquiry Centre to ensure that relevant, timely and specific information was available to all electors and to decrease the number of telephone enquiries made to councils.
The Elector Inquiry Centre was operational from Monday, 28 July 2008 to Monday, 29 September 2008 with peak periods coinciding with the distribution of election information brochures and the NSWEC advertising campaign. In the three weeks leading up to election day 81% of the total calls were received with high volumes experienced in days directly prior to election day. Call volumes also remained high in the week following election day with a number of calls from electors who were unable to vote on election day.

REPORT ON THE 2008 LOCAL GOVERNMENT ELECTIONSNEWCASTLE CITY COUNCIL
20
Graph 1: 2008 Local Government Elections Elector Inquiry Centre Call Volumes
0
1 000
2 000
3 000
4 000
5 000
6 000
Mon Tue Wed Thu FriW
ee
k 1
We
ek
2
We
ek
3W
ee
k 4
We
ek
5W
ee
k 6
We
ek
7
We
ek
8W
ee
k 9
Some technical problems were experienced with the telecommunications which resulted in some calls not being answered or recorded with a reason for the call or call outcome.
Over 106,955 calls were made to the Elector Inquiry Centre during its operation. Of the operator answered calls, 1,579 came from postcodes within Newcastle City Council area.
The five councils with the highest proportion of calls to the Elector Inquiry Centrewere:
Council of the City of Sydney 3.95% Sutherland Shire Council 3.36% Blacktown City Council 3.31% Parramatta City Council 3.25% Fairfield City Council 3.20%
The five councils with the lowest proportion of calls were:
Forbes Council 0.01% Brewarrina Shire Council 0.02% Jerilderie Shire Council 0.02% Murrumbidgee Shire Council 0.02% Bombala Council 0.02%

REPORT ON THE 2008 LOCAL GOVERNMENT ELECTIONSNEWCASTLE CITY COUNCIL
21
Calls per day peaked at 5,673 on Friday, 12 September 2008. The peak calls per hour of 720 also occurred on Friday, 12 September 2008, between 9.30am and 10.30am. The following graph provides an overview of the call topics over the operating period.
Graph 2: 2008 Local Government Elections Elector Inquiry Centre, Nature of Calls
Enrolment10.6%
Postal voting19.4%
Polling places6.2%Transfers
3.7%
Other queries3.2%
Escalations0.6%
Pre-poll voting10.7%
Candidate/Voting/ Results info
2.3%
Disability issues0.1%
Unable to vote41.4%
Non-residential roll 0.4%
Wrong numbers, test calls1.2%
Council and Candidate Help Desk
The NSWEC established a help desk for the exclusive use of candidates and council representatives. Candidates and councils seeking advice on areas such as nominations, how-to-vote materials, election funding and election results were able to call the help desk throughout the election period. The introduction of the help desk led to a reduction in calls to the Returning Officer and more consistent and accurate distribution of information to candidates and council representatives.
The Council and Candidate Help Desk was based at the NSWEC head office with calls answered by experienced election staff and was operational from Monday, 2 June 2008 until three weeks after election day.
Candidate Information Seminars
Candidate information seminars were conducted by the NSWEC to assist all candidates in their preparation for the 2008 Local Government Elections. The initial programme contained seminars throughout May and June 2008. In response to requests from councils the NSWEC extended the programme with the final seminar held on Tuesday, 5 August 2008. Seminars were conducted in 30 locations across NSW and were attended by almost 1,000 prospective candidates and interested stakeholders.

REPORT ON THE 2008 LOCAL GOVERNMENT ELECTIONSNEWCASTLE CITY COUNCIL
22
The seminars provided prospective candidates with the opportunity to clarify any issues with senior NSWEC staff. Major topics covered in the seminars included:
the election timetable; candidate eligibility criteria and how to nominate; groups of candidates and political party names on ballot papers; mayoral elections; campaigning (election advertising, ‘how-to-vote’ material and public scrutiny
of candidates); complaints handling by NSWEC; voting and counting ballot papers; scrutineers; and election funding obligations.
The seminars were advertised in statewide newspapers and on local radio. Appendix 2 provides the dates, locations and number of attendees at the seminars.
Mobile Pre-Poll Voting
Providing voting services to electors in rural and remote NSW remains a challenge for the NSWEC with electors in isolated rural communities often experiencing difficulties in getting to a polling place because of the significant distances to be travelled. They are also often unable to lodge a postal vote due to irregular mail services in isolated locations.
Amendments made in 2008 to the Regulation enabled the NSWEC to implement mobile voting in remote Local Government areas. This was the first time that mobile pre-poll voting was available. It usually takes a few elections for electors to become accustomed to a new service. Consequently, elector take up is initially limited.
The NSWEC provided mobile pre-poll services for residents in eight regional areas in the far west and northern NSW including:
Balranald Shire Council (Hatfield) 10 am to 3 pm, Friday, 12 September; Bourke Shire Council (Fords Bridge) 10am to 3 pm, Sunday, 7 September; Central Darling Shire Council (Emmdale) 11 am to 4 pm, Saturday, 6
September; Hay Shire Council (Booligal) 10 am to 3 pm,Wednesday, 10 September; Hay Shire Council (Maude) 10 am to 3 pm, Thursday, 11 September; Narrabri Shire Council (Bellata) 10 am to 2 pm, Monday, 1 September; Narrabri Shire Council (Gwabegar) 10am to 2pm, Thursday, 4 September; and Narrabri Shire Council (Pilliga) 10am to 2 pm, Friday, 5 September.
Braille Ballot Papers
Amendments to the Regulation in 2008 allowed for the introduction of Braille ballot papers for electors with a vision impairment at the 2008 Local Government Elections. The availability of Braille ballot papers was advertised on the NSWEC website, in the NSWEC Equal Access to Democracy newsletters, on print handicapped radio and through the Vision Australia networks. Electors requiring Braille ballot papers were able to cast a postal vote, pre-poll vote or ordinary vote at a polling place on election day.

REPORT ON THE 2008 LOCAL GOVERNMENT ELECTIONSNEWCASTLE CITY COUNCIL
23
Electors requiring a Braille ballot paper were required to register with the NSWEC between Monday, 14 July and 5 pm Wednesday, 13 August either in writing (fax, post or email) or verbally. A total of 52 electors registered to vote using Braille ballot papers comprising of 31 requests for postal voting, 3 requests for pre-poll voting and 18 for voting at a polling place. Bankstown City Council and Burwood Council had the greatest number of electors using Braille ballot papers each with four requests. Two electors enrolled in Newcastle City Council registered to vote using Braille ballot papers.
Electors using Braille ballot papers who required information on candidates in their council area and/or ward could contact the NSWEC Elector Inquiry Centre if they needed candidate information sheets read to them.
While the NSWEC advertised the availability of Braille ballot papers on print handicapped radio (2RPH) most participants found out about the option of Braille ballot papers through the networks of organisations associated with vision impairment including Vision Australia, Blind Citizens Australia and Guide Dogs.
As an important initiative introduced at the 2008 Local Government Elections, the NSWEC sought feedback from electors who used the Braille ballot papers. The NSWEC conducted a telephone survey of 71.2% electors who applied to use Braille ballot papers2. Overall, high levels of satisfaction were recorded with the various aspects of the process.
Table 3: 2008 Local Government Elections Braille Ballot paper, Elector Satisfaction – NSW (%)
Very unsatisfactory
Unsatisfactory Neutral Satisfactory Very satisfactory
Access and availability of information
0.0 8.1 2.7 64.9 24.3
Registration process
0.0 2.7 5.4 54.1 37.8
Communication on arrangements
5.6 2.8 8.3 41.7 41.7
Instructions on how to mark the ballot papers
0.0 8.1 16.2 51.4 24.3
Manner of election staff
2.7 0.0 8.1 24.3 64.9
Overall ease of process
2.9 5.7 2.9 51.4 37.1
While 63.9% of users did not experience any problems when marking the ballot papers, comments were made concerning the requirement to mark the ballot paper using a pencil and the fact that it was not possible to check that the vote was correct without sighted assistance. Comments were also made that people with vision impairment are not necessarily familiar with writing numbers (on ballot papers) or text (in case of a referendum).
2 The NSWEC contacted all of the registered Braille ballot papers users. A few chose not to participate, the views of the remainder could not be gained for reasons of ill health, death or changed contact details

REPORT ON THE 2008 LOCAL GOVERNMENT ELECTIONSNEWCASTLE CITY COUNCIL
24
62.2% of participants believed that voting using a Braille ballot paper improved the privacy of their vote and 72.2% agreed that their independence when voting was improved. Some respondents, however, pointed out that the low numbers of Braille ballot paper users per council meant that their privacy was lessened as a Braille ballot paper stood out against other non Braille ballot papers.
Survey participants were asked to provide comments or suggestions that they thought would assist in improving services to electors with vision impairment in the future. While electors were supportive of the initiative and saw it as a positive start, there was a preference for online voting as used by the AEC at the 2007 Federal Election. Participants also commented that candidate information and other background election material in Braille would be useful at future elections. The Braille ballot papers were produced using Grade 1 (uncontracted) Braille, however, 71.9% of participants indicated a preference for the use of Grade 2 (contracted) Braille. It was noted that Grade 1 was useful for electors with vision impairment who were not as experienced with Grade 2 Braille.
The overall feedback indicated that 80.6% would choose to cast their vote using Braille ballot papers at future elections.
Equal Access to Democracy
The NSWEC’s Equal Access to Democracy Plan was reviewed, in consultation with the Equal Access to Democracy Reference Group, prior to the 2008 Local Government Elections. The Plan focused on ways to improve services to, and participation in, the democratic process for people with a disability.
Building on the successful strategies used at the 2007 State General Election and taking into consideration feedback from the reference group, the 2008 Equal Access to Democracy Plan contained strategies which were possible under the legislation and delivered real, practical improvements.
Key improvements made to the 2008 Equal Access to Democracy Plan included:
the provision of Braille ballot papers upon request for electors who are vision impaired;
increased consultation with NSW government organisations such as the Department of Ageing, Disability and Home Care;
increased website accessibility, including a page with information for electors with a disability;
development of a train the trainer module for the 2008 Local Government Elections; and
review of the Returning Officer guidelines to include information on assisting electors who have vision impairment, mental illness or intellectual disability.
Aboriginal Elector Information Strategy
The NSWEC reviewed its Aboriginal Elector Information Strategy to further developpractical and achievable strategies specifically for the 2008 Local Government Elections.

REPORT ON THE 2008 LOCAL GOVERNMENT ELECTIONSNEWCASTLE CITY COUNCIL
25
A major focus for the NSWEC was a focused recruitment drive for the 2008 Local Government Elections. Activities undertaken in the lead up to the 2008 Local Government Elections included:
participating in the Aboriginal Yabun festival on Saturday, 26 January 2008 where details were collected of people wishing to work at the 2008 Local Government Elections. The NSWEC subsequently wrote to those electors advising how to register an expression of interest;
advising Aboriginal organisations of employment opportunities including the Aboriginal Employment Strategy;
launching the Aboriginal Electors section of the NSWEC website with links to the employment page and Aboriginal Elector newsletters;
train the trainer module developed for Aboriginal electors was trialled with Walgett Council and provided to the Department of Aboriginal Affairs; and
increased consultation with peak Aboriginal bodies such as the Department of Aboriginal Affairs and the NSW Aboriginal Land Council.
Services for Culturally and Linguistically Diverse Electors
For the 2008 Local Government Elections the NSWEC further developed strategies to increase access to information and services for electors from culturally and linguistically diverse (CALD) backgrounds to ensure all members of the public hadaccess to a full range of election services.
Three major initiatives for CALD electors were introduced for the elections:
the introduction of Culturally and Linguistically Diverse News newslettersdistributed through the Community Relations Commission network;
the development of the Culturally and Linguistically Diverse electors’ page on the NSWEC website; and
the NSWEC prepared material for CALD electors including a multilingual voting assistance guide with election information in 24 community languages which was available at all pre-poll voting centres and polling places.
The NSWEC made available access to a telephone translating service through the Department of Immigration and Citizenship’s Translating and Interpreting Service (TIS). Call volumes through the translating service were significantly higher than average during September with over 600 calls taken in the month. Electors requiring translations in 27 different languages used the service with the majority of callers in September requiring assistance in Mandarin (26.0%) or Cantonese (23.2%).

REPORT ON THE 2008 LOCAL GOVERNMENT ELECTIONSNEWCASTLE CITY COUNCIL
26
Graph 3: 2008 Local Government Elections TIS National calls received by language. July –December 2008
0102030405060708090
100110120130140150160
Ara
bic
Ass
yria
n
Ca
nto
ne
se
Cro
atia
n
Da
ri
Filip
ino
Gre
ek
hin
di
Hu
ng
aria
n
Ind
on
esi
an
Italia
n
Jap
an
ese
Kh
me
r
Kore
an
Ma
ce
do
nia
n
Ma
ltese
Ma
nd
arin
Pers
ian
Po
lish
Po
rtu
gu
ese
Ru
ssia
n
Serb
ian
Spa
nis
h
Tha
i
Turk
ish
Urd
u
Vie
tna
me
se
Language
Ca
ll V
olu
me
July August September
October November December
Virtual Tally Room
The NSWEC introduced a Virtual Tally Room (VTR) as requested by the Local Government and Shires Associations to provide election stakeholders with regular updates of all election counts across NSW. The VTR was successfully introduced at the 2007 State General Election and its introduction at the 2008 Local Government Elections brought council elections into line with State elections by providing electronically first preference results for 148 councils on election night.
Results became available from approximately 6.30 pm on election night and were updated throughout election night until all first preferences results were recorded by the Returning Officers. The VTR was continuously updated in the weeks after election day until all 332 election results were known.
Election Management Application
The Election Management Application (EMA) was introduced at the 2007 State General Election as an internet based application for the use of Returning Officers, office assistants and head office staff.
The suite of software modules was developed to assist with managing electionprocesses such as enquiries, election day staffing, candidate nominations, the distribution and return of declaration votes, results and non-voter administration.
Further enhancements to the EMA system were implemented prior to the 2008 Local Government Elections to refine the developed modules. Additional modules werealso developed to assist with election resourcing.
REPORT ON THE 2008 LOCAL GOVERNMENT ELECTIONSNEWCASTLE CITY COUNCIL
27
Ward Boundary Changes
Section 211 of the Act requires councils to regularly review their ward boundaries to ensure that all wards have an approximately equal number of electors with a variance of not more than 10%.
Prior to the election, the NSWEC requested that all councils with wards review their internal ward boundaries in order to comply with the legislative requirements for the 2008 Local Government Elections. Councils were asked to have their wardboundaries finalised and approved by Monday, 31 December 2007.
A website was developed by the NSWEC to assist councils with the task and included information on how and when to alter ward boundaries, identified those councils outside the 10% variance and provided enrolment information to assist councils in creating their new ward boundaries.
Councils were required to complete a ward boundary report and submit a copy of the finalised ward boundaries, once approved by council, to the NSWEC. This ward boundary report ensured councils had correctly completed their ward boundary review and assisted the NSWEC and AEC correctly code electors to their new ward.
The finalised ward boundaries were published on the NSWEC website using Google Maps and were used as an information tool for electors to identify their ward and possible polling places.

REPORT ON THE 2008 LOCAL GOVERNMENT ELECTIONSNEWCASTLE CITY COUNCIL
28
The Returning Officer
Recruitment
In December 2007 the NSWEC placed advertisements in local newspapers inviting expressions of interest for work as a Returning Officer at the 2008 Local Government Elections. Interviews with successful applicants were conducted over a three week period in February and March 2008.
The training of Returning Officers commenced in May 2008 with Cathy Coleappointed as the Returning Officer for Newcastle City Council. Cathy Cole was the Returning Officer for the electoral district of Newcastle at the 2007 State election.
Returning Officer Duties
The Returning Officer had a number of responsibilities which were central to the running of the election. Operational duties included:
set up and decommissioning of a temporary office; training of office staff and polling place managers; making arrangements for voting at polling places and Declared Institutions; issuing and processing postal and pre-poll votes; dealing with enquiries and complaints from candidates and the public; processing candidate nominations and how-to-vote material; and counting of votes and declaring the result of the election.
The Returning Officer’s Office
Finding suitable office accommodation presents challenges in the lead up to elections as Returning Officers are required to lease an office with sufficient space to store materials and conduct the counts, in a location that is convenient for the public and available on a short lease.
The NSWEC contacted Newcastle City Council to discuss any available space in council owned premises to accommodate the Returning Officer for a period of ten weeks during the election. Council advised they were not able to provide accommodation for the Returning Officer.
The Returning Officer’s office for Newcastle City Council was located at:
Shop 1, 473-475 Hunter Street Newcastle NSW 2300.
All Returning Officers were in their offices from Monday, 21 July 2008 with offices across NSW open to the public from Monday, 28 July 2008. It was necessary for the Returning Officer’s office to be open from July in order to ensure that all stakeholders,including councils, candidates, media and electors, had access to election services and information in the week prior to the close of rolls and opening of nominations set for Monday, 4 August 2008.
The office accommodation is a significant cost driver during an election. The average cost charged for office accommodation for metropolitan councils was

REPORT ON THE 2008 LOCAL GOVERNMENT ELECTIONSNEWCASTLE CITY COUNCIL
29
$24,612 with the cost in regional areas averaging $10,025. Average costs incurred for council owned premises and privately leased premises did not vary significantly with the average expenditure for privately owned locations being $17,677 and for council owned premises $16,594. Almost a half (48.0%) of Returning Officers’ offices were leased from councils. (Where councils provided office accommodation at no cost, the total budget figure for the 2008 Local Government Elections includes an estimate to cover this accommodation although no charge was made to council when recouping the cost of their elections.)
As part of the debrief process Returning Officers were asked to rate their satisfaction with their office in terms of location, security, size and cost. All areas were well rated with almost three-quarters rating the location of their offices as very satisfactory.
Table 4: 2008 Local Government Elections Returning Officer Office Satisfaction – NSW (%)
Very dissatisfied
Dissatisfied Neutral Satisfied Very satisfied
Location 0.0 1.2 4.7 20.0 74.1Security 1.2 1.2 8.2 37.6 51.8Size 1.2 5.9 5.9 28.2 58.8Cost 0.0 3.7 15.9 40.2 40.2
Comments made in the feedback survey from Newcastle City Council's Returning Officer included ‘It was good to be advised of the space needed (500 sq m for Newcastle), which seemed big at first but on Election Sunday we were full to capacity and I couldn't employ as many people as the OA costing plan indicated as I couldn't physically fit them in (carried some functions/hours over to Monday). ’
Regional Returning Officers
The NSWEC identified an area of potential saving by introducing a regional model for the Returning Officer role for councils in regional and remote areas. By utilising a Regional Returning Officer, costs for the Returning Officer, office staff salaries andoffice accommodation fees were shared by each council.
As this was an initiative by the NSWEC, and a first for councils, the NSWEC invited councils to participate in sharing a Regional Returning Officer. In some areas the process was delayed as councils considered the benefits of involvement in this initiative. These delays caused difficulties in finalising arrangements for other councils who had already agreed to participate.
Councils representing in excess of 900,000 electors opted to share a Returning Officerwith their neighbouring councils. A total of 23 regions were established involving 81 councils. The smallest regions involved two councils; the biggest involved seven councils. Typically these councils were smaller by nature with an average elector base of 11,113 compared to the statewide average of 29,436. Councils that chose to share a Returning Officer ranged from 875 electors (Urana Shire Council) to 54,520electors (Blue Mountains City Council).
For councils with a Regional Returning Officer the average cost of providing theRegional Returning Officer, office staff and office accommodation was $1.23 per elector. A comparative cost for these same councils had they not opted to share a Regional Returning Officer would have been $4.88 per elector. Costs were cut to less

REPORT ON THE 2008 LOCAL GOVERNMENT ELECTIONSNEWCASTLE CITY COUNCIL
30
than a third on average for these councils. Appendix 3 includes a breakdown of councils by Regional Returning Officer groups, the number of electors per group and the area of the regions.
Feedback from the councils with a Regional Returning Officer was positive with 77.6% stating that they would be prepared to use a shared Returning Officer at the 2012 Local Government Elections based on the experience at the 2008 Elections. Councils noted their satisfaction of the benefits promoted by the NSWEC as having been seen by council (75.4% neutral, satisfactory or very satisfactory) and satisfaction with the availability of the Regional Returning Officer to council (86.2% neutral, satisfactory or very satisfactory).
Some councils raised concerns with the distance required to be travelled to the Regional Returning Officer’s office by electors and candidates. The NSWEC was faced with challenges when determining the most appropriate Regional Returning Officer office location. Unfortunately, with only one office location, there will always be some stakeholders who are required to travel greater distances than others to visit the Returning Officer. The NSWEC will review this aspect of the initiative prior to future elections by assessing other means of communication with the Regional Returning Officer and to minimise unnecessary travel.
Feedback on Returning Officers
Returning Officers were, on the whole, well regarded by the General Managers with particular satisfaction noted with their communication/liaison with council (95.3%),quality of work (99.0%) and professionalism (96.2%) (all including very satisfactory, satisfactory and neutral).
Processes conducted by the Returning Officers (including communication of candidate information, the nomination process, the conduct of draw for ballot paper position and the registration of how-to-vote material) were rated highly by candidates across the State with an overall satisfaction rate of 92.9% (14.6% neutral, 43.9% satisfied, 34.4% very satisfied).
Returning Officers Contact with Council
Feedback was received from Returning Officers on their contact with councils and the areas where council assisted.
The Returning Officer for Newcastle City Council advised that contact was made with council approximately once a week during the election period. The main reasons for contacting the council were:
advertising
The Returning Officer advised that the areas where assistance was provided by council included bulk photocopying services (e.g. postal vote applications and polling place manager training materials); assisted with reserving parking space for polling place manager return of materials on Saturday night; removed rubbish and took paper/cardboard and prfor recycling at the end of the elections.

REPORT ON THE 2008 LOCAL GOVERNMENT ELECTIONSNEWCASTLE CITY COUNCIL
31
Returning Officer Support Officer
A Returning Officer Support Officer (ROSO) was appointed to each Returning Officerin order to provide support on electoral matters and procedures in the conduct of the election. The appointed ROSOs were experienced former Returning Officers and NSWEC staff.
Any issues on which the Returning Officer required assistance were directed to the ROSO to ensure that all electors, council staff and other stakeholders were provided with consistent, accurate information. Each ROSO had responsibility for up to ten Returning Officers. The ROSOs answered a total of 12,423 calls from Returning Officers and their staff over the three months July to September 2008.
Dave Lennon was appointed as the ROSO for Newcastle City Council. All ROSOs were based in the NSWEC head office which allowed direct access to NSWEC head office staff when required.
Training
Returning Officers
All Returning Officers participated in a four day training programme scheduled between Tuesday, 6 May 2008 and Friday, 4 July 2008. The training covered keyelements of a Returning Officer’s role in the lead-up to election day and through to the close of office. The training included sessions on:
appointing of polling places; advertising strategy; media strategy; financial processes; nomination process; election staffing; IT communications set-up; counting the votes; voting arrangements; results management; registering electoral material; election day processes; declaration of the poll; and close of office.
Feedback from the evaluations undertaken immediately after the training and after the election, indicated that participants found the content of the training session satisfactory or very satisfactory and that the programme was professionally presented.
A high level of satisfaction was recorded in all categories for the manual, topics covered in training and follow up on training, with almost 70% reporting that the ongoing support was very satisfactory. 93.9% of Returning Officers stated that the training assisted them to be better able to undertake their work in the office.

REPORT ON THE 2008 LOCAL GOVERNMENT ELECTIONSNEWCASTLE CITY COUNCIL
32
Table 5: 2008 Local Government Elections Returning Officer Training Satisfaction – NSW (%)
Very unsatisfactory
Unsatisfactory Neutral Satisfactory Very satisfactory
Training manual 0.0 2.4 7.3 45.1 45.1Topics covered in training
0.0 3.7 7.3 52.4 36.6
Follow up on training
0.0 2.5 25.0 50.0 22.5
Ongoing support
0.0 1.2 3.7 24.7 70.4
Areas covered in the comments for future improvements included the availability of the training manuals and all computer modules at an earlier date and increased training on computer based programmes including EMA and VoteCalc.
Training materials provided to Returning Officers for the training of clerical assistants and polling place managers were rated satisfactory.
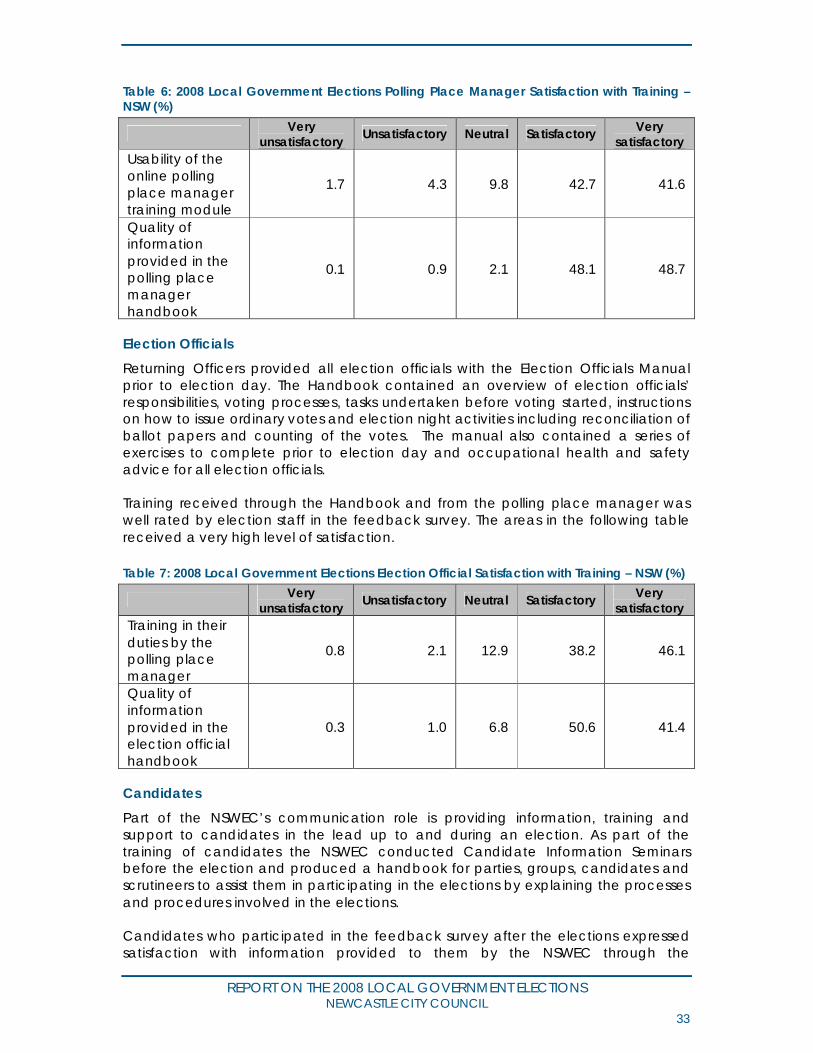
Polling Place Managers
The polling place manager training programme was developed by the NSWEC to assist polling place managers in the understanding of their duties and responsibilities during voting hours and when conducting the count on election day. Polling place managers attended a training session at the Returning Officer’s office and completed an online training programme.
The 2008 Local Government Elections were the first time online training has been utilised by the NSWEC. The online module allowed for a review of the role of a polling place manager, the various types of votes, counting and reconciling ballot papers and sorting and counting of the votes. The online training also required participants to complete exercises to assist in preparing for election day.
Feedback received from polling place managers indicates a high level of satisfaction with the quality of information provided in the polling place manager handbook (96.8%) and with the usability (84.3%) and usefulness of the content (87.3%) of the online polling place manager training module.
Face to face training for polling place managers was conducted by the Returning Officer in the weeks prior to election day.
Training, both through the Polling Place Managers Handbook and the online training, was well received by polling place managers with the vast majority expressing a high level of satisfaction.
REPORT ON THE 2008 LOCAL GOVERNMENT ELECTIONSNEWCASTLE CITY COUNCIL
33
Table 6: 2008 Local Government Elections Polling Place Manager Satisfaction with Training –NSW (%)
Very unsatisfactory
Unsatisfactory Neutral Satisfactory Very satisfactory
Usability of the online polling place manager training module
1.7 4.3 9.8 42.7 41.6
Quality of information provided in the polling place manager handbook
0.1 0.9 2.1 48.1 48.7
Election Officials
Returning Officers provided all election officials with the Election Officials Manualprior to election day. The Handbook contained an overview of election officials’responsibilities, voting processes, tasks undertaken before voting started, instructions on how to issue ordinary votes and election night activities including reconciliation of ballot papers and counting of the votes. The manual also contained a series of exercises to complete prior to election day and occupational health and safety advice for all election officials.
Training received through the Handbook and from the polling place manager was well rated by election staff in the feedback survey. The areas in the following table received a very high level of satisfaction.
Table 7: 2008 Local Government Elections Election Official Satisfaction with Training – NSW (%)
Very unsatisfactory
Unsatisfactory Neutral Satisfactory Very satisfactory
Training in their duties by the polling place manager
0.8 2.1 12.9 38.2 46.1
Quality of information provided in the election official handbook
0.3 1.0 6.8 50.6 41.4
Candidates
Part of the NSWEC’s communication role is providing information, training and support to candidates in the lead up to and during an election. As part of the training of candidates the NSWEC conducted Candidate Information Seminars before the election and produced a handbook for parties, groups, candidates and scrutineers to assist them in participating in the elections by explaining the processes and procedures involved in the elections.
Candidates who participated in the feedback survey after the elections expressedsatisfaction with information provided to them by the NSWEC through the

REPORT ON THE 2008 LOCAL GOVERNMENT ELECTIONSNEWCASTLE CITY COUNCIL
34
candidates handbook, information seminars and inquiry desk. A high level of satisfaction was also noted by candidates with general election services.
Table 8: 2008 Local Government Elections Candidate Information Satisfaction – NSW (%)
Very unsatisfactory
Unsatisfactory Neutral Satisfactory Very satisfactory
Candidates handbook
3.1 4.7 19.4 54.2 18.7
Candidates information seminars
4.3 4.8 35.8 39.5 15.6
Candidates inquiry desk
3.7 4.0 36.3 39.1 17.1
Advertising
The 2008 Local Government Elections advertising campaign consisted of a general statewide election campaign, council specific statutory advertisements and an election information brochure.
Statewide Campaign
The NSWEC statewide advertising campaign provided stakeholders with generalised election information. Advertisements appeared in Sydney metropolitan and selected regional publications and on selected radio across NSW. Topics covered by the statewide campaign included:
enrolment; voting arrangements; remember to vote; and registration of electoral material.
Statutory Campaign
Prior to the election the NSWEC consulted Newcastle City Council to determine in which local newspapers the statutory advertisements, required under the legislation, were to be placed. The NSWEC also requested that council provided information about the number of times the advertisements were to appear in the newspapers and also if they would like to arrange composite advertisements with surrounding councils sharing the same newspapers.
At previous Local Government elections, the General Manager had been required to advertise for the non-residential roll twice in the sixty day period prior to election day. Due to changes to the Regulation, General Managers were no longer required to conduct any advertising with the NSWEC undertaking these advertising responsibilities.
Processes covered by the statutory advertisements included the following:
nominations information; declaration of uncontested elections (where required); candidates and polling place information; and

REPORT ON THE 2008 LOCAL GOVERNMENT ELECTIONSNEWCASTLE CITY COUNCIL
35
election results.
There were in excess of 250 individual newspapers across NSW which councils nominated for the placement of the statutory advertisements. The majority of these advertisements were placed by the Returning Officer. Newcastle City Councilrequested that the statutory advertisements be placed in the following press:
Newcastle Herald
Advertising costs
The cost of a newspaper advertisement is based on the size of the advertisement and the rate charged by the newspaper. The NSWEC could not budget for the cost of the statutory advertisements for two main reasons:
a number of councils had commercial arrangements with the nominatednewspapers. The NSWEC was not privy to the council’s rates; and
the size and therefore cost of each advertisement varied depending on the information required for each council, candidate numbers and variations in the typesetting by individual newspapers.
The total advertising spend for the statewide advertising campaign was $1,521,388. The table below illustrates the components and costs of the statewide and statutory advertising campaign.
Table 9: 2008 Local Government Elections NSWEC advertising expenditure, $M – NSW
Advertisement NSW$M
NSW%
Enrolment 0.185 12.2Register electoral material 0.041 2.7Postal voting 0.253 16.6Nominations 0.196 12.9Candidates and polling places 0.550 36.1Uncontested elections 0.010 0.6Remember to vote 0.205 13.5Results 0.082 5.4TOTAL 1.522 100.0
More than half (57.6%) of the participants in the elector feedback survey indicated that they had heard about the elections from newspapers. The three topics most frequently recalled by participants from the NSWEC advertising campaign were:
‘Remember to vote’ (30.0%); ‘Candidates and polling places’ (21.7%); and ‘Enrolment’ (19.0%).
While there were no significant differences between males and females in how electors learnt of the elections, rural respondents were more likely to have heard from newspapers and from NSWEC advertising while less likely to have been advised of the elections from candidate material.

REPORT ON THE 2008 LOCAL GOVERNMENT ELECTIONSNEWCASTLE CITY COUNCIL
36
Election Information Brochure
In October 2007 the NSWEC wrote to all councils advising them of the availability of abrochure that could be sent to electors within their council area. Councils were provided with three options which included:
a household brochure mailed to each household in the Local Government area where one or more electors was enrolled; or
an elector brochure mailed to each elector in the Local Government area; or no brochure.
The brochure was customised for each council and served as a direct communication with electors. The brochure contained information such as key election dates, voting options and information specific to council including Returning Officer details and a list of pre-poll voting locations and polling places.
A positive response was received from 61 councils who confirmed their interest in the brochure as a communication piece for their constituents. The majority (53) of councils accepting the brochure opted for the household brochure with eight councils choosing an elector brochure.
Newcastle City Council opted not to have a brochure sent to electors.
Statewide 940,806 brochures were produced at a cost of $0.56 per brochure (including postage).
Of those electors who received a brochure and completed the NSWEC elector survey online, 86.1% indicated that the brochure partly covered the information theyrequired or that the information in the brochure clarified everything.
Participants were asked to nominate which areas of the brochure they found most useful and were able to nominate one or more areas they considered appropriate. The three areas of information on the brochure found to be most useful to those who received it included:
election timetable (56.5%); location of where to vote on election day (47.8%); and information on which council area and/or ward they were enrolled in (37.6%).
NSWEC Website
The NSWEC website is utilised by all election stakeholders as a quick and efficient way to acquire up to date and accessible election information. In readiness for the 2008 Local Government Elections the NSWEC undertook a review of the Local Government section to bring the content to a higher level of sophistication and to refine the site navigation.
As part of the new structure the NSWEC created a Local Government page from which stakeholders could source information on:
the election timetable;

REPORT ON THE 2008 LOCAL GOVERNMENT ELECTIONSNEWCASTLE CITY COUNCIL
37
election employment opportunities; enrolment requirements and online enrolment confirmation; council structures; information on referenda and polls; methods for voting; Local Government political parties; candidates; polling place lookup facility; and election results.
An enrolment search facility was placed on the NSWEC website to assist electors verify their enrolment information including their council and, where applicable, ward information. Polling place information provided on the website included accessibility information for electors with a disability.
To ensure availability of election information to council stakeholders the NSWEC requested that all councils provide a link on their websites to the NSWEC site.

REPORT ON THE 2008 LOCAL GOVERNMENT ELECTIONSNEWCASTLE CITY COUNCIL
38
Conduct of the Elections
Pre-election day
Electoral Roll Management
Residential RollIn NSW enrolment and voting are compulsory at all Federal, State and Local Government elections. The NSW electoral roll is managed by the AEC in conjunction with the NSWEC. Any person in NSW who met the enrolment criteria below was required to be enrolled for the 2008 Local Government Elections:
18 years of age or older; Australian citizens (or a British subject who was on an Australian electoral roll
on 25 January 1984); and living at their present address for at least the last month.
Legislation provides that for Local Government elections the electoral roll closes on the fortieth day before the day of the election. At the 2008 Local Government Elections the NSW electoral roll closed to new enrolments and changes to enrolment details at 6 pm on Monday, 4 August 2008.
At the close of rolls 4,544,395 electors were enrolled in NSW with 4,231,370 electors in areas with contested elections and 313,025 electors in areas with deferred or uncontested elections. The largest number of electors in a single contested area (that is an undivided council, excluding larger councils with wards) was Gosford City Council (113,763) with the smallest contested area being Urana City Council – B Ward (304).
There were a total of 104,017 electors on the residential electoral roll for Newcastle City Council.
Councils with Wards
Of the total electors in Newcastle City Council, 25,787 were enrolled in Newcastle First Ward, 25,708 were enrolled in Newcastle Second Ward, 25,328 were enrolled in Newcastle Third Ward, 27,200 were enrolled in Newcastle Fourth Ward.
The NSWEC's Corporate Plan 2008-2011 addresses enrolment as a key measure of the overall health of the electoral system. A Key Result Area in the Corporate Plan focuses on electoral roll management, specifically the accurate address coding of electors (Target = 100%). At the 2008 Local Government Elections the statewide known error rate of electors incorrectly coded was calculated as 0.01%. While this affected 369 electors in 12 council areas this is regarded as a satisfactory error rate.The NSWEC identified these errors prior to election day which allowed the NSWEC to formally write to each affected elector and notify the councils involved. Each affected elector was provided with their correct enrolment details, information on how to cast a section vote, locations where they could either pre-poll vote or vote on election day and a postal vote application.
No coding errors were known in Newcastle City Council.

REPORT ON THE 2008 LOCAL GOVERNMENT ELECTIONSNEWCASTLE CITY COUNCIL
39
Non-residential Roll
The non-residential roll of electors is a means to allow people who pay rates to a council for property they own, but do not occupy, to participate in the democratic process for that area. The non-residential roll lapses after each election. Electorsmust make a fresh application to appear on the roll for each election.
While the NSWEC undertook steps to promote non-residential enrolment as part of the advertising campaign, the responsibility of compiling the roll was with the council General Manager. All General Managers were required to prepare and certify a list of the potential electors who applied for the non-residential rolls and provide the list to the NSWEC.
Once the lists were received by the NSWEC, confirmation of electors was undertaken and successful applicants merged into the residential roll to produce the combined roll for each ward/area.
At the close of rolls 1,833 electors were on non-residential rolls across NSW. The council with the largest non-residential roll was Eurobodalla Shire Council with 421 electors (representing 1.6% of the total Eurobodalla roll). In Newcastle City Council, five electors were on the non-residential roll. This represents less than 0.01% of the total enrolment for Newcastle City Council.
Nomination Day
NominationsDue to an amendment of the Regulation, for the first time at the 2008 Local Government Elections the close of nominations and nomination day fell on the same day Wednesday, 13 August 2008. At previous Local Government elections close of nominations was 5 pm, two days prior to nomination day in order to allow candidates the chance to withdraw their nomination for election once all nominations had been received.
In order to nominate, candidates must be nominated by either a registered politicalparty or by at least two electors enrolled in the council or by at least two electors enrolled in the ward where applicable.
For a nomination to be accepted by the Returning Officer candidates were required to complete a nomination form and a Candidate Information Sheet. Compulsory fields on the Candidate Information Sheet included the candidate’s full name and enrolled address. Candidates were provided with the option of providing further personal information such as date of birth, occupation, trade and professional qualifications, organisation memberships, political party endorsement and a statement of policies. All Candidate Information Sheets were published on the NSWEC website and were made available for public inspection at the Returning Officer’s office.
As part of the nomination process, candidates were also required to pay a nomination deposit to the Returning Officer at the time of nomination. The nomination fee of $125 was applicable to all candidates, however, groups with five candidates or more were required to pay a maximum of $625 for the group to nominate.
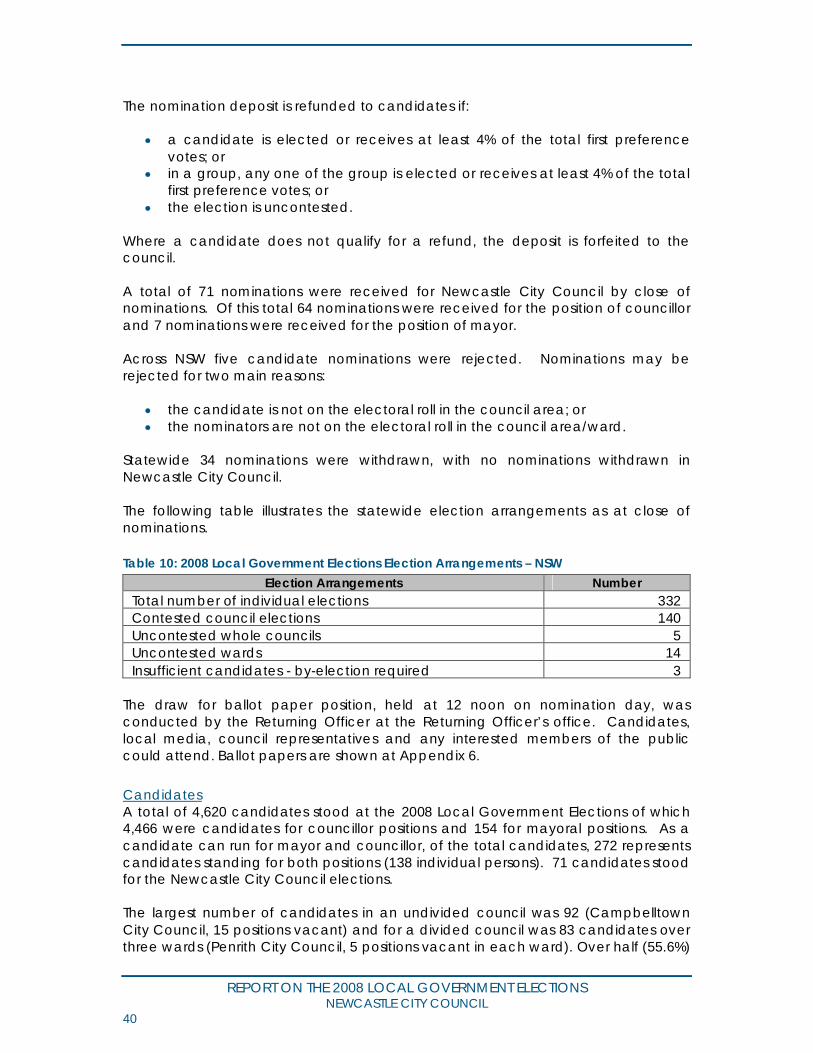
REPORT ON THE 2008 LOCAL GOVERNMENT ELECTIONSNEWCASTLE CITY COUNCIL
40
The nomination deposit is refunded to candidates if:
a candidate is elected or receives at least 4% of the total first preference votes; or
in a group, any one of the group is elected or receives at least 4% of the total first preference votes; or
the election is uncontested.
Where a candidate does not qualify for a refund, the deposit is forfeited to the council.
A total of 71 nominations were received for Newcastle City Council by close of nominations. Of this total 64 nominations were received for the position of councillor and 7 nominations were received for the position of mayor.
Across NSW five candidate nominations were rejected. Nominations may be rejected for two main reasons:
the candidate is not on the electoral roll in the council area; or the nominators are not on the electoral roll in the council area/ward.
Statewide 34 nominations were withdrawn, with no nominations withdrawn in Newcastle City Council.
The following table illustrates the statewide election arrangements as at close of nominations.
Table 10: 2008 Local Government Elections Election Arrangements – NSW
Election Arrangements NumberTotal number of individual elections 332Contested council elections 140Uncontested whole councils 5Uncontested wards 14Insufficient candidates - by-election required 3
The draw for ballot paper position, held at 12 noon on nomination day, was conducted by the Returning Officer at the Returning Officer’s office. Candidates, local media, council representatives and any interested members of the public could attend. Ballot papers are shown at Appendix 6.
CandidatesA total of 4,620 candidates stood at the 2008 Local Government Elections of which 4,466 were candidates for councillor positions and 154 for mayoral positions. As a candidate can run for mayor and councillor, of the total candidates, 272 representscandidates standing for both positions (138 individual persons). 71 candidates stood for the Newcastle City Council elections.
The largest number of candidates in an undivided council was 92 (Campbelltown City Council, 15 positions vacant) and for a divided council was 83 candidates over three wards (Penrith City Council, 5 positions vacant in each ward). Over half (55.6%)

REPORT ON THE 2008 LOCAL GOVERNMENT ELECTIONSNEWCASTLE CITY COUNCIL
41
of candidates were aged between 45-65 with 8.0% under 30 years of age and 6.9% aged over 70 years. The distribution of candidates across age categories as a statewide picture is shown below.
Graph 4: 2008 Local Government Elections Age Range of Candidates
0.0%
2.0%
4.0%
6.0%
8.0%
10.0%
12.0%
14.0%
16.0%18
-24
yrs
25-2
9 yr
s
30-3
4 yr
s
35-3
9 yr
s
40-4
4 yr
s
45-4
9 yr
s
50-5
4 yr
s
55-5
9 yr
s
60-6
4 yr
s
65-6
9 yr
s
70-7
4 yr
s
75-7
9 yr
s
80-8
4 yr
s
85-8
9 yr
s
Un
kno
wn
Metropolitan Rural Total
Males represented the majority of candidates at the 2008 Local Government Elections with 66.6% (3,077 candidates). Females represented the remaining third with 1,543 nominations. A higher proportion of male candidates stood in rural councils. Almost three-quarters of candidates elected were male (73.5%, 1,080) with females filling the remaining 389 positions (26.5%).

REPORT ON THE 2008 LOCAL GOVERNMENT ELECTIONSNEWCASTLE CITY COUNCIL
42
Graph 5: 2008 Local Government Elections Metropolitan and Rural Candidates Breakdown by Gender
61.70% 71.40%
38.30% 28.60%
0.0%10.0%
20.0%30.0%
40.0%50.0%
60.0%70.0%
80.0%
Metropolitan Rural
Female Male
For the councillor elections 1,588 candidates were affiliated by a registered political party while the remaining 3,032 candidates stood independently. The largest group of candidates affiliated by a registered political party were nominated by the Australian Labor Party (NSW Branch) (425) with the smallest number of candidates nominated by a party from the Australian Democrats (NSW Division) and The Fishing Party each with one candidate.
Table 11: 2008 Local Government Elections Statewide Candidates by Registered Political Party
Registered Political PartyNumber of candidates
%
Independent 3,032 71.2%Labor 425 10.0%Liberal 385 9.0%The Greens 355 8.3%Unity Party 56 1.3%Community First 34 0.8%Australian Business Party 24 0.6%Shoal Independents 21 0.5%Australia First Party 15 0.4%Eurobodalla First 15 0.4%Residents First 15 0.4%Shire Watch Independents 15 0.4%Country Labor Party 13 0.3%Holroyd Independents 13 0.3%Totally Locally Committed Party 12 0.3%Liverpool Community Independents Team 11 0.3%Our Sustainable Future 11 0.3%Shire Wide Action Group 11 0.3%

REPORT ON THE 2008 LOCAL GOVERNMENT ELECTIONSNEWCASTLE CITY COUNCIL
43
Registered Political PartyNumber of candidates
%
Wake Up Warringah 11 0.3%Clover Moore Independent Team 10 0.2%Community Development "Environment" Save Campbelltown Koalas 10 0.2%RAGAA 10 0.2%Save Our Suburbs 10 0.2%Socialist Alliance 10 0.2%STL 10 0.2%Bob Thompson's Independent Team 9 0.2%Christian Democratic Party (Fred Nile Group) 9 0.2%Russell Matheson Community First Team 9 0.2%Manly Independents 7 0.2%Albury Citizens and Ratepayers Movement 6 0.1%Central Coast First 6 0.1%No Parking Meters Party 6 0.1%Parramatta Better Local Government Party 6 0.1%Roads and Services 5 0.1%The Parramatta Independents 5 0.1%Burwood Community Voice 4 0.1%Kogarah Residents' Association 3 0.1%Lorraine Wearne Independents 3 0.1%Woodville Independents 3 0.1%Yvonne Bellamy Independents 3 0.1%Australian Democrats 1 0.0%The Fishing Party 1 0.0%TOTAL 4620 100.0%
Local Government Areas Requiring a By-election
In areas where the number of nominations received was less than the number of candidate positions available a by-election was conducted after election day. At the 2008 Local Government Elections three councils received less than the required number of nominations. These councils included:
Bland Shire Council (seven nominations received for nine positions); Warren Shire Council – A Ward (two nominations received for three positions);
and Wellington Council (seven nominations received for nine positions).
The candidates who nominated for the positions were declared elected on Saturday, 13 September 2008 and a by-election was held on Saturday, 29 November 2008 to fill the remaining positions.
Sufficient number of candidates stood for the by-elections to be conducted. In Wellington, seven candidates stood, in Bland six candidates and in Warren Ward A, two candidates. The gender profile did not vary greatly from that of the elections held earlier in September with one third of the total candidates for the November elections being female. The age range varied from 25 to 74 years. On this occasion, none of the candidates were nominated by a registered political party.

REPORT ON THE 2008 LOCAL GOVERNMENT ELECTIONSNEWCASTLE CITY COUNCIL
44
Details of the by-elections are provided below.
Table 12: By-elections by council, vacancies, candidates and enrolled electors, Saturday, 29 November 2008
CouncilNumber
VacanciesNumber
CandidatesNumber Enrolled
ElectorsBland Shire Council 2 6 4,337Warren Shire Council (A Ward) 1 2 443Wellington Council 2 7 5,618Total 5 15 10,398
Voters who could not vote in their council area could vote pre-poll at their local council office from Monday, 17 November 2008 up to 6pm on Friday, 28 November 2008 during normal business hours. Applications for postal voting closed at 5pm on Friday, 24 November 2008. The NSWEC conducted voting at Declared Institutions such as hospitals and nursing homes from Monday, 24 November 2008 until Wednesday, 26 November 2008.
Key election dates for the by-elections were:Event Date
Close of electoral rolls Monday, 20 October 2008Close of nominations Wednesday, 29 October 2008Pre-poll voting starts Monday, 17 November 2008Registration of ‘how-to-vote’ material closes Friday 21 November 2008Postal voting applications closes Monday, 24 November 2008Declared institution voting commences Monday, 24 November 2008Declared institution voting concludes Wednesday, 26 November 2008Pre-poll voting finishes Friday, 28 November 2008Election Day Saturday, 29 November 2008Return of postal votes closes Monday, 1 December 2008Distribution of preferences commences Tuesday, 2 December 2008
NSWEC permanent staff served as Returning Officers and travelled to the council area for key events such as close of nominations. This enabled containment of by-election costs.
The NSWEC posted first preference results representing approximately 85% of the ordinary votes cast on the NSWEC website from 6pm Saturday, 29 November 2008. These votes were recounted the next day along with votes cast during pre-polling or at Declared Institutions such as hospitals and nursing homes. Postal votes were accepted up until 6pm on Monday, 1 December 2008 and then included in the count.
The November by-elections were considered as part of the 2008 Local Government Elections as they were sufficiently close to election day on Saturday, 13 September 2008 to be regarded as part of the four yearly elections. In addition, there were economies of scale for councils if some operations were considered as part of the 2008 statewide exercise.
The successful candidates will hold office until September 2012, the balance of the original four year term.
REPORT ON THE 2008 LOCAL GOVERNMENT ELECTIONSNEWCASTLE CITY COUNCIL
45
Uncontested Elections
Elections are uncontested when the number of candidates nominated for election is equal to the number of councillors to be elected to the council or ward. Similarly, if there is only one nominee for the election of a mayor then that nominee is elected to the position of mayor without an election being conducted.
In five councils the number of nominations received for the position of councillor was equal to the number of available positions. These councils included:
The Council of the City of Botany Bay (six nominations received for six positions);
Carrathool Shire Council (ten nominations received for ten positions); Conargo Shire Council (eight nominations received for eight positions); Lockhart Shire Council (nine nominations received for nine positions); and Uralla Shire Council (nine nominations received for nine positions).
In 14 wards the number of nominations received for the position of councillor was equal to the number of available positions. These wards included:
Cabonne Shire Council – Yuranigh Ward (two nominations received for two positions);
Guyra Shire Council – Ward B and Ward C (two nominations received for two positions in each ward);
Ku-ring-gai Council – Wahroonga Ward (two nominations received for two positions);
Tenterfield Shire Council – Ward B and Ward C (two nominations received for two positions in each ward);
Urana Shire Council – Ward A and Ward C (three nominations received for three positions in each ward);
Walcha Council – Ward B, Ward C and Ward D (two nominations received for two positions in each ward); and
Weddin Shire Council – Ward B, Ward C and Ward E (two nominations received for two positions in each ward).
All candidates who nominated for the above positions were declared elected on Saturday, 13 September 2008 and electors in the uncontested ward or council were not required to vote in the 2008 Local Government Elections (with the exception of electors in Cabonne Shire Council – Yuranigh Ward, Ku-ring-gai Council - Wahroonga Ward and Weddin Shire Council – Ward B, Ward C and Ward E who were required to vote in their council referendum).
Deferred Elections
There were four councils which did not have elections in September 2008 due to being placed under administration. The councils involved were:
Broken Hill City Council; Port Macquarie-Hastings Council; Shellharbour City Council; and Wollongong City Council.

REPORT ON THE 2008 LOCAL GOVERNMENT ELECTIONSNEWCASTLE CITY COUNCIL
46
These councils were placed under administration in early 2008, with the exception of Broken Hill City Council which was placed under administration in January 2007. Broken Hill City Council will return to democracy on Saturday, 5 December 2009 while the remaining council elections have been deferred until 2012.
Ballot Paper Printing
Unlike practices in previous years where some councils arranged for the printing of their own ballot papers, for the 2008 elections the NSWEC centrally arranged the printing of all ballot papers by a contracted printing company. This ensured greater quality control and consistency in the ballot paper formats and styles.
A total of 291 unique ballot papers were produced for the various election contests with 8.9 million ballot papers printed at a cost of $0.16 per small ballot paper (generally single column and mayoral election ballot papers) and $0.39 per large ballot paper (generally above the line voting ballot papers).
Ballot papers for Newcastle City Council can be found at Appendix 6.
Staffing
Staffing is a significant cost driver for elections and as such the NSWEC recognises the importance of accurately predicting the number of required staff while taking into consideration the associated costs without compromising the level of service to electors.
The level of staffing required at the Returning Officer’s office varied during the different phases of the election. These staff were employed to administer a variety of tasks including:
office setup; engaging polling place staff; packing materials for each polling place; registration, distribution and receipt of postal votes; operation of pre-poll voting; visits to Declared Institutions; counting of the votes; and office pack-up.
The required number of election officials to work at polling places on election day is calculated through a formula based on the predicted number of electors who will attend the polling place. Accurately predicting the number of required staff presents challenges to ensure the appropriate number of staff without over resourcing which can result in unnecessary increases in costs. Estimating the number of electors who will attend each polling place is not an exact science.
The changing of council ward boundaries can have some negative impacts on the staffing estimates as predicted vote numbers previously allocated to polling places need to be redistributed with minimal data available to base decisions.
All polling places must have a minimum of two staff, one of whom is the polling place manager. Staff roles at polling places are:
REPORT ON THE 2008 LOCAL GOVERNMENT ELECTIONSNEWCASTLE CITY COUNCIL
47
Polling place manager:o manages the polling place and all polling place staff.
Deputy polling place manager:o employed in some larger polling places.
Ordinary vote issuing officer:o issues ballot papers to enrolled electors (ordinary voters).
Ballot box guard:o guards the ballot boxes;o ensures electors place completed ballot papers in ballot box before
leaving the polling place;o indicates the exit for voters leaving the polling place; ando relieves ordinary vote issuing officers during breaks.
Enquiry officer:o controls queue and flow of electors to issuing tables;o deals with elector enquiries;o assists voters who need help;o keeps the polling place in a clean and tidy condition;o relieves ordinary vote issuing officers during breaks; ando assists the polling place manager to issue ‘Name not on roll’ and
‘Name already marked as voted’ votes.
Scrutiny assistant:o employed after 5.30pm;o deconstructs voting screens;o assists in counting ballot papers; ando assists in returning the venue to pre-lease condition.
While prior electoral experience is not necessary to work at an election, people interested in the office assistant positions required previous work experience in an office environment, high level customer service skills and the ability to undertake tasks quickly and accurately under minimum supervision. People recruited to work in polling places needed excellent customer service skills and the patience to undertake repetitive duties accurately over a long period.
In Newcastle City Council, the NSWEC appointed 364 election officials to work at the 66 appointed polling places and the Returning Officer’s Office. The statewide ratio of polling place staff (working between 8am and 6pm on Election Day) to electors was 1:398. For Newcastle City Council the ratio was 1:369.
Newcastle City Council polling places on average took 97% of the projected votes. This is higher than the state average of 91% of the projected votes but on par with the average for large councils (over 60,000 electors).
Predicted votes at polling places are available in Appendix 5.
A staffing breakdown for Newcastle City Council can be found in the table below. The Returning Officer and Returning Officer Support Officer are in addition to these staff.

REPORT ON THE 2008 LOCAL GOVERNMENT ELECTIONSNEWCASTLE CITY COUNCIL
48
Table 13: 2008 Local Government Elections Categories of Election Staff – NSW and Newcastle City Council
Staff Categories NSW Newcastle City CouncilOffice assistants 2,326 82Polling place managers 2,205 56Deputy polling place managers 811 12Election officials 7,607 173Scrutiny assistants 635 41TOTAL 13,584 364
The NSWEC endeavoured to recruit election officials from culturally and linguistically diverse backgrounds to work on election day to provide language assistance to electors where required. Statewide, 14.0% of election day staff indicated that they spoke a language other than English. The NSWEC recognises that there were insufficient staff from culturally and linguistically diverse backgrounds to assist in some areas with diverse communities. The NSWEC will re-assess recruitment strategies to further engage election officials from diverse backgrounds.
Of the election day staff who participated in the feedback survey 75.8% indicated that the number of staff was sufficient to deal with the uneven flow of electorsthroughout election day. Some election officials did, however, indicate thatadditional staff members to work at the polling place would be beneficial to minimise congestion within the polling place. The vast majority of participants indicated that there was sufficient staff after the close of polls to assist with sorting and counting ballot papers.

REPORT ON THE 2008 LOCAL GOVERNMENT ELECTIONSNEWCASTLE CITY COUNCIL
49
Early Voting
Pre-poll Voting
At the 2008 Local Government Elections pre-poll voting was available to those electors who met at least one of the following criteria set out in the legislation:
were not within the ward or area for which the election was being held on election day;
were not within 8 kilometres of any polling place within their council area or ward on election day;
were travelling under conditions that prevented them from attending a polling place to vote;
were unable to attend a polling place to vote for religious beliefs; were caring for another person who requires his or her care for medical
reasons and so were prevented from attending at any such polling place to vote; or
were working throughout the hours of voting on election day.
Electors meeting the above criteria were provided with the opportunity to cast their vote in the two weeks prior to election day with pre-poll voting open from Monday, 1 September 2008. Pre-poll voting closed in all locations at 6 pm on Friday, 12September 2008.
197 pre-poll voting centres were available across NSW in the lead up to election day, of which 78.2% (154) were fully wheelchair accessible. One pre-poll voting centre was open for electors in Newcastle City Council. Pre-poll voting centre hours of operation were the same as council hours.
Table 14: 2008 Local Government Elections Pre-poll Voting Centre Details
Pre-Poll Venue Name
Pre-poll Address Hours of Operation Accessibility
Newcastle RO Office
Shop 1, 473-475 Hunter Street, Newcastle
Mon 1 Sept to Thur 11 Sept 8.30am to 5pm; Fri 12 Sept 8.30am to 6pm
Yes
A total of 308,735 (8.7% of the total votes cast) pre-poll votes were cast across NSW of which 4,211 were cast in Newcastle City Council.
After election day General Managers were asked to respond on the selection of pre-poll voting centres in their area in terms of the location, number available and accessibility for electors with a disability. A high level of overall satisfaction amongst the General Managers was achieved as illustrated in the below table.

REPORT ON THE 2008 LOCAL GOVERNMENT ELECTIONSNEWCASTLE CITY COUNCIL
50
Table 15: 2008 Local Government Elections Satisfaction with Pre-poll Voting Centres – NSW (%)
Pre-Poll Very unsatisfactory
Unsatisfactory Neutral Satisfactory Very satisfactory
Location 0.0 12.9 5.9 55.4 25.7Number available
0.0 8.9 12.9 58.4 19.8
Accessibility 0.0 6.9 9.9 58.4 24.8Note: The percentages in the above table may not add to 100 as the missing responses were not reported.
Of the electors who participated in the feedback survey, one third (33.1%) indicatedthat they knew about pre-poll voting because they voted using pre-poll at a previous election. Other major ways participants found out about pre-poll voting was from the NSWEC website (23.1%) or newspaper advertisements (23.1%).
Pre-poll participants rated their satisfaction with a variety of areas as listed in the following table.
Table 16: 2008 Local Government Elections Satisfaction with the Pre-poll Voting Process – NSW (%)
Very unsatisfactory
Unsatisfactory Neutral Satisfactory Very satisfactory
Location 10.7 14.9 14.0 36.4 23.1Time taken 10.7 12.4 12.4 39.7 22.3Accessibility 9.1 14.0 12.4 42.1 19.8Information 19.0 14.9 25.6 29.8 7.4
Note: The percentages in the above table may not add to 100 as the missing responses were not reported.
Postal Voting
Postal voting services were provided to those electors who were unable to cast their vote on election day at a polling place for any of the following reasons prescribed in the legislation:
will not be within the ward or area for which the election is being held on election day;
will not be within 8 kilometres of any polling place within their council area or ward on election day;
will be travelling under conditions that prevent them from attending a polling place to vote;
due to illness, disability or approaching maternity are prevented from attending a polling place to vote;
are unable to attend a polling place to vote for religious beliefs; incarcerated; caring for another person who requires his or her care for medical reasons and
so will be prevented from attending at any such polling place to vote; will be working throughout the hours of voting on election day; or a silent elector.
Electors who are registered as a Registered General Postal Voter at the State level are not required to register again for Local Government elections and were therefore automatically sent postal vote ballot papers. Electors wanting to become Registered General Postal Voters could apply up until 6pm, Monday 4 August 2008.

REPORT ON THE 2008 LOCAL GOVERNMENT ELECTIONSNEWCASTLE CITY COUNCIL
51
Applications for postal voters opened on nomination day with electors able to obtain applications from the NSWEC website, the NSWEC head office or the Returning Officer’s office. Postal vote applications closed on Monday, 8 September 2008.
In order to be admitted to the count postal votes needed to be received by the Returning Officer by 6 pm, Monday, 15 September 2008. Statewide 134,802 votes were cast by electors who voted by post at the 2008 Local Government Elections. This represents 3.8% of the total votes cast at the 2008 elections. A total of 3,455postal votes were admitted to the count for Newcastle City Council. A proportion of those returned were unable to be admitted to the count for reasons including late return, an incomplete or incorrect declaration or the declaration not being signed by the elector.
Of the electors who participated in the elector feedback survey and who postal voted, 40.0% indicated that they knew about postal voting because they had doneso at a previous election, followed by 20.0% who found out about postal voting from the NSWEC website. Postal voting participants rated their satisfaction with a variety of areas, which are listed in the following table.
Table 17: 2008 Local Government Elections Satisfaction with Postal Voting Process – NSW Overall (%)
Very unsatisfactory
Unsatisfactory Neutral Satisfactory Very satisfactory
Applying 6.7 6.7 11.1 44.4 24.4Timeliness 4.4 8.9 6.7 35.6 37.8Instructions 4.4 11.1 11.1 44.4 24.4Information 4.4 0.0 17.8 53.3 17.8
Note: The percentages in the above table may not add to 100 as the missing responses were not reported.
Declared Institutions
The Electoral Commissioner has the authority to appoint hospitals, nursing homes, retirement villages and like facilities as Declared Institutions to assist the residents and/or patients of these facilities who are unable to attend a polling place on election day.
In the lead up to the election the NSWEC wrote to all Declared Institutions used at the 2007 State Election asking if they would like to be listed as a Declared Institution for the 2008 Local Government Elections. Of the 521 responses received, 81 statedthat they would prefer that postal vote applications be provided to their residents.
Election officials visited Declared Institutions across NSW from Monday, 8 September until Wednesday, 10 September 2008.
A total of 9,421 votes were cast in Declared Institutions across the State (0.3% of total votes cast). 140 of these votes were cast at the Declared Institutions in Newcastle City Council.
From the feedback survey of electors undertaken on the NSWEC’s conduct of the elections, less than 1% indicated that they voted at a Declared Institution.

REPORT ON THE 2008 LOCAL GOVERNMENT ELECTIONSNEWCASTLE CITY COUNCIL
52
Statistically, this figure is too small to be able to use to draw meaningful and valid conclusions.
Mobile Voting
Mobile voting was trialled in five council areas encompassing nine remote locationsin far west and northern NSW from Monday, 1 September 2008. Further information on mobile pre-poll voting is available on under the Election Preparation section.
Of those respondents who participated in the elector survey, less than 1% voted using mobile polling booths. Statistically, this figure is too small to be able to use to draw meaningful and valid conclusions.

REPORT ON THE 2008 LOCAL GOVERNMENT ELECTIONSNEWCASTLE CITY COUNCIL
53
Election Day Voting
Voting
The vast majority of votes cast at the 2008 Local Government Elections were ordinary votes cast at a polling place on election day, Saturday, 13 September 2008. Of the total formal votes cast statewide 79.9% (2,821,087) were cast in polling places across NSW on election day. In Newcastle City Council 83.5% of the total votes were cast at polling places available to electors.
Three types of votes are distributed to electors on election day. The type of vote the elector receives is determined by their individual circumstance and includes:
Ordinary o Issued to an elector whose name and address is on the roll at the
polling place.
Silento Issued to an elector whose name appears on the roll but their address
has been suppressed.
Section Voteo Name Not On Roll
Issued to an elector whose name cannot be found on the roll but claims to be entitled to vote; and
o Name Already Marked As VotedIssued to an elector whose name is already marked off as having voted, or whose roll number appears on the Polling Centre report, but claims not to have voted.
Unlike State and Federal elections, and as legislated in the Act, absent voting is not available at NSW Local Government elections for electors who are outside their council area or ward on election day. This presents some difficulties for the NSWEC as electors are often familiar with the use of absent voting at the State and Federal level and are unaware of the restrictions at the Local Government level. While the NSWEC statewide advertising campaign endeavoured to better inform electors of the arrangements, unfortunately some electors still attempted to absent vote outside their council area.
Statewide, 103 (4.1%) polling places exceeded the number of predicted votes by over 500 votes, 129 (5.2%) polling places exceeded projections by between 250-500 votes and 295 (11.8%) polling places were 500 or more votes below the predicted number of votes. The predicted and actual number of votes cast at polling places in Newcastle City Council on election day is available at Appendix 5.
Polling Places
The establishment of polling places for election day is a major component of the election preparation for the NSWEC and the Returning Officers. It is a difficult balance to select the number of polling places to meet the needs of the community

REPORT ON THE 2008 LOCAL GOVERNMENT ELECTIONSNEWCASTLE CITY COUNCIL
54
while keeping costs to a minimum. These issues present the NSWEC head office and the local Returning Officer with challenges that cannot be met through an exact science but are determined by a series of formulas.
Prior to determining a draft list of polling places for council’s review, the NSWEC undertook a full review of polling places across NSW. Every polling place previously used by the NSWEC was re-assessed for its suitability using historical polling place data, mapping data, census data from the Australian Bureau of Statistics and existing reports and other relevant information sourced from previous elections.
In the lead up to the election the NSWEC provided Newcastle City Council with a draft list of proposed polling places to be used for the election. The list contained polling places similar to those used at the NSW State General Election in 2007. Newcastle City Council was asked to consider the list and provide the NSWEC with comments on additional or alternative venues or comments on polling places that they believed were not required. Comments from Newcastle City Council received by the NSWEC were taken into consideration prior to the final selection of polling places.
On election day 2,597 polling places were available across NSW with 66 available to the electors of Newcastle City Council. In addition to ordinary polling places, this total could include hospitals, multi ward and multi council polling places. The principal polling place was located at New Lambton South Public School, which was available to all electors enrolled in Newcastle City Council.
As a general rule in council areas with wards, polling places only issue votes to electors enrolled for the ward where the polling place is located. In recognition that there is no absent voting in Local Government elections, there is provision for some polling places to issue votes for a larger area, such as:
principal polling places to issue votes for all wards of the council; multi ward polling places located close to ward boundaries to issue votes for
both the ward(s) in which it was located as well as the ward(s) it adjoined; and
multi council polling places where a single premise served as a polling place for two or more council areas.
Statewide there were 65 principal polling places, 152 multi ward polling places (for adjoining wards), 62 multi council polling places (for two or more council areas) and six multi ward and multi council polling places (for two or more council areas and adjoining wards).
There is a Memorandum of Understanding between the NSWEC and the NSW Department of Education and Training for the use of schools and TAFE NSW facilitiesas polling places and this provides more certainty for the NSWEC about availability. At the 2008 Local Government Elections, 60.5% (1,571) of polling places used by theNSWEC were NSW Department of Education and Training facilities. The remainder were sourced from private schools, community halls, community centres, church facilities and other facilities.
Where possible, the NSWEC leased wheelchair accessible venues as polling places. While the NSWEC does not own any of the venues used for voting it is committed to

REPORT ON THE 2008 LOCAL GOVERNMENT ELECTIONSNEWCASTLE CITY COUNCIL
55
providing the best possible voting facilities for electors with a disability and understands the importance of providing accurate accessibility information to the public.
The NSWEC undertook an audit of the accessibility status of all polling places against information supplied by the AEC. Polling place accessibility information was provided to the Returning Officers for review at the local level along with a list of criteria used by the AEC in assessing accessibility from the car park to the voting area but not including items such as wheelchair accessible toilets. All criteria provided to the Returning Officer were required to be met for a polling place to be deemed fully accessible. Statewide 549 (21.1%) of polling places had full wheelchair access and 1,103 (42.5%) had partial wheelchair access. Newcastle City Council had fiveaccessible polling places and 38 with assisted access.
Polling places were open to electors on election day from 8 am to 6 pm. Feedback from election staff indicates that the majority of electors attended polling places in the morning (75.9% of election staff indicated that the busiest time of the day was between 8 am and 11 am) with a small peak in the hour prior to the close of polls. Quieter periods were experienced generally in the early afternoon.
Feedback from electors who participated in the survey and who voted at a polling place on election day indicates that people most frequently choose their voting location based on past elections (56.8% “Voted same place as I always go”) followed by those who knew where to go from a newspaper advertisement (19.4%).
Almost three-quarters of the participants (72.2%) reported that they were satisfied or very satisfied or neutral with the overall process while areas that rated particularly well included:
convenience of polling place location (87.4%); accuracy of polling place accessibility information (84.2%); and manner of staff (89.9%).
The following table illustrates the levels of satisfaction with the listed areas on a statewide basis.
Table 18: 2008 Local Government Elections Electors’ Satisfaction with Polling Place Voting –NSW (%)
Very unsatisfactory
Unsatisfactory Neutral Satisfactory Very satisfactory
Convenience 8.8 3.1 5.9 35.0 46.5Length of time 15.1 6.0 5.7 33.1 39.1Information 10.9 7.3 17.2 36.3 26.1Layout 9.5 6.8 10.4 42.6 29.3Accessibility 9.1 6.5 9.9 43.3 29.2Accuracy of accessibility
8.3 4.5 23.3 36.5 24.4
Manner of staff
5.9 2.8 9.2 35.7 45.0
Assistance provided
5.8 3.1 20.0 27.2 30.3
Note: The percentages in the above table may not add to 100 as the missing responses were not reported.

REPORT ON THE 2008 LOCAL GOVERNMENT ELECTIONSNEWCASTLE CITY COUNCIL
56
In their feedback survey, General Managers were asked to respond on the selection of polling places in terms of the location, number available and accessibility for electors with a disability. Statewide, a high level of overall satisfaction was achieved in all areas illustrated in the below table.
Table 19: 2008 Local Government Elections Satisfaction with Polling Places – NSW Overall (%)
Polling Place Very unsatisfactory
Unsatisfactory Neutral Satisfactory Very satisfactory
Location 2.0 4.0 9.9 69.3 14.9Number available
2.0 4.0 9.9 70.3 13.9
Accessibility 3.0 4.0 12.0 67.0 14.0
The NSWEC received some complaints from stakeholders about polling places running out of ballot papers at various times throughout election day. Subsequent to receiving these complaints, the NSWEC undertook an assessment of polling place managers to determine actual figures on the number of polling places without ballot papers, the length of time a polling place was without ballot papers and the approximate number of electors affected. Statewide, 16 (0.6%) polling places ran out of ballot papers for a period of time on election day.
In Newcastle City Council no polling places ran out of ballot papers.
How-to-vote material
All electoral material to be distributed by candidates or their representatives on election day must be registered by the NSWEC. Registration does not apply to posters, whether they are displayed before or on election day, nor is it required for material to be distributed before election day.
Candidates were required to provide an application form and a copy of each item to be registered to the Returning Officer by Friday, 5 September 2008. The NSWEC provided candidates with guidelines to assist them to meet the registration requirements.
All Returning Officers had the authority to register how-to-vote material that met the requirements. In the circumstance where the Returning Officer was unsure if the material was appropriate for registration the material was referred to the NSWEC head office for resolution.
Election Day Issues
Polling place managers were required to complete an incident report for any major incidents occurring in or outside the polling place involving electors, party workers or election officials. These incidents generally include any accidents or confrontations. This assists the NSWEC in managing occupational health and safety issues at the polling place and ensures that, where accidents arose, an appropriate record was taken.
REPORT ON THE 2008 LOCAL GOVERNMENT ELECTIONSNEWCASTLE CITY COUNCIL
57
Post Election Day
Counting the Votes
The accuracy of vote counting and the impartiality of this process are key tenets of electoral administration. The counting of results is a complex process, prescribed by legislation, to ensure accuracy in the results.
Across NSW 332 election contests were held at the 2008 Local Government Elections which included 271 councillor elections (84 undivided council areas, 187 wards), 27 mayoral elections, 17 referenda (17 questions for 15 councils) and 17 polls (17 questions for eight councils).
The method of counting votes for Local Government elections is set out in the Regulation. Votes for Newcastle City Council election of councillors were counted using the Proportional Representation (PR) method.
Timetable for Counts The time taken to count results varied from council to council depending on the size of the council, voting system and timetable position (for counts conducted at the LGCC). Counting at the Local Government Counting Centre for the 2008 Local Government Elections was completed three days ahead of schedule.
Local CountsAll elections using Optional Preferential voting were counted locally at the Returning Officer’s office. Some councillor elections, all mayoral elections, all referenda and all polls were counted locally by the Returning Officer. Statewide, 106 councillor elections, 27 mayoral elections, 17 referendum questions, 17 poll questions and a recount at Leeton Shire Council were counted locally by the Returning Officer.
On election night all polling places conducted an initial count of first preference votes. On the Sunday, 14 September 2008 the Returning Officer conducted a check count of all the ballot papers counted on election night. The check count was conducted at the Returning Officer’s office with scrutineers able to attend. Final distribution of preference counts conducted locally commenced on Tuesday, 16 September 2008.
Local Government Count Centre (LGCC) CountsThe NSWEC established a Local Government Count Centre (LGCC) at its Riverwood warehouse to conduct the count of ballot papers for councils using the Proportional Representation voting system. A total of 165 elections (plus the Manly Council recount) were counted at LGCC.
All councils counted at the LGCC were scheduled to be counted between Tuesday, 16 September and Monday, 22 September 2008. The data entry schedule and count status for each council was placed on the NSWEC website.
For the count to commence ballot paper information was entered into a computer programme by approximately 400 data entry operators, working over two eight hour shifts per day and managed by senior NSWEC staff.

REPORT ON THE 2008 LOCAL GOVERNMENT ELECTIONSNEWCASTLE CITY COUNCIL
58
To increase accuracy in results, all ballot papers were put through two data entry rounds and, where any discrepancies arose, a third verification round was applied. Before running each vote count, data entry totals were reconciled against election night figures to ensure totals were complete and correct.
Observation TeamThe NSWEC established an independent Observation Team to observe the operations of the LGCC. The Observation Team was established to give candidates, registered political parties and members of the public confidence in the integrity, effectiveness and efficiency of the centralised count of ballot papers.
In July 2008 the NSWEC established six Terms of Reference against which the Observation Team reported. The Team was provided with detailed briefings on all aspects of the central count operations and copies of all documentation relating to the counting operations and visited the central count operation during the data entry process.
In October 2008 the Observation Team reported back to the NSWEC and concluded the following:
“The team was impressed with the count process and could not fault it, and feel that scrutineers and candidates should have no concerns regarding process, transparency and integrity of the central count conducted by the NSWEC”.
The Team provided a series of recommendations for the NSWEC’s consideration for future elections. The recommendations covered areas such as:
occupational health and safety management; practical design layout; security issues; management of scrutineers; and disaster recovery.
ReferendaReferenda were counted on Saturday night in each polling place with postal ballot papers and pre-poll votes included in the count in the week after election day. Once finalised the referenda results were posted on the NSWEC Virtual Tally Room.
PollsPolls were counted on election night with all postal and pre-poll votes included in the count in the week following election day. Once finalised the poll results were posted on the NSWEC Virtual Tally Room.
RecountsOnce a result is declared by the NSWEC, candidates have a twenty-four hour window to request a recount of the ballot papers for the council or ward if they wish to dispute the outcome. Scrutineers are permitted to be present at a recount and can challenge the formality of any ballot papers for the Returning Officer’s final determination (at the discretion of the NSWEC).

REPORT ON THE 2008 LOCAL GOVERNMENT ELECTIONSNEWCASTLE CITY COUNCIL
59
Recounts were held for Leeton Shire Council - A Ward and Manly Council (at the request of The Greens and paid for by The Greens) with no change to the results for either council.
Some enquiries were received by the NSWEC from candidates requesting recounts. The Electoral Commissioner determined that the recounts were not necessary and therefore did not agree to cover the associated costs. The requesting candidates also did not agree to cover the costs and subsequently recounts were not undertaken.
Timeliness of ResultsThe overall schedule set by the NSWEC for declaration of results was met although the results for some councils were not to councils’ expectations. The NSWEC acknowledges that it needs to improve its management of communication to councils, parties, groups and candidates about the progress of the count.
For the 2012 Local Government Elections, the NSWEC will establish and communicate clearly to all councils, a schedule for the counting and declaration of results. Performance against this schedule will then be assessed.

REPORT ON THE 2008 LOCAL GOVERNMENT ELECTIONSNEWCASTLE CITY COUNCIL
60
Results
Participation
A total of 3,529,220 votes were cast in councillor elections across NSW with formal votes for councillor elections totalling 3,278,188 and informal votes 251,032. Voter participation is a measure of the total number of votes cast for the councillor elections as a percentage of the eligible enrolment (that is the number of electors in areas with contested elections). The statewide voter participation at the 2008 Local Government Elections was 83.4%. This figure is slightly lower than the 2004 Local Government Elections participation rate (85.2%3).
Table 20: 2008 Local Government Elections Voter Participation
NSW Newcastle City Council
Number of electors enrolled to vote in contested areas
4,231,370 104,022
Votes (councillor elections only, including all types)
3,529,220 86,369
Participation rate 83.4% 83.0%
For Newcastle City Council voter participation was calculated to be 83.0%. Voter participation as calculated for each ward is shown below:
Newcastle First Ward 79.2% Newcastle Second Ward 82.0% Newcastle Third Ward 84.2% Newcastle Fourth Ward 86.6%
The highest voter participation rate for a council was recorded in Gundagai Shire Council (89.1%) and the lowest in Central Darling Shire Council (63.6%).
The five councils with the highest participation rates as a percentage of the enrolment were:
Gundagai Shire Council 89.1% Temora Shire Council 88.9% Upper Lachlan Shire Council 88.6% Blayney Shire Council 88.3% Mid-Western Regional Council 88.3%
The five councils with the lowest participation rates were: Central Darling Shire Council 63.6% Woollahra Municipal Council 68.5% Sydney City Council 69.6% North Sydney Council 70.7% Mosman Municipal Council 71.3%
3 Methodological issues make strict comparisons between the 2004 and 2008 Local Government Elections difficult.

REPORT ON THE 2008 LOCAL GOVERNMENT ELECTIONSNEWCASTLE CITY COUNCIL
61
There is no significant variation in the comparative participation levels when assessing rural participation (average 83.6%) against metropolitan participation (average 82.0%).
While the NSWEC compares favourably with other jurisdictions when comparing voter participation rates at Local Government elections, it is unreliable to compare participation trends in Australia due to the nature of the different voting systems. While voting in Local Government elections is compulsory in NSW, Queensland, Victoria and the Northern Territory, voting is not compulsory at the Local Government level in the remaining jurisdictions.
Voting methods for Local Government elections across Australia include:
full attendance voting – New South Wales; full postal voting – South Australia and Tasmania; combination of attendance and postal voting – Queensland, Victoria,
Western Australia; and combination of attendance and mobile voting – Northern Territory.
Councillor Election Results
All councillor ballot papers for Newcastle City Council were counted at the Local Government Counting Centre in Riverwood. The 12 candidates who received sufficient votes for election were declared elected to Newcastle City Council by the Returning Officer. A list of elected councillors is available at Appendix 7.
Of the formal votes cast for the councillor elections some:
4,211 were cast in a pre-poll voting centre; 3,455 were cast as a postal vote; 140 were cast at a Declared Institution; and 72,134 were cast in a polling place on election day.
Statewide formality was recorded at 92.9% with an informality rate of 7.1%. From the total votes cast in the Newcastle City Council councillor election 92.7% were formal (80,084) with the remaining 7.3% deemed informal (6,285).
The five councils with the highest formality rates were:
Hay Shire Council 98.7% Murrumbidgee Shire Council 98.4% Temora Shire Council 98.3% Coonamble Shire Council 98.2% Boorowa Council 97.9%
The five councils with the lowest formality rates were:
Liverpool City Council 87.1% Fairfield City Council 87.3% Canterbury City Council 88.9% Griffith City Council 89.1% Warringah Council 89.1%

REPORT ON THE 2008 LOCAL GOVERNMENT ELECTIONSNEWCASTLE CITY COUNCIL
62
The significant influences upon informal voting have been reported as including a higher than average number of candidates, a high proportion of citizens from non-English speaking backgrounds, differences between electoral systems and proximity to other electoral events.
Mayoral Election Results
All mayoral election ballot papers for Newcastle City Council were counted locally at the Returning Officer’s office. Of the seven mayoral candidates who stood for the position, John Tate was declared to be elected as mayor of Newcastle City Councilby the Returning Officer on Thursday, 18 September 2008.
Voter participation in the mayoral election for Newcastle City Council was calculated to be 82.9%.
Feedback on Results
Over 95% of candidates that participated in the feedback survey indicated that they reviewed the results on the NSWEC website. High levels of satisfaction were recorded with over 70% rating the presentation (72.9%) and accuracy (71.2%) as satisfactory or very satisfactory. Presentation of the results and accuracy of the results were also rated highly. The timeliness of updates was rated less well.
Table 21: 2008 Local Government Elections Results information satisfaction – NSW (%)
Very unsatisfactory
Unsatisfactory Neutral Satisfactory Very satisfactory
Ease of understanding
3.5 7.2 17.9 53.8 17.5
Presentation 3.4 6.3 17.4 56.7 16.2Timeliness of updates
13.6 15.9 21.4 36.7 12.4
Accuracy 2.8 2.5 23.5 51.5 19.7
Of the electors who participated in the feedback survey 1,556 participants indicated that they sought results information. Slightly more than half of the participants (51.3%) found out the results on the NSWEC website followed by the newspaper (19.5%). Of the participants who viewed the election results on the NSWEC website over half (58.1%) said they reviewed the results the Sunday after election day.
Declaration of the Poll
On 23 September 2008, the Returning Officer, Cathy Cole, declared the results of the Newcastle City Council election.
Once the declaration paperwork had been signed, the Returning Officer provided copies of the paperwork to the Electoral Commissioner, the council General Manager, the Director General of the Department of Local Government and the Secretary of the Local Government and Shires Associations. In addition, the Returning Officer advised all candidates either by phone, email or SMS that the election results were available on the NSWEC website. Election results were also published in local press and appeared on the NSWEC Virtual Tally Room.
Some council General Managers expressed a level of dissatisfaction at the time taken for the Returning Officer to declare the results for their council area. The count

REPORT ON THE 2008 LOCAL GOVERNMENT ELECTIONSNEWCASTLE CITY COUNCIL
63
is conducted in a highly legal environment and involves varying levels of complexity depending on the type of count. At the 2008 Local Government Elections the NSWEC centralised the count of ballot papers using the proportional representation system, in an effort to make the process more efficient in order to deliver the election results faster. Further information on the LGCC is available under the section titled Counting of the Votes.
Failure to Vote
Under electoral legislation, the NSWEC was required to issue ‘failure to vote’ notices to those electors whose names were not marked off the electoral roll as having voted or as having provided a valid excuse. All electoral rolls marked at polling places and in the Returning Officer’s office were scanned after election day to create a list of non-voters for each council area. The penalty for failing to vote without a valid reason at the 2008 Local Government Election is $55.
Across NSW some 672,794 electors failed to vote at the 2008 Local Government Elections. Of these, 16,847 electors failed to vote in Newcastle City Council of which 9,879 were issued with a penalty notice. Penalty notices provide the elector with the option of:
advising, in writing, their reason for not voting; claiming they did vote and providing details of where they voted; paying the penalty; or applying for the matter to be heard by a Court.
The five councils with the lowest non-voter rate as a percentage of enrolment were:
Gundagai Shire Council 10.0% Blayney Shire Council 10.5% Temora Shire Council 10.7% Upper Lachlan Shire Council 10.8% Bathurst Regional Council 11.0%
The five councils with the highest non-voter rate included:
Woollahra Municipal Council 29.4% Central Darling Shire Council 29.2% Council of the City of Sydney 28.9% North Sydney Council 28.5% Waverley Council 27.7%
Table 22: 2008 Local Government Elections Non-voter Statistics Comparisons
2004 Local Government
Elections
2007 State General Election
2008 Local Government
ElectionsRoll 4.091M 4.374M 4.544M4
Non-voters 456,791 318,095 672,794Exclusions 83,857 166,004 274,345Fine $55 $25 $55Notices issued 372,934 152,091 398,489
4 4.231m in contested areas

REPORT ON THE 2008 LOCAL GOVERNMENT ELECTIONSNEWCASTLE CITY COUNCIL
64
Penalty notices as % of roll 9.1% 3.5% 8.8%State Debt Recovery Office referrals
102,769 57,842 130,697
At previous elections little research has been undertaken into the reasons anddemographics of electors who fail to vote. As a first for the NSWEC, following the 2008 Local Government Elections the NSWEC undertook an evaluation of non-voter demographics focusing on age, location and gender in order to identify any specific groups who are under represented in the voting process. By identifying these groups the NSWEC will be in a more informed position when addressing advertising needs at future elections.
Table 23: 2008 Local Government Elections Non-voters by Region and Gender
Region Gender Absolute Number % of NVMetro/Rural
TotalsMetro/Rural
% of NVMetropolitan Female 223,255 33.2Metropolitan Male 234,393 34.8
457,648 68.0
Rural Female 104,325 15.5Rural Male 110,812 16.5
215,137 32.0
On a numerical basis, male electors are more represented amongst non-voters than female electors. This trend holds until the age group 80 years and over at which point the trend is reversed. For age groups above 80 years, the greater proportion of older women amongst the non-voters groups reflects the greater number of older women than men in the 80 years plus age range.
Non-voting behaviour varies according to age group. Taking non-voters as a proportion of the total age cohort revealed that the lowest participation occurred in younger age groups particularly the 18 – 24 year old group as shown below.
Older citizens actively participated in the 2008 Local Government Elections with the age group 70 – 74 years having the lowest non voting rate of all age groups. This active participation continued for electors over 80 years with the non-voting rate for ages 80 – 84 years being below the average for under 70 year old electors. Only after 90 years does the non-voting rate exceed that for the 18 – 24 year old group.

REPORT ON THE 2008 LOCAL GOVERNMENT ELECTIONSNEWCASTLE CITY COUNCIL
65
Graph 6: 2008 Local Government Elections Non-Voters by Age and Gender – NSW
010 00020 00030 00040 00050 00060 00070 00080 00090 000
100 000N
umb
er o
f No
n V
ote
rs
18-2
4
25-2
9
30-3
4
35-3
9
40-4
4
45-4
9
50-5
4
55-5
9
60-6
4
65-6
9
70-7
4
75-7
9
80-8
4
85-8
9
90-9
4
95-9
9
100-
104
105-
112
Years
Female Male Total
Graph 7: 2008 Local Government Elections Statewide Enrolment, Voter Total and Non-Voter Total by Age
0
50,000
100,000
150,000
200,000
250,000
300,000
350,000
400,000
450,000
500,000
18
-24
25
-29
30
-34
35
-39
40
-44
45
-49
50
-54
55
-59
60
-64
65
-69
70
-74
75
-79
80
-84
85
-89
90
-94
95
-99
100
-10
4
105
-11
2
Age groups
Peo
ple
NV Total Voters Total Electors Total
The reasons why electors failed to vote are recorded in the non-voters database. The three valid reasons most frequently recorded across NSW included out of the area, aged and deceased/no longer on the NSW roll. Review on an individual council

REPORT ON THE 2008 LOCAL GOVERNMENT ELECTIONSNEWCASTLE CITY COUNCIL
66
basis found little variation in the trend with the exception of the Council of the City Of Sydney which recorded a much higher number of non-voters in the category of deceased/no longer on roll in NSW.
The following graph illustrates the number of valid excuses for failing to vote at a State level.
Graph 8: 2008 Local Government Elections Statewide Valid Reasons for Failing to Vote
0
20 000
40 000
60 000
80 000
100 000
120 000
Out of Area Aged Deceased /No longer on
NSW Roll
Religious OtherAcceptable
Sick AwayIndefinitely
Infirm
Excuse Reason
Ele
cto
rs E
xcus
ed
The NSWEC received some reports of incidents where electors who claimed to have voted, received a penalty notice from the NSWEC. Unfortunately, the roll scanning process is not without minor errors. Where an election official marked a name on the roll too faintly or did not mark the line correctly the elector can be scanned as not having voted. While it is an inconvenience to electors who receive incorrect penalty notices, the electors are not penalised and are excused. These errors occur on an infrequent basis.

REPORT ON THE 2008 LOCAL GOVERNMENT ELECTIONSNEWCASTLE CITY COUNCIL
67
Election Conclusion
Media Strategy and Debrief
High levels of local media interest surrounded the 2008 Local Government Elections in the lead up to, during and post election day. Local newspapers and radio stations followed with interest the electoral process and candidate activities throughout the period.
The NSWEC endeavoured to provide all media with accurate and timely election information throughout the election. A Media Liaison Officer responded to numerous high level media enquiries and conducted more than 100 live radio interviews and prepared and distributed 64 media releases containing important election information. A media protocol was developed by the NSWEC to assist Returning Officers with handling media enquiries and to manage the flow of information from Returning Officers and the NSWEC head office.
A survey of 30 regional, rural and suburban press and radio outlets recorded a high level of satisfaction with the NSWEC’s provision of information as illustrated in the following table. The surveyed media outlets had either daily or weekly contact with both the Returning Officer (75.8%) and media spokesperson (71.4%).
Table 24: 2008 Local Government Elections Media Information Satisfaction – NSW (%)
Very unsatisfactory
Unsatisfactory Neutral Satisfactory Very satisfactory
Access to information
3.3 10.0 6.7 43.3 36.7
Quality of information
0.0 10.0 10.0 53.3 26.7
Timeliness of information
3.4 6.9 10.3 51.7 27.6
Content of media releases
3.3 3.3 13.3 56.7 23.3
Media page on NSWEC website
0.0 10.0 23.3 40.0 26.7
Debriefs
Background
As part of the NSWEC’s commitment to provide high quality, value for money election services, the NSWEC conducted an internal election debrief to assess its performance and the satisfaction of key stakeholder groups including councils, electors, registered political parties, candidates and election staff.
The NSWEC has a responsibility under Priority S8 of the NSW State Plan to measure, report and improve customer satisfaction with Government services. The content of all surveys was structured around the Key Results Areas of the NSWEC’s Corporate

REPORT ON THE 2008 LOCAL GOVERNMENT ELECTIONSNEWCASTLE CITY COUNCIL
68
Plan 2008-2011 to assess the NSWEC’s performance and satisfaction with the services it provided.
Services assessed included the following:
ordinary, pre-poll and postal voting services to the general public; registration, continued registration and nomination services for registered
political parties; candidate nomination process; elector and candidate inquiry centres; services provided centrally from Sydney to:
o General Managers of local councils; ando Regional Returning Officers, Returning Officers and polling officials.
services provided by Regional Returning Officers, Returning Officers; effectiveness of communication programmes for the voting public and
specific groups about enrolment, compulsory voting, nomination, election results; and
internet based information via website.
In order to minimise expenses, an online debrief approach was adopted by the NSWEC for all stakeholder groups with the exception of the survey of electors who used Braille ballot papers where a telephone survey was conducted.
Participation
Participation in stakeholder surveys was satisfactory with the highest level of participation seen in the Returning Officers with a 94.4% response rate followed by General Managers (77.7%). The following table outlines statewide participation in the surveys and the response rates for Newcastle City Council.
Table 25: 2008 Local Government Elections Survey Participation
Stakeholder Group NSW Participation % Response Rate Newcastle City Council Participation
General Managers 115 77.7% 1Electors 2,044 0.04% 37Candidates 1,312 28.4% 18Returning Officers 85 94.4% 1Election day staff 7,023 62.4%5 171
Survey Content Areas
General Managers
In early November 2008, the NSWEC emailed a survey to General Managers as a means of gaining feedback. Two reminder emails were sent before the survey closed in early December 2008 and analysis commenced.
The General Manager survey covered matters across the entire election period including:
5 Not all staff provided an email address. The participation represents the percentage of staff who completed the survey and who did provide such an address.

REPORT ON THE 2008 LOCAL GOVERNMENT ELECTIONSNEWCASTLE CITY COUNCIL
69
overall satisfaction with election processes; the Returning Officer; communication with the NSWEC; election information; enrolment; nominations and voting; results; and election costs.
Electors A feedback survey of electors who voted at the 2008 Local Government Elections was undertaken in the two weeks following election day. The NSWEC engaged an independent survey company to assist in developing the survey content, collect survey responses and provide an independent report on the collated feedback on the full range of election matters.
The NSWEC made the survey available to all electors through a link on the NSWEC website homepage. The survey was accessible from election day until Tuesday, 7 October 2008. Electors were advised of the survey’s availability through leaflets distributed at polling places on election day along with a section in the NSWECelection information brochure.
An online approach was adopted to most cost effectively and efficiently assess issues concerning electors such as:
enrolment (both residential and non-residential rolls); usefulness and availability of election information; methods of voting (prior to and on election day); results information; and overall satisfaction with electoral processes.
Returning OfficersFeedback was sought from all Returning Officers on the operations and processes they were involved in throughout their period of employment. Returning Officers were asked to complete the survey in an impartial and open manner in order to ensure that the feedback could be used to assist the NSWEC improve its operations and services at future elections.
Areas covered in the Returning Officer survey included:
recruitment; training; office accommodation and equipment; NSWEC and ROSO support; candidates; council; advertising and media; Election Management Application; ballot papers, rolls and voting furniture; voting and counting of the votes; and future improvements.

REPORT ON THE 2008 LOCAL GOVERNMENT ELECTIONSNEWCASTLE CITY COUNCIL
70
Returning Officers were also provided with access to an online Issues Log which they were able to access at any stage throughout the election to note any issues that arose which could be acted on at future elections.
Election Day StaffAfter election day, all polling place managers and election officials who provided the NSWEC with an email address were emailed a link to an online survey on the operations and processes in the polling place in which they worked on election day.
The survey covered important operational areas including:
recruitment processes; training; processes in the polling places; counting of results; and future recruitment.
CandidatesAfter the election, feedback on election processes and procedures was sought from candidates who participated in the election. The survey covered candidates’ views on:
the administrative processes; election services provided by the NSWEC; availability of candidate information; the provision of results information; and the overall satisfaction and perspective of the conduct of the elections.
Overall Satisfaction
General ManagersOf the General Managers who participated in the survey 97.2% found the NSWEC’s conduct to be impartial (87.0% = Yes, 10.2% = Neutral) and 78.5% found the electionsto be conducted effectively (49.5% = Yes, 29.0% = Neutral). General Managers indicated lower levels of satisfaction with the efficiency of the election at 53.2% (25.2% = Yes, 28.0% = Neutral).
A high level of satisfaction with the NSWEC’s overall communication with councils was recorded in terms of accuracy (92.5%), availability (88.8%), timelines (85.8%) and consistency (92.5%) (all including very satisfactory, satisfactory and neutral).
Electors Almost three-quarters of the participants (72.2%) reported that they were neutral, satisfied or very satisfied with the overall voting process. The aspects that had the highest levels of satisfaction were privacy (90.3%) and security of the vote (88.1%). The aspect that had the highest level of dissatisfaction was the NSWEC administration of the elections. These findings were consistent amongst the gender and regional comparisons.

REPORT ON THE 2008 LOCAL GOVERNMENT ELECTIONSNEWCASTLE CITY COUNCIL
71
Returning OfficersReturning Officers were the stakeholder group with the highest level of overall satisfaction, as illustrated in the following table.
93.7% of responding Returning Officers were satisfied or very satisfied with the NSWEC’s overall conduct of the election (35.4% satisfied, 58.3% very satisfied). The Newcastle City Council Returning Officer rated the overall conduct as very satisfactory.
Table 26: 2008 Local Government Elections Returning Officer Satisfaction – NSW (%)
Very unsatisfactory
Unsatisfactory Neutral Satisfactory Very satisfactory
Advertising 0 0 6.2 51.9 42.0Candidate queries
0 1.2 9.9 51.9 37.0
Council issues 2.5 0 14.8 43.2 39.5EMA 0 0 4.9 46.9 48.1Finance andPayroll support
0 1.2 3.7 40.7 54.3
Intranet 0 0 3.7 48.1 48.1IT andTele-communication support
0 0 8.6 44.4 46.9
Office accommo-dation
1.2 2.5 9.9 43.2 43.2
Polling places 0 3.7 8.6 58.0 29.6Registration of How-to-Vote materials
0 3.8 5.0 53.8 37.5
Returning Officer bulletins
0 2.5 1.3 38.0 58.2
ROSO 0 0 0 27.8 72.2Staffing 0 6.3 10.0 43.8 40.0 Overall satisfaction
6.3 0 0 35.4 58.3
Election Day StaffA good indication of the satisfaction of election staff, in terms of their ability to provide services and their employment conditions, can be measured by the number of staff who would work for the NSWEC again. Based on their experience at this election, an outstanding 97.1% of the election staff that participated in the statewide feedback survey, indicated that they would be interested in working for the NSWEC again, with 40.5% interested in taking on a higher role such as polling place manager. Of the election staff that participated in the feedback survey and worked in a polling place in Newcastle City Council, 96.91% (157) indicated that they would be interested in working for the NSWEC again.
In terms of impartiality, across NSW, 93.7% of election day staff indicated that they felt the election was conducted impartially (of election officials who worked in a

REPORT ON THE 2008 LOCAL GOVERNMENT ELECTIONSNEWCASTLE CITY COUNCIL
72
polling place in Newcastle City Council, 94.41% (152) felt the election was conducted impartially).
CandidatesStatewide, candidates’ responses to the survey indicated a high level of overall satisfaction with the NSWEC’s conduct of the elections (42.1% satisfied, 18.5% very satisfied and 16.1% neutral).
Of the survey participants, 91.4% had confidence that the elections were conducted impartially, 76.4% had confidence that the elections were conducted effectively and 62.0% had confidence that the elections were conducted efficiently. As the survey numbers are small, the information has not been provided for each council.
NSWEC Head Office Debrief
NSWEC head office staff participated in debrief sessions where each project manager presented a summary of the aims of the project, the challenges faced, the strengths of the projects and what, in hindsight, needed to be strengthened.
All major projects were reviewed and improvements identified.
In addition to the full staff debrief the NSWEC Management Committee further evaluated the strengths and weaknesses of the projects and the overall management of the elections. The project reviews assisted in the development of areas for improvements which are further discussed under Future Directions.

REPORT ON THE 2008 LOCAL GOVERNMENT ELECTIONSNEWCASTLE CITY COUNCIL
73
Review of Complaints and Suggested Improvements
The NSWEC recognises the importance of feedback, both positive and negative, to assist in delivering improved election services to stakeholders. With such a large number of stakeholders it is unrealistic to expect that all stakeholders will be completely satisfied with their experience. While overall satisfaction levels were high,the NSWEC did receive a number of complaints concerning the electoral process and the conduct of the elections.
All written complaints made to the NSWEC regarding the 2008 Local Government Elections were registered in the complaints handling register and actioned by NSWEC head office staff. A total of 181 substantive complaints were made to the NSWEC during the election period. The majority of the complaints received concerned the activities of candidates with some concerning services provided by the NSWEC. The three most frequently received complaints concerned electoral material (27.1%), pre-poll voting centres and polling places (23.2%) and the conduct of candidates, candidate workers, election officials and participants in electoral process (12.7%).
The complaints received came from across all parts of NSW with no council having a more significant proportion of complaints relative to other councils. Of the substantive complaints received by the NSWEC, nine complaints were relevant to elections conducted in Newcastle City Council. Complaints covered electoral material, eligibility of candiadtes, pre- poll voting, polling places and conduct of participants in electoral process.
A number of improvements can be made by the NSWEC as a result of the feedback received through complaints. The major areas for future improvements are coveredlater in the report under Future Directions.

REPORT ON THE 2008 LOCAL GOVERNMENT ELECTIONSNEWCASTLE CITY COUNCIL
74
Election Costs
Election costs for the 2008 Local Government Elections
As prescribed in the Act the Electoral Commissioner conducts Local Government elections on behalf of councils on a full cost recovery basis. The NSWEC is not funded by the NSW Government for the conduct of the elections.
Key cost drivers for the 2008 Local Government Elections included:
election official wages; office accommodation for Returning Officers; information and technology support; polling places; number of electors in council area; number of elections held; mayoral, referendum and polls; newspaper and radio advertising; and Elector Inquiry Centre.
The process for developing the budget for the 2008 Local Government Elections and individual council budgets involved four major stages:
1. Identification of all 2008 Local Government Elections projects and associated activities;
2. Development of the final estimates using a 'zero based' or 'bottom-up' budget methodology involving itemising volume and unit costs for each project, the tasks for each month and financial year;
3. Substantive testing of budget items and estimated costs using the most reliable cost schedule, that is the 2007 State General Election; and
4. Allocation of the costs for each project to individual councils was completed using the applicable methodology for the activity involved in each project.
To assist with council budgeting in mid 2007 the NSWEC provided all councils withestimates of the cost for the conduct of their Local Government elections. This early estimate was a simple allocation based on the number of electors.
Some feedback from councils was received by the NSWEC regarding the timeliness of this estimate. While the NSWEC provided the estimate to the councils as a guide only it is understood from feedback received that councils would appreciate the estimates earlier in order to meet the requirement to exhibit council budgets for a month prior to adoption by 30 June.
In May 2008, the NSWEC provided all councils with an itemised budget for election costs specific to each council. Newcastle City Council was given a total budget estimation of $724,000.
Recoupment of expenses incurred by the NSWEC commenced in August 2008 with councils invoiced 85% of the estimated budget. The exceptions to this were councils where payment was supported by the Department of Local Government to be spread over two financial years (the first invoice for 50%) and where the election ballot was uncontested.

REPORT ON THE 2008 LOCAL GOVERNMENT ELECTIONSNEWCASTLE CITY COUNCIL
75
In March 2009 the NSWEC issued final council invoices based on actual costs. The actual expenditure outcome saw 63 councils receive a refund while three councilsreceived an increase.
The total cost for conducting the 2008 Local Government Elections was $25.9 millionwith the cost per elector $5.71. The average cost per metropolitan council was $369,550 while the average cost per rural council was $92,796. The highest cost of conducting the election was $821,700 for Blacktown City Council with the lowest cost for a council with contested elections $8,600 for Jerilderie Shire Council. The lowest cost for an uncontested election was $4,100 for Conargo Shire Council6.
For Newcastle City Council the total cost was $598,400. A full breakdown of costs for Newcastle City Council is available at Appendix 8.
The major cost items for the 2008 Local Government Elections and their contribution to the total State and council budgets are shown below.
Table 27: 2008 Local Government Elections Major Expenditure Items for NSW and Newcastle City Council.
Expenditure Item NSW$M
NSW%
Newcastle City Council
$Election official salaries 10.446 40.3 216,260Ballot paper production 2.468 9.5 75,070Information communication technology
2.126 8.2 51,530
Returning Officer accommodation 2.069 8.0 45,220Communication campaign 2.020 7.8 36,370Centralised vote counting 0.757 2.9 22,490Polling place hire 0.742 2.9 16,680
Analysis of individual council budgets shows that the greater the elector numbers within a Local Government area, the higher the cost of the council’s elections. This was the case for both metropolitan and rural councils as shown in the following graph. While the number of elections had some impact upon overall cost to a council, the greater determinant was number of electors within the council.
6 Uncontested elections are only known at the close of nominations. Until that point the NSWEC had been undertaking work towards anticipated elections and incurring expenses.

REPORT ON THE 2008 LOCAL GOVERNMENT ELECTIONSNEWCASTLE CITY COUNCIL
76
Graph 9: 2008 Local Government Elections Election costs – Number of Electors by Location
0
200,000
400,000
600,000
800,000
1,000,000
1,200,000
0
20,0
00
40,0
00
60,0
00
80,0
00
100,
000
120,
000
140,
000
160,
000
180,
000
200,
000
Electors
Co
st $
Metropolitan Rural Linear (Metropolitan) Linear (Rural)
The final statewide invoiced cost was $5.2 million less than the budget estimate of May 2008, a variation of 16.9% below budget. The reduced expenditure was achieved from savings made in the following areas:
IT infrastructure - borrowed equipment $1.3M Equipment and Materials supplied to Returning Officer offices $1.0M Wages - reduced staffing levels $0.9M Communications/Information plan $0.7M Back office support savings $0.5M Centralised vote counting - finished earlier $0.5M Polling Places - usage of public versus private spaces $0.3M
The main issue raised by General Managers in the feedback survey concerned election costs. Election costs were a contentious issue in the lead up to and throughout the election period. The NSWEC endeavoured to deliver high quality election services to all election stakeholders in the most cost efficient manner. In the lead up to the election the NSWEC examined ways to minimise costs in high cost areas and introduced initiatives never before used in NSW at the Local Government level.
As part of the NSWEC’s internal audit programme the NSWEC engaged Walter Turnbull to undertake a review on the NSW Local Government Elections pricingmodel. In July 2008 Walter Turnbull presented its report on the review and found that the NSWEC apportioned all costs associated with the 2008 Local Government Elections in a fair and equitable manner. The review also contained

REPORT ON THE 2008 LOCAL GOVERNMENT ELECTIONSNEWCASTLE CITY COUNCIL
77
recommendations arising from the audit which the NSWEC addressed by making changes to the cost model in areas which would directly impact on the costs associated with the elections.
The NSWEC administration fee also raised some queries from General Managers. The administration fee included in the costing model captured an allocation of head office costs including the cost of NSWEC permanent staff. The charge basis was derived as a result of an internal audit review.
Further information on the cost recovery model is available in the NSWEC’s report toon the 2008 Local Government Elections.
Election Costs for By-elections
The November by-elections were considered as part of the same 'delivery package' of elections that covered both the statewide elections and the three by-elections. There was no differentiation of costs as associated with the run-up to the Saturday, 13 September elections as opposed to the Saturday, 29 November by-elections.
The date of the by-elections was close to the election date and there were economies of scale for some operations to be considered all part of the same package. These councils received just one final invoice in March 2009.
Election Costs for Uncontested Elections
Councils with uncontested elections only received a final invoice in March 2009 and were not required to make an 85% deposit payment. The invoicing policy was based on councils being allocated costs incurred for that council, until the point that it was known that the elections were uncontested.

REPORT ON THE 2008 LOCAL GOVERNMENT ELECTIONSNEWCASTLE CITY COUNCIL
78
Performance Measurement
The assessment of performance is integral in determining the effectiveness and efficiency of service delivery and stakeholder satisfaction. Measuring stakeholder satisfaction provides the NSWEC with critical performance data to be assessed in terms of:
general services (those designed for a general audience) such as information about electoral requirements and entitlements, provision of information,communication of results;
specific services (the experience of the individual/group user) such as accessibility of polling place used, length of time queueing, courtesy of staff,knowledge of staff and difficulties with enrolment;
complaints received concerning the elections; expectations of future service delivery; and measures drawn from the 2008-2011 Corporate Plan and other sources.
The NSWEC is continuously reviewing areas for improvement in performance and its accountability to stakeholders. The 2008 elections presented an opportunity for the NSWEC to set benchmarks for future Local Government elections and allowed the NSWEC to measure current performance in a manner open to scrutiny.
After the 2008 Local Government Elections the NSWEC undertook performance evaluations through online surveys to assess stakeholders’ satisfaction with the conduct of the elections. The surveys contained questions to provide the NSWEC with both quantitative and qualitative material to assist in reporting on the provision of the elections. Following the completion of the surveys the NSWEC began an assessment of responses to review how well tasks were undertaken and areas where improvements could be made.
The following table outlines the NSWEC targets and the outcomes from the 2008 Local Government Elections.
Table 28: NSWEC Corporate Plan Measures and 2008 Local Government Elections Outcomes
CORPORATE PLAN MEASURES2008 LOCAL GOVERNMENT ELECTIONS
OUTCOMESKRA 1: Conduct of elections % polling places where
provisional first preferences are counted for the Legislative Assembly and Local Government elections on election night (target = 100%).
Provisional first preferences counted at 100% of polling places on election night.
Variance rates between count of votes and recount if any (target = <10 votes).
Leeton Shire Council, A Ward - no variance in first preference votes on the recount. No change to outcome.
Manly Council – variance 6 votes. No change to outcome.

REPORT ON THE 2008 LOCAL GOVERNMENT ELECTIONSNEWCASTLE CITY COUNCIL
79
CORPORATE PLAN MEASURES2008 LOCAL GOVERNMENT ELECTIONS
OUTCOMES Establish baseline measure of
community members’ satisfaction with the NSWEC’s services in enabling them to vote.
74.4% surveyed electors very satisfied, satisfied or neutral on their overall experience of voting.
Establish a baseline measure of the satisfaction of registered political parties with registration, continued registration and nomination services provided by the NSWEC.
78.5% very satisfied, satisfied or neutral with the current registration and ongoing registration process; 100% satisfied with information onrequirements; 92.9% satisfied with the level of NSWEC service.
Establish a baseline measure of the community’s, the media’s and registered political parties’ satisfaction with the timeliness and accuracy of results.
94.1% General Managers have noconcerns re accuracy of results; 51.9% General Managers, 80.8% media and 70.5% candidates very satisfied, satisfied or neutral with timeliness of results; 51.7% electors reported election results was most useful information on the NSWEC’s website.
KRA 2: Electoral roll management % of voters’ addresses correctly
coded to electorates (Target = 100%).
99.99% of electors correctly codedstatewide.
KRA 3: Communication and public awareness Establish baseline measure of the
% of surveyed community members who are enrolled to vote.
99.4% of electors surveyed were enrolled.
% of electors aware of the NSWEC’s information campaign (Target: 75%).
65.8% electors surveyed recalled seeing or hearing NSWEC advertisements.
Report on conduct of elections to be completed (Target: within sixmonths from election day for State and Local Government elections).
Report prepared to timeframe of NSW Parliamentary Joint Standing Committee on Electoral Matters.
KRA 4: Organisational development and innovation % of variation from budget for
State and Local Government elections (target: +/- 2% from budget).
Budget $31.2M, actual $25.9M, savings $5.3M (-16.9% variance).
% costs recovered for Local Government elections (target: 95%).
100% of planned operational costs recovered.
Establish NSWEC’s costs per elector and commence comparison with other jurisdictions and previous years’ performance.
Cost per elector = $5.71.
Number of IT business systems failures (target: zero).
Zero.

REPORT ON THE 2008 LOCAL GOVERNMENT ELECTIONSNEWCASTLE CITY COUNCIL
80
Future DirectionThe NSWEC endeavours to be an evolving, developing organisation with a focus on continuous improvement. As part of this process, the NSWEC looks at ways to provide smarter and more efficient electoral services to all election stakeholders.
A review of the 2008 Local Government Elections allowed the NSWEC to reflect on the processes and operations that were successful but also allowed for an assessment of the areas requiring improvement.
Operational Practices
All practices and procedures will be kept under review to ensure that the best service is delivered to all Local Government election stakeholders. Below are some of the areas which have been identified for improvement.
Timeliness of Results
The NSWEC will further review ways to develop the election counts and results information in order to provide the results in a timely manner without compromising the accuracy of the results information. Also under review will be the communication of results information to the media, councils, candidates and other interested stakeholders. This will include the management and communication of results counting schedules and actual results data.
Cost Estimates and Cost Recovery
To ensure that councils are better equipped to budget for the costs of their election, the NSWEC will endeavour to determine council budgets earlier in the process so that budget estimates can be prepared and provided to councils earlier and with a higher level of accuracy.
As a result of the NSWEC capturing all costs at the 2008 Local Government Elections, councils will be in a better position to budget for their elections in 2012.
Regional Returning Officers
The Regional Returning Officer initiative introduced at the 2008 Local Government Elections was well received and considered to be successfully implemented. As with most new programmes, areas for improvement have been identified and will be consideration for future elections.
The NSWEC will review the possibility of expanding the Regional Returning Officer initiative in consultation with Councils.
Council Visits Programme
The NSWEC acknowledges the importance of relationship management with its stakeholders. Council visits were useful for both the NSWEC and councils to work through the electoral process and discuss any matters for consultation. The NSWEC will continue to provide election information to councils including visits prior to finalising administrative arrangements for the 2012 elections.

REPORT ON THE 2008 LOCAL GOVERNMENT ELECTIONSNEWCASTLE CITY COUNCIL
81
Candidate Information Seminars
To ensure a high level of involvement in the candidate information seminars the NSWEC will consider developing an online expression of interest system in which all potential candidates can register their contact details. The system would allow the NSWEC to directly provide candidates with seminar information and other relevant election and election funding information through an email network.
The NSWEC will continue to operate the candidate information seminars and will offer councils the option of selecting their own session on a fee for service basis.
Location of Voting Venues and Staffing Levels
The NSWEC will undertake a review of all voting venues with a view to identifying possible new venues, with a particular focus on larger polling places. An analysis of the staffing level compared with the number of votes taken will be undertaken to determine areas where staffing levels need to be amended with a focus on multilingual staff in areas with large culturally and linguistically diverse communities.
Electors with Vision Disabilities
The NSWEC has noted that many of those electors who used the Braille ballot papers at the 2008 Local Government Elections have expressed a desire for the NSWEC to incorporate electronically assisted voting into future Local Government elections.
The NSWEC will continue to undertake research into electronic voting to assist electors with a vision impairment cast a private and independent vote. The implementation of electronic voting, either at an electronic voting kiosk or over the internet, is not possible without legislative changes.
Training
The NSWEC will look to further extending online training for election staff with a view to reducing face to face training hours. The online training programmes will be extended to include Returning Officers and senior office assistants.
Communication of Electoral Services
In terms of communication the NSWEC will look to consider more technological approaches better geared to younger and more electronic oriented members of the community. Also, the differences identified through the elector survey inretention of advertising messages between metropolitan and rural electors will be used by the NSWEC in the development of future election communication strategies.
The NSWEC is aware that there remains a poor understanding of the nature of Local Government elections and of the role of the NSWEC. The NSWEC will examine how it can address the community’s understanding of the NSW electoral systems.
Maximising Enrolment
The NSWEC notes the previous report of the NSW Joint Standing Committee on enrolment and reports that the Government has supported the ‘smart roll’ concept by providing appropriate funding for the project. It is anticipated that this project will result in additional electors being enrolled and more accurate enrolment for the 2012 Local Government Elections.

REPORT ON THE 2008 LOCAL GOVERNMENT ELECTIONSNEWCASTLE CITY COUNCIL
82
Proposed Legislative Changes
Based on the experience of the 2008 Local Government Elections it is recommended that consideration be given to the following proposals which are based on the 2008 Local Government Elections experience.
Postal Voting
Currently in NSW universal postal voting is not available for Local Government elections and limited postal voting is only available as an alternative to ‘in attendance’ voting. Availability of postal voting relies upon certain criteria being met, that is, electors will not be in NSW, in their ward/council area or within eight kilometres of a polling booth during polling hours on polling day. It can also be used for electors who are sick, infirm, in advanced pregnancy, in prison, working or otherwise restricted from attending the polling place because of religious beliefs or other preclusions.
Precedents exist for greater use of postal voting in Local Government elections. The NSWEC received feedback from many electors, General Managers and other stakeholders regarding the need to allow for flexibility in the voting options. A number raised the fact that other Australian States and Territories allow greater use of postal voting.
The NSWEC will raise with the NSW Parliamentary Joint Standing Committee on Electoral Matters and the Minister for Local Government the option of providing councils with the choice of either attendance or postal voting, believing that this option will be more convenient to electors and more flexible for councils.
Timeframe for Appointment of Mayors by Councillors
The NSWEC intends to make submissions to the Minister for Local Government to revisit the proposal to change the deadline for the election of the mayor by the councillors to within three weeks after the election is declared.
Where a mayor is to be elected by councillors from among their number, the Local Government Act 1993 requires that this election occurs at a council meeting within three weeks after the date of the ordinary election (and every September for the remainder of the council term thereafter) (s.290(1)(a)).
This legislative requirement has caused problems as the result of the election may not be known for some days after election day. A proposal to change the deadline for the election of the mayor by the councillors to within three weeks after the election is declared was included in the Local Government Amendment (Elections) Bill 2008. The Bill was introduced by the Minister for Local Government in early April last year but did not pass Parliament.
Candidate Information Sheets
Local Government candidates are required under the legislation to complete and lodge a Candidate Information Sheet together with the candidate nomination form. The Candidate Information Sheets have always been required to be available to the public for inspection at the office of the relevant Returning Officer or displayed at the relevant polling place. Access to these documents has been enhanced by their publication on the NSWEC and council websites. While this initiative has allowed

REPORT ON THE 2008 LOCAL GOVERNMENT ELECTIONSNEWCASTLE CITY COUNCIL
83
broader coverage of candidate profiles to the benefit of all stakeholders, it has also brought two particular recurring areas of confusion into focus: non endorsed and independent candidates who are members of registered political parties; and candidates who are not residents of the local government areas they are contesting.
The NSWEC regularly receives complaints following council elections from the public asserting that they would not have voted for a particular independent candidate if they had known that person was a member of a registered political party. There is also much confusion as to whether electoral material disseminated by a non-endorsed independent candidate is misleading where that material contains matter regarding the candidate’s actual party membership or affiliation (without going so far as to suggest endorsement – something that is not permitted under the legislation). It is recommended that a candidate’s membership with a registered political party and whether a candidate has been endorsed by a registered political party are prescribed as matters that must be included in the Candidate Information Sheet. This would provide greater transparency and certainty for electors and assist them in casting an informed vote.
Eligibility for nomination – candidates residing outside of the council areas they are contestingIt is often misunderstood that a candidate for election to a local council must live in the council area to be enrolled to vote either on the residential roll or the non-residential roll for the area. It is recommended that amendments are made so that candidates are required to indicate in their Candidate Information Sheet whether they are qualified to contest an election based on their residential or non-residential status. This initiative will enhance electors’ understanding of candidate eligibility, reduce confusion and minimise incidents of misconceived challenges to a councillor’s election (the NSWEC is aware of at least one application to the Administrative Decisions Tribunal to dismiss a councillor elected at the 2008 elections who lived outside of the area but who was, nevertheless, an eligible non-residential candidate).
Envelopes for Pre-poll and Declared Institution Ballot Papers:
The NSWEC has previously recommended dispensing with the requirement to cast pre-poll and Declared Institution ballots in envelopes bearing written declarations of eligibility. Streamlining and simplification of the Local Government pre-poll process by replacing traditional methods with a more efficient process is warranted.
The Joint Standing Committee on Electoral Matters has recommended in its report “Administration of the 2007 NSW Election and Related Matters” (May 2008) that State legislation is amended to allow electors in Declared Institutions to cast an ordinary vote if the Declared Institution is in the elector’s home district.
It is recommended that similar amendments are made to Local Government legislation and that the proposal is extended to also dispensing with envelopes for pre-poll voting.
Electoral Material
A new and successful regime for regulating electoral material was introduced under amendments made prior to the 2008 elections. The following additional enhancements are recommended.

REPORT ON THE 2008 LOCAL GOVERNMENT ELECTIONSNEWCASTLE CITY COUNCIL
84
Clothing and other items not required to be authorised In line with Commonwealth elections legislation and that of all other states, it is recommended that certain items are expressly exempted from the requirement that electoral material must be “authorised” (that is, must contain the name and address of the person on whose instruction the material was printed and the name and address of the printer). Such exempted items would include T-shirts, hats, lapel buttons, lapel badges, pens, pencils, balloons and business or visiting cards promoting a candidacy.
Identifying the party/candidateTo avoid confusion and to reduce incidents of potentially misleading material being disseminated on election day, it is recommended that express provision is made that electoral material cannot be registered unless it clearly identifies the person, political party, organisation or group on whose behalf the card is to be distributed. This proposal reflects similar provisions in other jurisdictions that seek to ensure electors are properly informed of who is responsible for the political messages that may be contained in the material.

REPORT ON THE 2008 LOCAL GOVERNMENT ELECTIONSNEWCASTLE CITY COUNCIL
85
AppendicesAppendix 1 NSWEC Council Visits Agenda Items ......................................................... 86Appendix 2 Location of Candidate Information Seminars......................................... 87Appendix 3 Regional Returning Officer Groups............................................................ 88Appendix 4 Newcastle City Council Candidates......................................................... 90Appendix 5 Newcastle City Council Polling Places ..................................................... 91Appendix 6 Newcastle City Council Ballot Papers....................................................... 93Appendix 7 Newcastle City Council Election Results................................................... 98Appendix 9 Newcastle City Council Final Expenses Summary ................................100

REPORT ON THE 2008 LOCAL GOVERNMENT ELECTIONSNEWCASTLE CITY COUNCIL
86
Appendix 1 NSWEC Council Visits Agenda Items
Agenda Items
1. Council’s Election Budget and Election Costs
2. Redevelopment of NSWEC’s Election Management Software (EMA)
3. Returning Officer Appointments and Training
4. Returning Officer Accommodation
5. Provision of Election Equipment and Materials (Returning Officer and Polling Places)
6. Polling Places, Pre-poll Offices and Declared Institutions
7. Election Advertising
8. Equal Access To Democracy Plan
9. Recruitment and Payment of Election Officials and Office Assistants
10. Candidate Information Seminars
11. NSWEC and Council Websites
12. NSWEC Call Centre
13. Printing Ballot Papers
14. Electoral Rolls and ‘iRoll’
15. Vote Counting Arrangements
16. Display and Declaration of Election Results
17. Post Election
18. Other Matters Raised

REPORT ON THE 2008 LOCAL GOVERNMENT ELECTIONSNEWCASTLE CITY COUNCIL
87
Appendix 2 Location of Candidate Information Seminars
Location Date No. of AttendeesAlbury Saturday, 10 May 2008 23Armidale Saturday, 17 May 2008 36Bathurst Saturday, 31 May 2008 25Burwood Wednesday, 7 May 2008 32Byron Bay Saturday, 31 May 2008 15Chatswood Wednesday, 14 May 2008 27Chatswood Saturday, 26 July 2008 39Coffs Harbour Saturday, 21 June 2008 50Dee Why Thursday, 12 June 2008 27Deniliquin Saturday, 28 June 2008 18Dubbo Saturday, 14 June 2008 19Gosford Wednesday, 21 May 2008 27Goulburn Wednesday, 21 May 2008 14Griffith Saturday, 14 June 2008 35Hurstville Tuesday, 20 May 2008 17Hurstville Saturday, 26 July 2008 15Kiama Thursday, 22 May 2008 30Lismore Friday, 30 May 2008 59Liverpool Wednesday, 11 June 2008 45Narooma Saturday, 24 May 2008 32Newcastle Thursday, 22 May 2008 78Nyngan Saturday, 14 June 2008 4Orange Friday, 13 June 2008 18Parramatta Wednesday, 11 June 2008 33Penrith Thursday, 29 May 2008 33Queanbeyan Saturday, 28 June 2008 50Randwick Tuesday, 5 August 2008 28Strathfield Wednesday, 16 July 2008 32Sydney Wednesday, 4 June 2008 27Tamworth Saturday, 17 May 2008 12Taree Saturday, 24 May 2008 24Tweed Heads Thursday, 19 June 2008 26Wagga Wagga Saturday, 10 May 2008 15Young Saturday, 17 May 2008 12TOTAL 977

REPORT ON THE 2008 LOCAL GOVERNMENT ELECTIONSNEWCASTLE CITY COUNCIL
88
Appendix 3 Regional Returning Officer Groups
Group Councils Total Electors
Total Area (km2)
Electors (per km2)
1.
Albury City CouncilCorowa Shire CouncilGreater Hume Shire CouncilTumbarumba Shire Council
49,534 13,044 3.8
2.Armidale Dumaresq CouncilWalcha Council
17,767 10,502 1.7
3.Ballina Shire CouncilByron Shire Council
49,335 1,051 46.9
4.*
Balranald Shire CouncilBerrigan Shire CouncilConargo Shire CouncilDeniliquin CouncilJerilderie Shire CouncilMurray Shire CouncilWakool Shire Council
21,478 39,145 0.6
5.Bathurst Regional CouncilBlayney Shire Council
29,200 5,345 5.4
6.Bega Valley Shire CouncilEurobodalla Shire Council
50,218 9,702 5.18
7.Bellingen Shire CouncilClarence Valley CouncilCoffs Harbour City Council
91,137 13,218 6.9
8.*
Bland Shire CouncilCarrathool Shire CouncilGriffith City CouncilHay Shire CouncilLeeton Shire CouncilMurrumbidgee Shire CouncilNarrandera Shire Council
35,371 30,252 1.2
9.Blue Mountains City CouncilLithgow City Council
68,692 5,999 11.5
10.
Bogan Shire CouncilBourke Shire CouncilBrewarrina Shire CouncilCentral Darling Shire CouncilCobar Shire Council
9,071 174,595 0.05
11.Bombala CouncilCooma-Monaro Shire CouncilSnowy River Shire Council
13,181 15,395 0.9
12.
Boorowa CouncilCowra Shire CouncilHarden Shire CouncilWeddin Shire CouncilYoung Shire Council
24,851 13,362 1.9

REPORT ON THE 2008 LOCAL GOVERNMENT ELECTIONSNEWCASTLE CITY COUNCIL
89
Group Councils Total Electors
Total Area (km2)
Electors (per km2)
13.
Cabonne Shire CouncilForbes Shire CouncilLachlan Shire CouncilOrange City CouncilParkes Shire Council
55,328 31,962 1.7
14.
Coolamon Shire CouncilCootamundra Shire CouncilGundagai Shire CouncilJunee Shire CouncilTemora Shire Council
19,147 11,248 1.7
15.
Dubbo City CouncilGilgandra Shire CouncilNarromine Shire CouncilWarren Shire Council
35,036 24,288 1.4
16.Goulburn Mulwaree CouncilUpper Lachlan Shire Council
24,105 10,499 2.3
17.Gloucester Shire CouncilGreat Lakes CouncilGreater Taree City Council
62,785 10,080 6.2
18.Gunnedah Shire CouncilLiverpool Plains Shire CouncilTamworth Regional Council
51,858 19,733 2.6
19.Kempsey Shire CouncilNambucca Shire Council
32,360 4,871 6.6
20.Kyogle CouncilLismore City CouncilRichmond Valley Council
51,227 7,930 6.5
21.*
Lockhart Shire CouncilTumut Shire CouncilUrana Shire CouncilWagga Wagga City Council
48,054 12,747 3.8
22.Narrabri Shire CouncilWalgett Shire CouncilWarrumbungle Shire Council
19,912 47,747 0.4
23.Palerang CouncilQueanbeyan City CouncilYass Valley Council
44,682 9,315 4.8
Note: * Councils or Wards with uncontested elections not included in totals.

REPORT ON THE 2008 LOCAL GOVERNMENT ELECTIONSNEWCASTLE CITY COUNCIL
90
Appendix 4 Newcastle City Council Candidates
Mayoral Candidates
ALCORN, ZaneBUMAN, AaronEADE, Marilyn
OSBORNE, MichaelTATE, John
BROWN, TonyO'NEILL, Helene
Councillor Candidates
First WardBUMAN, AaronEADE, MarilynOSBORNE, MichaelCLAYDON, SharonDICKSON, Jon
GAFFNEY, BrianGARIS, DiGREIVE, BronwynHARRIS, DonovanHEYMAN, Kathie
MAHONY, TerenceMcLAUGHLIN, AnneMOLE, HowardROOKE-FRIZELL, AnnieSKLAVOS, Angelo
Second WardANDERSON, JohnBREARLEY, SamCLARKE, NathanCRAKANTHORP, TimDELLA-GROTTA, LeoDOYLE, ThereseHARRIS, DonHENRY, Catherine
HEPPLE, ChristopherHOGG, DavidHUNT, MelanieKILMURRAY, JessicaKOCHANSKI, GlennisLUKE, BradMcBRYDE, IanMORRIS, Neil
SHARPE, ScottSMITH, JimSMOOTHER, BrodieSTREETER-SMITH, DebraSUNOL, JohnSYMONS, Beverley
Third WardALCORN, ZaneTATE, JohnBAREHAM, NevenkaBAREHAM, TereseBOYD, Graham
CAMERON, ThomasEALING, LauraKING, MikeMcALARY, MargotMOWBRAY, Nicholas
NELMES, NuataliPARSONS, KeithPILLEY, MelSTRAZZARI, TonyWOTHERSPOON, Lena
Fourth WardCONNELL, ShayneCOOK, BobDEAKIN, JulieGARDNER, Daniel
HEATHCOTE, GreggHUXTABLE, GeorgieJACKSON, MikeJOHNSON, Aaron
LOFBERG, KellyMcCORKELL, MaxMOONEN, BertRODD, Damon

REPORT ON THE 2008 LOCAL GOVERNMENT ELECTIONSNEWCASTLE CITY COUNCIL
91
Appendix 5 Newcastle City Council Polling Places
FIRST WARD
Polling PlaceProjected
VotesActual Votes
St Thomas Anglican Church Hall 1000 1102Newcastle School 800 690St Johns Anglican Church Hall Cooks Hill 2100 1814Hamilton South Public School 600 198Islington Public School 600 729St Marks Anglican Church Hall Islington 800 788St Andrews Anglican Church Hall Mayfield 1200 1382Mayfield East Public School 1400 1370Mayfield Presbyterian Church Hall 1800 1836Mayfield West Demonstration School 1500 1693New Lambton South Public School 300 123Newcastle East Public School 1500 1350Stockton Public School 900 1024Stockton Uniting Church Hall 1100 1172St Josephs School Hall 600 706Tighes Hill Public School 1100 1185Warabrook Community Centre 1000 1159
SECOND WARD
Polling Place Projected Votes
Actual Votes
St Columba's Parish Hall 2600 2247Kotara High School 2000 1753Adamstown Combined Pensioners Association 1400 1525Hamilton South Community Hall 1600 914Hamilton Public School 1700 1561Scots Kirk Hall 1000 974Hamilton North Public School 500 565Hamilton South Public School 2200 2238Merewether Uniting Church Hall 1000 1190Merewether Heights Public School 1600 1257Holy Family Church Hall 2000 2447New Lambton Public School 800 114New Lambton South Public School 800 667St Josephs School Hall 1700 1471

REPORT ON THE 2008 LOCAL GOVERNMENT ELECTIONSNEWCASTLE CITY COUNCIL
92
THIRD WARD
Polling Place Projected Votes
Actual Votes
St Pauls Anglican Church Hall Birmingham Gardens 400 114Garden Suburb Public School 700 69Jesmond Public School 700 832Callaghan College - Jesmond Senior Campus 1300 1337Kotara Park Hall 600 584Grinsell Street, New Lambton Uniting Church Hall 700 853Kotara South Public School 1200 1188St John the Baptist Anglican Hall 1800 2039Lambton High School 800 1000New Lambton Public School 3000 3080All Saints Parish House 750 976New Lambton Heights Infants School 700 298New Lambton South Public School 1400 1099Silver Ridge Community Hall 900 833Wallsend Community Pre-School 200 240Waratah Public School 3000 2917Cameron Park School 1300 596Waratah West Public School 1100 1109
FOURTH WARD
Polling Place Projected Votes
Actual Votes
Beresfield Public School 1300 2096St Pauls Anglican Church Hall Birmingham Gardens 800 716Shortland Uniting Church Hall 1000 1034Black Hill Public School 200 119Elermore Vale Public School 2200 2497Glendore Public School 1200 1342Maryland Public School 2900 3039Minmi Progress Hall 400 571New Lambton South Public School 200 87St Patricks Parish Hall 850 864Callaghan College Wallsend Campus 1200 2055Shortland Public School 1100 1347Silver Ridge Community Hall 200 277Tarro Public School 1100 821Wallsend Uniting Church Hall 1200 2057Wallsend Community Pre-School 700 507Wallsend South Public School 3000 2339
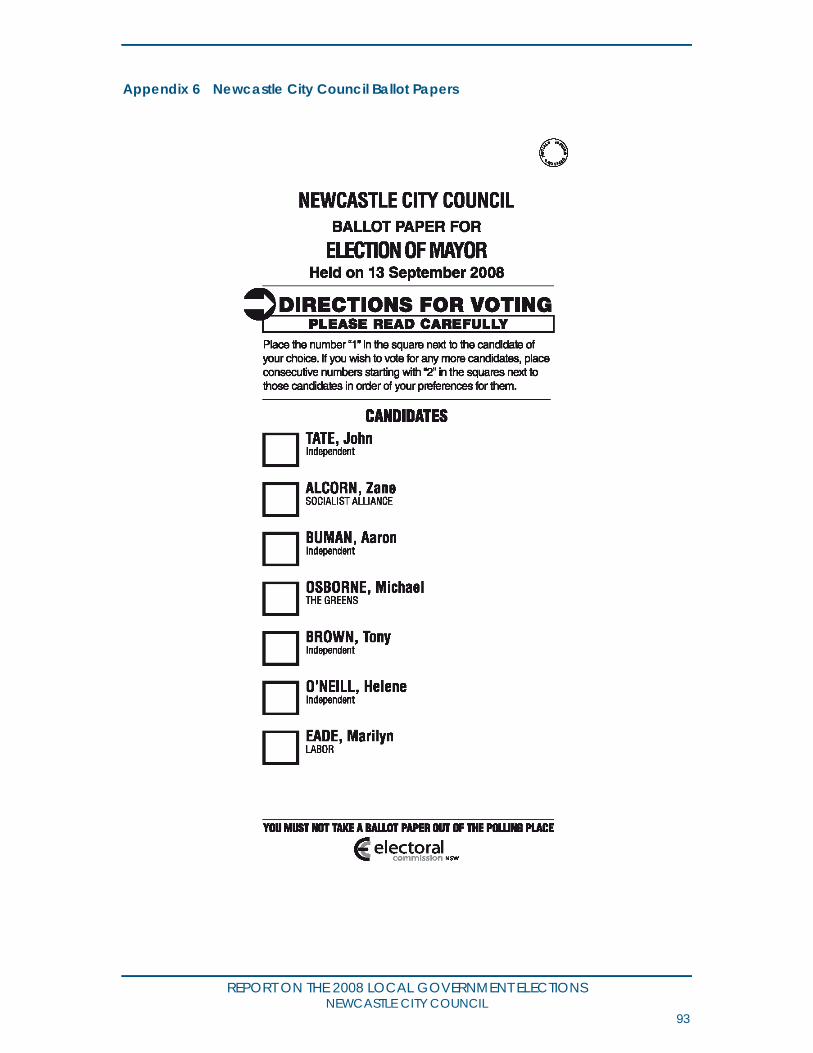
REPORT ON THE 2008 LOCAL GOVERNMENT ELECTIONSNEWCASTLE CITY COUNCIL
93
Appendix 6 Newcastle City Council Ballot Papers

REPORT ON THE 2008 LOCAL GOVERNMENT ELECTIONSNEWCASTLE CITY COUNCIL
94

REPORT ON THE 2008 LOCAL GOVERNMENT ELECTIONSNEWCASTLE CITY COUNCIL
95

REPORT ON THE 2008 LOCAL GOVERNMENT ELECTIONSNEWCASTLE CITY COUNCIL
96

REPORT ON THE 2008 LOCAL GOVERNMENT ELECTIONSNEWCASTLE CITY COUNCIL
97

REPORT ON THE 2008 LOCAL GOVERNMENT ELECTIONSNEWCASTLE CITY COUNCIL
98
Appendix 7 Newcastle City Council Election Results
Elected Mayor
TATE, John was elected
Newcastle First Ward Elected Councillors
CLAYDON, Sharon was elected firstBUMAN, Aaron was elected secondOSBORNE, Michael was elected third
Newcastle Second Ward Elected Councillors
CRAKANTHORP, Tim was elected firstLUKE, Brad was elected secondSHARPE, Scott was elected third
Newcastle Third Ward Elected Councillors
BOYD, Graham was elected firstNELMES, Nuatali was elected secondKING, Mike was elected third
Newcastle Fourth Ward Elected Councillors
JACKSON, Mike was elected firstCONNELL, Shayne was elected secondCOOK, Bob was elected third
Breakdown of voting methods - Mayor
Method elector used to vote Electors Percentage of total
Ordinary 73812 85.6%Postal 3468 4.0%Pre-poll 4234 4.9%Declared Institution/Silent/Section 285 0.3%Electors who voted Informally 4430 5.1%
TOTAL 86229 99.9%

REPORT ON THE 2008 LOCAL GOVERNMENT ELECTIONSNEWCASTLE CITY COUNCIL
99
Breakdown of voting methods - Newcastle First Ward - Councillor
Method elector used to vote Electors Percentage of total
Ordinary 17033 83.4%Postal 768 3.8%Pre-poll 1125 5.5%Declared Institution/Silent/Section 131 0.6%Electors who voted Informally 1357 6.6%
TOTAL 20414 99.9%
Breakdown of voting methods - Newcastle Second Ward - Councillor
Method elector used to vote ElectorsPercentage of
totalOrdinary 17560 83.3%Postal 782 3.7%Pre-poll 1279 6.1%Declared Institution/Silent/Section 33 0.2%Electors who voted Informally 1422 6.7%
TOTAL 21076 100.0%
Breakdown of voting methods - Newcastle Third Ward - Councillor
Method elector used to vote Electors Percentage of total
Ordinary 17731 83.2%Postal 1098 5.2%Pre-poll 943 4.4%Declared Institution/Silent/Section 65 0.3%Electors who voted Informally 1477 6.9%
TOTAL 21314 100.0%
Breakdown of voting methods - Newcastle Fourth Ward - Councillor
Method elector used to vote Electors Percentage of total
Ordinary 19810 84.1%Postal 807 3.4%Pre-poll 864 3.7%Declared Institution/Silent/Section 55 0.2%Electors who voted Informally 2029 8.6%
TOTAL 3565 100.0%

REPORT ON THE 2008 LOCAL GOVERNMENT ELECTIONSNEWCASTLE CITY COUNCIL
100
Appendix 8 Newcastle City Council Final Expenses Summary
Final Expenses for Newcastle City Council 2008 Local Government Election(s)
Item Description Amount
Local Government Elections Programme Management Project Management 3,880 Performance Evaluation & Reporting, 6,940 Candidate Support, Legal
NSWEC Administration Fee 55,550 Programme Management Total 66,370
Finance Services Budget Management 580
Payroll Processing 7,150
Payables Processing 2,260 Mail Services 2,900 Finance Services Total 12,890
Election Services Council Visits 740
Candidate Info Sessions 1,790
De-brief Programme for Returning Officers 220
Centralised Vote Counting 22,490 Voting Centres (Incl. pre-poll, DIs & polling places) 16,680
Election Materials 39,530
Training Programme 6,830
Returning Officer Support Centre 6,320
Wages -Returning Officers 28,540
Wages -Office Assistants 74,410
Wages -Election Officials 113,310
Returning Officer Accommodation 45,220
Registration of How-to-Vote Material 110 Printing Ballot Papers 75,070 Election Services Total 431,260
Election Information Services Equal Access to Democracy 3,390
Elector Info Campaign -NSWEC Campaign 17,270
Elector Info Campaign -Brochure -
Elector Information 2,070 Info Kit
LG Profiling
Elector Enquiry Centre 7,830 Website & Education Services 5,810 Election Information Services Total 36,370
Information Technology
Systems Support 10,320 IT Setup 22,480
Website (dynamic) 2,020
Rolls 8,890 IT Personnel 4,720 Results 3,100 Information Technology Total 51,530
Total Expenses 598,400
Note: All amounts listed are GST Exclusive