news release · 2019-04-26 · news release exxon mobil corporation 5959 las colinas boulevard...
TRANSCRIPT

News Release Exxon Mobil Corporation
5959 Las Colinas Boulevard Irving, TX 75039 972 940 6007 Telephone 972 940 6143 Facsimile FOR IMMEDIATE RELEASE FRIDAY, APRIL 26, 2019
ExxonMobil Earns $2.4 Billion in First Quarter 2019
• Upstream liquids production grows by 5 percent versus first quarter 2018, driven by the Permian
• Portfolio strengthens with new offshore discoveries in Guyana and Cyprus
• Downstream and Chemical results reflect challenging industry margin environments
First First Fourth
Quarter Quarter Quarter
2019 2018 % 2018 %
Earnings Summary (Dollars in millions, except per share data)
Earnings (U.S. GAAP) 2,350 4,650 -49 6,000 -61
Earnings Per Common Share
Assuming Dilution 0.55 1.09 -50 1.41 -61
Capital and Exploration
Expenditures 6,890 4,867 42 7,843 -12
IRVING, Texas – April 26, 2019 – Exxon Mobil Corporation today announced estimated first quarter 2019 earnings of $2.4 billion, or $0.55 per share assuming dilution, compared with $4.7 billion a year earlier. Cash flow from operations and asset sales was $8.4 billion, including proceeds associated with asset sales of $107 million. During the quarter, the company distributed $3.5 billion in dividends to shareholders. Capital and exploration expenditures were $6.9 billion, up 42 percent from the prior year, reflecting key investments in the U.S. Permian Basin. Oil-equivalent production was 4 million barrels per day, up 2 percent from the first quarter of 2018. Excluding entitlement effects and divestments, oil-equivalent production was up 3 percent from the first quarter of 2018. Upstream liquids production grew by 5 percent compared with the first quarter of 2018, driven by Permian unconventional growth of nearly 140 percent.
“Solid operating performance in the first quarter helped mitigate the impact of challenging Downstream and Chemical margin environments. In addition, we continued to benefit from our integrated business model,” said Darren W. Woods, chairman and chief executive officer. “We are making strong progress on our growth plans and expect to deliver sustained value for our shareholders. The change in Canadian crude differentials, as well as heavy scheduled maintenance, similar to the fourth quarter of 2018, affected our quarterly results.”

2
First Quarter 2019 Business Highlights Upstream • Crude prices strengthened during the quarter but remained weaker, on average, than the fourth quarter
of 2018. North American differentials narrowed, largely as a result of imposed production curtailments in Canada and additional takeaway capacity in the Permian.
• Natural gas prices were impacted by warmer weather.
• Production volumes benefited from continued unconventional growth. However, first quarter production was negatively impacted by lower Kearl output in Canada and downtime.
Downstream • ExxonMobil achieved first sales of on-specification Group II basestocks from the advanced hydrocracker
at the Rotterdam refinery in the Netherlands. The new unit uses proprietary catalyst in a unique refining configuration to upgrade lower-value vacuum gas oil into higher-value EHC™ Group II basestocks and ultra-low sulfur diesel.
• Weak industry fuels margins from high gasoline inventory levels and narrowed North American crude differentials impacted results in the quarter.
• Overall heavy scheduled maintenance remained at similar levels to the fourth quarter of 2018.
Chemical • Sales volumes increased from the prior year quarter reflecting project growth, however, margins
remained challenged with continued supply length from recent industry capacity additions.
Strengthening the Portfolio • ExxonMobil made two additional discoveries offshore Guyana at the Tilapia-1 and Haimara-1 wells
during the first quarter. In April, the company also announced a new discovery at the Yellowtail-1 well, marking the 13th discovery on the Stabroek Block.
• ExxonMobil made a natural gas discovery offshore Cyprus in the Eastern Mediterranean at the Glaucus-
1 well. Based on preliminary interpretation of the well data, the discovery could represent an in-place natural gas resource of approximately 5 trillion to 8 trillion cubic feet (142 billion to 227 billion cubic meters). Further analysis is required to better determine the resource potential.
• ExxonMobil has revised its Permian Basin growth plans to produce more than 1 million oil-equivalent
barrels per day by as early as 2024. The size of the company’s resource base in the Permian is approximately 10 billion oil-equivalent barrels and is likely to grow further as analysis and development activities continue.
Investing for Growth • ExxonMobil and partner Qatar Petroleum made a final investment decision to proceed with development
of the Golden Pass LNG export project located in Sabine Pass, Texas. The facility is expected to start up in 2024. The project will have capacity to produce approximately 16 million tons of liquefied natural gas per year and provide an increased, reliable, long-term supply of liquefied natural gas to global gas markets.

3
• ExxonMobil reached a final investment decision and started construction on a new unit at its Beaumont, Texas refinery that will increase crude refining capacity by more than 65 percent, or 250,000 barrels per day. The third crude unit within the facility’s existing footprint will expand light crude oil refining and be supported by increased crude oil production in the Permian Basin.
• ExxonMobil reached a final investment decision on construction of a new polypropylene production unit
in Baton Rouge, Louisiana that will expand production capacity along the Gulf Coast by up to 450,000 metric tons per year. Construction will begin in 2019 and startup is anticipated by 2021.
Advancing Innovative Technologies and Products • ExxonMobil announced a new partnership with Microsoft Corporation that will make its Permian Basin
operations the largest-ever oil and gas acreage to use cloud technology to drive improvements in analyses and enhance operational efficiencies. The application of Microsoft technologies by ExxonMobil’s XTO Energy subsidiary is anticipated to improve capital efficiency and support Permian production growth by as much as 50,000 oil-equivalent barrels per day by 2025.
• ExxonMobil and Renewable Energy Group have signed a joint research agreement with Clariant AG to
evaluate the potential use of cellulosic sugars from sources such as agricultural waste and residues to produce biofuel, which has the potential to play a role in reducing greenhouse gas emissions.

4
Earnings and Volume Summary
Millions of Dollars 1Q 1Q
(unless noted) 2019 2018 Change Comments
Upstream
U.S. 96 429 -333 Lower liquids prices, higher growth-related expenses and an asset impairment charge (-115), partly offset by liquids volume growth
Non-U.S. 2,780 3,068 -288 Absence of Scarborough asset sale gain (-366), lower liquids prices, higher growth-related expenses and an asset impairment charge (-43), partly offset by higher gas realizations and favorable tax impacts
Total 2,876 3,497 -621 Prices -30, volumes +80, other -670
Production (koebd) 3,981 3,889 +92 Liquids +111 kbd: U.S. growth and improved reliability, partly offset by decline
Gas -114 mcfd: lower demand, decline, and divestments, partly offset by lower maintenance and growth
Downstream
U.S. (161) 319 -480 Higher scheduled maintenance and lower margins, partly offset by improved yield / sales mix
Non-U.S. (95) 621 -716 Lower margins and higher scheduled maintenance
Total (256) 940 -1,196 Margins -860, scheduled maintenance -450, other +110
Petroleum Product Sales (kbd) 5,415 5,432 -17
Chemical
U.S. 161 503 -342 Lower margins and higher growth-related expenses
Non-U.S. 357 508 -151 Lower margins and unfavorable foreign exchange impacts, partly offset by volume growth
Total 518 1,011 -493 Margins -360, foreign exchange -70, volumes +60, other -120
Prime Product Sales (kt) 6,772 6,668 +104 Growth-related volumes
Corporate and financing (788) (798) +10

5
Earnings and Volume Summary
Millions of Dollars 1Q 4Q
(unless noted) 2019 2018 Change Comments
Upstream
U.S. 96 265 -169 Lower volumes and lower gas realizations
Non-U.S. 2,780 3,048 -268 Lower volumes, unfavorable tax impacts and absence of favorable one-time 4Q'18 items, partly offset by higher liquids prices and lower exploration expenses
Total 2,876 3,313 -437 Volumes -290, prices +50, other -200
Production (koebd) 3,981 4,010 -29 Liquids -21 kbd: decline and higher downtime, partly offset by growth
Gas -50 mcfd: lower entitlements, partly offset by higher seasonal demand
Downstream
U.S. (161) 987 -1,148 Lower margins, including narrowed crude differentials and the change in mark-to-market derivative impacts, and higher scheduled maintenance
Non-U.S. (95) 1,717 -1,812 Lower margins, including the change in mark-to-market derivative impacts, and lower divestment gains with absence of the sale of Augusta refinery / Germany Retail conversion to branded wholesaler (-888), partly offset by lower scheduled maintenance
Total (256) 2,704 -2,960 Margins -2,060, divestment gains -900
Petroleum Product Sales (kbd) 5,415 5,495 -80
Chemical
U.S. 161 282 -121 Lower margins
Non-U.S. 357 455 -98 Absence of favorable tax item (-212), partly offset by lower downtime / maintenance
Total 518 737 -219 Margins -110, downtime / maintenance +80, other -190
Prime Product Sales (kt) 6,772 6,672 +100 Lower downtime / maintenance
Corporate and financing (788) (754) -34

6
Cash Flow from Operations and Asset Sales
Millions of Dollars 1Q
2019 Comments
Net income including noncontrolling interests 2,406 Including $56 million for noncontrolling interests
Depreciation 4,571
Changes in working capital 2,257 Including favorable seasonal payables
Other (896) Equity company earnings greater than dividends
Cash Flow from Operating 8,338
Activities (U.S. GAAP)
Asset sales 107
Cash Flow from Operations 8,445
and Asset Sales
First Quarter 2019 Financial Updates During the first quarter of 2019, Exxon Mobil Corporation purchased 5 million shares of its common stock for the treasury at a gross cost of $414 million. These shares were acquired to offset dilution in conjunction with the company’s benefit plans and programs. The corporation will continue to acquire shares to offset dilution in conjunction with its benefit plans and programs.

7
ExxonMobil will discuss financial and operating results and other matters during a webcast
at 8:30 a.m. Central Time on April 26, 2019. To listen to the event or access an archived
replay, please visit www.exxonmobil.com.
Cautionary Statement
Outlooks, projections, goals, targets, descriptions of strategic plans and objectives, and other statements of future events or conditions in this release are forward-looking statements. Actual future results, including business and project plans, capacities, costs, and timing; resource recoveries and production rates; and the impact of new technologies, including to increase capital efficiency and production and to reduce greenhouse gas emissions, could differ materially due to a number of factors. These include global or regional changes in supply and demand for oil, gas, and petrochemicals and other market conditions that impact prices and differentials; reservoir performance; the outcome of exploration projects and timely completion of development and construction projects; the impact of fiscal and commercial terms and the outcome of commercial negotiations or acquisitions; changes in law, taxes, or regulation including environmental regulations, and timely granting of governmental permits; war, and other political or security disturbances; the actions of competitors; the capture of efficiencies between business lines; unforeseen technical or operating difficulties; unexpected technological developments; the ability to bring new technologies to commercial scale on a cost-competitive basis; general economic conditions including the occurrence and duration of economic recessions; the results of research programs; and other factors discussed under the heading Factors Affecting Future Results on the Investors page of our website at www.exxonmobil.com and in Item 1A of ExxonMobil’s 2018 Form 10-K. We assume no duty to update these statements as of any future date. Frequently Used Terms and Non-GAAP Measures
This press release includes cash flow from operations and asset sales. Because of the regular nature of our asset management and divestment program, we believe it is useful for investors to consider proceeds associated with the sales of subsidiaries, property, plant and equipment, and sales and returns of investments together with cash provided by operating activities when evaluating cash available for investment in the business and financing activities. A reconciliation to net cash provided by operating activities is shown for the first quarter of 2019 on page 6 and for 1Q 2019, 1Q 2018 and 4Q 2018 in Attachment V. This press release also includes total taxes including sales-based taxes. This is a broader indicator of the total tax burden on the corporation’s products and earnings, including certain sales and value-added taxes imposed on and concurrent with revenue-producing transactions with customers and collected on behalf of governmental authorities (“sales-based taxes”). It combines “Income taxes” and “Total other taxes and duties” with sales-based taxes, which are reported net in the income statement. We believe it is useful for the corporation and its investors to understand the total tax burden imposed on the corporation’s products and earnings. A reconciliation to total taxes is shown as part of the Estimated Key Financial and Operating Data in Attachment I. References to the resource base and other quantities of oil, natural gas or condensate may include estimated amounts that are not yet classified as “proved reserves” under SEC definitions, but which are expected to be ultimately recoverable. The term “in-place” refers to those quantities of oil and natural gas estimated to be contained in known accumulations and includes recoverable and unrecoverable amounts. The term “project” as used in this release can refer to a variety of different activities and does not necessarily have the same meaning as in any government payment transparency reports. Further information on ExxonMobil’s frequently used financial and operating measures and other terms including “Cash flow from operations and asset sales”, and “Total taxes including sales-based taxes” is contained under the heading “Frequently Used Terms” available through the “Investors” section of our website at exxonmobil.com.

8
Reference to Earnings
References to corporate earnings mean net income attributable to ExxonMobil (U.S. GAAP) from the consolidated income statement. Unless otherwise indicated, references to earnings, Upstream, Downstream, Chemical and Corporate and financing segment earnings, and earnings per share are ExxonMobil’s share after excluding amounts attributable to noncontrolling interests. EHC is a registered trademark of Exxon Mobil Corporation. Exxon Mobil Corporation has numerous affiliates, many with names that include ExxonMobil, Exxon, Mobil, Esso, and XTO. For convenience and simplicity, those terms and terms such as corporation, company, our, we, and its are sometimes used as abbreviated references to specific affiliates or affiliate groups. Similarly, ExxonMobil has business relationships with thousands of customers, suppliers, governments, and others. For convenience and simplicity, words such as venture, joint venture, partnership, co-venturer, and partner are used to indicate business and other relationships involving common activities and interests, and those words may not indicate precise legal relationships.

9
Estimated Key Financial and Operating Data
Attachment I
Exxon Mobil Corporation
First Quarter 2019
(millions of dollars, unless noted)
First First Fourth
Quarter Quarter Quarter
2019 2018 2018
Earnings / Earnings Per Share
Total revenues and other income 63,625 68,211 71,895
Total costs and other deductions 59,336 60,971 63,774
Income before income taxes 4,289 7,240 8,121
Income taxes 1,883 2,457 1,915
Net income including noncontrolling interests 2,406 4,783 6,206
Net income attributable to noncontrolling interests 56 133 206
Net income attributable to ExxonMobil (U.S. GAAP) 2,350 4,650 6,000
Earnings per common share (dollars) 0.55 1.09 1.41
Earnings per common share
- assuming dilution (dollars) 0.55 1.09 1.41
Exploration expenses, including dry holes 280 287 555
Other Financial Data
Dividends on common stock
Total 3,505 3,291 3,502
Per common share (dollars) 0.82 0.77 0.82
Millions of common shares outstanding
At period end 4,231 4,234 4,237
Average - assuming dilution 4,270 4,270 4,270
ExxonMobil share of equity at period end 191,222 188,195 191,794
ExxonMobil share of capital employed at period end 234,673 231,282 232,280
Income taxes 1,883 2,457 1,915
Total other taxes and duties 8,087 8,815 8,473
Total taxes 9,970 11,272 10,388
Sales-based taxes 4,985 5,281 5,444
Total taxes including sales-based taxes 14,955 16,553 15,832
ExxonMobil share of income taxes of
equity companies 849 740 992

10
Attachment II
Exxon Mobil Corporation
First Quarter 2019
(millions of dollars)
First First Fourth
Quarter Quarter Quarter
2019 2018 2018
Earnings (U.S. GAAP)
Upstream
United States 96 429 265
Non-U.S. 2,780 3,068 3,048
Downstream
United States (161) 319 987
Non-U.S. (95) 621 1,717
Chemical
United States 161 503 282
Non-U.S. 357 508 455
Corporate and financing (788) (798) (754)
Net income attributable to ExxonMobil 2,350 4,650 6,000
11
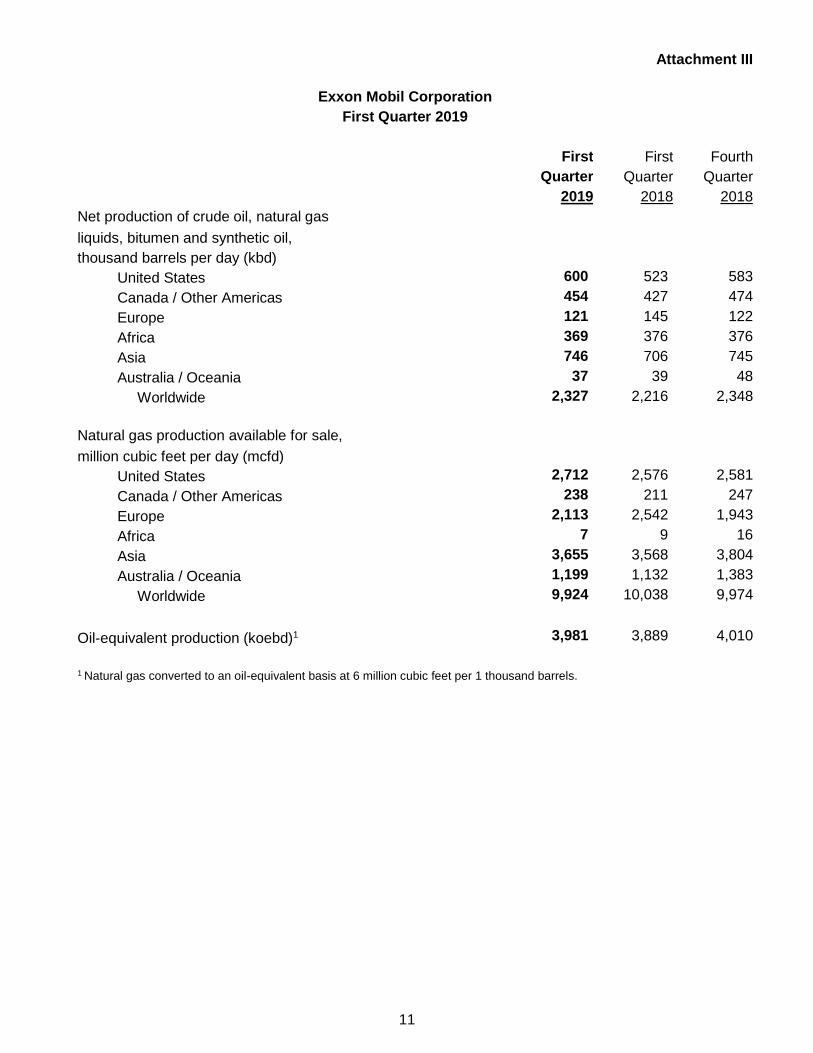
Attachment III
Exxon Mobil Corporation
First Quarter 2019
First First Fourth
Quarter Quarter Quarter
2019 2018 2018
Net production of crude oil, natural gas
liquids, bitumen and synthetic oil,
thousand barrels per day (kbd)
United States 600 523 583
Canada / Other Americas 454 427 474
Europe 121 145 122
Africa 369 376 376
Asia 746 706 745
Australia / Oceania 37 39 48
Worldwide 2,327 2,216 2,348
Natural gas production available for sale,
million cubic feet per day (mcfd)
United States 2,712 2,576 2,581
Canada / Other Americas 238 211 247
Europe 2,113 2,542 1,943
Africa 7 9 16
Asia 3,655 3,568 3,804
Australia / Oceania 1,199 1,132 1,383
Worldwide 9,924 10,038 9,974
Oil-equivalent production (koebd)1 3,981 3,889 4,010
1 Natural gas converted to an oil-equivalent basis at 6 million cubic feet per 1 thousand barrels.

12
Attachment IV
Exxon Mobil Corporation
First Quarter 2019
First First Fourth
Quarter Quarter Quarter
2019 2018 2018
Refinery throughput (kbd)
United States 1,373 1,518 1,661
Canada 383 408 408
Europe 1,325 1,495 1,366
Asia Pacific 609 720 670
Other 196 152 193
Worldwide 3,886 4,293 4,298
Petroleum product sales (kbd)
United States 2,210 2,128 2,230
Canada 484 484 516
Europe 1,510 1,574 1,474
Asia Pacific 749 795 825
Other 462 451 450
Worldwide 5,415 5,432 5,495
Gasolines, naphthas 2,149 2,215 2,183
Heating oils, kerosene, diesel 1,914 1,828 1,915
Aviation fuels 386 396 376
Heavy fuels 299 346 387
Specialty products 667 647 634
Worldwide 5,415 5,432 5,495
Chemical prime product sales,
thousand metric tons (kt)
United States 2,322 2,391 2,577
Non-U.S. 4,450 4,277 4,095
Worldwide 6,772 6,668 6,672

13
Attachment V
Exxon Mobil Corporation
First Quarter 2019
(millions of dollars)
First First Fourth
Quarter Quarter Quarter
2019 2018 2018
Capital and Exploration Expenditures
Upstream
United States 2,548 1,248 2,630
Non-U.S. 2,813 2,511 3,620
Total 5,361 3,759 6,250
Downstream
United States 414 218 325
Non-U.S. 415 396 541
Total 829 614 866
Chemical
United States 552 343 579
Non-U.S. 144 122 132
Total 696 465 711
Other 4 29 16
Worldwide 6,890 4,867 7,843
Cash flow from operations and asset sales
Net cash provided by operating activities
(U.S. GAAP) 8,338 8,519 8,607
Proceeds associated with asset sales 107 1,441 884
Cash flow from operations and asset sales 8,445 9,960 9,491

14
Attachment VI
Exxon Mobil Corporation
Earnings
$ Millions $ Per Common Share1
2015
First Quarter 4,940 1.17
Second Quarter 4,190 1.00
Third Quarter 4,240 1.01
Fourth Quarter 2,780 0.67
Year 16,150 3.85
2016
First Quarter 1,810 0.43
Second Quarter 1,700 0.41
Third Quarter 2,650 0.63
Fourth Quarter 1,680 0.41
Year 7,840 1.88
2017
First Quarter 4,010 0.95
Second Quarter 3,350 0.78
Third Quarter 3,970 0.93
Fourth Quarter 8,380 1.97
Year 19,710 4.63
2018
First Quarter 4,650 1.09
Second Quarter 3,950 0.92
Third Quarter 6,240 1.46
Fourth Quarter 6,000 1.41
Year 20,840 4.88
2019
First Quarter 2,350 0.55
1 Computed using the average number of shares outstanding during each period.