news release · news release intel reports second-quarter 2019 financial results news summary: •...
TRANSCRIPT

1 Find the press release from today's announcement at: https://newsroom.intel.com/news-releases/intel-smartphone-modem-business/
* Data-centric businesses include DCG, IOTG, Mobileye, NSG, PSG and All Other
^ No adjustment on a non-GAAP basis
Intel Corporation
2200 Mission College Blvd.
Santa Clara, CA 95054-1549
News Release
Intel Reports Second-Quarter 2019 Financial Results
News Summary:
• Second-quarter revenue of $16.5 billion, down 3% year-over-year (YoY), exceeded April guidance. IOTG
achieved record revenue. Data-centric revenue declined 7 percent; PC-centric revenue grew 1 percent YoY.
• Second-quarter earnings-per-share (EPS) exceeded April guidance. GAAP EPS of $0.92 declined 12 percent
YoY; non-GAAP EPS of $1.06 was up 2 percent.
• Announced an agreement for Apple to acquire the majority of Intel’s smartphone modem business1.
• Raising full-year revenue outlook to $69.5 billion, up $500 million from April guidance. Now expecting full-year
GAAP EPS of $4.10 and raising full-year non-GAAP EPS outlook to $4.40.
SANTA CLARA, Calif., July 25, 2019 -- Intel Corporation today reported second-quarter 2019 financial results.
“Second quarter results exceeded our expectations on both revenue and earnings, as the growth of data and
compute-intensive applications are driving customer demand for higher performance products in both our PC-
centric and data-centric businesses,” said Bob Swan, Intel CEO. “Based on our outperformance in the quarter,
we’re raising our full-year guidance. Intel’s ambitions are as big as ever, our collection of assets is unrivaled, and
our transformation continues.”
Q2 2019 Financial Highlights
GAAP Non-GAAP
Q2 2019 Q2 2018 vs. Q2 2018 Q2 2019 Q2 2018 vs. Q2 2018
Revenue ($B) $16.5 $17.0 down 3% $16.5^ $17.0^ down 3%
Gross Margin 59.8% 61.4% down 1.6 pts 61.6% 63.0% down 1.4 pts
R&D and MG&A ($B) $5.0 $5.1 down 1% $5.0^ $5.1^ down 1%
Operating Income ($B) $4.6 $5.3 down 12% $5.1 $5.6 down 8%
Tax Rate 11.5% 9.5% up 2.1 pts 11.8% 11.7% up 0.1 pt
Net Income ($B) $4.2 $5.0 down 17% $4.8 $4.9 down 3%
Earnings Per Share $0.92 $1.05 down 12% $1.06 $1.04 up 2%
In the second quarter, the company generated approximately $7.6 billion in cash from operations, paid dividends of
$1.4 billion and used $3.0 billion to repurchase 67 million shares of stock.

Intel/Page 2
^ No adjustment on a non-GAAP basis
* Data-centric businesses include DCG, IOTG, Mobileye, NSG, PSG and All Other 1 IOTG growth rate excludes Q2'18 $80M for Wind River revenue
Business Unit Summary
Key Business Unit Revenue and Trends
Q2 2019 vs. Q2 2018
PC-centric CCG $8.8 billion up 1%
Data-centric
DCG $5.0 billion down 10%
Internet of Things
IOTG $986 million up 12%
Mobileye $201 million up 16%
NSG $940 million down 13%
PSG $489 million down 5%
down 7%*
Second-quarter revenue of $16.5 billion was $900 million higher than April guidance. Intel achieved 1 percent
growth in the PC-centric business while data-centric revenue declined 7 percent.
The PC-centric business (CCG) was up 1 percent in the second quarter due to a strong mix of Intel's higher
performance products, strength in the commercial segment, and customers buying ahead of possible tariff impacts.
New, 10nm-based 10th Gen Intel® Core™ processors (code-named "Ice Lake") are now shipping, and expected to
be in volume systems on retail shelves this 2019 holiday selling season.
Collectively, Intel's data-centric businesses declined 7 percent YoY in the second quarter. In the Data Center Group
(DCG), the communications service provider segment grew 3 percent while the cloud segment declined 1 percent
and enterprise and government revenue declined 31 percent. The Internet of Things Group (IOTG) achieved record
revenue, up 12 percent YoY (23 percent excluding Wind River1) on broad strength and increased demand for higher
performance processors. Mobileye achieved second-quarter revenue of $201 million, up 16 percent YoY on
continued customer momentum. Intel's memory business (NSG) was down 13 percent YoY in a challenging pricing
environment. Intel's Programmable Solutions Group (PSG) revenue was down 5 percent YoY in the second quarter.
Additional information regarding Intel’s results can be found in the Q2'19 Earnings Presentation available at:
www.intc.com/results.cfm.
Intel/Page 3
^ No adjustment on a non-GAAP basis
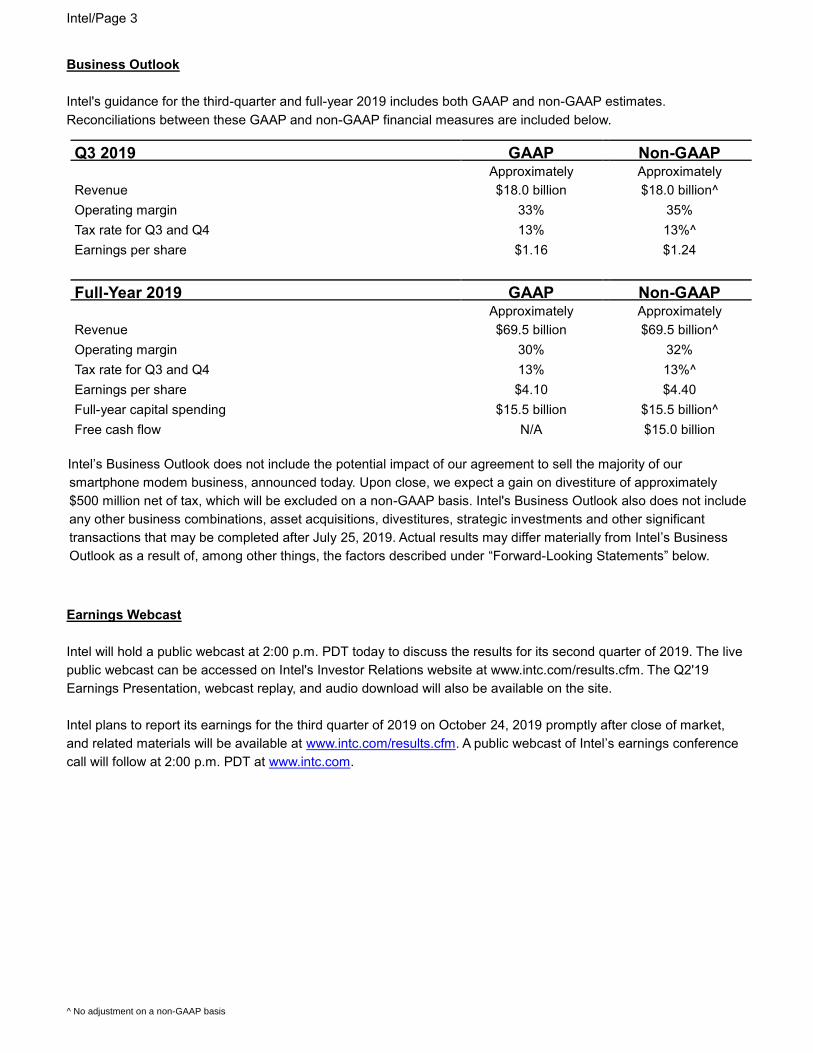
Business Outlook
Intel's guidance for the third-quarter and full-year 2019 includes both GAAP and non-GAAP estimates.
Reconciliations between these GAAP and non-GAAP financial measures are included below.
Q3 2019 GAAP Non-GAAP Approximately Approximately
Revenue $18.0 billion $18.0 billion^
Operating margin 33% 35%
Tax rate for Q3 and Q4 13% 13%^
Earnings per share $1.16 $1.24
Full-Year 2019 GAAP Non-GAAP Approximately Approximately
Revenue $69.5 billion $69.5 billion^
Operating margin 30% 32%
Tax rate for Q3 and Q4 13% 13%^
Earnings per share $4.10 $4.40
Full-year capital spending $15.5 billion $15.5 billion^
Free cash flow N/A $15.0 billion
Intel’s Business Outlook does not include the potential impact of our agreement to sell the majority of our
smartphone modem business, announced today. Upon close, we expect a gain on divestiture of approximately
$500 million net of tax, which will be excluded on a non-GAAP basis. Intel's Business Outlook also does not include
any other business combinations, asset acquisitions, divestitures, strategic investments and other significant
transactions that may be completed after July 25, 2019. Actual results may differ materially from Intel’s Business
Outlook as a result of, among other things, the factors described under “Forward-Looking Statements” below.
Earnings Webcast
Intel will hold a public webcast at 2:00 p.m. PDT today to discuss the results for its second quarter of 2019. The live
public webcast can be accessed on Intel's Investor Relations website at www.intc.com/results.cfm. The Q2'19
Earnings Presentation, webcast replay, and audio download will also be available on the site.
Intel plans to report its earnings for the third quarter of 2019 on October 24, 2019 promptly after close of market,
and related materials will be available at www.intc.com/results.cfm. A public webcast of Intel’s earnings conference
call will follow at 2:00 p.m. PDT at www.intc.com.

Intel/Page 4
Forward-Looking Statements
Intel’s Business Outlook and other statements in this release that refer to future plans and expectations are forward-
looking statements that involve a number of risks and uncertainties. Words such as "anticipates," "expects,"
"intends," "goals," "plans," "believes," "seeks," "estimates," "continues," "may," "will," "would," "should," "could," and
variations of such words and similar expressions are intended to identify such forward-looking statements.
Statements that refer to or are based on estimates, forecasts, projections, uncertain events or assumptions,
including statements relating to total addressable market (TAM) or market opportunity, future products and the
expected availability and benefits of such products, and anticipated trends in our businesses or the markets
relevant to them, also identify forward-looking statements. All forward-looking statements included in this release
are based on management's expectations as of the date of this release and, except as required by law, Intel
disclaims any obligation to update these forward-looking statements to reflect future events or circumstances.
Forward-looking statements involve many risks and uncertainties that could cause actual results to differ materially
from those expressed or implied in such statements. Intel presently considers the following to be among the
important factors that could cause actual results to differ materially from the company's expectations.
• Demand for Intel's products is highly variable and could differ from expectations due to factors including
changes in business and economic conditions; customer confidence or income levels, and the levels of
customer capital spending; the introduction, availability and market acceptance of Intel's products, products
used together with Intel products, and competitors' products; competitive and pricing pressures, including
actions taken by competitors; supply constraints and other disruptions affecting customers; changes in
customer order patterns including order cancellations; changes in customer needs and emerging
technology trends; and changes in the level of inventory at customers.
• Intel's results could vary significantly from expectations based on capacity utilization; variations in inventory
valuation, including variations related to the timing of qualifying products for sale; changes in revenue
levels; segment product mix; the timing and execution of the manufacturing ramp and associated costs;
excess or obsolete inventory; changes in unit costs; defects or disruptions in the supply of materials or
resources; and product manufacturing quality/yields. Variations in results may also be caused by the timing
of Intel product introductions and related expenses, including marketing programs, and Intel's ability to
respond quickly to technological developments and to introduce new products or incorporate new features
into existing products, as well as decisions to exit product lines or businesses, which may result in
restructuring and asset impairment charges.
• Intel's results could be affected by adverse economic, social, political and physical/infrastructure conditions
in countries where Intel, its customers or its suppliers operate, including recession or slowing growth,
military conflict and other security risks, natural disasters, infrastructure disruptions, health concerns,
fluctuations in currency exchange rates, sanctions and tariffs, and continuing uncertainty regarding social,
political, immigration, and tax and trade policies in the U.S. and abroad, including the United Kingdom's
vote to withdraw from the European Union. Results may also be affected by the formal or informal
imposition by countries of new or revised export and/or import and doing-business regulations, which could
be changed without prior notice.
• Intel operates in highly competitive industries and its operations have high costs that are either fixed or
difficult to reduce in the short term. In addition, in connection with our strategic transformation to a data-
centric company, we have entered new areas and introduced adjacent products, where we face new
sources of competition and uncertain market demand or acceptance of our products, and these new areas
and products may not grow as projected.
• The amount, timing and execution of Intel's stock repurchase program may fluctuate based on Intel's
priorities for the use of cash for other purposes—such as investing in our business, including operational

Intel/Page 5
and capital spending, acquisitions, and returning cash to our stockholders as dividend payments—and
because of changes in cash flows, tax laws, or the market price of our common stock.
• Intel's expected tax rate is based on current tax law, including current interpretations of the Tax Cuts and
Jobs Act of 2017 (”TCJA”), and current expected income and may be affected by evolving interpretations of
TCJA; changes in the volume and mix of profits earned across jurisdictions with varying tax rates; changes
in the estimates of credits, benefits and deductions; the resolution of issues arising from tax audits with
various tax authorities, including payment of interest and penalties; and the ability to realize deferred tax
assets.
• Intel's results could be affected by gains or losses from equity securities and interest and other, which could
vary depending on gains or losses on the change in fair value, sale, exchange, or impairments of equity
and debt investments, interest rates, cash balances, and changes in fair value of derivative instruments.
• Product defects or errata (deviations from published specifications) may adversely impact our expenses,
revenues and reputation.
• We or third parties regularly identify security vulnerabilities with respect to our processors and other
products as well as the operating systems and workloads running on them. Security vulnerabilities and any
limitations of, or adverse effects resulting from, mitigation techniques can adversely affect our results of
operations, financial condition, customer relationships, prospects, and reputation in a number of ways, any
of which may be material, including incurring significant costs related to developing and deploying updates
and mitigations, writing down inventory value, a reduction in the competitiveness of our products, defending
against product claims and litigation, responding to regulatory inquiries or actions, paying damages,
addressing customer satisfaction considerations, or taking other remedial steps with respect to third parties.
Adverse publicity about security vulnerabilities or mitigations could damage our reputation with customers
or users and reduce demand for our products and services. A detailed description of these risks is set forth
in the "Risk Factors" section of our most recent reports on Forms 10-K and 10-Q.
• Intel's results could be affected by litigation or regulatory matters involving intellectual property, stockholder,
consumer, antitrust, commercial, disclosure and other issues. An unfavorable ruling could include monetary
damages or an injunction prohibiting Intel from manufacturing or selling one or more products, precluding
particular business practices, impacting Intel's ability to design its products, or requiring other remedies
such as compulsory licensing of intellectual property.
• Intel's results may be affected by the timing of closing of acquisitions, divestitures and other significant
transactions.
Detailed information regarding these and other factors that could affect Intel's business and results is included in
Intel's SEC filings, including the company's most recent reports on Forms 10-K and 10-Q, particularly the "Risk
Factors" sections of those reports. Copies of these filings may be obtained by visiting our Investor Relations
website at www.intc.com or the SEC's website at www.sec.gov.

Intel/Page 6
About Intel
Intel (NASDAQ: INTC), a leader in the semiconductor industry, is shaping the data-centric future with computing
and communications technology that is the foundation of the world’s innovations. The company’s engineering
expertise is helping address the world’s greatest challenges as well as helping secure, power and connect billions
of devices and the infrastructure of the smart, connected world - from the cloud to the network to the edge and
everything in between. Find more information about Intel at newsroom.intel.com and intel.com.
Intel, the Intel logo, Intel Optane, and Thunderbolt are trademarks of Intel Corporation or its subsidiaries in the U.S.
and/or other countries.
CONTACTS: Brooke Wells Cara Walker
Investor Relations Media Relations
503-613-8230 503-696-0831

Intel/Page 7
INTEL CORPORATION
CONSOLIDATED SUMMARY STATEMENT OF INCOME DATA
Three Months Ended Six Months Ended
(In Millions, Except Per Share Amounts; Unaudited) Jun 29,
2019 Jun 30,
2018 Jun 29,
2019 Jun 30,
2018
NET REVENUE $ 16,505 $ 16,962 $ 32,566 $ 33,028
Cost of sales 6,627 6,543 13,599 12,878
GROSS MARGIN 9,878 10,419 18,967 20,150
Research and development (R&D) 3,438 3,371 6,770 6,682
Marketing, general and administrative (MG&A) 1,589 1,725 3,122 3,625
R&D AND MG&A 5,027 5,096 9,892 10,307
Restructuring and other charges 184 — 184 —
Amortization of acquisition-related intangibles 50 50 100 100
OPERATING EXPENSES 5,261 5,146 10,176 10,407
OPERATING INCOME 4,617 5,273 8,791 9,743
Gains (losses) on equity investments, net 170 (203 ) 604 440
Interest and other, net (63 ) 459 (124 ) 357
INCOME BEFORE TAXES 4,724 5,529 9,271 10,540
Provision for taxes 545 523 1,118 1,080
NET INCOME $ 4,179 $ 5,006 $ 8,153 $ 9,460
EARNINGS PER SHARE - BASIC $ 0.94 $ 1.08 $ 1.82 $ 2.03
EARNINGS PER SHARE - DILUTED $ 0.92 $ 1.05 $ 1.79 $ 1.98
WEIGHTED AVERAGE SHARES OF COMMON STOCK OUTSTANDING:
BASIC 4,466 4,649 4,479 4,661
DILUTED 4,523 4,747 4,543 4,768

Intel/Page 8
INTEL CORPORATION
CONSOLIDATED SUMMARY BALANCE SHEET DATA
(In Millions) Jun 29, 2019
Dec 29,
2018
CURRENT ASSETS (unaudited)
Cash and cash equivalents $ 2,867 $ 3,019
Short-term investments 2,414 2,788
Trading assets 6,663 5,843
Total cash investments 11,944 11,650
Accounts receivable 6,233 6,722
Inventories
Raw materials 808 813
Work in process 5,612 4,511
Finished goods 2,276 1,929
8,696 7,253
Other current assets 2,366 3,162
TOTAL CURRENT ASSETS 29,239 28,787
Property, plant and equipment, net 51,377 48,976
Equity investments 4,629 6,042
Other long-term investments 3,577 3,388
Goodwill 24,583 24,513
Identified intangible assets, net 11,249 11,836
Other long-term assets 6,105 4,421
TOTAL ASSETS $ 130,759 $ 127,963
CURRENT LIABILITIES
Short-term debt $ 3,726 $ 1,261
Accounts payable 4,682 3,824
Accrued compensation and benefits 2,554 3,622
Other accrued liabilities 8,743 7,919
TOTAL CURRENT LIABILITIES 19,705 16,626
Debt 25,089 25,098
Contract liabilities 1,558 2,049
Income taxes payable, non-current 4,847 4,897
Deferred income taxes 1,783 1,665
Other long-term liabilities 2,583 2,646
TEMPORARY EQUITY 247 419
Stockholders' equity
Preferred stock — —
Common stock and capital in excess of par value 25,140 25,365
Accumulated other comprehensive income (loss) (622 ) (974 )
Retained earnings 50,429 50,172
TOTAL STOCKHOLDERS' EQUITY 74,947 74,563
TOTAL LIABILITIES, TEMPORARY EQUITY AND STOCKHOLDERS' EQUITY $ 130,759 $ 127,963
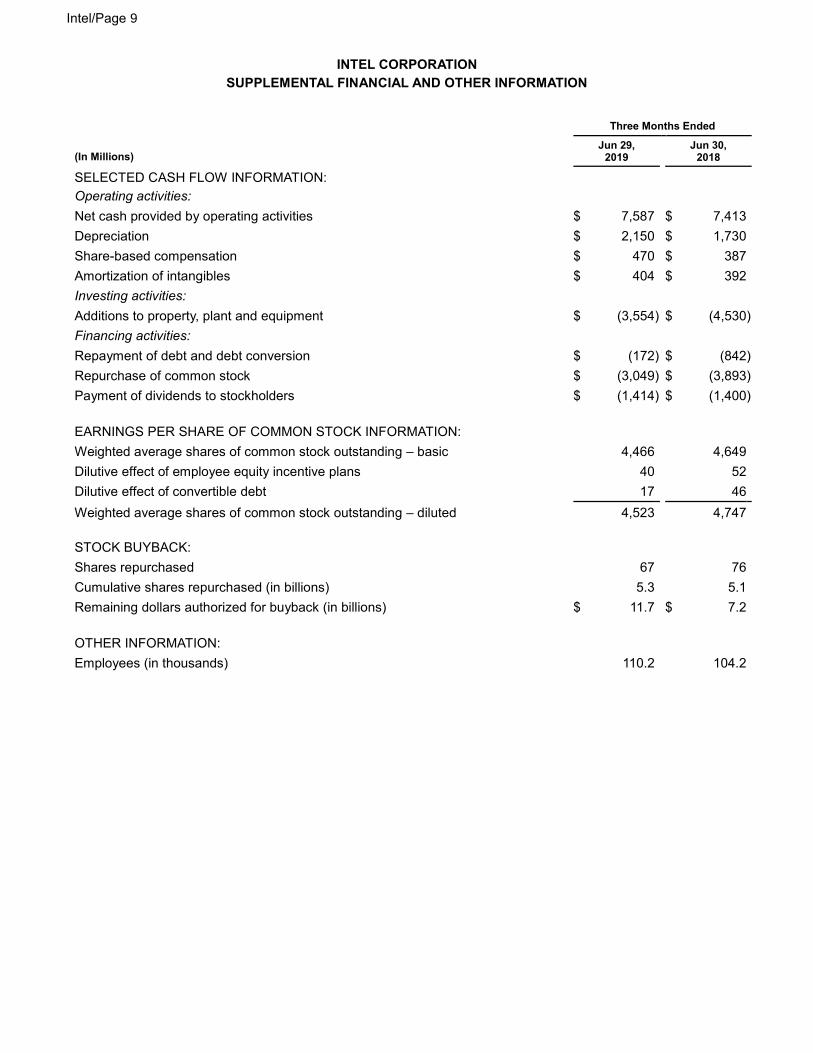
Intel/Page 9
INTEL CORPORATION
SUPPLEMENTAL FINANCIAL AND OTHER INFORMATION
Three Months Ended
(In Millions) Jun 29,
2019 Jun 30,
2018
SELECTED CASH FLOW INFORMATION:
Operating activities:
Net cash provided by operating activities $ 7,587 $ 7,413
Depreciation $ 2,150 $ 1,730
Share-based compensation $ 470 $ 387
Amortization of intangibles $ 404 $ 392
Investing activities:
Additions to property, plant and equipment $ (3,554 ) $ (4,530 )
Financing activities:
Repayment of debt and debt conversion $ (172 ) $ (842 )
Repurchase of common stock $ (3,049 ) $ (3,893 )
Payment of dividends to stockholders $ (1,414 ) $ (1,400 )
EARNINGS PER SHARE OF COMMON STOCK INFORMATION:
Weighted average shares of common stock outstanding – basic 4,466 4,649
Dilutive effect of employee equity incentive plans 40 52
Dilutive effect of convertible debt 17 46
Weighted average shares of common stock outstanding – diluted 4,523 4,747
STOCK BUYBACK:
Shares repurchased 67 76
Cumulative shares repurchased (in billions) 5.3 5.1
Remaining dollars authorized for buyback (in billions) $ 11.7 $ 7.2
OTHER INFORMATION:
Employees (in thousands) 110.2 104.2

Intel/Page 10
INTEL CORPORATION
SUPPLEMENTAL OPERATING SEGMENT RESULTS
Three Months Ended Six Months Ended
(In Millions) Jun 29,
2019
Jun 30, 2018
Jun 29,
2019
Jun 30, 2018
Net Revenue Client Computing Group
Platform $ 7,925 $ 8,065 $ 15,749 $ 15,680
Adjacency 916 663 1,678 1,268
8,841 8,728 17,427 16,948 Data Center Group
Platform 4,553 5,100 9,035 9,924
Adjacency 430 449 850 859
4,983 5,549 9,885 10,783 Internet of Things
IOTG 986 880 1,896 1,720
Mobileye 201 173 410 324
1,187 1,053 2,306 2,044
Non-Volatile Memory Solutions Group 940 1,079 1,855 2,119
Programmable Solutions Group 489 517 975 1,015
All Other 65 36 118 119
TOTAL NET REVENUE $ 16,505 $ 16,962 $ 32,566 $ 33,028
Operating income (loss) Client Computing Group $ 3,737 $ 3,234 $ 6,809 $ 6,025
Data Center Group 1,800 2,737 3,641 5,339
Internet of Things IOTG 294 243 545 470
Mobileye 53 44 121 54
347 287 666 524
Non-Volatile Memory Solutions Group (284 ) (65 ) (581 ) (146 )
Programmable Solutions Group 52 101 141 198
All Other (1,035 ) (1,021 ) (1,885 ) (2,197 )
TOTAL OPERATING INCOME $ 4,617 $ 5,273 $ 8,791 $ 9,743
Revenue for our reportable and non-reportable operating segments is primarily related to the following product lines:
• CCG includes platforms designed for end-user form factors, focusing on higher growth segments of 2-in-1, thin-and-light, commercial and
gaming, and growing adjacencies such as WiFi and Thunderbolt™ products.
• DCG includes workload-optimized platforms and related products designed for cloud, enterprise, and communication infrastructure market
segments.
• IOTG includes high-performance compute solutions for targeted verticals and embedded applications in market segments such as retail,
manufacturing, health care, energy, automotive, and government.
• Mobileye includes computer vision and machine learning-based sensing, data analysis, localization mapping and driving policy technology for
advanced driver assistance systems (ADAS) and autonomous driving.
• NSG includes Intel® Optane™ technology and 3D NAND flash memory, primarily used in solid-state drives (SSDs).
• PSG includes programmable semiconductors, primarily field-programmable gate arrays (FPGAs), and related products for a broad range of
markets, such as communications, data center, industrial, and military.
We have sales and marketing, manufacturing, engineering, finance, and administration groups. Expenses for these groups are generally
allocated to the operating segments.

Intel/Page 11
All other category includes revenue, expenses, and charges such as:
• results of operations from non-reportable segments not otherwise presented;
• historical results of operations from divested businesses;
• results of operations of start-up businesses that support our initiatives, including our foundry business; • amounts included within restructuring and other charges;
• a portion of employee benefits, compensation, and other expenses not allocated to the operating segments; and
• acquisition-related costs, including amortization and any impairment of acquisition-related intangibles and goodwill.
A substantial majority of our revenue is generated from the sale of platform products. Platform products incorporate various components and
technologies, including a microprocessor and chipset, a stand-alone SoC, or a multi-chip package based on Intel® architecture. Our remaining
primary product lines are incorporated in "adjacency."

Intel/Page 12
INTEL CORPORATION
SUPPLEMENTAL PLATFORM REVENUE INFORMATION
Q2 2019 Q2 2019 YTD 2019
compared to
Q1 2019 compared to
Q2 2018 compared to
YTD 2018
Client Computing Group Platform
Notebook platform volumes 15% (2)% (4)%
Notebook platform average selling prices (9)% 3% 8%
Desktop platform volumes (4)% (11)% (9)%
Desktop platform average selling prices (2)% 5% 6%
Data Center Group Platform
Unit volumes (2)% (12)% (10)%
Average selling prices 4% 2% 1%

Intel/Page 13
INTEL CORPORATION
EXPLANATION OF NON-GAAP MEASURES
In addition to disclosing financial results in accordance with U.S. generally accepted accounting principles (GAAP), this earnings
release contains references to the non-GAAP financial measures included in the table below. We believe these non-GAAP
financial measures provide investors with useful supplemental information about the financial performance of our business,
enable comparison of financial results between periods where certain items may vary independent of business performance, and
allow for greater transparency with respect to key metrics used by management in operating our business and measuring our
performance.
Our non-GAAP financial measures reflect adjustments based on the following items, as well as the related income tax effects.
Income tax effects have been calculated using an appropriate tax rate for each adjustment. We also provide a non-GAAP
financial measure of free cash flow, as described below. These non-GAAP financial measures should not be considered a
substitute for, or superior to, financial measures calculated in accordance with GAAP, and the financial results calculated in
accordance with GAAP and reconciliations from these results should be carefully evaluated.
Amortization of acquisition-related intangible assets: Amortization of acquisition-related intangible assets consists of amortization
of intangible assets such as developed technology, brands, and customer relationships acquired in connection with business
combinations. We record charges related to the amortization of these intangibles within both cost of sales and operating
expenses in our GAAP financial statements. Amortization charges for our acquisition-related intangible assets are inconsistent in
size and are significantly impacted by the timing and valuation of our acquisitions, rather than our core operations.
Consequently, our non-GAAP adjustments exclude these charges to facilitate an evaluation of our current operating performance
and comparisons to our past operating performance.
Restructuring and other charges: Restructuring charges are costs associated with a formal restructuring plan and are primarily
related to employee severance and benefit arrangements. Other charges include asset impairments. We exclude restructuring
and other charges, including any adjustments to charges recorded in prior periods, for purposes of calculating certain non-GAAP
measures. We believe that these costs do not reflect our current operating performance. Consequently, our non-GAAP
adjustments exclude these charges to facilitate an evaluation of our current operating performance and comparisons to our past
operating performance.
Gains or losses from divestiture: We divested Wind River in Q2 2018 and recognized an associated gain. Our non-GAAP
earnings per share figures exclude this impact to facilitate an evaluation of our current operating performance and comparisons
to our past operating performance.
Ongoing mark-to-market on marketable equity securities: We exclude gains and losses resulting from ongoing mark-to-market
adjustments of our marketable equity securities, after the initial mark-to-market adjustment is recorded upon a security becoming
marketable, when calculating certain non-GAAP measures, as we do not believe this volatility correlates to our core operational
performance. Consequently, our non-GAAP earnings per share figures exclude these impacts to facilitate an evaluation of our
current operating performance and comparisons to our past operating performance.
Tax Reform adjustment: During Q2 2018, we made an adjustment to our U.S. Tax Cuts and Jobs Act (Tax Reform) provisional
tax estimates that we recorded in Q4 2017. We exclude this provisional tax adjustment when calculating certain non-GAAP
measures. We believe excluding this adjustment facilitates a better evaluation of our current operating performance and
comparisons to past operating performance.
Free cash flow: We reference a non-GAAP financial measure of free cash flow, which is used by management when assessing
our sources of liquidity, capital resources, and quality of earnings. We believe this non-GAAP financial measure is helpful to
investors in understanding our capital requirements and provides an additional means to reflect the cash flow trends of our
business.

Intel/Page 14
INTEL CORPORATION
SUPPLEMENTAL RECONCILIATIONS OF GAAP OUTLOOK TO NON-GAAP OUTLOOK
Set forth below are reconciliations of the non-GAAP financial measure to the most directly comparable GAAP financial measure.
The non-GAAP financial measures disclosed by the company have limitations and should not be considered a substitute for, or
superior to, the financial measures prepared in accordance with GAAP, and the financial outlook prepared in accordance with
GAAP and the reconciliations from this Business Outlook should be carefully evaluated. Please refer to "Explanation of Non-
GAAP Measures" in this document for a detailed explanation of the adjustments made to the comparable GAAP measures, the
ways management uses the non-GAAP measures, and the reasons why management believes the non-GAAP measures
provide useful information for investors.
Q3 2019 Outlook Full-Year 2019
Approximately Approximately
GAAP OPERATING MARGIN 33 % 30 %
Amortization of acquisition-related intangible assets 2 % 2 %
NON-GAAP OPERATING MARGIN 35 % 32 %
GAAP DILUTED EARNINGS PER COMMON SHARE $ 1.16 $ 4.10
Amortization of acquisition-related intangible assets 0.08 0.30
Restructuring and other charges 0.02 0.06
Ongoing mark-to-market on marketable equity securities — (0.02 )
Income tax effect (0.02 ) (0.04 )
NON-GAAP DILUTED EARNINGS PER COMMON SHARE $ 1.24 $ 4.40
(In Billions) Full-Year 2019
GAAP CASH FROM OPERATIONS $ 30.5
Additions to property, plant and equipment (15.5 )
FREE CASH FLOW $ 15.0

Intel/Page 15
INTEL CORPORATION
SUPPLEMENTAL RECONCILIATIONS OF GAAP ACTUALS TO NON-GAAP ACTUALS
Set forth below are reconciliations of the non-GAAP financial measure to the most directly comparable GAAP financial measure.
The non-GAAP financial measure disclosed by the company has limitations and should not be considered a substitute for, or
superior to, the financial measure prepared in accordance with GAAP, and the reconciliations from GAAP to Non-GAAP actuals
should be carefully evaluated. Please refer to "Explanation of Non-GAAP Measures" in this document for a detailed explanation
of the adjustment made to the comparable GAAP measures, the ways management uses the non-GAAP measures, and the
reasons why management believes the non-GAAP measures provide useful information for investors.
Three Months Ended Six Months Ended
(In Millions, Except Per Share Amounts) Jun 29,
2019 Jun 30,
2018 Jun 29,
2019 Jun 30,
2018 GAAP GROSS MARGIN $ 9,878 $ 10,419 $ 18,967 $ 20,150 Amortization of acquisition-related intangible assets 287 275 568 550
NON-GAAP GROSS MARGIN $ 10,165 $ 10,694 $ 19,535 $ 20,700
GAAP GROSS MARGIN PERCENTAGE 59.8 % 61.4 % 58.2 % 61.0 %
Amortization of acquisition-related intangible assets 1.7 % 1.6 % 1.7 % 1.7 %
NON-GAAP GROSS MARGIN PERCENTAGE 61.6 % 63.0 % 60.0 % 62.7 %
GAAP OPERATING INCOME $ 4,617 $ 5,273 $ 8,791 $ 9,743 Amortization of acquisition-related intangible assets 337 325 668 650 Restructuring and other charges 184 — 184 —
NON-GAAP OPERATING INCOME $ 5,138 $ 5,598 $ 9,643 $ 10,393 GAAP TAX RATE 11.5 % 9.5 % 12.1 % 10.2 %
Other 0.2 % 2.2 % 0.1 % 1.5 %
NON-GAAP TAX RATE 11.8 % 11.7 % 12.1 % 11.7 %
GAAP NET INCOME $ 4,179 $ 5,006 $ 8,153 $ 9,460 Amortization of acquisition-related intangible assets 337 325 668 650 Restructuring and other charges 184 — 184 — (Gains) losses from divestiture — (494 ) — (494 )
Ongoing mark-to-market on marketable equity securities 179 235 (74 ) (371 )
Tax Reform — (181 ) — (181 )
Income tax effect (94 ) 48 (98 ) 51
NON-GAAP NET INCOME $ 4,785 $ 4,940 $ 8,833 $ 9,116
GAAP DILUTED EARNINGS PER COMMON SHARE $ 0.92 $ 1.05 $ 1.79 $ 1.98 Amortization of acquisition-related intangible assets 0.08 0.07 0.15 0.14 Restructuring and other charges 0.04 — 0.04 — (Gains) losses from divestiture — (0.10 ) — (0.10 )
Ongoing mark-to-market on marketable equity securities 0.04 0.05 (0.02 ) (0.08 )
Tax Reform — (0.04 ) — (0.04 )
Income tax effect (0.02 ) 0.01 (0.02 ) 0.01
NON-GAAP DILUTED EARNINGS PER COMMON SHARE $ 1.06 $ 1.04 $ 1.94 $ 1.91

Intel/Page 16