· pdf fileadopt!new!technologies!more!quickly);however,!benchmarked!against!the!united!...
TRANSCRIPT
A Tale of Two SICs: Industrial Development in Japan and the United States in the Late
Nineteenth Century
John Tang*
The Australian National University
Current Version: November 2013
Abstract
Late developing countries are able to adopt best practice technologies pioneered
abroad, allowing more rapid convergence toward leading economies. Meiji Japan (1868-‐
1912) is considered a successful example of industrial convergence, but much of the
evidence relies on national aggregates or selected industries. Using historical industry
data, this paper examines whether Japan adopted new technologies faster compared to
the United States. Contrary to conventional wisdom, duration analysis indicates that
new sectors did not appear relatively sooner in Japan; however, they did grow to
economic significance faster. Higher firm capitalization and capital intensity are also
associated with earlier entry for Japanese sectors.
Keywords: convergence, industry classification, survival analysis, technology adoption
and diffusion
JEL codes: N11, N15, O14, O33
______ *Research School of Economics, The Australian National University, Acton ACT 0200, Australia. E-‐mail: [email protected]; office: +61 2 6125 3364. Shigeo Morita and Jun Imaki provided diligent research assistance, and funding support was provided by the Australian Research Council (project DE120101426).

1
Between 1870 and 1900, the United States saw a three-‐fold increase in the value-‐
added of manufacturing, with its share of national output rising four percent over the
period to just under a fifth of total income.1 While this rapid expansion of American
industry laid the groundwork to the country's economic leadership in the twentieth
century, no less remarkable was the catch up of other late developing countries,
particularly Japan. Starting from a much smaller base, Japanese industry also grew
apace, with manufacturing's share of national income increasing four percent between
1885 and 1900, and another three percent the following decade to reach 18.5 percent in
1910.2 In effect, what took the United States three decades was achieved by Japan in half
the time.3
Like other late developing countries, Japan had the opportunity to hasten its
development by adopting technologies at their current best practice, also known as
technological convergence.4 Besides potential savings in time and resources for the
economy as a whole, this process also allows for policymakers to target industries that
may have a relative comparative advantage and for entrepreneurs to compete with
established foreign producers in local and possibly international markets. This was the
case for leading Japanese sectors like railroads and cotton textiles that used state-‐of-‐
the-‐art equipment and production techniques; less is clear is whether the country's path
to industrialization can generally be described as asynchronous for the economy as a
whole or if adoption was ad hoc and specific to certain industries.
While numerous studies have examined economic convergence between leaders
and laggards, few examine the actual timing or dimensions of technological catch-‐up.
Are increased labor productivity or the number of steam engines by themselves
sufficient statistics to assess industrial advancement or economic policies? How can
different types of technologies and sectors be measured and compared without loss of
generality? These issues, difficult by themselves within a single economy, are magnified
1 United States Bureau of the Census (1975). 2 Japan Statistical Agency (2007). 3 "In England the factory system evolved over two centuries or more; in Japan it was established in fifty years, or even less" (Lockwood, 1954, p. 187). 4 This is also called technological leapfrogging. "[T]he higher the degree of backwardness, the more discontinuous the development is likely to be" (Gerschenkron, 1962, p. 45). Some constraints to acquiring frontier technologies include the size of industrial investments, available production inputs, and prevailing institutional frameworks may limit the scope of non-‐linear adoption and economic development.
2
when making international comparisons crossing time and space. Japan's industrial
development in the Meiji Period (1868-‐1912), however, provides a unique context to
analyze the dynamics of technology adoption due to its relative isolation prior to its
integration into the world economy and the observed introduction of foreign
technologies thereafter.
To assess the relative speed of Japanese technology adoption, this paper uses
official statistics of manufacturing industries starting in 1885. These data, which
include figures on establishments and industry capitalization, allow one to identify
when sectors appeared in the country and grew in importance during its initial wave of
industrialization. The timing of Japanese industrial change is then compared to that of
the United States at an earlier period to establish whether the two economies followed
similar patterns. Assuming that the classification of industries is a reasonable proxy for
embodied technologies and that the chronology corresponds to technology adoption,
comparing the two countries' experiences may demonstrate the extent to which Japan
engaged in technological leapfrogging relative to an industrial leader.
Estimates from duration model analysis show substantial differences in the
respective industrial development of the two countries in the second half of the
nineteenth century. Consistent with technological convergence, per capita income levels
were inversely correlated with the speed of adoption in general (ie, poorer countries
adopt new technologies more quickly); however, benchmarked against the United
States, new manufacturing sectors do not appear in Japan relatively earlier and in some
cases emerge later. In both countries, but especially true for Japan, industries with
larger firms are associated with faster introduction. Furthermore, unlike in the United
States, a lower share of capital among related sectors and higher capital intensity
appear to speed up technology adoption.
In contrast, for industries that became economically significant, defined as those
attaining at least half a percent of total manufacturing capital stock, Japanese industries
passed the threshold more quickly than those in the U.S. This result obtains even though
both per capita income levels and firm size become directly correlated with economic
significance (ie, richer countries pass the capital share threshold sooner). Results for
both new industry entry and industry significance are robust to different specifications,
although higher capital thresholds weaken the significance of faster Japanese
industrialization.

3
As a whole, these results qualify the conventional wisdom that Japanese
industrialization was based simply on accelerated adoption and diffusion of foreign
technologies by controlling for industry characteristics and differentiating between
sector appearance and their rise to economic importance. New technologies were
adopted more slowly, but once introduced spread more quickly through the economy.
This may have been due to the relative concentration within Japanese industries, with
larger firms able to standardize application of new production techniques more
effectively. These findings, along with a description of the data and methodology, are
further discussed in the following sections.
II
In his theory of late development, Alexander Gerschenkron identified Germany
and Russia as having industrialized with unusual rapidity in the second half of the
nineteenth century.5 He credits this achievement to their relative "backwardness" and
thus being able to adopt pre-‐existing technologies developed by industrial pioneers like
the United Kingdom and United States.6 His observation has been the subject of an
extensive literature on economic convergence that measures differences in national
income, productivity, capitalization, and institutions.7
Until the late 1800s, Japan too was considered a backward country, with the
economy organized along feudal lines and engaged primarily in traditional agricultural
production.8 This changed markedly in the second half of the century, following the
country's (forced) opening to the international economy. In 1868, the year of the Meiji
Restoration, two-‐thirds of gross national output came from primary sector production;
by 1905, this share fell to under forty percent, similar to the proportion coming from a
swiftly growing textile manufacturing industry.9 Even with these gains, Japan remained
5 Gerschenkron (1962), chapter 1. 6 "Industrialization always seemed the more promising the greater the backlog of technological innovations which the backward country could take over from the more advanced country" (ibid, p. 8). 7 Some well-‐known studies on economic convergence and growth include Abramovitz (1986), Baumol (1986), and Delong (1988). More recent works include Benetrix et al (2013) and Rodrik (2013). 8 Ohkawa and Rosovsky (1973, p. 4). 9 Ibid, p. 15.

4
in absolute measures significantly behind industrial leaders like the United States, but
the relative disparity had narrowed.10
Similar to the experiences of other successful late developing countries, Japan's
modernization is attributed to the adoption of new technologies, increased capital
accumulation, and higher levels of productivity, although the analyses typically rely on
national aggregates or are not empirically verified.11 A visible example of foreign
technology adoption was the introduction of the railroad in the early 1870s, which
expanded rapidly in the next three decades and linked population areas, provided
access to natural resources as well as increased firm scale.12 Recent scholarship
confirms Japan's precocity among countries in the industrial periphery, with growth
rates exceeding the leading economies of the United States, United Kingdom, and
Germany starting in the 1890s and continuing for most of the twentieth century.13
Notwithstanding the insight gained from estimating industrial growth rates and
aggregate productivity levels, the specific mechanisms underlying economic
convergence remain unclear as well as which industries are affected and how sectoral
differences can be measured.14 In the case of Meiji Japan, besides transportation
infrastructure, other contributing factors to its industrial take-‐off included public
investment, entrepreneurial capital, and financial market access.15 Equally crucial was
the diffusion of new technologies, with sectors like cotton spinning directly benefitting
10 See Table 1 for a comparison of economic activity in both countries. 11 For example, Ohkawa and Rosovsky (1973, p. 39) claim that Japan's high absorptive capacity for technology is due in part to its "well-‐functioning sociopolitical infrastructure." In a dissenting view, Lockwood (1954, pp. 17-‐18) attributes Meiji Japanese growth largely to market integration, lower transaction costs, and increased productivity indirectly related to technological change. 12 Tang (2013b). Railroads were also heavily utilized in Japan's military victories against China (1895) and Russia (1905), which provided the country with its first colonial possessions, reparations, and international status. 13 Benetrix et al (2012). While Japan was the first Asian country to reach the five percent threshold of industrial growth rates, it initially lagged behind countries in the European periphery and Latin America. 14 Abramovitz (1986, p. 395) states that "[p]roductivity levels...were erratic indicators of gaps between existing and best-‐practice technology." 15 See Morck and Nakamura (2007), Tang (2011), Rousseau (1999) and Tang (2013a). Tang (2011) identifies the large, family-‐owned zaibatsu conglomerates as instrumental in introducing many new technologies to the economy, although the analysis does not consider relative timing between entrepreneurs or international comparisons.

5
from the adoption of contemporary best practice.16 However, it is uncertain whether the
impact of innovations from individual sectors generalizes to the economy as a whole, or
how different technologies and their economic significance can be compared to each
other.17 Innovation is typically identified at a micro-‐level (eg, patents, products) or
backed out as a residual in macroeconomic production functions.18 At the industry level,
there is ambiguity as to what constitutes technological progress (as opposed to capital
utilization and labor productivity), and this is further complicated by data availability
and consistency as well as variation between sectors.19
This paper addresses these measurement issues by assuming that industry
classification itself is a useful gauge of technology differences, and the successive
emergence of different industries over time represents technological progress.20 This
framework is applied to the industrialization of Japan in the late nineteenth century,
with the experience of the United States used as a reference. Some hypotheses that can
be tested are whether new Japanese industries appeared relatively sooner compared to
those in the U.S.; whether their emergence was affected by the scale of enterprises
within those sectors and industry-‐level capital intensity; whether the existence of
similar industries encouraged the introduction of new, but related technologies; and if
there was a difference between appearance of an industry (aka, adoption) and its
growth to economic significance (aka, diffusion).
16 Saxonhouse (1974). While Japanese cotton spinning was initially modeled after British practice (ie, mule spindles), the industry shifted quickly to newer American technology (ie, ring spindles) given the latter's suitability to Japanese production inputs (labor abundant) and consumer markets (lower quality textiles). 17 Gerschenkron (1962, pp. 42-‐43) suggests per capita output as a measure of backwardness as unsatisfactory given differences in the range of output and availability of price data. A notable example of consistent measurement and economic impact in technology adoption is Saxonhouse and Wright (2010), which tracks the diffusion of cotton spinning technology over fifty years across multiple countries. 18 This distinction finds an analogue to Mokyr's (1990) discussion micro-‐ versus macroinventions, although he argues the former are incremental improvements in productivity and the latter to paradigm shifts. 19 While it is possible to aggregate the contributions of all microinventions to estimate an industry-‐ or economy-‐wide figure, an exhaustive inventory may be infeasible. It may also be difficult to isolate the value of general purpose technologies that are used in multiple sectors or goods. 20 A similar approximation is Abramovitz's (1986, p. 386) claim that technology as embodied in capital stock, where the "technological age of the stock is, so to speak, the same as its chronological age."
6
III
The data used in the analysis come from official records collected by the
statistical agencies in the two countries, either in statistical yearbooks (Japan) or
decennial economic censuses (United States). Specifically, data in the Statistical
Yearbook of the Japanese Empire were compiled by the Prime Minister's Cabinet
Statistics Bureau from different government agencies' records and occasionally from
individual firms into annual reports between 1883 and 1936.21 The information
included in these yearbooks covers all aspects of the Japanese economy and population
and often at the prefecture and industry level.22 Industry statistics were progressively
standardized during the 1880s and 1890s in terms of the amount of detail included and
how sectors were classified, such as the reporting of manufacturing separate from sales
starting in year 1885. Industry names also changed slightly to accommodate expansion
or contraction of activities. For the Meiji Period, consistent series at the industry level
are available from the mid 1880s for the number of establishments and the amount of
paid-‐in capital, whereas data on employment, raw materials, and output are not
comprehensive across sectors until the early 1900s.
In contrast, perhaps due to the relative enormity of the task and infrequency of
data collection, American statistics tended to be more complete. Starting with the 1810
census, economic data collection took place along with population enumerations every
decade until the turn of the century, when a permanent census office was established in
1902.23 The Permanent Census Act had provisions for economic statistics to be collected
on a five-‐year basis starting in 1905.24 While accuracy and information increased during
the 1800s, such as including workers, raw materials, and equipment (1820) and adding
sections on fishing, mining, and trade (1840), it was not until the second half of the
century that consistent and detailed instructions were used in the enumerations (1850)
and that trained specialists instead of U.S. marshals collected the data (1880). 21 Japan Statistical Association (1962). 22 Note that while some series are at both the prefecture and industry level, many are available only in one or the other. 23 The 1810 census was the third to take place, and included for the first time questions on goods and manufactures; see Boehme (1987). Atack and Bateman (1999) also describe changes in data collection and quality over time. Japanese statistical collection increased in sophistication as well, which may be due to greater institutional capacity acquired over time. 24 The frequency of economic censuses also changed to biennial, then four-‐yearly enumerations before returning to a quinquennial basis; ibid.
7
These changes in coverage for both countries mean that reliable industrial data
can be analyzed only after 1885 for Japan and 1850 for the United States, and these are
limited to a small number of series available for all manufacturing sectors, namely the
number of establishments and capital value.25 Fortunately, the decades following these
two starting points sufficiently span major periods of industrial development in both
countries, as shown in Table 1.26 For Japan, the initial wave of sustained industrial
activity occurred after the fiscal retrenchment of the early 1880s, when the government
privatized many of its enterprises and its financial restructuring stabilized the currency
and reduced inflation.27 In the quarter century to 1910, the number of firms increased
seven-‐fold while their nominal level of paid-‐in capital rose by a factor of twenty.28
[Table 1]
Meanwhile, the United States was undergoing significant structural change
following its Civil War in 1861-‐65. The economy began to actively employ mass
production techniques and to expand its manufacturing sector, which exceeded
agriculture in value in the 1880s and was the international leader by 1900.29 The
periods of analysis for both countries end in 1910, which coincides with the last years of
the Meiji Period and Japan's first wave of industrialization. It also allows use of the last
quinquennial American economic census prior to World War I, which further changed
the composition and development of the two economies.
Comparing Japan's industrial development with that of the United States is
complicated by the fact that neither country had a standardized industry classification
(SIC) system until well into the twentieth century. To ensure consistent comparison
over time and between countries, industries from the Japanese yearbooks and American
censuses are coded retroactively using the 1987 United States SIC system at the three-‐ 25 Even these series are not exact mappings, with Japan reporting nominal paid-‐in capital value for industries while the United States giving the value of industries' fixed capital assets. 26 Table 1 omits the column containing statistics for the 1905 economic census, which are included in the regression analysis. 27 Allen (1946), pp. 46-‐47. 28 Financial figures are reported in current U.S. dollars at market exchange rates for Japan, which are likely to be underestimates compared to those calculated using purchasing price parity (PPP). 29 Atack and Passell (1994), p. 457, and Boehme (1987).

8
digit level.30 This coding reduces the number of industries listed in the historical
records on average by a factor of two. For the United States, the number of SIC3
industries was fairly unchanged throughout the late 1800s, around one hundred, while
in Japan the number steadily increased, trebling in twenty-‐five years. By 1910, Japan
had nearly two-‐third the number of SIC3 industries as the U.S., compared to less than
one-‐fifth in 1885. This absolute growth in Japanese SIC3 industries is also reflected in
the number of completely new sectors, with twenty appearing within five years after
1885 and another 19 in the following ten years. A similar increase of industrial
diversification occurred in the United States two decades earlier, when nineteen new
industries appeared between the 1850 and 1860 censuses, and another thirteen in the
next two decades.31
In addition to the official records used to construct these industrial series, a few
other sources of statistics are used. For Japan, these are national income and population
figures from the Historical Statistics of Japan collection and industry output values from
the Estimates of Long-‐Term Economic Statistics; and for the United States, historical
estimates of national income and population from MeasuringWorth.32 It should be noted
that the two countries differ in the methodology used to calculate national income, with
the United States measuring it as gross domestic product while for Japan it is gross
national expenditure.33 Furthermore, Japanese industry output values are aggregated
at a much higher level (two-‐digit SIC) than those for the U.S. While this does not pose a
technical problem for the analytical model since the output values series are used to
construct average capital intensity ratios (capital value to output value), it does mean
that figures for Japan will be less precise than the equivalent American ratios. All
income and output values are in current U.S. dollars, with the Japanese figures
converted from yen using prevailing market exchange rates averaged over the given
year.
IV 30 United States Office of Management and Budget (1987). Atack and Bateman (1999) also use three-‐digit 1987 SIC codes in their analysis of U.S. Census of Manufacturing extracts for the 1850, 1860, 1870, and 1880 enumerations. 31 See data appendix for list of new industries in both countries by three-‐digit SIC. 32 Japan Statistical Association (2007), Shinohara (1972), and Williamson (2013). 33 GDP measures are also available for Japan, but they post-‐date the earliest available industrial series; see Japan Statistical Association (2007).

9
To test the hypothesis that Japan adopted technologies faster than advanced
economies like the United States, and thus enabling it to converge toward industrial
leaders, this paper uses a duration analysis model to compare the relative timing of
industry development in the two countries.34 It does this by estimating the expected
time to when a new industry will appear in an economy based on a parametric model
that reflects the observed behavior of events in the data and is conditional on covariates
that may influence the occurrence. One of the advantages to using duration analysis
instead of other regression models is that censored subjects (eg, industries that do not
pass the capital threshold) remain in the analysis and thus improve the precision of the
estimated coefficients.
Before continuing, it may be reasonable to consider whether duration analysis is
appropriate to model industry emergence in both countries for the periods in question.
Figure 1 plots the appearance of new industries (vertical axis) over time as given in the
data, and shows comparable levels of activity for the United States and Japan, albeit
separated by nearly three decades. The Japanese trend is also more compressed in
timing, which corresponds with its industrial growth rates relative to the United States.
In both countries, new industries appear mostly in the first third of their respective
periods of analysis, with a noticeable decline in technology adoption thereafter.
[Figures 1 and 2]
Figure 2 plots the two countries' curves as estimated probabilities (ie, the
likelihood of appearance given non-‐appearance in a given year) using the Kaplan-‐Meier
survivor function. The interpretation is that the probability (vertical axis) of new
industry appearance is high early in the period of analysis for each country, with
subsequent appearances less likely to occur over time. Here the similarity between the
two countries' curves is even more striking, with all estimated probabilities statistically
34 Duration analysis models are also commonly known as survival analysis models, which measure the hazard rate (risk) of an event occurrence, like death or unemployment; see Cleves et al (2008). There are a number of duration model types (eg, parametric, semiparametric) and probability distributions (eg, exponential, Weibull), the selection of which depends on the outcome of interest (eg, duration time, relative hazard ratios) and observed or expected behavior over time, respectively.

10
significant at least to the ten percent level. Log-‐rank tests of equality between the two
countries' survivor functions also fail to be rejected at that level.
Given the differences in capital investment and economic development over time
and between countries, it may be more informative to include additional variables that
may influence the timing of industry appearance. Assuming a conditional probability of
industry appearance that is constant over time (ie, a Poisson or exponential
distribution), which is consistent with the observed pattern of appearance shown in
Figure 1, the basic functional form of the model is:
𝑙𝑜𝑔 (𝑡) = 𝑋!𝛽! + 𝑋!"𝛽! + 𝑧, where
t = time to industry appearance
Xi = country-‐level variables indexed by i
(eg, per capita income, Japan indicator variable)
Xij = control variables indexed by country i and industry j
(eg, average firm capital level, interaction variables)
z = error term
New industries are identified using the earliest available data: for Japan, these
include industries starting in 1885, and for the United States, those in 1850. Using these
sets of sectors as benchmarks for each country, any sectors appearing in successive
years until 1910 are considered new, with the corresponding duration in between
measured as an outcome variable t. The group of industries from the reference years,
which are considered left-‐truncated, are omitted from the analysis.35
The model tests whether time-‐to-‐appearance is associated with the following
economy and industry level differences: a) income per capita, as a proxy for relative
backwardness; b) a Japan indicator variable, to identify difference between the two
countries; c) the average level of firm capital in each country, calculated by dividing an
industry's capital value by its number of enterprises, as a measure of firm scale; d) the
share of capital invested in similar sectors (ie, three-‐digit SIC industries within the same
two-‐digit industry group) out of total capital invested across manufacturing sectors in
35 Left-‐truncation differs from left-‐censorship in that the latter includes industries that have not yet experienced a threshold event, but their existence precedes their appearance in the data. This difference is meaningful only in the duration analysis of economic significance as new industries appearing in the data have no prior existence.

11
country i, to account for relative innovativeness;36 e) industry capital intensity in
country i, which is the value of capital divided by the value of output; and f) interactions
between the Japan indicator and industry level variables. Since the impact of
industrialization is felt more in its sustained growth over time as opposed to a possibly
short-‐lived market appearance, separate regressions are run using as the dependent
variable the duration until an industry attains economic significance, defined as having
at least half a percent of the country's total manufacturing capital.37 This dependent
variable allows inclusion of industries that appear in the data series, but do not receive
sufficient capital investment, thus improving the estimates of the coefficients as well as
increasing the overlap of industries between the two countries.
Since industrial data for the United States before 1900 were collected every ten
years, whereas the Japanese data are annual, dating the appearance of new industries
and when industries attain economic significance in America is less precise.38
Consequently, this may bias the results in favor of finding technological convergence for
Japan since the dependent variables measure the duration until appearance or diffusion.
To mitigate this bias, both countries' data are coded as five-‐year intervals (which also
coincide with the post-‐1900 U.S. enumerations), and imputing event occurrence dates in
a shorter span of time for U.S. sectors. For example, in measuring the time for an
American industry to pass the half percent threshold of total capital stock, if the sector
has a capital share of 0.1 percent in 1860 and 2 percent in 1870, instead of dating the
occurrence as passing the threshold in 1870, it is coded as 1865 based on the arithmetic
average between the two enumerations. Attendant covariates like related industry
capital share and capital intensity are similarly imputed. To match the level of
imprecision in the American data, Japan industries are recoded also in five-‐year periods,
which means they may appear up to four years later (eg, an industry appearing in 1891
36 A similar method of assessing industry innovativeness is used in Tang (2011). 37 Given approximately two hundred possible three-‐digit SIC industries, the half percent threshold would approximate a uniform distribution of invested capital for each industry (ie, each industry of equal importance). Since industries varied considerably in age and capital investment, it is expected that this threshold is a reasonable metric to measure absolute growth and technological diffusion. Separate robustness checks using the higher threshold of one percent total manufacturing capital stock are also performed and presented in the following section. 38 This is also known as interval censorship.

12
coded as 1895) and would use the later date's industry-‐ and economy-‐level values in the
covariates.
V
Regression results from the parametric duration model indicate that while lower
per capita income is associated with faster technology adoption, new industries did not
appear relatively earlier in Japan compared to the United States. As shown in Table 2,
the coefficient on per capita income (row 1) is positive, which indicates increased
duration until industry appearance, and usually statistically significant. This is
consistent with developing countries converging toward technological leaders, with
new manufacturing sectors appearing earlier presumably due to a technological backlog
from which to establish industries. However, the Japan indicator variable (row 2) is also
positive and despite most of its interactions with industry covariates being negative (all
are statistically significant), the net effect (row 11) remains positive and weakly
significant.39 This net effect indicates that as a whole new Japanese manufacturing
sectors appear in the economy no sooner than those in the U.S., and in some cases later.
[Table 2]
Among the covariates, both average firm capital level (row 3) and the capital
share of related sectors (row 4) are negatively associated with expected duration. This
suggests that new industries with higher invested capital per firm emerge more quickly,
and this is especially true for Japan as shown by the positively signed and larger
coefficient on the interaction variable (row 6). On the other hand, while more capital
invested in related sectors may ease the appearance of new industries in general,
perhaps due to greater availability of transferable technology and resources, the effect
is reversed in Japan (row 7). This contrasts with industry capital intensity, which has a
positive sign on the overall effect, but a negative one when interacted with the Japan
39 The net effect is calculated using a Wald test of the linear combination of all control variables excluding income per capita and year trend, evaluated at the population average for the Japan subset of new industries.
13
fixed effect. One explanation for the latter two interactions is that capital scarcity led to
the concentration of resources in fewer, but more capital intensive sectors.40
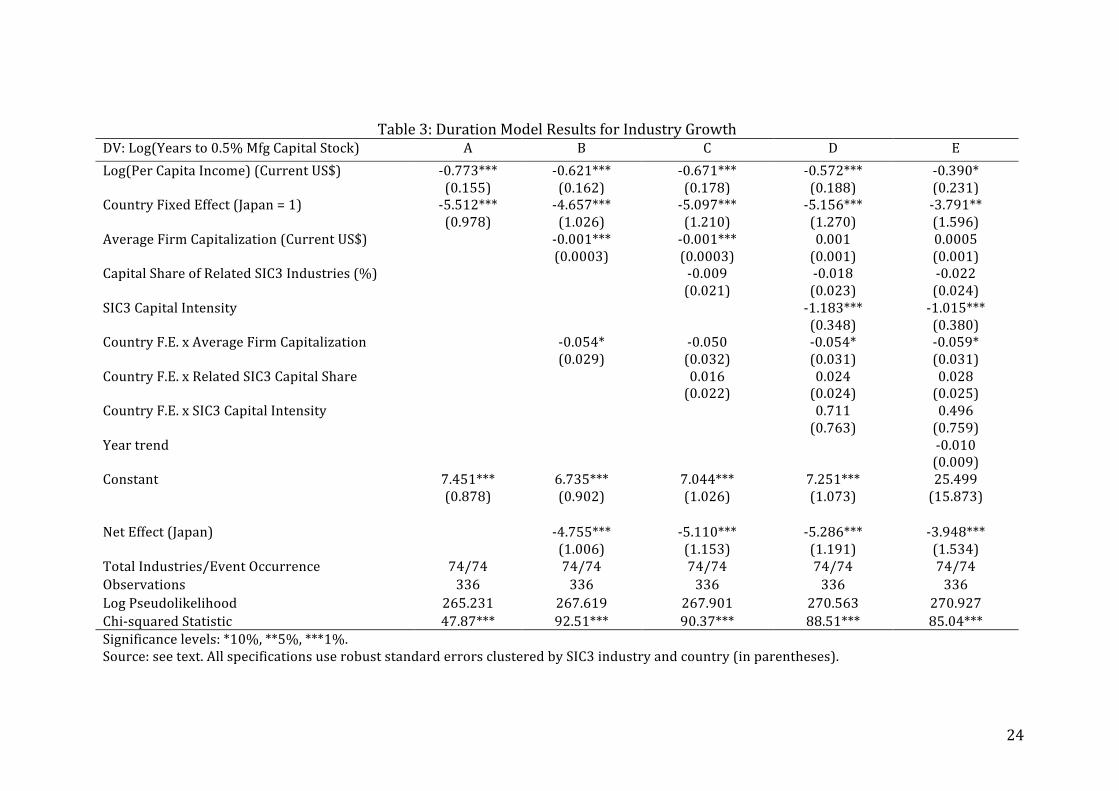
Interestingly, the above findings do not carry through to those using the half
percent capital stock threshold as the dependent variable, shown in Table 3. Per capita
income (row 1) now is negatively signed, indicating faster growth of manufacturing in
wealthier countries. At the same time, the indicator variable for Japan (row 2) is also
negatively signed and combined with its interactions with other covariates, the net
effect (row 11) is negative and statistically significant. This suggests that Japanese
sectors grew to economic significance, with diffusion of embodied technology, relatively
faster than those in the United States, even with the inclusion of a time trend to allow
for the difference in actual timing.
[Table 3]
Among the covariates, average firm capital (row 3) changes signs and loses
significance compared to the previous table and related sector capital share (row 4) has
a negative and insignificant coefficient. Only industry capital intensity (row 5) is
statistically significant but now with a negative sign, while all the interactions with the
Japan indicator variable are weakly or not significant. These findings suggest that unlike
with the appearance of new industries, their growth is less affected by firm or industry
group scale, and that aside from the timing itself, there were no substantive differences
between countries as captured by these industry characteristics.
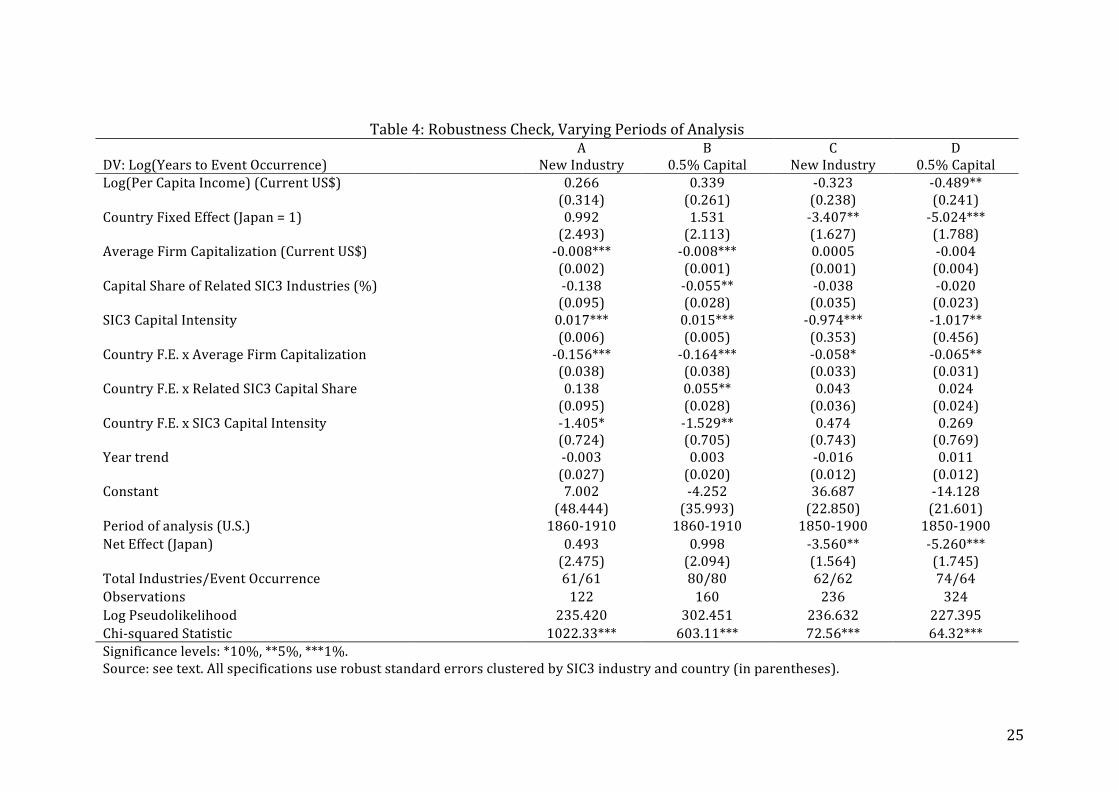
To check the robustness of these results, one can change the period of analysis as
well as the capital stock threshold. These results are shown in Tables 4 and 5,
respectively. In Table 4, the period of analysis for the United States is shortened by ten
years, either by postponing the starting year to 1860 or by advancing the ending year to
1900; the analysis period for Japan remains unchanged. For industry new appearance,
changing the benchmark year to 1860 (column A) reduces the number of new
industries by nineteen (row 12), but does not affect most of the main results from the
full period of analysis in Table 2 (column E). That is, both average firm capital (row 6)
40 This interpretation can also be qualified by the observation that higher capital intensity is derivative of the high cost of capital equipment (ie, imported) relative to output value in Japan.

14
and industry capital intensity (row 8) are associated with faster industry appearance in
Japan, but the net effect (row 11) remains positive and insignificant. The results from
moving the end year to 1900 (column B) replicate those from the earlier table as no
new industries appeared in either the 1905 or 1910 economic censuses.
[Table 4]
The different start and end years also do not affect the main results for
industries reaching the 0.5 percent capital stock threshold, shown in columns C and D.
In both cases, the estimates are similar in magnitude and match in sign and statistical
significance, with the net effects indicating faster growth of new industries in Japan,
which is associated with overall capital intensity and the size of Japanese firms. The net
effect is particularly pronounced with an earlier American end date, which may owe to
the longer duration until reaching the capital threshold in the United States and thus
censors ten industries from the analysis.
[Table 5]
The second robustness check uses a one percent total capital stock threshold as a
proxy for technological diffusion. These results, shown in Table 5, indicate that while
average firm capitalization in Japan still reduces the time to passing the threshold, the
net effect is no longer negatively signed. Furthermore, including a time trend variable
(column E) increases the magnitude of the positive net effect and is weakly significant,
suggesting a longer time to economic significance in relation to the United States. This
finding may be due to the relatively short length of the Japanese industrial data series;
when compared to a shorter analysis period for the United States ending in 1900, the
net effect becomes insignificant and negatively signed.
VI
Given the enormous differences in economic and industrial development
between Japan and the United States in the second half of the nineteenth century, it may
seem obvious that some convergence between the two countries would occur with
sufficient resources and institutions. That Japan did make considerable progress in

15
reducing the gap owes in part to the rapidity of its industrialization and the adoption of
technologies pioneered by industrial pioneers. The results from duration analysis
provide evidence that while Japanese industries were able to spread technologies via
industry growth more quickly, it is qualified by the relatively slow adoption of new
technologies themselves. In other words, technological adoption and diffusion were
distinct phenomena in Japan, and even the latter may require longer periods of
development than the two decades considered in the analysis.
How does one reconcile these seemingly opposing results? One issue may be the
precision of the data, which are still fairly aggregated even at the three-‐digit industry
code level. This may obscure discrete advances in technologies within industry codes as
well as the continued use of traditional methods alongside modern ones, as was
observed in Japan throughout the late 1800s.41 The periods chosen for analysis, based
on data availability, may also not be directly comparable since the United States was
already fairly industrialized by the mid 1800s. Thus, the technologies adopted in its
post-‐bellum decades could be affected differently by the included covariates than those
adopted in Japan, although the standard errors were adjusted to accommodate
heterogeneity in sector and country.
Nonetheless, the findings corroborate observations made by Gerschenkron that
backward countries will have larger firms and more coordination among them.42 In all
specifications, higher average firm capital stock is associated with earlier entry and
growth of Japanese industries compared to the United States, and in many cases the
presence of related sectors (which may serve as competition to new entrants as well as
provide organic technological growth opportunities) appears to delay these outcomes.43
At a broader level, one can also observe technological catch up, although possibly
not industrial growth, in per capita income differences, with poorer countries adopting
new technologies sooner but still requiring additional time for them to attain economic
significance. That Japan apparently reverses this relationship, which is not obvious if
adoption and diffusion are conflated, may help to explain its success in industrialization
compared to its peer group of developing countries. That is, selective adoption of
41 Ohkawa and Rosovsky (1973, p. 17) observe that half of all capital goods were still produced using traditional methods in the Meiji Period. 42 Gerschenkron (1964), p. 44. 43 Saxonhouse (1974) attributes the rapidity of technology transfer for cotton spinning to coordination among firms in that sector.

16
technologies, but with increased resources in those sectors, may have allowed Japan to
gain the scale needed to compete internationally while laying the foundation for further
intensification during the period between the two world wars.
This paper also identifies a number of areas for future work, such as including
factor costs, which figured prominently in the expansion of Japanese textiles, although
this is partly accounted for in the measure of capital intensity via production value, nor
comparisons of labor mobility and productivity. Also omitted are discussions of
international trade, which may have influenced the types of industries that developed
during the period; access to foreign financial capital; and the role of government policy
and expenditure, such as the establishment of enterprises in the early Meiji Period and
public investments in infrastructure and strategic sectors, all which can be explored in
further work.
That said, the findings are consistent with anecdotal accounts and aggregate
measures of Japanese technological convergence, and date the timing of its
industrialization firmly in the late 1800s, before most other peripheral economies.44 By
the eve of the First World War, Japan had an industrial economy with far more
advanced technology than a few decades earlier.
References Abramovitz, Moses (1986). "Catching up, forging ahead, and falling behind." Journal of
Economic History, 46(2): 385-‐406.
Allen, George C. (1946). A Short Economic History of Modern Japan, 1867-‐1937. London,
United Kingdom: George Allen and Unwin Ltd.
Atack, Jeremy and Fred Bateman (1999). "Nineteenth-‐century U.S. industrial
development through the eyes of the Census of Manufactures." Historical Methods,
32(4): 177-‐188.
Atack, Jeremy and Peter Passel (1994). A New Economic View of American History from
Colonial Times to 1940, 2nd edition. New York, New York: W. W. Norton and
Company.
Baumol, William (1986). "Productivity growth, convergence, and welfare: what the
long-‐run data show." American Economic Review, 76(5): 1072-‐1085.
44 Abramovitz (1987) notes that convergence between leading and lagging economies was weak prior to 1913.

17
Benetrix, Agustin, Kevin O'Rourke, and Jeffrey Williamson (2012). "The spread of
manufacturing to the poor periphery, 1870-‐2007." NBER Working Paper 18221.
Boehme, Frederick (1987). "U.S. Economic Census, 1810 to Present." Government
Information Quarterly, 4(3): 221-‐243.
Cleves, Mario, William Gould, Roberto Gutierrez, and Yulia Marchenko (2008). An
Introduction to Survival Analysis Using Stata, 2nd edition. College Station, Texas:
Stata Press.
Delong, J. Bradford (1988). "Productivity growth, convergence, and welfare: comment."
American Economic Review, 78(5): 1138-‐1154.
Gerschenkron, Alexander (1962). Economic Backwardness in Historical Perspective: A
Book of Essays. Boston, Massachusetts: Harvard University Press.
Japan Statistical Association (1962). Nihon Teikoku Tokei Nenkan [Japanese Empire
Statistical Yearbook], volumes 1-‐33. Tokyo, Japan: Tokyo Ripurinto Shuppansha.
-‐-‐-‐ (2007). Historical Statistics of Japan: New Edition. Tokyo, Japan: Japan Statistical
Association.
Lockwood, William (1954). The Economic Development of Japan: Growth and Structural
Change 1868-‐1938. Princeton, New Jersey: Princeton University Press.
Mokyr, Joel (1990). Lever of Riches. Oxford, United Kingdom: Oxford University Press.
Morck, Randall and Masao Nakamura (2007). "Business groups and the Big Push: Meiji
Japan's mass privatization and subsequent growth." Enterprise and Society, 8(3):
543-‐601.
Ohkawa, Kazushi and Henry Rosovsky (1973). Japanese Economic Growth: Trend
Acceleration in the Twentieth Century. Stanford, California: Stanford University
Press.
Rodrik, Dani (2013). "Unconditional convergence in manufacturing." Quarterly Journal
of Economics, 128: 165-‐204.
Rousseau, Peter (1999). "Finance, investment, and growth in Meiji-‐era Japan." Japan and
the World Economy, 11(2): 185-‐198.
Saxonhouse, Gary (1974). "A tale of technological diffusion in the Meiji Period." Journal
of Economic History, 34(1): 149-‐65.
Saxonhouse, Gary and Gavin Wright (2010). "National leadership and competing
technological paradigms: the globalization of cotton spinning, 1878-‐1933." Journal
of Economic History, 70(3): 535-‐566.

18
Shinohara, Miyohei (1972). Estimates of Long-‐Term Economic Statistics of Japan since
1868, Volume 10 Mining and manufacturing. Tokyo, Japan: Toyo Keizai Shinposha.
Tang, John (2011). "Technological leadership and late development: evidence from Meiji
Japan, 1868-‐1912." Economic History Review, 64(S1): 99-‐116.
-‐-‐-‐ (2013a). "Financial intermediation and late development in Meiji Japan, 1868 to
1912." Financial History Review, 20(2): 111-‐135.
-‐-‐-‐ (2013b). "Railroad expansion and entrepreneurship: evidence from Meiji Japan."
CEH Discussion Paper 2013-‐11, Centre for Economic History, Australian National
University.
United States Bureau of the Census (1858). Manufactures in the Several States and
Territories for the Year Ending June 1, 1850: Digest of Statistics of Manufactures.
Washington, DC: Government Printing Office.
-‐-‐-‐ (1865). Exhibit of the Total Manufactures of the United States for the Year Ending June
1, 1860: Digest of Statistics of Manufactures. Washington, DC: Government Printing
Office.
-‐-‐-‐ (1872). A Compendium of the Ninth Census (June 1, 1870). Washington, DC:
Government Printing Office.
-‐-‐-‐ (1907). Census of Manufactures, 1905. Washington, DC: Government Printing Office.
-‐-‐-‐ (1913). Thirteenth Census of the United States Taken in the Year 1910, volume VIII-‐X:
Manufactures. Washington, DC: Government Printing Office.
-‐-‐-‐ (1975). The Statistical History of the United States: From Colonial Times to 1970:
Bicentennial Edition. Washington, DC: United States Government Printing Office.
United States Office of Management and Budget (1987). Standard Industrial
Classification Manual. Washington, DC: Government Printing Office.
Williamson, Samuel H. (2013). "What Was the U.S. GDP Then?" MeasuringWorth
(August).
19
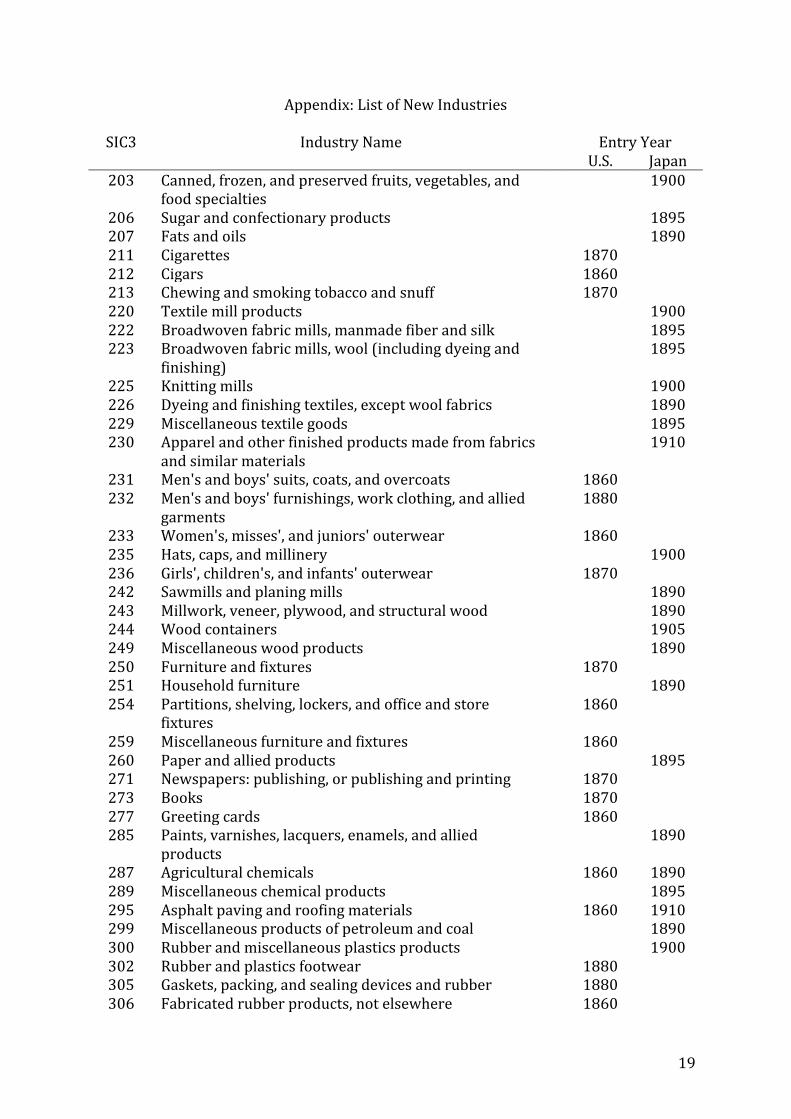
Appendix: List of New Industries
SIC3 Industry Name Entry Year U.S. Japan
203 Canned, frozen, and preserved fruits, vegetables, and food specialties
1900
206 Sugar and confectionary products 1895 207 Fats and oils 1890 211 Cigarettes 1870 212 Cigars 1860 213 Chewing and smoking tobacco and snuff 1870 220 Textile mill products 1900 222 Broadwoven fabric mills, manmade fiber and silk 1895 223 Broadwoven fabric mills, wool (including dyeing and
finishing) 1895
225 Knitting mills 1900 226 Dyeing and finishing textiles, except wool fabrics 1890 229 Miscellaneous textile goods 1895 230 Apparel and other finished products made from fabrics
and similar materials 1910
231 Men's and boys' suits, coats, and overcoats 1860 232 Men's and boys' furnishings, work clothing, and allied
garments 1880
233 Women's, misses', and juniors' outerwear 1860 235 Hats, caps, and millinery 1900 236 Girls', children's, and infants' outerwear 1870 242 Sawmills and planing mills 1890 243 Millwork, veneer, plywood, and structural wood 1890 244 Wood containers 1905 249 Miscellaneous wood products 1890 250 Furniture and fixtures 1870 251 Household furniture 1890 254 Partitions, shelving, lockers, and office and store
fixtures 1860
259 Miscellaneous furniture and fixtures 1860 260 Paper and allied products 1895 271 Newspapers: publishing, or publishing and printing 1870 273 Books 1870 277 Greeting cards 1860 285 Paints, varnishes, lacquers, enamels, and allied
products 1890
287 Agricultural chemicals 1860 1890 289 Miscellaneous chemical products 1895 295 Asphalt paving and roofing materials 1860 1910 299 Miscellaneous products of petroleum and coal 1890 300 Rubber and miscellaneous plastics products 1900 302 Rubber and plastics footwear 1880 305 Gaskets, packing, and sealing devices and rubber 1880 306 Fabricated rubber products, not elsewhere 1860
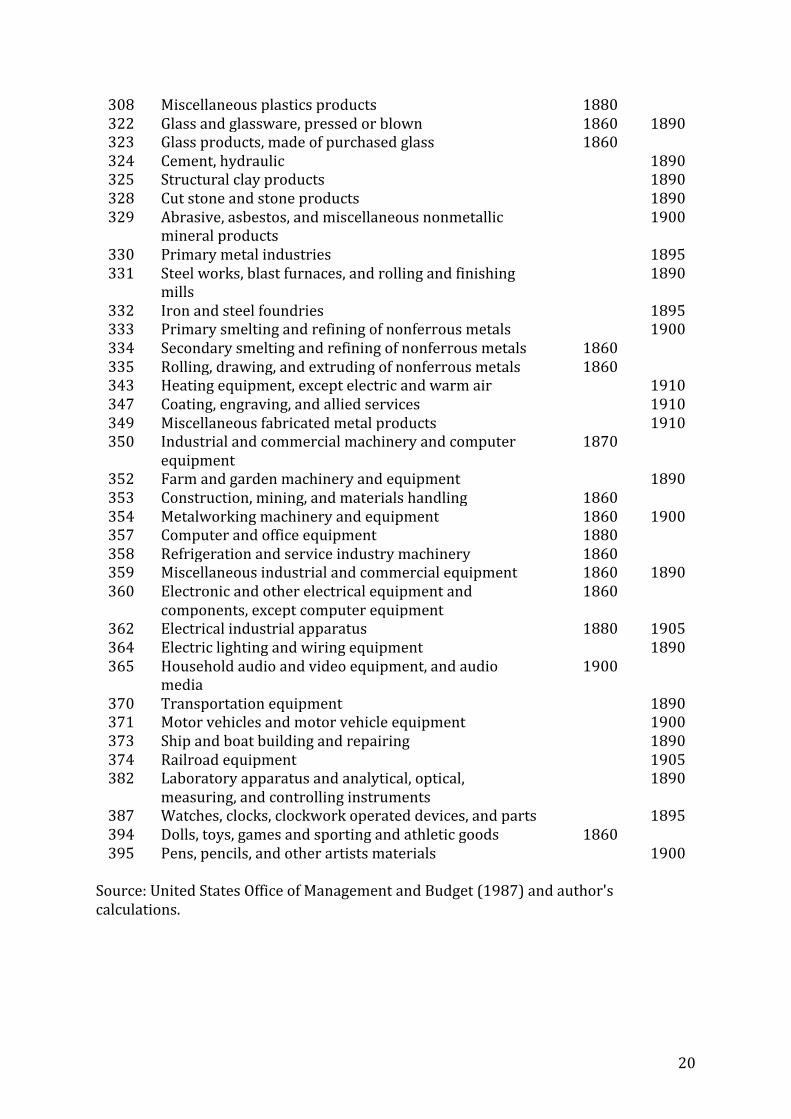
20
308 Miscellaneous plastics products 1880 322 Glass and glassware, pressed or blown 1860 1890 323 Glass products, made of purchased glass 1860 324 Cement, hydraulic 1890 325 Structural clay products 1890 328 Cut stone and stone products 1890 329 Abrasive, asbestos, and miscellaneous nonmetallic
mineral products 1900
330 Primary metal industries 1895 331 Steel works, blast furnaces, and rolling and finishing
mills 1890
332 Iron and steel foundries 1895 333 Primary smelting and refining of nonferrous metals 1900 334 Secondary smelting and refining of nonferrous metals 1860 335 Rolling, drawing, and extruding of nonferrous metals 1860 343 Heating equipment, except electric and warm air 1910 347 Coating, engraving, and allied services 1910 349 Miscellaneous fabricated metal products 1910 350 Industrial and commercial machinery and computer
equipment 1870
352 Farm and garden machinery and equipment 1890 353 Construction, mining, and materials handling 1860 354 Metalworking machinery and equipment 1860 1900 357 Computer and office equipment 1880 358 Refrigeration and service industry machinery 1860 359 Miscellaneous industrial and commercial equipment 1860 1890 360 Electronic and other electrical equipment and
components, except computer equipment 1860
362 Electrical industrial apparatus 1880 1905 364 Electric lighting and wiring equipment 1890 365 Household audio and video equipment, and audio
media 1900
370 Transportation equipment 1890 371 Motor vehicles and motor vehicle equipment 1900 373 Ship and boat building and repairing 1890 374 Railroad equipment 1905 382 Laboratory apparatus and analytical, optical,
measuring, and controlling instruments 1890
387 Watches, clocks, clockwork operated devices, and parts 1895 394 Dolls, toys, games and sporting and athletic goods 1860 395 Pens, pencils, and other artists materials 1900
Source: United States Office of Management and Budget (1987) and author's calculations.

21
Figure 1: Number of New SIC3 Industries in the U.S. and Japan
Source: see text
Figure 2: Survival Curves of New Industry Appearance in the U.S. and Japan
Source: see text.

22
Table 1: Industrial Development in the U.S. and Japan
United States 1850 1860 1870 1880 1890 1900 1910 GDP (mil) $2,581 $4,387 $7,812 $10,462 $15,223 $20,766 $33,746 Population (mil) 23.3 31.5 39.9 50.3 63.1 76.1 92.4 Manufacturing Industries 251 605 383 277 305 314 256 SIC3 Sectors 95 108 109 105 107 107 101 New SIC3 Sectors 19 7 6 0 1 0 Firms 114,774 128,574 230,330 176,788 200,128 207,176 268,440 Average Firm Capital $4,234 $7,279 $8,980 $15,255 $30,348 $43,201 $71,815 Japan 1885 1890 1895 1900 1905 1910 GNE (mil) $9.6 $12.6 $30.7 $49.0 $62.5 $79.5 Population (mil) 38.3 39.9 41.6 43.8 46.6 49.2 Manufacturing Industries 24 48 52 73 82 93 SIC3 Sectors 18 37 39 49 52 58 New SIC3 Sectors 20 9 10 3 5 Firms 498 2,055 831 2,344 2,325 3,489 Average Firm Capital $99 $190 $1,063 $1,602 $1,261 $2,181 Source: see text.

23
Table 2: Duration Model Results for New Industry Appearance DV: Log(Years to New SIC3 Industry) A B C D E Log(Per Capita Income) (Current US$) 0.138
(0.106) 0.284*** (0.102)
0.263*** (0.102)
0.374*** (0.116)
0.339 (0.261)
Country Fixed Effect (Japan = 1) 0.481 (0.615)
1.242** (0.592)
0.957 (0.610)
1.820** (0.717)
1.531 (2.113)
Average Firm Capitalization (Current US$) -‐0.007*** (0.001)
-‐0.007*** (0.001)
-‐0.008*** (0.001)
-‐0.008*** (0.001)
Capital Share of Related SIC3 Industries (%) -‐0.056** (0.027)
-‐0.057** (0.028)
-‐0.055** (0.028)
SIC3 Capital Intensity 0.015*** (0.006)
0.015*** (0.005)
Country F.E. x Average Firm Capitalization -‐0.177*** (0.042)
-‐0.175*** (0.043)
-‐0.164*** (0.038)
-‐0.164*** (0.038)
Country F.E. x Related SIC3 Capital Share 0.057** (0.028)
0.057** (0.028)
0.055** (0.028)
Country F.E. x SIC3 Capital Intensity -‐1.535** (0.702)
-‐1.529** (0.705)
Year trend 0.003 (0.020)
Constant 2.370*** (0.555)
1.780*** (0.535)
2.048*** (0.554)
1.479** (0.621)
-‐4.252 (35.993)
Net Effect (Japan) 1.002*
(0.607) 0.723 (0.624)
1.286* (0.692)
0.998 (2.094)
Total Industries/Event Occurrence 80/80 80/80 80/80 80/80 80/80 Observations 160 160 160 160 160 Log Pseudolikelihood 294.167 299.951 300.634 302.438 302.451 Chi-‐squared Statistic 201.87*** 185.98*** 158.83*** 577.21*** 603.11*** Significance levels: *10%, **5%, ***1%. Source: see text. All specifications use robust standard errors clustered by SIC3 industry and country (in parentheses).
24
Table 3: Duration Model Results for Industry Growth DV: Log(Years to 0.5% Mfg Capital Stock) A B C D E Log(Per Capita Income) (Current US$) -‐0.773***
(0.155) -‐0.621*** (0.162)
-‐0.671*** (0.178)
-‐0.572*** (0.188)
-‐0.390* (0.231)
Country Fixed Effect (Japan = 1) -‐5.512*** (0.978)
-‐4.657*** (1.026)
-‐5.097*** (1.210)
-‐5.156*** (1.270)
-‐3.791** (1.596)
Average Firm Capitalization (Current US$) -‐0.001*** (0.0003)
-‐0.001*** (0.0003)
0.001 (0.001)
0.0005 (0.001)
Capital Share of Related SIC3 Industries (%) -‐0.009 (0.021)
-‐0.018 (0.023)
-‐0.022 (0.024)
SIC3 Capital Intensity -‐1.183*** (0.348)
-‐1.015*** (0.380)
Country F.E. x Average Firm Capitalization -‐0.054* (0.029)
-‐0.050 (0.032)
-‐0.054* (0.031)
-‐0.059* (0.031)
Country F.E. x Related SIC3 Capital Share 0.016 (0.022)
0.024 (0.024)
0.028 (0.025)
Country F.E. x SIC3 Capital Intensity 0.711 (0.763)
0.496 (0.759)
Year trend -‐0.010 (0.009)
Constant 7.451*** (0.878)
6.735*** (0.902)
7.044*** (1.026)
7.251*** (1.073)
25.499 (15.873)
Net Effect (Japan) -‐4.755***
(1.006) -‐5.110*** (1.153)
-‐5.286*** (1.191)
-‐3.948*** (1.534)
Total Industries/Event Occurrence 74/74 74/74 74/74 74/74 74/74 Observations 336 336 336 336 336 Log Pseudolikelihood 265.231 267.619 267.901 270.563 270.927 Chi-‐squared Statistic 47.87*** 92.51*** 90.37*** 88.51*** 85.04*** Significance levels: *10%, **5%, ***1%. Source: see text. All specifications use robust standard errors clustered by SIC3 industry and country (in parentheses).
25
Table 4: Robustness Check, Varying Periods of Analysis
DV: Log(Years to Event Occurrence)
A New Industry
B 0.5% Capital
C New Industry
D 0.5% Capital
Log(Per Capita Income) (Current US$) 0.266 (0.314)
0.339 (0.261)
-‐0.323 (0.238)
-‐0.489** (0.241)
Country Fixed Effect (Japan = 1) 0.992 (2.493)
1.531 (2.113)
-‐3.407** (1.627)
-‐5.024*** (1.788)
Average Firm Capitalization (Current US$) -‐0.008*** (0.002)
-‐0.008*** (0.001)
0.0005 (0.001)
-‐0.004 (0.004)
Capital Share of Related SIC3 Industries (%) -‐0.138 (0.095)
-‐0.055** (0.028)
-‐0.038 (0.035)
-‐0.020 (0.023)
SIC3 Capital Intensity 0.017*** (0.006)
0.015*** (0.005)
-‐0.974*** (0.353)
-‐1.017** (0.456)
Country F.E. x Average Firm Capitalization -‐0.156*** (0.038)
-‐0.164*** (0.038)
-‐0.058* (0.033)
-‐0.065** (0.031)
Country F.E. x Related SIC3 Capital Share 0.138 (0.095)
0.055** (0.028)
0.043 (0.036)
0.024 (0.024)
Country F.E. x SIC3 Capital Intensity -‐1.405* (0.724)
-‐1.529** (0.705)
0.474 (0.743)
0.269 (0.769)
Year trend -‐0.003 (0.027)
0.003 (0.020)
-‐0.016 (0.012)
0.011 (0.012)
Constant 7.002 (48.444)
-‐4.252 (35.993)
36.687 (22.850)
-‐14.128 (21.601)
Period of analysis (U.S.) 1860-‐1910 1860-‐1910 1850-‐1900 1850-‐1900 Net Effect (Japan) 0.493
(2.475) 0.998 (2.094)
-‐3.560** (1.564)
-‐5.260*** (1.745)
Total Industries/Event Occurrence 61/61 80/80 62/62 74/64 Observations 122 160 236 324 Log Pseudolikelihood 235.420 302.451 236.632 227.395 Chi-‐squared Statistic 1022.33*** 603.11*** 72.56*** 64.32*** Significance levels: *10%, **5%, ***1%. Source: see text. All specifications use robust standard errors clustered by SIC3 industry and country (in parentheses).

26
Table 5: Robustness Check, Higher Total Capital Stock Threshold DV: Log(Years to 1% Mfg Capital Stock) A B C D E Log(Per Capita Income) (Current US$) -‐0.005
(0.243) 0.314 (0.232)
0.284 (0.244)
0.313 (0.290)
0.730* (0.378)
Country Fixed Effect (Japan = 1) 0.306 (1.374)
1.940 (1.346)
1.745 (1.433)
1.354 (1.767)
4.405* (2.462)
Average Firm Capitalization (Current US$) -‐0.005*** (0.001)
-‐0.005*** (0.001)
-‐0.004*** (0.001)
-‐0.003*** (0.001)
Capital Share of Related SIC3 Industries (%) -‐0.033 (0.024)
-‐0.051** (0.026)
-‐0.055* (0.029)
SIC3 Capital Intensity -‐0.750** (0.370)
-‐0.465 (0.425)
Country F.E. x Average Firm Capitalization -‐0.187** (0.083)
-‐0.182** (0.082)
-‐0.187** (0.081)
-‐0.197** (0.081)
Country F.E. x Related SIC3 Capital Share 0.015 (0.026)
0.033 (0.027)
0.036 (0.030)
Country F.E. x SIC3 Capital Intensity 0.848 (1.079)
0.430 (1.137)
Year trend -‐0.023* (0.012)
Constant 3.551*** (1.321)
2.156* (1.244)
2.520* (1.348)
2.910* (1.561)
44.242** (21.981)
Net Effect (Japan) 1.727
(1.330) 1.387 (1.422)
1.010 (1.634)
4.020* (2.330)
Total Industries/Event Occurrence 84/52 84/52 84/52 84/52 84/52 Observations 410 410 410 410 410 Log Pseudolikelihood 150.024 158.468 159.879 160.780 161.964 Chi-‐squared Statistic 1.97 58.99*** 64.03*** 93.32*** 109.69*** Significance levels: *10%, **5%, ***1%. Source: see text. All specifications use robust standard errors clustered by SIC3 industry and country (in parentheses).