next generation supercomputers - scc.acad.bg
TRANSCRIPT

© 2007 IBM Corporation
Next Generation SupercomputersExploiting innovative massively parallel system architecture to facilitate breakthrough scientific discoveries
Valentina Salapuraon behalf of the Blue Gene team
IBM T.J. Watson Research Center

IBM Research
© 2007 IBM CorporationV. Salapura, Next Generation SupercomputersGrace Hopper Celebration of Women in Computing
2
The Blue Gene Team – Yorktown

© 2007 IBM Corporation3 V. Salapura, Next Generation Supercomputers2007 Grace Hopper Celebration of Women in Computing
IBM Research
CMOS Scaling
p substrate, doping α*NA
Scaled Device
L/α xd/α
GATEn+ source
n+ drain
WIRINGVoltage, V / α
W/αtox/α
semiconductor scaling
– Dennard’s scaling theory
– Increases compute density
– Enables higher compute speed
SCALING:Voltage: V/αOxide: tox /αWire width: W/αGate width: L/αDiffusion: xd /αSubstrate: α * NA
RESULTS:Higher Density: ~α2
Higher Speed: ~αPower/ckt: ~1/α2
Power Density: ~Constant
Source: Dennard et al., JSSC 1974.
© 2007 IBM Corporation4 V. Salapura, Next Generation Supercomputers2007 Grace Hopper Celebration of Women in Computing
IBM Research
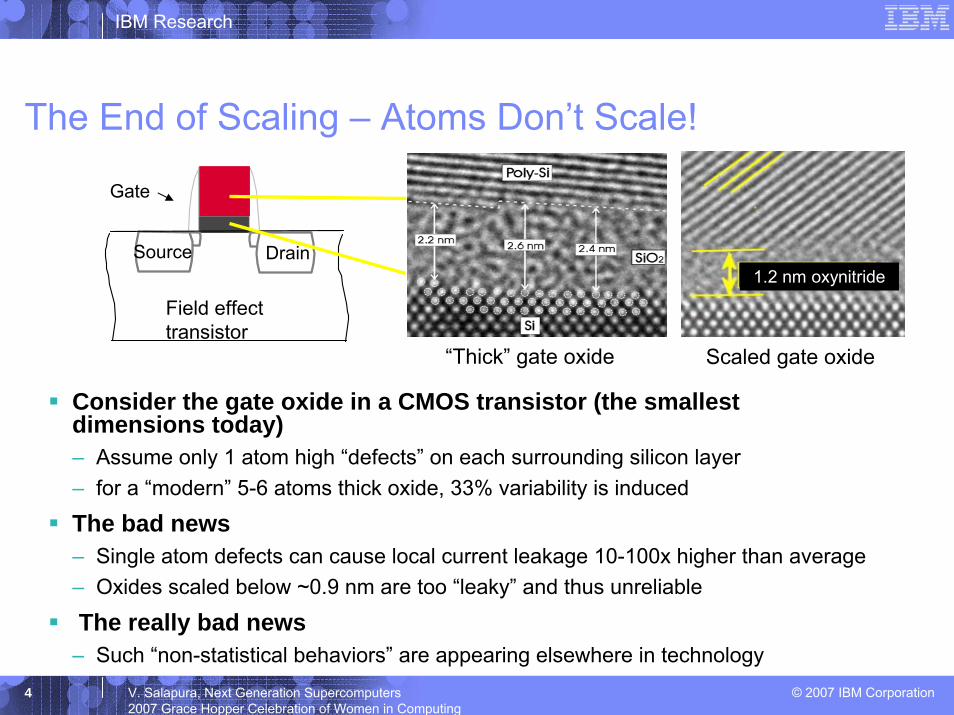
The End of Scaling – Atoms Don’t Scale!
Consider the gate oxide in a CMOS transistor (the smallest dimensions today) – Assume only 1 atom high “defects” on each surrounding silicon layer– for a “modern” 5-6 atoms thick oxide, 33% variability is induced
The bad news– Single atom defects can cause local current leakage 10-100x higher than average– Oxides scaled below ~0.9 nm are too “leaky” and thus unreliable
The really bad news– Such “non-statistical behaviors” are appearing elsewhere in technology
“Thick” gate oxidet
1.2 nm oxynitride
Scaled gate oxide
Field effect transistor
DrainSource
Gate

© 2007 IBM Corporation5 V. Salapura, Next Generation Supercomputers2007 Grace Hopper Celebration of Women in Computing
IBM Research
Scale systems, not atomsFrom technology to system optimization
Performance benefits of technology scaling increasingly hard to obtain
⇒Obtain performance increases by system optimization– Benefit from area scaling of new technologies
Similar strategy as in embedded system SoC design– Constrained in technology choice by cost
– Obtain product performance and differentiation through integration

© 2007 IBM Corporation6 V. Salapura, Next Generation Supercomputers2007 Grace Hopper Celebration of Women in Computing
IBM Research
Technology Discontinuity
Then 2002– Scaling drives performance
– Performance constrained– Active power dominates– Performance tailoring in
manufacturing– Focus on technology performance
Now 2007– Architecture drives performance
• Scaling drives down cost– Power constrained
– Standby power dominates
– Performance tailoring in design
– Focus on system performance

© 2007 IBM Corporation7 V. Salapura, Next Generation Supercomputers2007 Grace Hopper Celebration of Women in Computing
IBM Research
“Holistic Design”
Innovation across the entire value stack– Core Architecture
– Chip Design
– Devices
– System Architecture
– Cooling & Packaging
– Software Stack

© 2007 IBM Corporation8 V. Salapura, Next Generation Supercomputers2007 Grace Hopper Celebration of Women in Computing
IBM Research
Innovation That Matters:Understanding Design Leverage Points
Recognize which aspects impact design efficiency
How we optimize BlueGene for power/performance– High integration
– Memory hierarchy
– SIMD processing
Not a system-specific optimization target– Processor core
– System-on-a-Chip

© 2007 IBM Corporation9 V. Salapura, Next Generation Supercomputers2007 Grace Hopper Celebration of Women in Computing
IBM Research
Low Power Design
Power dissipation is a problem at multiple levels– Chip Level – system cooling
– Data Center Level – cooling a building!
30A1995
60A1998
100A2002

© 2007 IBM Corporation10 V. Salapura, Next Generation Supercomputers2007 Grace Hopper Celebration of Women in Computing
IBM Research
Thermal and power issues at the data center level
Data center limits determines what systems can be deployed– Floor space, Power supplies, Cooling capacity & solution (air, water)– Today, capacity of data center limited by cooling, not floor space
At data center level, only half of electricity bill goes to systems– Other half goes to air conditioning– Typically, data centers support only air cooling
Air cooling capacity limited– Power budget per rack ≈ 25 kW

© 2007 IBM Corporation11 V. Salapura, Next Generation Supercomputers2007 Grace Hopper Celebration of Women in Computing
IBM Research
The Supercomputer Challenge
More Performance More Power– Cannot require new buildings for new supercomputers
– FLOPS/W not improving from technology
Scaling up single core performance degrades power-efficiency– 2× performance ⇒ 8× power
traditional supercomputer design hitting power & cost limits
© 2007 IBM Corporation12 V. Salapura, Next Generation Supercomputers2007 Grace Hopper Celebration of Women in Computing
IBM Research
The BlueGene Concept
Parallelism can deliver higher aggregate performance– Deliver performance by exploiting application parallelism
Data level parallelism with SIMD– Work on multiple elements of a vector concurrently
– SIMD is intuitively power efficient
Thread level parallelism with a multi-core design– 2× cores = 2× performance = 2× power– IBM pioneered multicore with POWER4 over 10 years ago
– This is now becoming an industry-wide trend

© 2007 IBM Corporation13 V. Salapura, Next Generation Supercomputers2007 Grace Hopper Celebration of Women in Computing
IBM Research
The BlueGene Concept
Improve efficiency of massively parallel systems– By optimizing communication
between threads
High performance networks for synchronization and communication– Match different networks to
requirements
s

© 2007 IBM Corporation14 V. Salapura, Next Generation Supercomputers2007 Grace Hopper Celebration of Women in Computing
IBM Research
BlueGene Design Philosophy
Reduce number of components which must be designed– Single chip implements building block (“node”) for supercomputer– Use system-on-a-chip (SoC) design methodology– “Embedded design” reduces development time and cost
Build on standards– PowerPC architecture as microprocessor– Messaging interface (MPI) as programming modelMature and familiar software environment – Standard programming model– Mature compiler support

© 2007 IBM Corporation15 V. Salapura, Next Generation Supercomputers2007 Grace Hopper Celebration of Women in Computing
IBM Research
13.6 GF/s8 MB EDRAM
4 processors
1 chip, 20 DRAMs
13.6 GF/s2.0 GB DDR2
(4.0GB is an option)
32 Node Cards
13.9 TF/s2 TB
112 Racks
1.5PF/s224 TB
CabledRack
System
Compute Card
Chip
435 GF/s64 GB
32 chipsNode Card
Blue Gene/P System view

© 2007 IBM Corporation16 V. Salapura, Next Generation Supercomputers2007 Grace Hopper Celebration of Women in Computing
IBM Research
BlueGene node design (Generation L)
PLB (4:1)
L2L2
SharedSRAM
SharedSRAM
JTAGGbitEthernet
144b DDRinterface
256
256
128
256snoop
128
32k I1/32k D132k I1/32k D1
PPC440PPC440
Double FPUDouble FPU
EthernetGbit
EthernetGbit JTAG
Access
JTAGAccess CollectiveCollectiveTorusTorus Global
Barrier
GlobalBarrier
DDRControllerw/ ECC
DDRControllerw/ ECC
32k I1/32k D132k I1/32k D1
PPC440PPC440
Double FPUDouble FPU4MB
eDRAM
L3 Cacheor
On-ChipMemory
4MBeDRAM
L3 Cacheor
On-ChipMemory
Shared L3 Directory
for eDRAM
w/ECC
Shared L3 Directory
for eDRAM
w/ECC
1024b data 144b ECC
L2L2128
256
6b out, 6b in1.4Gb/sper link
3b out, 3b in2.8Gb/sper link
4 globalbarriers orinterrupts

© 2007 IBM Corporation17 V. Salapura, Next Generation Supercomputers2007 Grace Hopper Celebration of Women in Computing
IBM Research
Designing BlueGene/P
Emphasis on modular design and component reuse
Reuse of Blue Gene/L design components when feasible– Optimized SIMD floating point unit
• Protect investment in Blue Gene/L application tuning– Basic network architecture
Add new capabilities when profitable– PPC 450 embedded core with hardware coherence support
– New data moving engine to improve network operation• DMA transfers from network into memory
– New performance monitor unit• Improved application analysis and tuning

© 2007 IBM Corporation18 V. Salapura, Next Generation Supercomputers2007 Grace Hopper Celebration of Women in Computing
IBM Research
JTAG 10 Gb/s
256
256
32k I1/32k D132k I1/32k D1
PPC450PPC450
Double FPUDouble FPU
Ethernet10 Gbit
Ethernet10 GbitJTAG
Access
JTAGAccess Collective
CollectiveTorus
Torus GlobalBarrier
GlobalBarrier
DDR-2Controllerw/ ECC
DDR-2Controllerw/ ECC
32k I1/32k D132k I1/32k D1
PPC450PPC450
Double FPUDouble FPU
4MBeDRAM
L3 Cacheor
On-ChipMemory
4MBeDRAM
L3 Cacheor
On-ChipMemory
6 3.4Gb/sbidirectional
4 globalbarriers orinterrupts
128
32k I1/32k D132k I1/32k D1
PPC450PPC450
Double FPUDouble FPU
32k I1/32k D132k I1/32k D1
PPC450PPC450
Double FPUDouble FPU L2L2
Snoop filter
Snoop filter
4MBeDRAM
L3 Cacheor
On-ChipMemory
4MBeDRAM
L3 Cacheor
On-ChipMemory
512b data 72b ECC
128
L2L2
Snoop filter
Snoop filter
128
L2L2
Snoop filter
Snoop filter
128
L2L2
Snoop filter
Snoop filter
Multiplexing
switch
Multiplexing
switch
DMADMA
Multiplexing
switch
Multiplexing
switch
3 6.8Gb/sbidirectional
DDR-2Controllerw/ ECC
DDR-2Controllerw/ ECC
13.6 GB/sDDR-2 DRAM bus
32
SharedSRAM
SharedSRAM
snoop
Hybrid PMU
w/ SRAM256x64b
Hybrid PMU
w/ SRAM256x64b
Next generation node design (Generation P)
Shared L3 Directory
for eDRAM
w/ECC
Shared L3 Directory
for eDRAM
w/ECC
Shared L3 Directory
for eDRAM
w/ECC
Shared L3 Directory
for eDRAM
w/ECC
ArbArb
512b data 72b ECC

© 2007 IBM Corporation19 V. Salapura, Next Generation Supercomputers2007 Grace Hopper Celebration of Women in Computing
IBM Research
Exploiting Data Level Parallelism:SIMD Floating-Point Unit
Two replicas of a standard single-pipe PowerPC FPU– 2 x 32 64-bit registers– Reuse standard IBM FPU
SIMD ⇒ Single instruction operates on multiple data– Datapath width is 16 bytes– Feeds two FPUs with 8 bytes
each every cycle
Two FP multiply-add operations per cycle– 3.4 GFLOP/s peak performance
To Memory
From Memory
SecondaryFPR
S0
S31
PrimaryFPR
P0
P31

© 2007 IBM Corporation20 V. Salapura, Next Generation Supercomputers2007 Grace Hopper Celebration of Women in Computing
IBM Research
Exploiting Thread Level Parallelism:Multicore Design and Data Sharing
4 processors on chip
Processors usually include cache– High-speed data access for frequently accessed data
In multiprocessor systems, each processor has a separate private cache
What happens when multiple processors cache and write the same data?

© 2007 IBM Corporation21 V. Salapura, Next Generation Supercomputers2007 Grace Hopper Celebration of Women in Computing
IBM Research
Multiprocessor cache management issues
Address DataAddress Data
PPC440PPC440
Address DataAddress Data
PPC440PPC440
L1D L1D
Address DataAddress Datamemory
FF00 5FF00 5FF00 5
FF00 6 FF00 7

© 2007 IBM Corporation22 V. Salapura, Next Generation Supercomputers2007 Grace Hopper Celebration of Women in Computing
IBM Research
Multiprocessor cache management issues:Coherence protocol
Address DataAddress Data
PPC450PPC450
Address DataAddress Data
PPC450PPC450
L1D L1D
Address DataAddress Data
FF00 5FF00 5FF00 5
FF00 6 FF00 7
memory
© 2007 IBM Corporation23 V. Salapura, Next Generation Supercomputers2007 Grace Hopper Celebration of Women in Computing
IBM Research
The cost of maintaining coherence
Every time any processor requests data – Every other processor needs to check its cache
High overhead cost– Cache busy for significant fraction of cycles
• to snoop if processor has data corresponding to current request(s)– Increasing penalty as more processors added
Solution– Snoop filtering – filter requests to remove unnecessary lookups

© 2007 IBM Corporation24 V. Salapura, Next Generation Supercomputers2007 Grace Hopper Celebration of Women in Computing
IBM Research
Snoop filters in the system
Processor 0
snoop
SnoopUnit
Processor 1
snoop
Processor 2
snoop
Processor 3
snoop
L2 Cache
SnoopUnit
L2 Cache
SnoopUnit
L2 Cache
SnoopUnit
L2 Cache
L3 CacheDMA
Coherence traffic
Data transfer

© 2007 IBM Corporation25 V. Salapura, Next Generation Supercomputers2007 Grace Hopper Celebration of Women in Computing
IBM Research
Multi-component snoop filtering
Snoop filter requirements– Functional correctness
• Cannot filter requests which are locally cached– Effectiveness
• Should filter out a large fraction of snoop requests– Efficient
• Should be small and power efficientBlue Gene/P implements multiple snoop filters– Set of snoop filters for each processor core– Each snoop filter has multiple filter components – Filter components use different filtering algorithms for maximal
effectiveness• Snoop caches• Stream registers

© 2007 IBM Corporation26 V. Salapura, Next Generation Supercomputers2007 Grace Hopper Celebration of Women in Computing
IBM Research
Snoop filter efficiency
0
20
40
60
80
100
120
FFT Barnes LU Ocean Raytrace Cholesky
Filte
r rat
e (%
)
Big
ger i
s be
tter
Big
ger i
s be
tter
Simulation results

© 2007 IBM Corporation27 V. Salapura, Next Generation Supercomputers2007 Grace Hopper Celebration of Women in Computing
IBM Research
Preliminary results on snoop filter efficiency
0
0.2
0.4
0.6
0.8
1
1.2
BT EP FT LU-HP LU MG SP UA Average
Exec
utio
n tim
e (n
orm
.)
no filter stream reg snoop cache both
smal
ler i
s be
tter
smal
ler i
s be
tter
Actual hardware
measurements

© 2007 IBM Corporation28 V. Salapura, Next Generation Supercomputers2007 Grace Hopper Celebration of Women in Computing
IBM Research
Performance monitoring unit
Allow programmers to understand behavior of their programs
Detect bottlenecks and guide program optimization– Particularly important for supercomputing application
Performance counters provide statistics about program execution– Instructions executed
– Cache misses
– Coherence requests
Feedback about the effectiveness of various architectural enhancements

© 2007 IBM Corporation29 V. Salapura, Next Generation Supercomputers2007 Grace Hopper Celebration of Women in Computing
IBM Research
Performance monitoring unit
Traditionally about 6-8 counters
256 counters, 64bits wide, 1024 possible counter events– Monitors 4 processor cores and FPU, L3, L2, snoop filters,
torus and collective network
Novel architecture– Hybrid implementation using SRAM arrays

© 2007 IBM Corporation30 V. Salapura, Next Generation Supercomputers2007 Grace Hopper Celebration of Women in Computing
IBM Research
BlueGene/P ASIC
IBM Cu-08 90nmCMOS ASIC process technology Die size 173 mm2
Clock frequency 850MHzTransistor count 208MPower dissipation 16W
Careful floorplaning

© 2007 IBM Corporation31 V. Salapura, Next Generation Supercomputers2007 Grace Hopper Celebration of Women in Computing
IBM Research
BlueGene/P node card with 32 chip cards

© 2007 IBM Corporation32 V. Salapura, Next Generation Supercomputers2007 Grace Hopper Celebration of Women in Computing
IBM Research
BlueGene/P cabinet
16 node cards in a half-cabinet (midplane)
512 nodes (8 x 8 x 8)
all wiring up to this level (>90%) card-level
1024 nodes in a cabinet
Pictured 512 way prototype (upper cabinet)

© 2007 IBM Corporation33 V. Salapura, Next Generation Supercomputers2007 Grace Hopper Celebration of Women in Computing
IBM Research
Application Performance and Power Efficiency
We need metrics to guide design and quantify tradeoffs
Power and Performance figures of merit– t -- time (delay)
• application execution time– E -- energy (W/MIPS)
• energy dissipated to execute application – E * t -- energy-delay [Gonzalez Horowitz 1996]
• energy and delay are equally weighted– E * t2 -- energy-delay squared [Martin et al. 2001]
• metric invariant on the assumption of voltage scaling

© 2007 IBM Corporation34 V. Salapura, Next Generation Supercomputers2007 Grace Hopper Celebration of Women in Computing
IBM Research
Low Power - High Performance System Concept
0.000001
0.00001
0.0001
0.001
0.01
0.1
1
1 10 100 1000
nodes
norm
aliz
ed
EE * tE * t²
1 100 1000 100000 100000010 10000

© 2007 IBM Corporation35 V. Salapura, Next Generation Supercomputers2007 Grace Hopper Celebration of Women in Computing
IBM Research
Exploring the Benefits of SIMD
Power efficient
Low overhead (doubles data computation without paying cost of instruction decode, issue etc.)
Code optimized to exploit SIMD floating point
Workload: UMT2K on 1024 nodesSource: Salapura et al., IEEE Micro, 2006
0
0.2
0.4
0.6
0.8
1
1.2
t power E E t E t²metrics
norm
aliz
ed
scalarSIMD
smal
ler i
s be
tter
smal
ler i
s be
tter

© 2007 IBM Corporation36 V. Salapura, Next Generation Supercomputers2007 Grace Hopper Celebration of Women in Computing
IBM Research
SIMD and Thread Level Parallelism
Exploiting parallelism at all levels offers the biggest power/performance advantage Source: Salapura et al., IEEE Micro, 2006
0
0.2
0.4
0.6
0.8
1
1.2
t power E E t E t²
metrics
norm
aliz
edscalar thread-level parallel data-level parallel both
smal
ler i
s be
tter
smal
ler i
s be
tter

© 2007 IBM Corporation37 V. Salapura, Next Generation Supercomputers2007 Grace Hopper Celebration of Women in Computing
IBM Research
Snoop filtering improves power and performance
50%
60%
70%
80%
90%
100%
110%
time power E E × t E × t²
snoop disabled snoop filterActual hardware
measurements
smal
ler i
s be
tter
smal
ler i
s be
tter
© 2007 IBM Corporation38 V. Salapura, Next Generation Supercomputers2007 Grace Hopper Celebration of Women in Computing
IBM Research
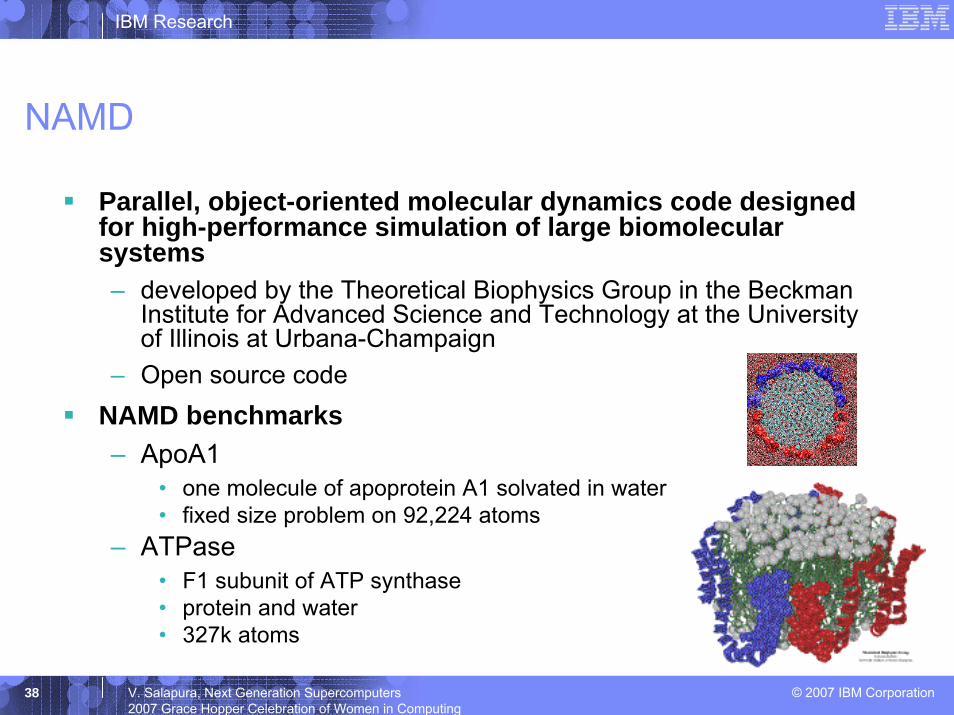
NAMD
Parallel, object-oriented molecular dynamics code designed for high-performance simulation of large biomolecularsystems– developed by the Theoretical Biophysics Group in the Beckman
Institute for Advanced Science and Technology at the University of Illinois at Urbana-Champaign
– Open source codeNAMD benchmarks– ApoA1
• one molecule of apoprotein A1 solvated in water • fixed size problem on 92,224 atoms
– ATPase• F1 subunit of ATP synthase• protein and water• 327k atoms

© 2007 IBM Corporation39 V. Salapura, Next Generation Supercomputers2007 Grace Hopper Celebration of Women in Computing
IBM Research
NAMD Performance and Power/Performance Efficiency
0
500
1000
1500
2000
2500
0 512 1024 1536 2048 2560 3072 3584 4096
nodes
perf
orm
ance
ApoA1
ATPase
0.0000001
0.000001
0.00001
0.0001
0.001
0.01
0.1
1
10
1 10 100 1000 10000
ATPase EATPase E * tATPase E * t²ApoA1 EApoA1 E * tApoA1 E * t²
Power/Performance efficiency on log-logPerformance scaling - normalized
Source: Salapura et al., IEEE Micro, 2006
smal
ler i
s be
tter
smal
ler i
s be
tter
Big
ger i
s be
tter
Big
ger i
s be
tter

© 2007 IBM Corporation40 V. Salapura, Next Generation Supercomputers2007 Grace Hopper Celebration of Women in Computing
IBM Research
QCD: 2006 Gordon Bell Prize winner
Quantum chromo dynamics– the theory of the strong nuclear force
that binds the constituents of sub-nuclear matter, the quarks and gluons, to form stable nuclei and therefore more than 90% of the visible matter of the Universe
70.9 TFLOPS!Significance of QCD– Cosmological models depend on the
mechanism that transformed the primordial quark gluon plasma into stable nuclear matter
– The Big Bang simulationEmploys Domain Wall Fermion (DWF) method– uses a fifth space time dimension to
eliminate systematic errorsLQCD breaks new ground in the understanding of sub-nuclear matter
1E-10
1E-09
1E-08
1E-07
1E-06
1E-05
0.0001
0.001
0.01
0.1
1
10
1 10 100 1000 10000 100000nodes
norm
aliz
ed
EE * tE * t²E (measured)E * t (measured)E * t² (measured)
Source: Vranas et al., Supercomputing 2006
smal
ler i
s be
tter
smal
ler i
s be
tter

© 2007 IBM Corporation41 V. Salapura, Next Generation Supercomputers2007 Grace Hopper Celebration of Women in Computing
IBM Research
ddcMD: 2005 Gordon Bell Prize WinnerMolecular dynamics– Models solidification process - determines structure and stability of metals under dynamic
loading conditions 524 million atom simulations on 64K nodes are orders of magnitude larger than any previously attempted runs– Example: Solidification of molten Ta at 5000K during isothermal compression to 250GPaBlue Gene enables important scientific findings

© 2007 IBM Corporation42 V. Salapura, Next Generation Supercomputers2007 Grace Hopper Celebration of Women in Computing
IBM Research
HOMME: Atmospheric Modeling
Moist Held-Suarez test
BlueGene allows to include models of clouds – requires resolution of 1km – was not feasible before

© 2007 IBM Corporation43 V. Salapura, Next Generation Supercomputers2007 Grace Hopper Celebration of Women in Computing
IBM Research
LINPACK PerformanceBlue Gene/L
#1 on Nov 2004 TOP500 list
70.72 TFLOP/s on 16K nodes @ 700 MHz
#1 since November 2005 TOP500 list
280.6 TFLOP/s on 64K nodes
Blue Gene/P
#31 on June 2007 TOP500 list
20.86 TFLOP/s on 2K nodes @ 850 MHz0
10000
20000
30000
40000
50000
60000
70000
80000
1 32 1024 4096 16384
0
50000
100000
150000
200000
250000
300000
1 32 1024 4096 16384 65536
Number of nodes
GFL
OPS

© 2007 IBM Corporation44 V. Salapura, Next Generation Supercomputers2007 Grace Hopper Celebration of Women in Computing
IBM Research
BlueGene: Performance and Density Breakthrough
Metric ASCI White ASCI Q Earth Simulator ASC Purple BG/L
Memory/Space (GB/sq.m) 8.6 17 3.1 8015019.4
140Speed/Space (GF/sq.m) 13 16 13 1600Speed/Power (GF/kW) 12 7.9 4 300

© 2007 IBM Corporation45 V. Salapura, Next Generation Supercomputers2007 Grace Hopper Celebration of Women in Computing
IBM Research
Year Computer MeasuredTflop/s
TheoreticalPeak Tflop/s
Number ofProcessors
% peak Processor MHz
2005 IBM BlueGene/L LLNL 280.6 367.00 131072 76 700
2006 Cray Jaguar XT4/XT3Oak Ridge NL
101.7 119.35 23016 85 2600
2006 Cray Red Storm, Sandia NL 101.4 127.41 26544 80 2400
2007 IBM BlueGene/LStony Brook
82.16 103.22 36864 80 700
2007 IBM BlueGene/LRensselaer
73.03 91.75 32768 80 700
2006 IBM Mare Nostrum JS21 PPC970, BSC
62.63 94.21 10240 66 2300
2005 IBM BlueGene/LIBM Yorktown
91.29 114.69 40960 80 700
2006 IBM ASC PurpleLLNL
75.76 92.78 12208 81 1900
2007 Dell Abe PowerEdge 1955 NCSA
62.68 89.59 9600 70 2333
2007 SGI HLRB-II Altrix 4700, Leibniz
56.52 62.26 9728 90 1600
June 2007: 29th TOP500 list

© 2007 IBM Corporation46 V. Salapura, Next Generation Supercomputers2007 Grace Hopper Celebration of Women in Computing
IBM Research
The Green500 List
Supercomputers ranked using FLOPS/Watt
Official draft – the first list to appear at SC07 in 11/2007
Green500 Computer TOP500 MeasuredTflop/s
Total Rated Power (kW) MFLOPS/W
1 IBM BlueGene/L LLNL 1
2 IBM MareNostrumBSC 5 62.6 1,071 58.23
3 Cray Jaguar XT3Oak Ridge NL 10 43.5 1,331 32.67
4 Columbia SGI 4 51.9 3,400 15.26
5 IBM ASC PurpleLLNL 3 75.8 7,600 9.97
6 IBM ASC White 90 7.3 2,040 3.58
7 Earth Simulator (NEC) 14 35.9 11,900 3.01
40
280.6 2,500 112.24
8 ASC Q (HP) 13.9 10,200 1.36
© 2007 IBM Corporation47 V. Salapura, Next Generation Supercomputers2007 Grace Hopper Celebration of Women in Computing
IBM Research
Conclusions
Next generation design– Exploit proven low-power approach with massive parallelism– Aggregate performance is important, not performance of individual chip– Exploit thread level and data-level parallelism
Facilitate application scaling to the next level– Snoop filtering improves efficiency of coherent system– Improve efficiency with new hardware DMA– Improved support for application tuning with improved perf. monitoring
The next generation of supercomputers will enable scientists to make even more important scientific discoveries– new unparalleled application performance– breakthroughs in science by providing unprecedented compute power

© 2007 IBM Corporation48 V. Salapura, Next Generation Supercomputers2007 Grace Hopper Celebration of Women in Computing
IBM Research
BlueGene on the Web
The Blue Gene/P project has been supported and partially funded by Argonne National Laboratory and the Lawrence Livermore National Laboratory on behalf of the United States Department of Energy under Subcontract No. B554331.
The Blue Gene/L project has been supported and partially funded by the Lawrence Livermore National Laboratories on behalf of the United States Department of Energy under Lawrence Livermore National Laboratories Subcontract No. B517552.