next plc results ye 310108 -...
TRANSCRIPT

Introduction

Income Statement£m 2010 2009
Revenue 3,406 3,272
Operating profit 530 478Interest (25) (49)
Profit before tax 505 429Taxation (141) (127)
Profit after tax 364 302
EPS 188.5p 156.0p
+4%
+11%

Income Statement£m 2010 2009
Revenue 3,406 3,272
Operating profit 530 478Interest (25) (49)
Profit before tax 505 429Taxation (141) (127)
Profit after tax 364 302
EPS 188.5p 156.0p
+4%
One OffsIncrease to profit
Extra (53rd) week £7m
NSL provision £2m
Total £9m
+11%
Decrease to profit
London Olympics £5m
Int‘l goodwill £2m
Int’l impairment £3m
Total £10m

Income Statement£m 2010 2009
Revenue 3,406 3,272
Operating profit 530 478Interest (25) (49)
Profit before tax 505 429Taxation (141) (127)
Profit after tax 364 302
EPS 188.5p 156.0pRate5.0%
Rate6.3%
£500m
£750m
2010 2009
Average Debt Balance

Income Statement£m 2010 2009
Revenue 3,406 3,272
Operating profit 530 478Interest (25) (49)
Profit before tax 505 429Taxation (141) (127)
Profit after tax 364 302
EPS 188.5p 156.0p
+4%
+11%
+18%
28.0% 29.5%
+21%

Income Statement£m 2010 2009
Revenue 3,406 3,272
Operating profit 530 478Interest (25) (49)
Profit before tax 505 429Taxation (141) (127)
Profit after tax 364 302
EPS 188.5p 156.0p
+18%
28.0% 29.5%
Rate5.0%
Rate6.3%
£500m
£750m
2010 2009
Average Debt Balance
+21%
The Times, 20th April 2009

£m 2010 2009
Fixed assets 582 617Goodwill 47 55Stocks 309 319Debtors 617 623Creditors (886) (842)Derivatives 4 66Pension fund deficit (50) (69)Buyback commitments (90) -Net debt (400) (629)
Net assets 133 140
Balance Sheet
- 3%- 1%

£m 2010 2009
Fixed assets 582 617Goodwill 47 55Stocks 309 319Debtors 617 623
Balance Sheet
Directory Debtors
January 2010
£484m + 5.0%January 2009
£461m
Salesincrease + 7.0%
- 1%

£m 2010 2009
Fixed assets 582 617Goodwill 47 55Stocks 309 319Debtors 617 623Creditors (886) (842)Derivatives 4 66Pension fund deficit (50) (69)Buyback commitments (90) -Net debt (400) (629)
Net assets 133 140
Balance Sheet
+ 5%

£m 2010 2009
Profit before tax 505 429Depreciation / impairment 136 123Capital expenditure (99) (121)Acquisitions - (14) Working capital / other 13 (18)Dividends paid (109) (107)Tax paid (115) (126)Share buybacks (102) (55)
Net cash flow 229 111
Cash Flow

£m 2010 2009
Profit before tax 505 429Depreciation / impairment 136 123Capital expenditure (99) (121)
Cash Flow
Jan 10 Jan 09
£102m£19m£121m
REFITS£42m
NEW£60m
£20m£99m
£79m
REFITS£26m
NEW£46m
EXT£7m
Warehouse / other
Stores

£m 2010 2009
Profit before tax 505 429Depreciation / impairment 136 123Capital expenditure (99) (121)
Cash Flow
Warehouse / other
Stores
Jan 10
£20m£99m
£79m
REFITS£26m
NEW£46m
EXT£7m
Jan 11(e)
£121m
£87m
£34m
REFITS£24m
NEW£46m
EXT£17m

£m 2010 2009
Profit before tax 505 429Depreciation / disposals 136 123Capital expenditure (99) (121)Acquisitions - (14) Working capital / other 13 (18)Dividends paid (109) (107)Tax paid (115) (126)Share buybacks (102) (55)
Net cash flow 229 111
Cash Flow
Operational cash flow 331 166

2011(e)
(121)
(70)(132)(150)
Cash Flow£m
Profit before taxDepreciation / disposalsCapital expenditureAcquisitionsWorking capital / otherDividends paidTax paidShare buybacks
Net cash flow
2010
505136(99)
-13
(109)(115)(102)
229

Debt and Facilities
Facilities
£250m
£255m
£295m
2016 Bond
2013 Bond
2013 Bank
Net debt
Sept 2010peak(e)
£800m
£600mJanuary 2011(e)
Inc. completed buybacks
£320m
Net debt 2010
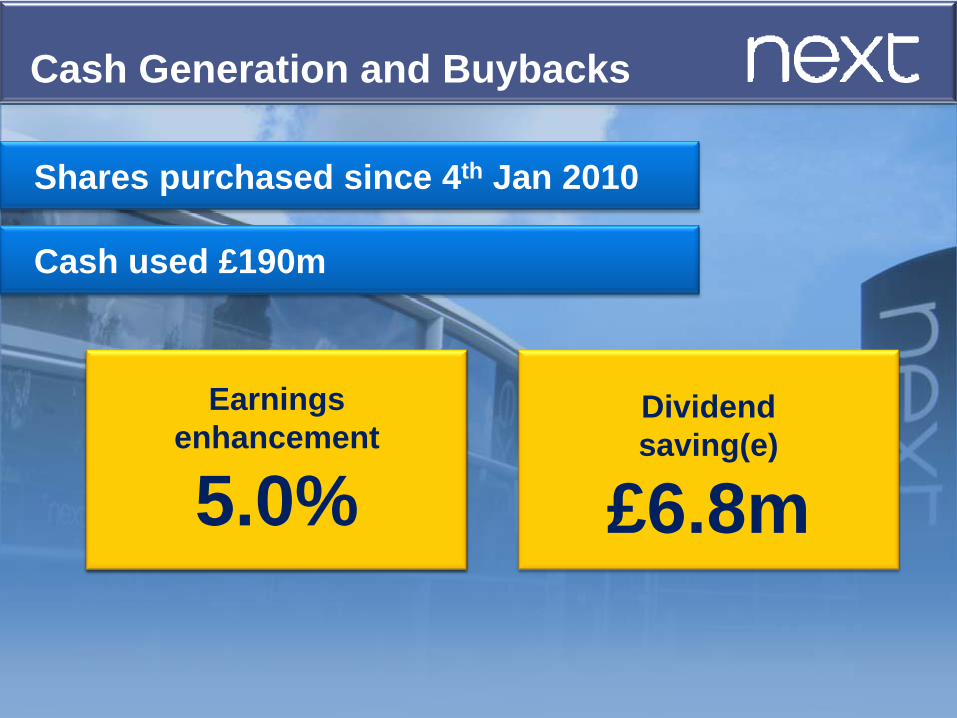
Cash Generation and Buybacks
Shares purchased since 4th Jan 2010
Cash used £190m
Share Price
£20£190m of Buybacks
9.5m shares
Earningsenhancement
5.0%Dividendsaving(e)
£6.8m

+20%
Dividends
55p66pJan 2010 Jan 2009
At least10%
increase
Jan 2011(e)
Retail average
2.4x
COVER
2.8xCOVER
2.8x
FTSE 100 average
1.8x

Retail

Retail
£m 2010 2009
Revenue 2,274 2,198 + 3.5%
Operating profit 324 289 + 12.2%
% to revenue 14.2% 13.1%

Retail
£m 2010 2009
Revenue 2,274 2,198 + 3.5%
Operating profit 324 289 + 12.2%
% to revenue 14.2% 13.1%
52 v 52
+ 2.0%

Retail
Sales Analysis52 week full price LFL Net sales from new space52 week full price salesImpact of extra weekMarkdownsTotal Sales
: Sales Analysis
£m 2010 2009
Revenue 2,274 2,198 + 3.5%
Operating profit 324 289 + 12.2%
% to revenue 14.2% 13.1%
+ 0.5%+ 3.2%+ 3.7%+ 1.5%- 1.7%+ 3.5%
+ 2.0%
52 v 52
+ 1.7%
Inc. Directory

Retail
Margin MovementFX impact - 5.0%Better sourcing + 3.7%VAT reduction + 0.5%Lower freight + 0.4%
£m 2010 2009
Revenue 2,274 2,198 + 3.5%
Operating profit 324 289 + 12.2%
% to revenue 14.2% 13.1%
: Profit Analysis
Bought in gross margin - 0.4%

£m 2010 2009
Revenue 2,274 2,198 + 3.5%
Operating profit 324 289 + 12.2%
% to revenue 14.2% 13.1%
Retail
Margin Movement
Markdowns + 1.4%
: Profit Analysis
200820092010
Brand surplus stock
7989
Index100
Achieved gross margin + 1.0%
Bought in gross margin - 0.4%

Occupancy + 0.3%
£m 2010 2009
Revenue 2,274 2,198 + 3.5%
Operating profit 324 289 + 12.2%
% to revenue 14.2% 13.1%
Retail : Profit Analysis
Margin Movement
Rent 0.0%Rates - 0.1%Depreciation - 0.1%Utilities & other + 0.5%
Achieved gross margin + 1.0%

Branch payroll 0.0%
Warehouse & distribution + 0.5%
Overheads / other - 0.7%
£m 2010 2009
Revenue 2,274 2,198 + 3.5%
Operating profit 324 289 + 12.2%
% to revenue 14.2% 13.1%
Retail : Profit Analysis
Margin Movement Achieved gross margin + 1.0%
Occupancy + 0.3%
Retail
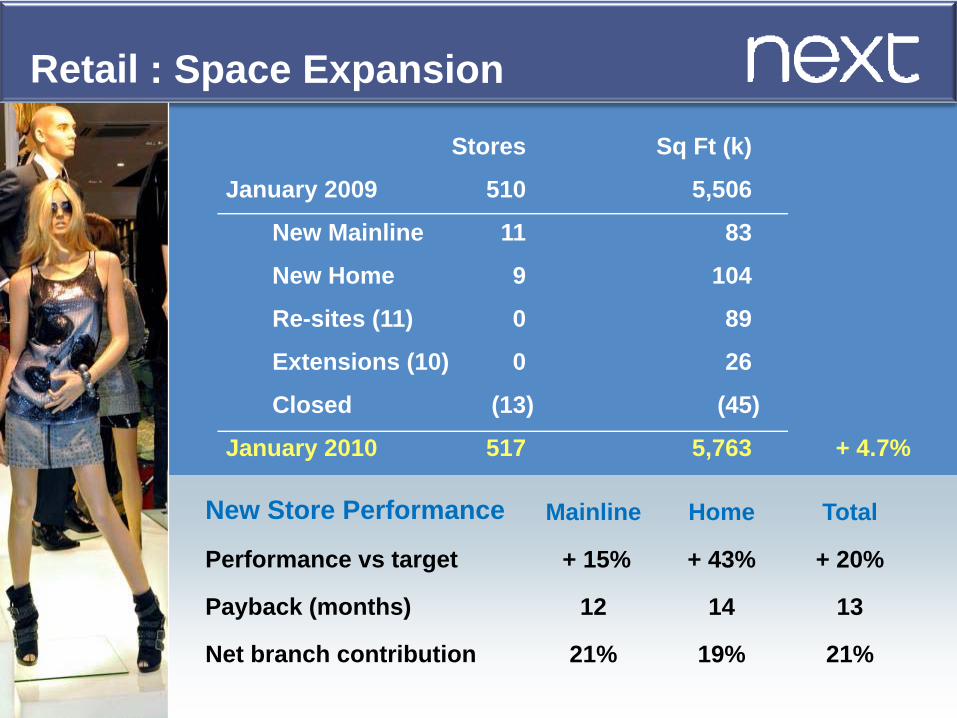
New Store Performance
Performance vs target
Payback (months)
Net branch contribution
Stores Sq Ft (k)
January 2009 510 5,506
New Mainline 11 83
New Home 9 104
Re-sites (11) 0 89
Extensions (10) 0 26
Closed (13) (45)
January 2010 517 5,763 + 4.7%
: Space Expansion
Mainline
+ 15%
12
21%
Home
+ 43%
14
19%
Total
+ 20%
13
21%
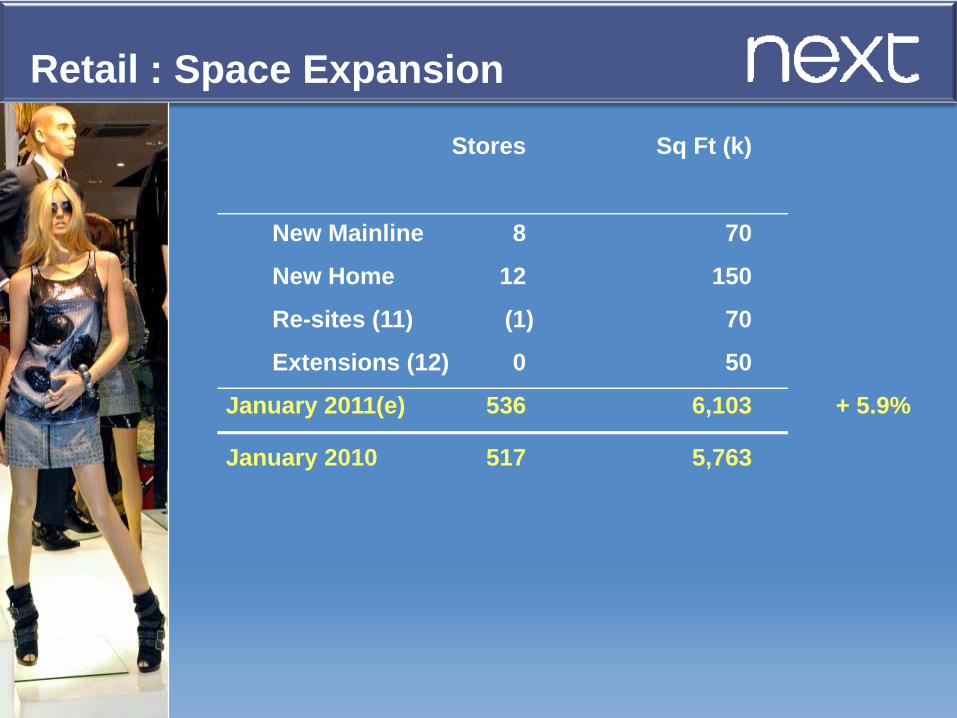
Retail : Space Expansion
New Mainline 8 70
New Home 12 150
Re-sites (11) (1) 70
Extensions (12) 0 50
January 2011(e) 536 6,103 + 5.9%
Stores Sq Ft (k)
January 2010 517 5,763

Directory

£m 2010 2009
Revenue 873 816 + 7.0%
Operating profit 184 158 + 16.4%
% to revenue 21.0% 19.3%
Sales Drivers 2010 2009
Active customers 2.28m 2.20m + 3.6%Printed pages 3,968 3,960 + 0.2%
Directory : Sales Analysis

£m 2010 2009
Revenue 873 816 + 7.0%
Operating profit 184 158 + 16.4%
% to revenue 21.0% 19.3%
Sales Drivers 2010 2009
Active customers 2.28m 2.20m + 3.6%Printed pages 3,968 3,960 + 0.2%
Directory : Sales Analysis
+ 5.0%
52 v 52
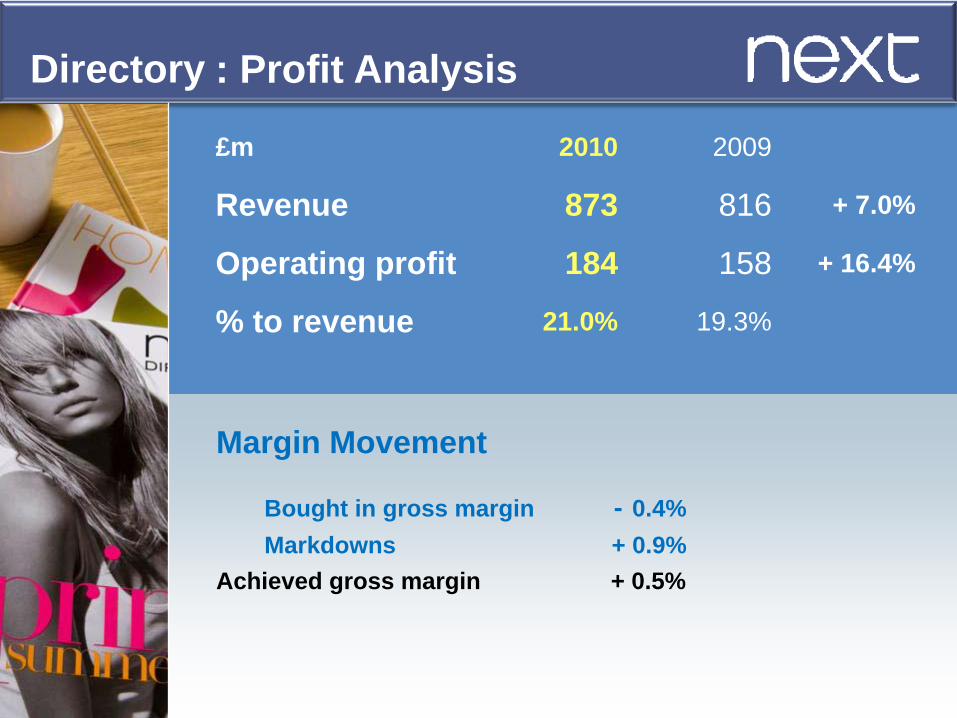
Directory : Profit Analysis
£m 2010 2009
Revenue 873 816 + 7.0%
Operating profit 184 158 + 16.4%
% to revenue 21.0% 19.3%
Margin Movement
Markdowns + 0.9% Achieved gross margin + 0.5%
Bought in gross margin - 0.4%

Directory
Bad debt reduction + 0.7%Service charge - 0.3%Book creation / marketing + 0.7%Warehouse & distribution + 1.0%Other - 0.9%
£m 2010 2009
Revenue 873 816 + 7.0%
Operating profit 184 158 + 16.4%
% to revenue 21.0% 19.3%
: Profit Analysis
Achieved gross margin + 0.5%
Margin Movement

International (NextDirect.com)
1. Direct trading in 36 countries
2. Delivery operations robust
3. Advantages over Retail• Low start up costs
• Low fixed overheads
• Central stock location
• Scalability Turnover
2009/10Turnover(e)
2010/11
£2.5m £7.0m
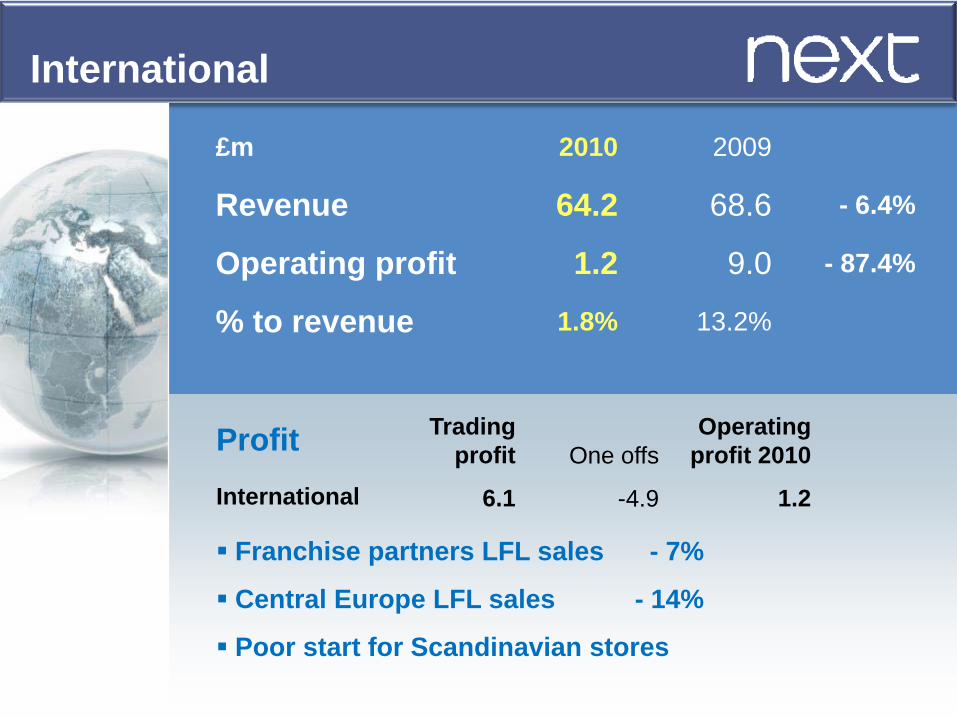
International
£m 2010 2009
Revenue 64.2 68.6 - 6.4%
Operating profit 1.2 9.0 - 87.4%
% to revenue 1.8% 13.2%
ProfitInternational
Tradingprofit
6.1
One offs
-4.9
Operatingprofit 2010
1.2
Franchise partners LFL sales - 7%
Central Europe LFL sales - 14%
Poor start for Scandinavian stores

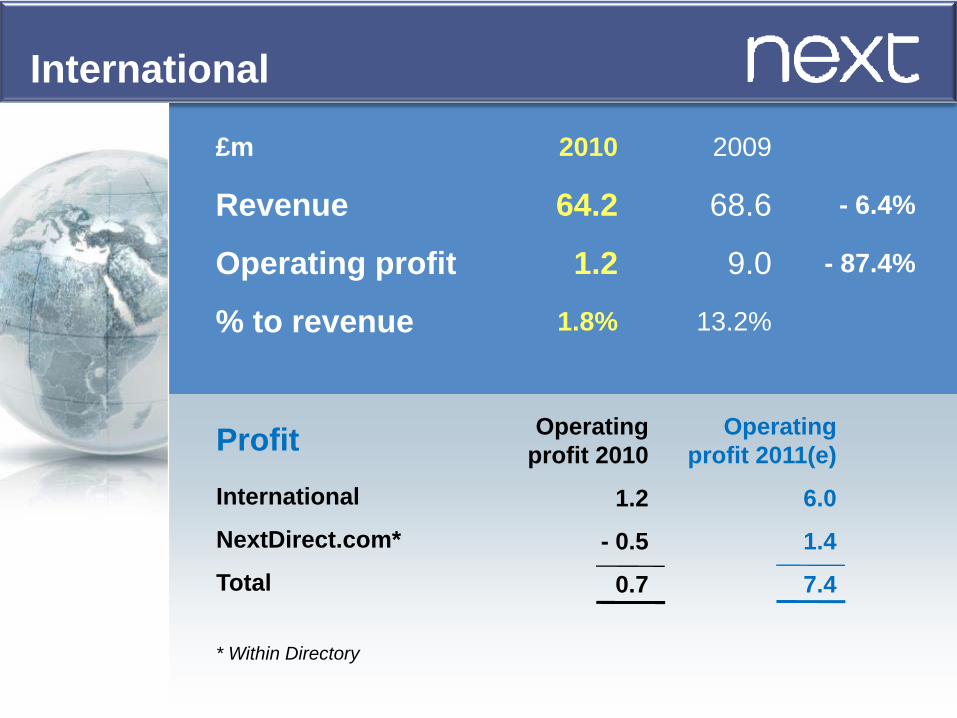
International
£m 2010 2009
Revenue 64.2 68.6 - 6.4%
Operating profit 1.2 9.0 - 87.4%
% to revenue 1.8% 13.2%
ProfitInternational
NextDirect.com*
Total
Tradingprofit
6.1
0.8
6.9
One offs
- 4.9
- 1.3
- 6.2
Operatingprofit 2010
1.2
- 0.5
0.7
* Within Directory
International
£m 2010 2009
Revenue 64.2 68.6 - 6.4%
Operating profit 1.2 9.0 - 87.4%
% to revenue 1.8% 13.2%
ProfitInternational
NextDirect.com*
Total
Operatingprofit 2011(e)
6.0
1.4
7.4
Operatingprofit 2010
1.2
- 0.5
0.7
* Within Directory

Increased competition
Lower commission income
Includes £2m profit share release
2010/11(e) profits circa £30m
Sourcing
£m 2010 2009
Intra-group sales 534.0 600.7 - 11.1%
Operating profit 35.7 32.0 + 11.5%
- 23.4%
USD
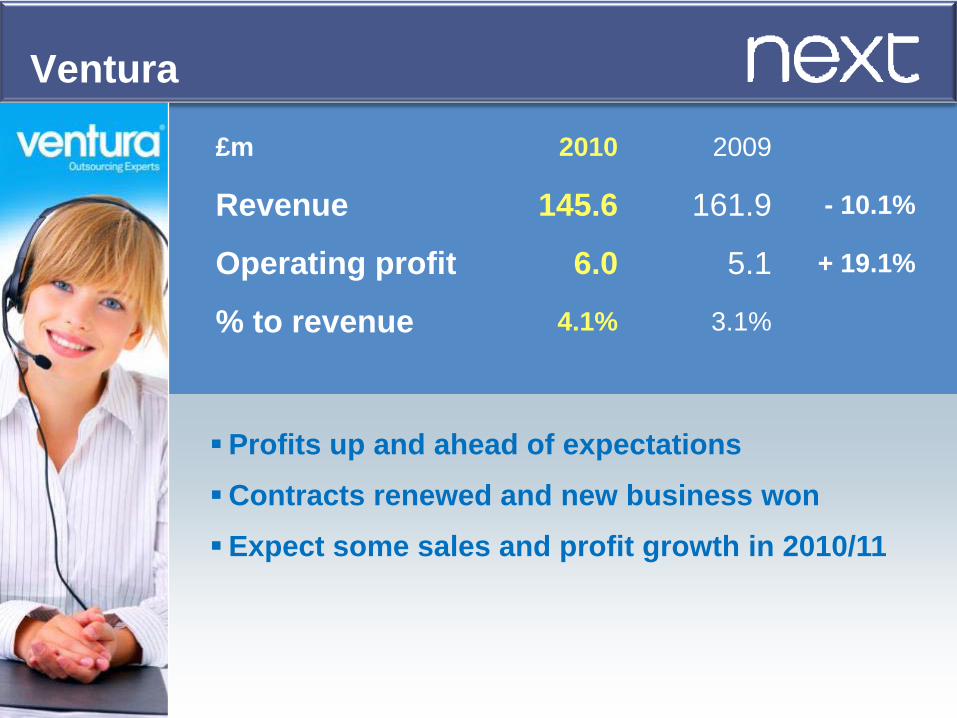
Profits up and ahead of expectations
Contracts renewed and new business won
Expect some sales and profit growth in 2010/11
Ventura
£m 2010 2009
Revenue 145.6 161.9 - 10.1%
Operating profit 6.0 5.1 + 19.1%
% to revenue 4.1% 3.1%

Other
£m 2010 2009
Lipsy 0.1 (1.4)
Property 0.3 0.8
Associates 0.9 0.9
Group / other (22.0) (14.5)
Total (20.7) (14.2)
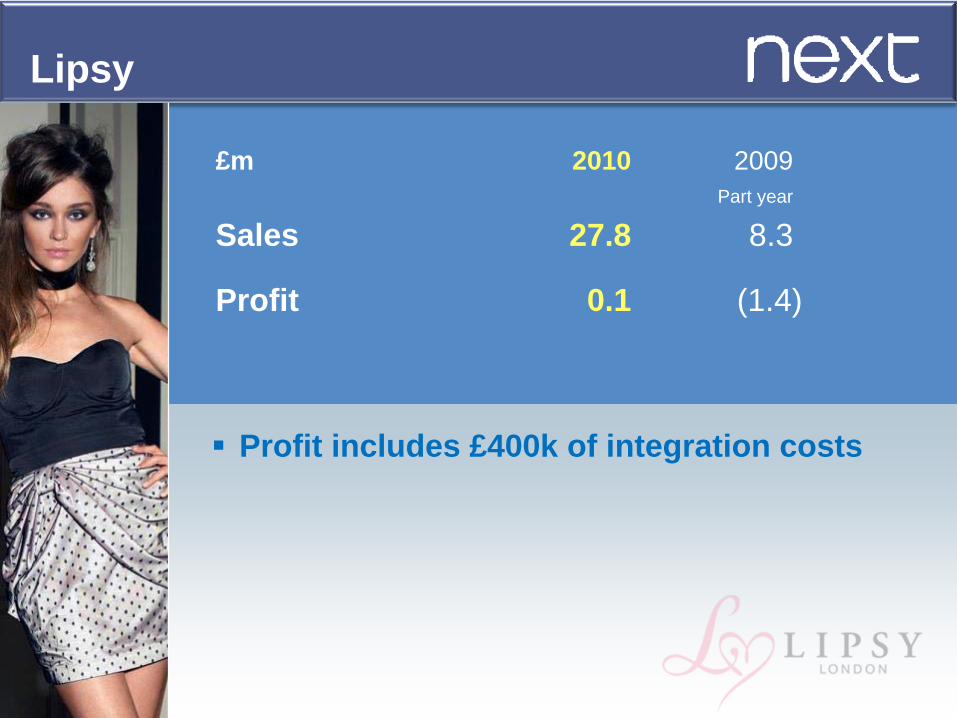
£m 2010 2009Part year
Sales 27.8 8.3
Profit 0.1 (1.4)
Profit includes £400k of integration costs
Lipsy

£m 2010 2009Part year
Sales 27.8 8.3
Profit 0.1 (1.4)
Profit includes £400k of integration costs
13 stores open
Lipsy

£m 2010 2009Part year
Sales 27.8 8.3
Profit 0.1 (1.4)
Lipsy
New Store PerformancePerformance v target + 6%
Payback (months) 21
Net branch contribution 15%

£m 2010 2009Part year
Sales 27.8 8.3
Profit 0.1 (1.4)
11 stores planned for 2010/11
2010/11(e) profits circa £2m
Lipsy

£m 2010 2009
Lipsy 0.1 (1.4)
Property 0.3 0.8
Associates 0.9 0.9
Group / other (22.0) (14.5)
Total (20.7) (14.2)
Other

Outlook

1.6m
2.5m
+51%-1.8%
29.4m
28.9m
Better Than Expected...
Jan’10Jan’08
NO. OF UNEMPLOYED
UP 900K
NO. OF EMPLOYED
DOWN 500K
Source: HM Treasury
BENEFITS UP
MORTGAGE COSTS DOWN

2008
JAN MAR MAY JUL SEP NOV JAN MAR JUL SEP NOV
2009
8%
6%
4%
2%
0%
MAY
BUT... Interest Rates Annualise
JAN
10Source: Bank of England
Average Mortgage Interest Rate

Taxincreases?
Spendingcuts?
THE CHALLENGE... Gov’t Debt
Joblosses?

Quarterly Retail Full Price LFLs*
Q1 Q2 Q3 Q4
-2.4%
-0.2% -0.3%
+ 4.0%
Tougher comparisons going forward
* Excluding VAT

LFL Retail (VAT inc)*
Total Retail (VAT inc)
Directory (VAT inc)
Next Sales Outlook for 1st Half
- 1.5% to + 1.5%
+ 1.5% to + 4.5%
+ 2.0% to + 5.0%
* Like for like sales excluding Direct sales

Next Sales Outlook for 1st Half
LFL Retail (VAT ex)*
Total Retail (VAT ex)
Directory (VAT ex)
- 1.5% to + 1.5%
+ 1.5% to + 4.5%
+ 2.0% to + 5.0%
- 2.5% to + 0.5%
+0.5% to + 3.5%
+ 1.0% to + 4.0%
* Like for like sales excluding Direct sales

Annual Sales and Profit Scenario (NOT forecast!)
Annual Directory (VAT ex) Flat (52 vs 53)
Annual LFL Retail (VAT ex)
Annual Total Retail (VAT ex)
- 2%
Flat (52 vs 53)
IF.....
circa + 1%~ £540mTHEN… Group profit +7%

Year End Statement
• New product development
• Profitable new space
• Increase UK Directory sales
• NextDirect.com
Strong cash generation
• 5% EPS growth (buybacks)
• 10%+ dividend increase
Better designGrowth opportunities
Good cost control

Year End – In Summary
In summary
Continuedprogress
expected inan uncertain environment