nfr 22 - soest · 2017-12-21 · nfr-22 . national report update on tuna fisheries of taiwan in the...
TRANSCRIPT

National Report: Update on tuna fisheries of Taiwan in the Pacific Region
Shu-Hui Wang1, Shyh-Bin Wang1, and Chin-Lau Kuo2
1 Overseas Fisheries Development Council of the Republic of China
2 Fisheries Administration
Council of Agriculture, R.O.C.
SCTB15 Working Paper
NFR−22
National Report
Update on Tuna Fisheries of Taiwan
in the Pacific Region
Shu-Hui Wang and Shyh-Bin Wang
Overseas Fisheries Development Council of the Republic of China
and
Chin-Lau Kuo
Fisheries Administration,
Council of Agriculture, R.O.C.
July, 2002
This paper is prepared for the 15th meeting of the Standing Committee on Tuna and Billfish (SCTB) held in Hawaii, July 22-27, 2002. Document not to be cited without permission of the authors.

1
Introduction
The Pacific Ocean is one of the earliest fishing grounds exploited by
Taiwanese tuna fishery. Currently, there are three types of tuna fisheries
operating in this region: the frozen tuna longline (FTLL) fishery, the
distant-water purse seine (DWPS) fishery and the fresh and/or chilled tuna
longline (CTLL) fishery based upon how the catches were stored (chilled or
frozen), or gear types and the vessel sizes.
The frozen tuna longline (FTLL) fishery
The FTLL vessels refer to those vessels mostly greater than 100 GRT
and operating in distant waters of foreign EEZ and high seas. Number of
FTLL vessel in the Pacific Ocean in 2001 was estimated to be about 100.
Most of these vessels historically targeted on albacore for canning, but in
recent years, some vessels also targeted on bigeye and yellowfin tunas for
Japanese frozen sashimi market.
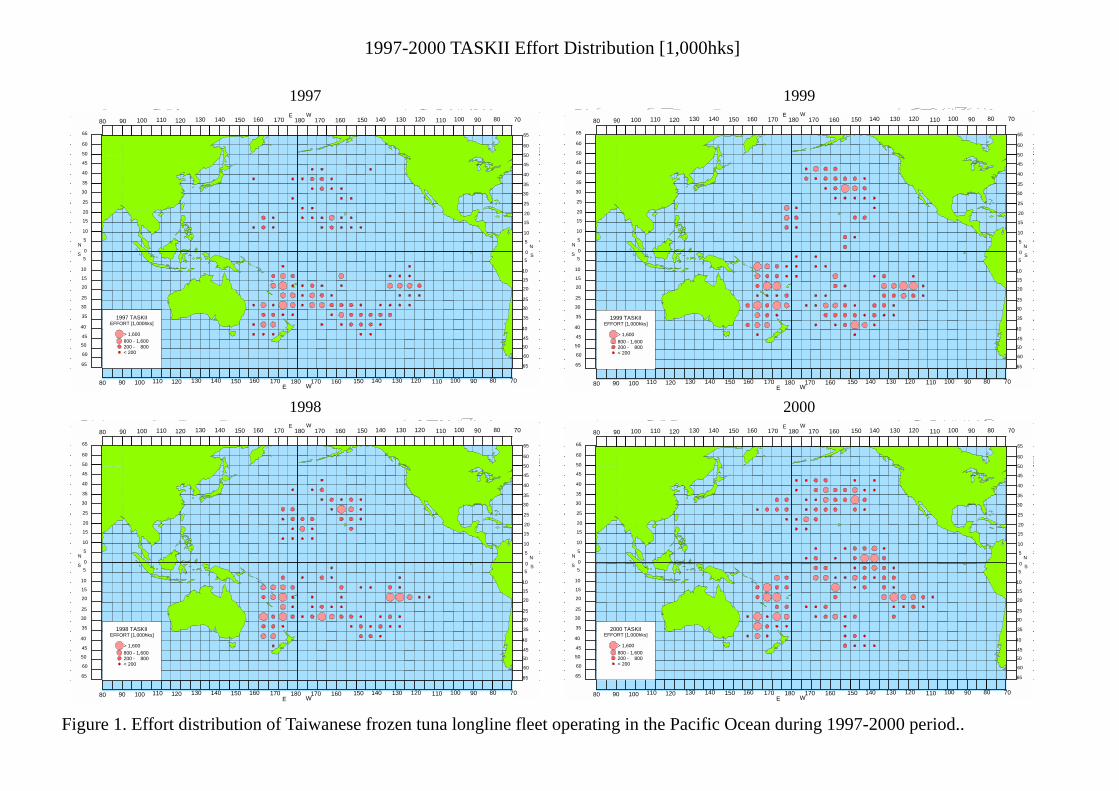
The major fishing grounds of FTLL vessels were located in the South
Pacific and the tropical region (Figure 1). However, in recent years, the
North Pacific has become increasingly important as some of the vessels start
to target on northern albacore on seasonal basis.
Table 1 shows the catch estimate of major tuna and tuna-like species
caught in FTLL fishery during 1997-2001 period. The most dominant
species caught was albacore, accounting for about 73% of the total catch

2
during this period (Figure 2). Bigeye and yellowfin tunas together accounted
for another 20%. Catch of other species was only 6% (in terms of quantity).
The average catch in recent 5 years (1997-2001) was about 19,000 mt for
albacore, 3,000 mt for bigeye, and 2,000 mt for yellowfin tuna. There was
an obvious increase in catch of tropical tunas in 2001, presumably resulting
from an increase in number of vessels equipped with super-cold freezer
(i.e. –50 ~ -60℃) and targeting on bigeye and yellowfin tunas in the region.
The distant water purse seine fishery
Purse seine fishery was introduced into Taiwan in 1982. Since then, it
has become one of the major fishing gears used in Taiwanese tuna fishery.
Total number of purse seine vessel in 2001 is 41, of which 18 are greater
than 1000 GRT and 23 between 500 and 1000 GRT.
Total catch and major species caught in this fishery during 1997-2001
period were shown in Table 2. The most dominant species remained to be
skipjack, accounting for about 77% of the total catch (Figure 3). Yellowfin
tuna was the 2nd dominant species accounting for another 22%, and the
bigeye tuna only accounted for 1% of the total catch. Average catch during
this period was about 169,000 mt for skipjack, 48,000 mt for yellowfin and
1,600 mt for bigeye tuna. In addition, catch of skipjack in 2001 decreased by
about 6% (12,000 mt), but catch of yellowfin and bigeye tunas increased by
about 19% (7,274 mt) and 20% (384 mt), respectively. Such a change may
have been related to differences in major fishing grounds located.

3
The major fishing grounds of DWPS fishery varied dynamically in this
period (Figure 4). After 1998, fishing grounds started to move westward and
mainly located in the western and central part of the tropical Pacific
(135-175oE, 8oN-8oS) with sporadic efforts concentrated in areas east of
180oE. The fishing grounds in 2000 essentially located only in areas west of
180oE. However, in 2001, fishing grounds extended to as far as 166oW due
possibly to the impact of El Niño.
Figure 5 shows the comparisons of CPUE (mt/set) and total catch
among fishing areas. The CPUE, in general, fluctuated between 20 and 40
mt/set among fishing areas from 1997 to 2001. The major catches were in
PNG, high sea, FSM and Kiribati. The catch in these areas accounts for
about 90% of the total catch. There seems no consistent pattern between
CPUE and regional catch by years. In 1997, the highest CPUE was in
Kiribati region and the lowest in FSM region while the highest catch was in
PNG waters and the lowest in Solomon Islands. In 1998, CPUE were similar
in all areas while the highest catch was found in the high sea region. In 1999,
high catch were found in both FSM and high sea areas while the highest
CPUE was in the PNG waters. For 2000, the highest CPUE was found in the
Solomon Islands, Kiribati and Tuvalu, while high catch were found in PNG,
FSM and high seas. In 2001, the highest CPUE was found in PNG region
and the lowest in Tuvalu region while the highest catch was located in
Kiribati waters and the lowest in Tuvalu region.
In terms of “school types”, most of the catches in DWPS fishery were
from “free” and “associated” schools (Figure 6(A)). This pattern is

4
consistent for all years between 1997 and 2001. The average CPUE for these
two types were between 21 and 48 mt/set (Figure 6(B)). The highest CPUE
although was found in “feeding school” in most years (except for 2001), this
type of school was, in general, difficult to find, as a result, the percentage of
fish caught in this school only accounted for a small percentage of the
annual catch. The highest CPUE found in 2001 for “unspecified” school was
from one record only.
The fresh/chilled tuna longline fishery
The CTLL vessel include those vessels operate in coastal and offshore
waters of Taiwan and is in general, smaller than 100 GRT. However, in
recent decades, the fishing pattern of this fleet has been changed. Some of
the vessels are now operating not only in the coastal and offshore regions
but also in distant waters (or EEZ of foreign countries) depending upon size
and facilities equipped.
Number of registered CTLL vessels ( <100 mt) was similar during
1997-2001 period, and estimated to be about 1700 (included vessels
operated in both the Pacific and the Indian Oceans). Total catch of tuna and
tuna-like species landed in Taiwan by this fleet was stable and averaged at
about 47,000 mt during 1997-2001 period (Table 3). The dominant species
caught included yellowfin tuna, bigeye tuna, swordfish, billfishes, and other
tuna species (Figure 7).
In addition to catches landed at domestic ports, averaged catches of
5
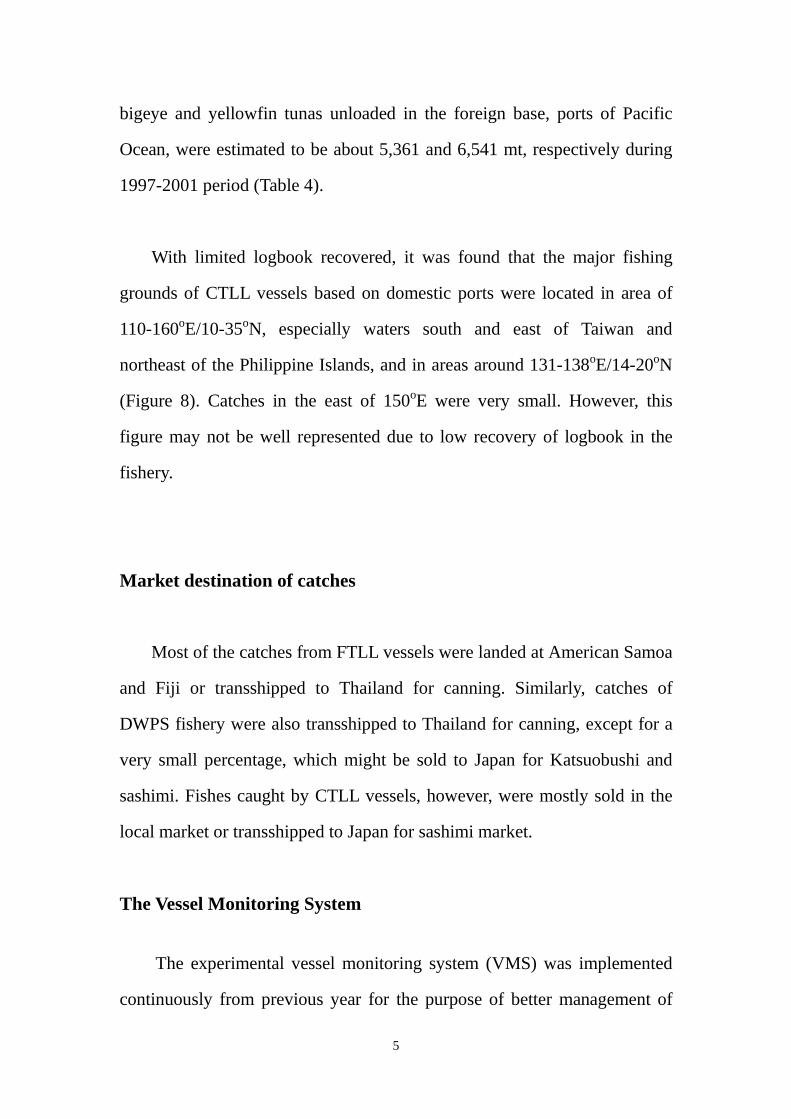
bigeye and yellowfin tunas unloaded in the foreign base, ports of Pacific
Ocean, were estimated to be about 5,361 and 6,541 mt, respectively during
1997-2001 period (Table 4).
With limited logbook recovered, it was found that the major fishing
grounds of CTLL vessels based on domestic ports were located in area of
110-160oE/10-35oN, especially waters south and east of Taiwan and
northeast of the Philippine Islands, and in areas around 131-138oE/14-20oN
(Figure 8). Catches in the east of 150oE were very small. However, this
figure may not be well represented due to low recovery of logbook in the
fishery.
Market destination of catches
Most of the catches from FTLL vessels were landed at American Samoa
and Fiji or transshipped to Thailand for canning. Similarly, catches of
DWPS fishery were also transshipped to Thailand for canning, except for a
very small percentage, which might be sold to Japan for Katsuobushi and
sashimi. Fishes caught by CTLL vessels, however, were mostly sold in the
local market or transshipped to Japan for sashimi market.
The Vessel Monitoring System
The experimental vessel monitoring system (VMS) was implemented
continuously from previous year for the purpose of better management of

6
our distant water fishing vessels. The government has encouraged FTLL
vessels to install the VMS through an incentive program since July 1996.
Currently, more than 56 longline and essentially all purse seine vessels
operating in the Pacific have installed such a system. It is our goal that all
distant water vessels operating in the region will eventually be equipped
with such a system.
The Observer Program
In addition to the vessel monitoring system, for purposes of improving
quality of catch statistics and understanding bycatch related issues of our
distant water fisheries, and in line with the international trend on
management of highly migratory species, the government has launched an
experimental observer program in 2001. Observations covered by this
program include catch statistics, bycatch, discards, sharks, seabird, sea turtle,
and marine mammals and some biological information, such as length and
otolith,… etc. for major tuna species. In 2002, the program has expanded to
include 6 observers in three major Oceans. It is expected that data obtained
from this program will be used for better understanding of operation
situation of our distant water fisheries operating in the region.
The Management Efforts Implemented by Government
In order to be in accordance with the international trend on
management of marine resources, our government has initiated a program
on management and/or conservation of some marine species, such as green

7
turtle (Chelonia mydas) and whale shark (Rhincodon typus). The satellite
telemetry technique has been introduced to study the migration patterns of
green turtle and whale shark. Also, a sanctuary area for green turtle was
established in Pen-Hu Island (southwest of Taiwan) to protect their
spawning and nursery ground.
In 2002, a shark conference was held in Taiwan to discuss the
conservation and utilization of shark resources in the Ocean. A total
allowable catch (TAC) of 80 individuals per year for whale shark also has
been set on July 1 of 2002. In addition, two whale sharks have been tagged
successfully on April 2002 to study their migration behavior. Current
information indicated that whale shark migrate between south eastern
Taiwan and Philippines, and mostly stayed in water columns where
temperature were between 24℃ and 28℃.
Except for the whale shark, stock assessment on certain shark species
such as bigeye thresher shark (Alopias superciliosus) also was conducted.
1997-2000 TASKII Effort Distribution [1,000hks]
1997
5
N0
5
S
30
35
40
45
10
15
20
25
65
50
60
25
30
35
20
10
15
50
60
65
40
45
1301201101009080
1401301201101009080
W150 170160140
E
150 180E
170160
160180 170 150 140
140170 160 150W
90130 120 110 100 80 70
90130 120 110 100 80 70
50
60
65
45
40
20
25
30
35
30
20
25
35
40
45
50
60
65
0N
S5
10
15
15
5
10
1997 TASKIIEFFORT [1,000hks]
> 1,600800 - 1,600200 - 800< 200
1999
5
N0
5
S
30
35
40
45
10
15
20
25
65
50
60
25
30
35
20
10
15
50
60
65
40
45
1301201101009080
1401301201101009080
W150 170160140
E
150 180E
170160
160180 170 150 140
140170 160 150W
90130 120 110 100 80 70
90130 120 110 100 80 70
50
60
65
45
40
20
25
30
35
30
20
25
35
40
45
50
60
65
0N
S5
10
15
15
5
10
1999 TASKIIEFFORT [1,000hks]
> 1,600800 - 1,600200 - 800< 200
1998
5
N0
5
S
30
35
40
45
10
15
20
25
65
50
60
25
30
35
20
10
15
50
60
65
40
45
1301201101009080
1401301201101009080
W150 170160140
E
150 180E
170160
160180 170 150 140
140170 160 150W
90130 120 110 100 80 70
90130 120 110 100 80 70
50
60
65
45
40
20
25
30
35
30
20
25
35
40
45
50
60
65
0N
S5
10
15
15
5
10
1998 TASKIIEFFORT [1,000hks]
> 1,600800 - 1,600200 - 800< 200
2000
5
N0
5
S
30
35
40
45
10
15
20
25
65
50
60
25
30
35
20
10
15
50
60
65
40
45
1301201101009080
1401301201101009080
W150 170160140 E
150 180E
170160
160180 170 150 140
140170 160 150W
90130 120 110 100 80 70
90130 120 110 100 80 70
50
60
65
45
40
20
25
30
35
30
20
25
35
40
45
50
60
65
0N
S5
10
15
15
5
10
2000 TASKIIEFFORT [1,000hks]
> 1,600800 - 1,600200 - 800< 200
Figure 1. Effort distribution of Taiwanese frozen tuna longline fleet operating in the Pacific Ocean during 1997-2000 period..


Year\Species ALB BET YFT SWO BILL SKJ TOTAL1997 19,524 726 1,108 182 322 266 22,1281998 18,416 1,395 904 228 585 499 22,0271999 18,245 1,993 1,181 315 503 779 23,0162000 20,981 2,876 2,105 362 1,415 274 28,0132001* 16,224 8,070 4,814 2,237 880 311 32,536
* a preliminary result
Fig. 2. Mean catch percentage of major tuna and tuna-like species caught byTaiwanese frozen tuna longline fishery in the Pacific region during 1997-2001period.
Table 1. Catch (in mt, round weight) statistics of major tuna and tuna-likespecies caught in frozen tuna longline fishery in the Pacific region during1997-2001 period.
3%
8%
12%73%
3% 2%ALB
BET
YFT
SWO
BILL
SKJ

Species\Year 1997 1998 1999 2000 2001*
SKJ 116,073 193,728 160,453 194,499 182,531YFT 50,722 64,764 41,905 38,579 45,853BET 401 201 3,372 1,900 2,284Total 167,196 258,693 205,730 234,978 230,668
* a preliminary result (Note: catch of bigeye in 1997 and 1998 has not been adjusted)
Fig. 3. Mean catch percentage of major tuna and tuna-like species caught by Taiwanese distant water purse seine fishery in the Pacific region during 1997-2001 period.
Table 2. Catch (in mt, round weight) statistics of major tuna species caught indistant water purse seine fishery in the Pacific region during 1997-2001 period.
77%
22%
1%
SKJ
YFT
BET

8
12
12
4
8
135
16
N
0
S
4
135 140 145
140 145
150 155 160
150 155 160 165 170 175 175E 180 W
170165 E 180 W175 175 170 165 160 155
155170 165 160
10°
10°
5°
N0°S
5°
1998 Effort (set)> 5020 - 50
5 - 20< 5
8
12
12
4
8
135
16
N
0
S
4
135 140 145
140 145
150 155 160
150 155 160 165 170 175 175E 180 W
170165 E 180 W175 175 170 165 160 155
155170 165 160
10°
10°
5°
N0°S
5°
2000 Effort (set)> 5020 - 50
5 - 20< 5
8
12
12
4
8
135
16
N
0
S
4
135 140 145
140 145
150 155 160
150 155 160 165 170 175 175E 180 W
170165 E 180 W175 175 170 165 160 155
155170 165 160
10°
10°
5°
N0°S
5°
1999 Effort (set)
> 5020 - 505 - 20
< 5
8
12
12
4
8
135
16
N
0
S
4
135 140 145
140 145
150 155 160
150 155 160 165 170 175 175E 180 W
170165 E 180 W175 175 170 165 160 155
155170 165 160
10°
10°
5°
N0°S
5°
2001 Effort (set)> 5020 - 50
5 - 20< 5
1998
2000
1999
2001
Figure 4. Effort distribution of Taiwanese distant water purse seine fleet operating in the Pacific Ocean in 1998, 1999, 2000, and 2001.
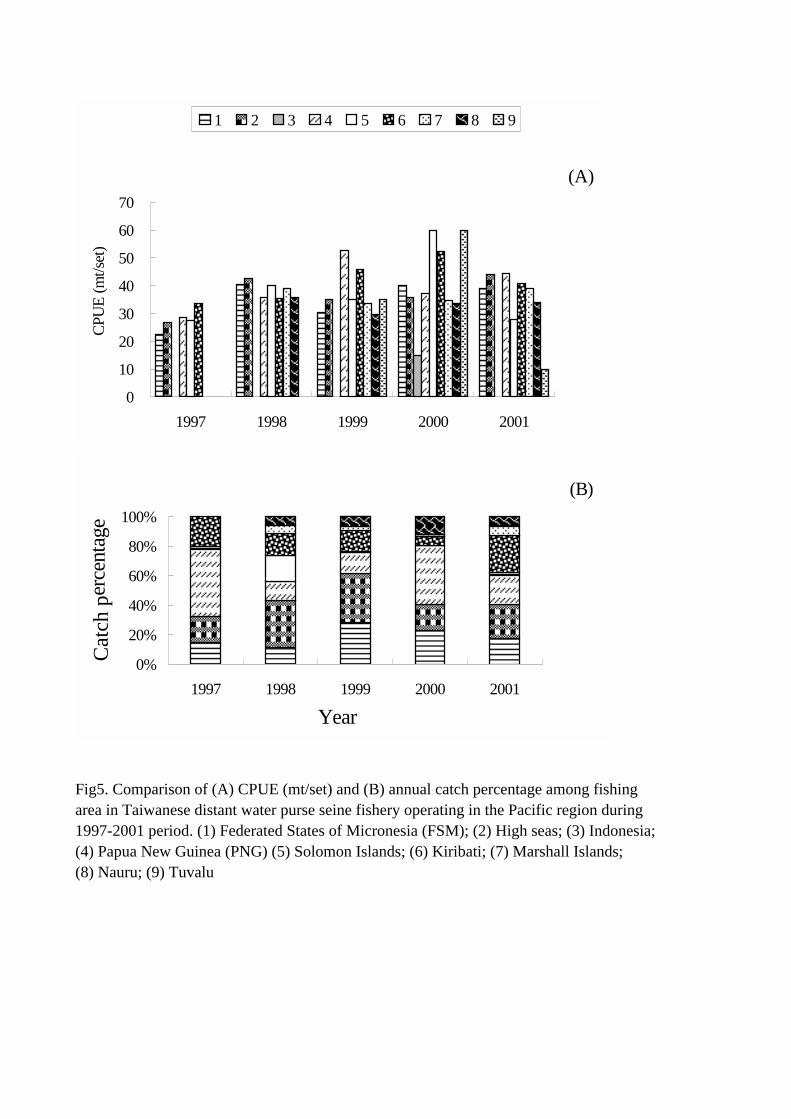
Fig5. Comparison of (A) CPUE (mt/set) and (B) annual catch percentage among fishing area in Taiwanese distant water purse seine fishery operating in the Pacific region during 1997-2001 period. (1) Federated States of Micronesia (FSM); (2) High seas; (3) Indonesia;(4) Papua New Guinea (PNG) (5) Solomon Islands; (6) Kiribati; (7) Marshall Islands;(8) Nauru; (9) Tuvalu
(A)
0
10
20
30
40
50
60
70
1997 1998 1999 2000 2001
CPU
E (
mt/
set)
1 2 3 4 5 6 7 8 9
(B)
0%
20%
40%
60%
80%
100%
1997 1998 1999 2000 2001
Year
Cat
ch p
erce
ntag
e
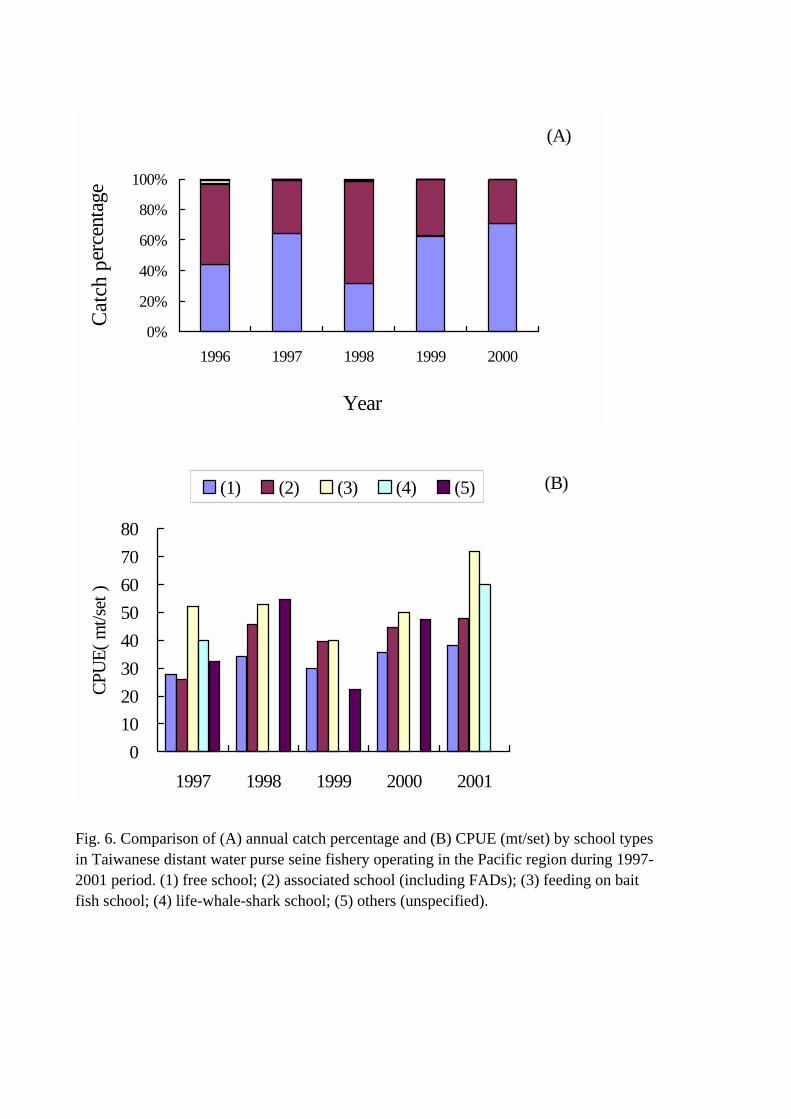
Fig. 6. Comparison of (A) annual catch percentage and (B) CPUE (mt/set) by school typesin Taiwanese distant water purse seine fishery operating in the Pacific region during 1997-2001 period. (1) free school; (2) associated school (including FADs); (3) feeding on baitfish school; (4) life-whale-shark school; (5) others (unspecified).
(B)
0
10
20
30
40
50
60
70
80
1997 1998 1999 2000 2001
CP
UE
( m
t/se
t )
(1) (2) (3) (4) (5)
(A)
0%
20%
40%
60%
80%
100%
1996 1997 1998 1999 2000
Year
Cat
ch p
erce
ntag
e

Year\Species ALB BET YFT SWO BILL SKJ TUN Total1997 973 3,772 9,994 2,604 16,771 3,494 8,576 46,183 1998 613 3,669 9,456 2,450 16,524 2,991 10,683 46,385 1999 382 2,673 10,347 2,720 14,486 2,663 14,355 47,626 2000 944 2,092 8,376 3,147 16,456 4,046 11,326 46,387 2001* 832 3,292 14,080 3,694 15,892 4,648 7,631 50,069
TUN: other tuna and tuna-like species.
Fig. 7. Mean catch percentage of major tuna and tuna-like species caught by Taiwanese fresh/chilled tuna longline fishery in the Pacific region during 1997-2001 period.
Table 3. Catch (in mt, round weight) of tuna and tuna-like species in the fresh/chilled tunalongline fishery landed in domestic ports of Taiwan (including vessels operated in distantwaters) during 1997-2001 period.
* a preliminary result
34%
22%
7%2%
6%
8%
22%ALB
BET
YFT
SWO
BILL
SKJ
TUN

Table 4. Estimated catch (in mt, round weight) of yellowfin tuna and bigeye tuna in Taiwanese offshore longline fishery based on foreignports in the Pacific region during 1997-2001 period.
Species\Year 1997 1998 1999 2000 2001* MeanBET 5,862 5,035 5,467 4,441 6,001 5,361YFT 7,032 4,948 6,578 7,042 7,106 6,541Sum 12,893 9,983 12,045 11,484 13,107 11,902
* a preliminary result
Figure 8. Effort distribution of domestic longline fleet operated in the Pacific Oceanduring 1998-2001 period. A, B and C represent for high, medium and low effort area, respectively.