ngfr gas price assessment - aemo · undertake sensitivity analysis in relation to the 2016 aemo...
TRANSCRIPT

Core Energy Group © 2016 October 2016 i
NGFR Gas Price Assessment
October 2016
Final Report

NGFR Gas Price Assessment
Core Energy Group © 2016 October 2016 2
Table of Contents
1. Introduction ......................................................................................................................................................... 4
2. Introduction and Methodology ............................................................................................................................ 5
3. NGFR Gas Demand Scenarios .......................................................................................................................... 6
4. Gas Price Drivers ............................................................................................................................................... 6
5. Gas Demand/Supply Balance ............................................................................................................................ 8
6. LNG Price and Cost Scenarios ........................................................................................................................... 9
7. Competition ...................................................................................................................................................... 11
8. Gas Price Scenarios ......................................................................................................................................... 13
A1. AEMO 2016 NGFR Forecasting and Planning Scenarios ....................................................................................... 15
Terms of Use ................................................................................................................................................................. 18

NGFR Gas Price Assessment
Core Energy Group © 2016 October 2016 3
Glossary
AEMO Australian Energy Market Operator
AUD Australian Dollar
AUD/t Australian Dollar per tonne
CE Core Energy Group
CSG Coal Seam Gas
GPG Gas Powered Generators
LNG Liquefied Natural Gas
NGFR National Gas Forecasting Report
PV Photovoltaic Cell
RET Renewable Energy Target
R&C Residential & Commercial
3
NGFR Gas Price Assessment
Core Energy Group © 2016 October 2016 4
1. Introduction
1.1. Introduction
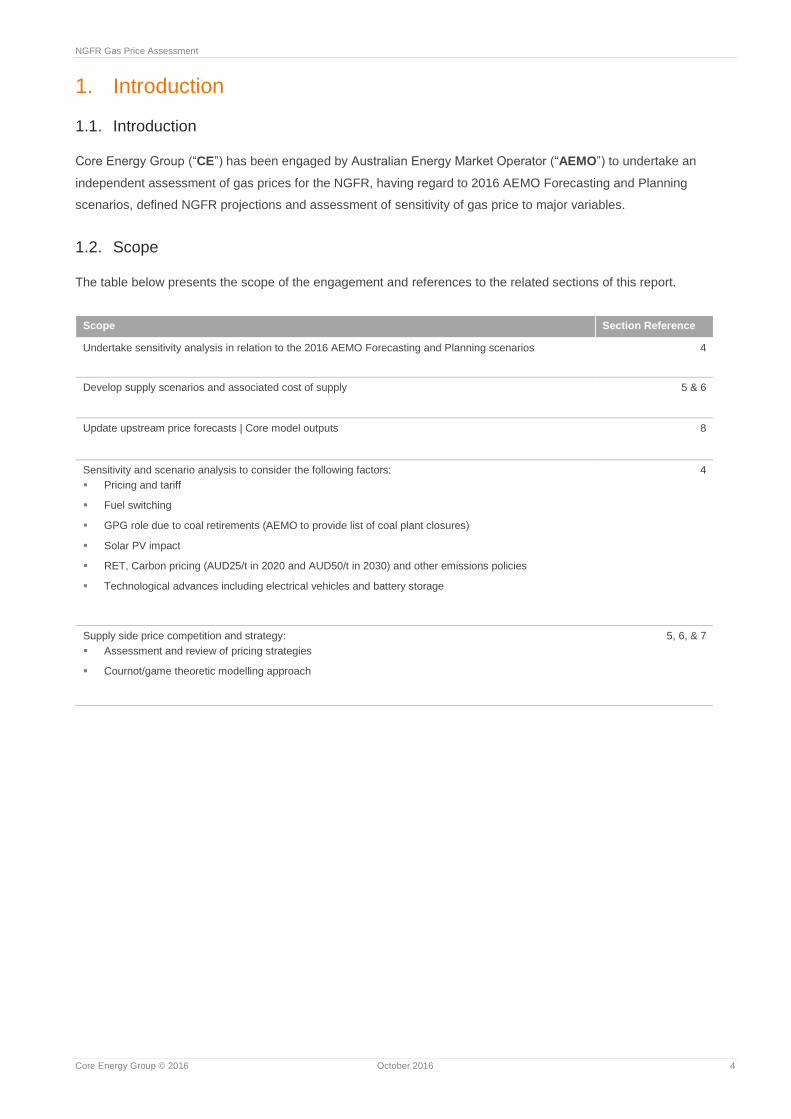
Core Energy Group (“CE”) has been engaged by Australian Energy Market Operator (“AEMO”) to undertake an
independent assessment of gas prices for the NGFR, having regard to 2016 AEMO Forecasting and Planning
scenarios, defined NGFR projections and assessment of sensitivity of gas price to major variables.
1.2. Scope
The table below presents the scope of the engagement and references to the related sections of this report.
Scope Section Reference
Undertake sensitivity analysis in relation to the 2016 AEMO Forecasting and Planning scenarios 4
Develop supply scenarios and associated cost of supply 5 & 6
Update upstream price forecasts | Core model outputs 8
Sensitivity and scenario analysis to consider the following factors:
Pricing and tariff
Fuel switching
GPG role due to coal retirements (AEMO to provide list of coal plant closures)
Solar PV impact
RET, Carbon pricing (AUD25/t in 2020 and AUD50/t in 2030) and other emissions policies
Technological advances including electrical vehicles and battery storage
4
Supply side price competition and strategy:
Assessment and review of pricing strategies
Cournot/game theoretic modelling approach
5, 6, & 7

NGFR Gas Price Assessment
Core Energy Group © 2016 October 2016 5
2. Introduction and Methodology
2.1. Introduction
CE has derived future gas price scenarios having regard to:
AEMO 2016 NGFR forecasting and planning scenarios, (see Section A.1)
AEMO 2016 NGFR demand forecasts - including Tariff V, Tariff D, GPG and LNG
CE assessment of major price drivers
CE assessment of the future pricing strategy of EA producers – applying Cournot and other game theoretic principles
2.2. Approach
The following figure outlines the framework that CE has adopted to derive the gas price scenarios:
Figure 2.1 Framework | Gas Price Scenario Review
CORE has considered the following cost elements to derive scenarios of the delivered price:
Wholesale contract market price
> Price at defined delivery point as extracted from CE Energyview system.
Transmission cost
> Estimated transmission pipeline tariff as extracted from CE Energyview system.
Peak supply cost
> Estimated cost of peak supply service as extracted from CE Energyview system.
It should be noted that this price represents the wholesale cost of gas to the retailer or GPG owner, not the marginal
cost or opportunity cost, which may influence bidding behaviour. Costs are expressed in 2016 real terms unless
stated otherwise.

NGFR Gas Price Assessment
Core Energy Group © 2016 October 2016 6
3. NGFR Gas Demand Scenarios
CE has considered AEMO’s 2016 NGFR forecasting and planning scenarios as presented in Attachment A.1 and AEMO’s
2016 NGFR future demand scenarios (including Tariff V, Tariff D, GPG and LNG), as a basis for deriving related gas price
scenarios.
4. Gas Price Drivers
CE has analysed all major drivers of demand and has determined that movements in the drivers of LNG and GPG
demand are expected to have the most material impact on gas price.
The sensitivity of gas prices to the drivers of the LNG and GPG demand segment are presented in the following table.
Table 4.1 Gas Price Sensitivity
Drivers Gas Price Sensitivity
LNG Demand
Oil Prices/Exchange
Rate/Gas Prices
Eastern Australian domestic gas prices are influenced by LNG prices, which are linked to global oil prices and exchange rates
In simple terms LNG prices are expected to set the upper limit of gas prices and the cost of gas extraction will set the lower limit. However high LNG prices can give rise to cost inflation which lifts the lower cost/price limit.
The following diagram presents an illustration of the interaction between demand, cost and price forces.
Cost Competitiveness of
Qld LNG
The cost competitiveness of Qld LNG projects relative to foreign LNG projects is expected to have a material influence of ultimate demand e.g. low foreign prices and available supply could reduce demand for Queensland CSG if supply contracts are flexible or if buyers and sellers agree new terms. Conversely, if Qld LNG cost is lower than that of competing LNG export nations, spare capacity of the LNG projects will be used to fulfil contracts and fill spot cargoes and therefore LNG demand in EA will be higher.
LNG Growth Outlook
Queensland LNG demand growth is expected to be limited beyond the ramp-up period, until the end of the projects’ initial contract period to ~2035.
Key uncertainties in LNG demand include:
potential for reduction in LNG supply due to exercise of flexible contract terms or renegotiation between buyers and seller
recontracting risk around 2035 when existing contracts mature
potential for a seventh LNG train to come online, depending on global demand/supply balance and cost competitiveness of Qld LNG projects.
The level of LNG demand has the potential to significantly impact the demand/supply balance and price of gas in Eastern Australia.

NGFR Gas Price Assessment
Core Energy Group © 2016 October 2016 7
Drivers Gas Price Sensitivity
Low LNG demand could make gas available to domestic market at lower prices
Strong LNG demand could result in higher demand for labour and services, placing upward pressure on costs, resulting in higher prices required to cover production costs. Further as high performance reserves are increasingly depleted, the development of low productivity acreage to fulfil LNG demand could result in higher upstream gas costs and prices.
GPG Demand
Electricity Wholesale
Price
The retirement of large scale coal generators is likely to drive an increase in average wholesale electricity prices as cheap coal-fired electricity supply will be removed from the National Electricity Market (“NEM”)
As wholesale electricity prices increase, GPG is likely to be more competitive in the intermediate to peak market, increasing gas consumption.
Higher gas consumption could result in greater competitive tension in the gas market and higher gas prices.
Electricity
Demand/Technology
Cost and Uptake Curve
Uncertainty regarding the future growth of solar PV and battery storage translates to uncertainty regarding future GPG demand – volume and peak. High penetration in solar PV and battery storage could potentially reduce peak demand for GPG.
A lower gas consumption could result in less competitive tension in the gas market and lower gas prices
LREC/SRES/Climate
Policy to 2030
The growth in renewable capacity in the NEM has resulted in intermittent supply challenges. GPG is often required to fulfil demand when renewable capacity is unavailable.
The expected increase in penetration of renewables to 2030 is likely to contribute to growth in intermittent supply, with GPG playing an increasingly important role to address energy security.
Material retirement of coal could give rise to increased use of gas for intermediate generation capacity which could place some upward pressure on prices in a limited supply scenario.
Higher gas consumption due to a combination of renewable penetration and coal retirements could result in greater competitive tension in the gas market and higher gas prices.

NGFR Gas Price Assessment
Core Energy Group © 2016 October 2016 8
5. Gas Demand/Supply Balance
5.1. Demand/supply scenarios
To assess the extent of future demand/supply tension and implications for gas price, CE derived supply scenarios to
meet the three NGFR demand scenarios, having regard to available 2P reserves, future field deliverability and relative
production costs. The results are summarised in Figures 5.1 to 5.3.
Figure 5.1 Neutral Case | Demand/Supply | PJ
Figure 5.2 Weak Case | Demand/Supply | PJ
Figure 5.3 Strong Case | Demand/Supply | PJ
CE has made the following assumptions in relation to gas supply:
Otway, Cooper and Bass projects supply southern markets until 2P reserves deplete in 2021/2022
Gippsland is a major source of supply in southern markets until its 2P reserves deplete around 2026/2027
Cooper Basin is supplied by Beach and Origin to southern markets until 2024 to meet domestic contracts and Santos is
assumed to contribute to the GLNG Horizon contract beginning in 2016 and supplying for 15 years.
Queensland CSG meets some domestic contracts and LNG to 2035.
-
500
1,000
1,500
2,000
2,500
2016 2019 2022 2025 2028 2031 2034
High Cost | Qld CSG & OtherMedium Cost | Qld CSGMedium Cost | Conventional SupplyLow Cost | Qld CSGLow Cost | Conventional Supply
-
500
1,000
1,500
2,000
2016 2019 2022 2025 2028 2031 2034
High Cost | Qld CSG & OtherMedium Cost | Qld CSGMedium Cost | Conventional SupplyLow Cost | Qld CSGLow Cost | Conventional Supply
-
500
1,000
1,500
2,000
2,500
3,000
2016 2019 2022 2025 2028 2031 2034
High Cost | Qld CSG & OtherMedium Cost | Qld CSGMedium Cost | Conventional SupplyLow Cost | Qld CSGLow Cost | Conventional Supply

NGFR Gas Price Assessment
Core Energy Group © 2016 October 2016 9
6. LNG Price and Cost Scenarios
CE has derived estimates of cost and price under each AEMO NGFR scenario:
Costs have been derived utilising a cash flow model, having regard to projected production, capital and operating
expenditures, after royalties and tax
LNG linked gas prices have been derived based on AEMO oil and exchange rate assumptions
Further detail regarding LNG price linkage follows:
1. Core has made the following assumptions to derive gas prices:
> CBJV and Otway contract prices undergo price review in 2017 and GBJV in 2018. Gas prices are assumed to be
oil-linked thereafter.
> The contract prices are assumed to comprise of 40% fixed cost-link component and 60% floating oil-price linked
component.
2. Fixed Component
> Core has assumed a fixed price of AUD5.00/GJ for GBJV and AUD6.00/GJ for CBJV.
3. Floating Component
> Core has used the following Brent Oil price scenarios to derive the gas price projections. The Brent Oil scenarios
were provided by AEMO as part of the engagement scope.
Table 6.1 Brent Oil Price forecast | USD/bbl
Year Weak Neutral Strong
Brent Oil 30 60 90
Source: AEMO, 2016
˃ AUD to USD exchange rate under all scenarios are summarised below
Table 6.2 AUD to USD Exchange Rate
Year Weak Neutral Strong
FOREX 0.65 0.75 0.95
˃ Gas price as a percentage of oil price, see Table 3.2
Table 6.3 Gas price as a percentage of oil price
Year Weak Neutral Strong
GBJV/Otway 6.5% 7.0% 8.0%
CBJV 6.0% 6.5% 7.0%
4. Contract Prices
> Contract prices are assumed to be the higher of cost based pricing and LNG linked pricing
> The LNG linked pricing of GBJV and CBJV gas based on historical pricing structures are presented in the table
below:
NGFR Gas Price Assessment
Core Energy Group © 2016 October 2016 10
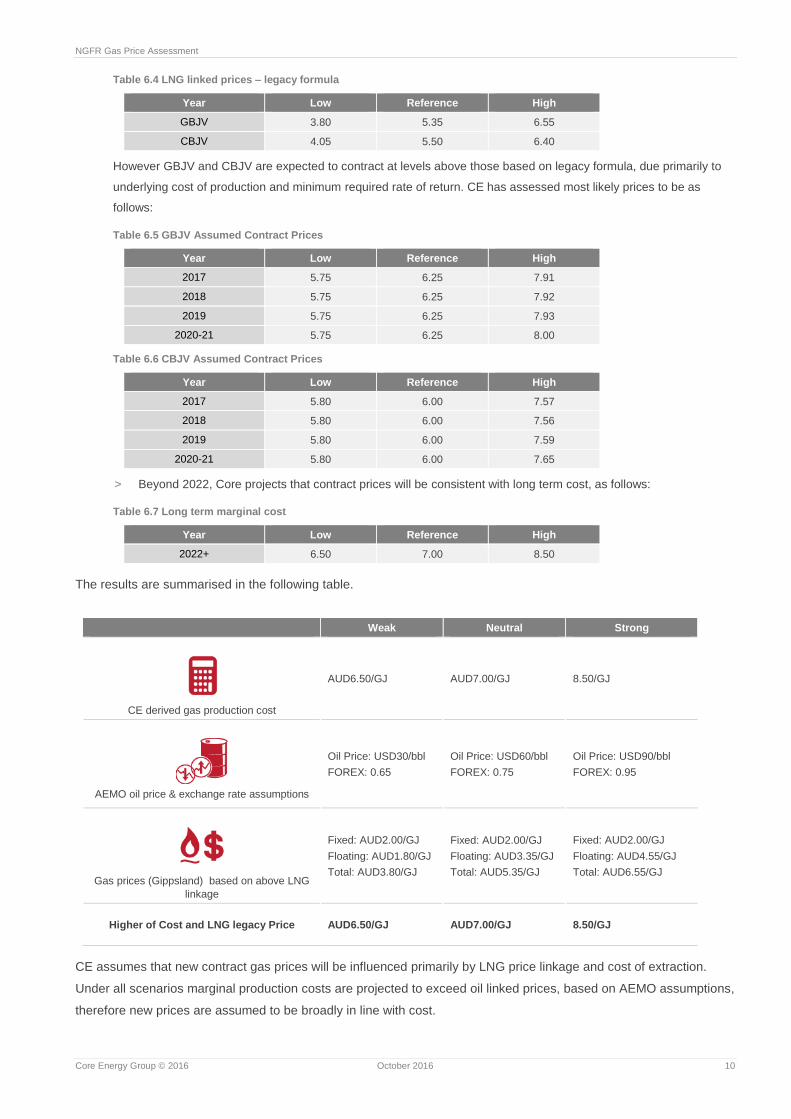
Table 6.4 LNG linked prices – legacy formula
Year Low Reference High
GBJV 3.80 5.35 6.55
CBJV 4.05 5.50 6.40
However GBJV and CBJV are expected to contract at levels above those based on legacy formula, due primarily to
underlying cost of production and minimum required rate of return. CE has assessed most likely prices to be as
follows:
Table 6.5 GBJV Assumed Contract Prices
Year Low Reference High
2017 5.75 6.25 7.91
2018 5.75 6.25 7.92
2019 5.75 6.25 7.93
2020-21 5.75 6.25 8.00
Table 6.6 CBJV Assumed Contract Prices
Year Low Reference High
2017 5.80 6.00 7.57
2018 5.80 6.00 7.56
2019 5.80 6.00 7.59
2020-21 5.80 6.00 7.65
> Beyond 2022, Core projects that contract prices will be consistent with long term cost, as follows:
Table 6.7 Long term marginal cost
Year Low Reference High
2022+ 6.50 7.00 8.50
The results are summarised in the following table.
Weak Neutral Strong
CE derived gas production cost
AUD6.50/GJ AUD7.00/GJ 8.50/GJ
AEMO oil price & exchange rate assumptions
Oil Price: USD30/bbl
FOREX: 0.65
Oil Price: USD60/bbl
FOREX: 0.75
Oil Price: USD90/bbl
FOREX: 0.95
Gas prices (Gippsland) based on above LNG
linkage
Fixed: AUD2.00/GJ
Floating: AUD1.80/GJ
Total: AUD3.80/GJ
Fixed: AUD2.00/GJ
Floating: AUD3.35/GJ
Total: AUD5.35/GJ
Fixed: AUD2.00/GJ
Floating: AUD4.55/GJ
Total: AUD6.55/GJ
Higher of Cost and LNG legacy Price AUD6.50/GJ AUD7.00/GJ 8.50/GJ
CE assumes that new contract gas prices will be influenced primarily by LNG price linkage and cost of extraction.
Under all scenarios marginal production costs are projected to exceed oil linked prices, based on AEMO assumptions,
therefore new prices are assumed to be broadly in line with cost.

NGFR Gas Price Assessment
Core Energy Group © 2016 October 2016 11
7. Competition
CE has undertaken analysis of the competitive dynamics between major producers, including consideration of pricing
theories such as Cournot. This analysis indicates that two producing regions have scope to influence forward gas
domestic prices:
Gippsland Basin producers in the short to mid term
Queensland CSG producers in the mid to longer term
7.1. Gippsland
CE has undertaken an analysis of all major southern market producers and determined that the only major party with
potential supply side power, based on existing reserves and projected demand is the Gippsland producers. Key
considerations are summarised in the following table.
Gippsland Basin
Overview The Gippsland Basin supplies approximately 40% of the domestic market and has a primary focus on supplying Vic, NSW and to a lesser extent SA
Estimated Supply Cost The medium to long term marginal cost is estimated to be approximately AUD 4.50/ GJ for legacy gas and higher for Kipper. This includes operational costs and maintenance/ SIB Capex only
It is assumed that existing 2P reserves in the Gippsland Basin are depleted by 2026/2027.therefore the cost of production is expected to increase if further capital expenditure is required to develop additional 2P reserves.
Contracted Position &
Uncontracted Potential
Supply
Significant contracts ending in 2017, 2020 and 2022.
Additional ~150 PJ of volume available for recontracting from 2018
Additional ~50-100 PJ of volume available for recontracting between 2021 and 2023
Proximity to Key Demand
Centres
LNG export and Queensland Domestic: Not well placed to supply gas into the LNG export market and Queensland domestic market due to transmission challenges and tariffs.
Victorian DTS: Gippsland Basin production is best placed to supply the Victorian market as Longford Plant is connected to the DTS/VTS. Gas can flow to Melbourne relatively cheaply via LMP.
Adelaide: Moderate transportation costs incurred along the LMP, SWP and SEAGas
Sydney: Moderate transportation costs incurred along the EGP (or potentially even a route running along the LMP, NVI and MSP)
As reserves currently stand, Gippsland Basin producers are exposed to limited direct gas supply competition in
southern markets during the period to 2025 given constraints on Cooper Basin, Otway and Bass Gas and new NSW
and Vic supply, with the only potential new supply associated with the proposed Sole development. Accordingly there
is a potential for Gippsland suppliers to price gas at a level which is competitive with northern CSG supply, adjusted
for related transmission costs.
7.2. Queensland CSG
CE has undertaken an analysis of all major Queensland CSG producers and determined that the only major party with
potential supply side power, based on existing reserves and projected demand is APLNG and Origin Energy during
the period beyond 2025. Factors considered are summarised in the following table.

NGFR Gas Price Assessment
Core Energy Group © 2016 October 2016 12
Queensland CSG
Overview Surat Bowen production supplies approximately 30% of the domestic market
These producers will supply the 1,200 to 1,500PJ p.a. required to fulfill LNG contracts.
Supply Cost The medium to long term full lifecycle cost is estimated to be AUD 7.00/GJ at Wallumbilla under a neutral case. This includes drilling and tie-in capex, operational costs and maintenance/ SIB Capex.
Contracted Position &
Uncontracted Potential
Supply
In 2015 and 2016 contracted to supply 125-160 PJ. The domestic contracts gradually mature through to 2031.
The primary focus of these producers is the LNG export market which will generally require 1,200 to 1,500PJ per annum.
Availability of future supply for domestic markets will
Proximity to Key Demand
Centres
LNG export and Queensland Domestic: The Queensland CSG producers are best placed to supply gas into the LNG export market and Queensland domestic market.
Victorian DTS: Significant transportation costs required to supply into the Victorian market. This puts Queensland CSG supply at a significant disadvantage.
Adelaide: Moderate transportation costs incurred along the SWQP (incl. QSN Link) and MAP.
Sydney: Moderate transportation costs incurred along the SWQP (incl. QSN Link) and MSP.
Beyond 2025 GLNG, Santos and QCLNG reserves and production in the north are expected to be constrained and
there is expected to be limited competitive pressure from southern sources unless new discoveries are made.
Accordingly there is potential for APLNG and Origin to seek to increase prices due to limited competition.

NGFR Gas Price Assessment
Core Energy Group © 2016 October 2016 13
8. Gas Price Scenarios
8.1. R&C Sector
The following figures present CE’s projection of average delivered mass market gas prices at major demand centres.
Figure 8.1 Neutral Case, real 2016 | AUD/GJ
Figure 8.2 Weak Case, real 2016 | AUD/GJ
Figure 8.3 Strong Case, real 2016 | AUD/GJ
4.00
5.00
6.00
7.00
8.00
9.00
10.00
11.00
12.00
2003 2007 2011 2015 2019 2023 2027 2031 2035 2039
Melbourne Sydney Adelaide
Brisbane Canberra Tasmania
4.00
5.00
6.00
7.00
8.00
9.00
10.00
11.00
12.00
2003 2007 2011 2015 2019 2023 2027 2031 2035 2039
Melbourne Sydney Adelaide
Brisbane Canberra Tasmania
4.00
5.00
6.00
7.00
8.00
9.00
10.00
11.00
12.00
2003 2007 2011 2015 2019 2023 2027 2031 2035 2039
Melbourne Sydney Adelaide
Brisbane Canberra Tasmania

NGFR Gas Price Assessment
Core Energy Group © 2016 October 2016 14
8.2. GPG
The following figures present CE’s projection of average GPG gas prices for each NEM state (at transmission pipeline
delivery point).
Figure 8.4 Neutral Case, real 2016 | AUD/GJ
Figure 8.5 Weak Case, real 2016 | AUD/GJ
Figure 8.6 Strong Case, real 2016 | AUD/GJ
4.00
5.00
6.00
7.00
8.00
9.00
10.00
11.00
12.00
2003 2007 2011 2015 2019 2023 2027 2031 2035 2039
Victoria New South Wales
South Australia Queensland
Tasmania
4.00
5.00
6.00
7.00
8.00
9.00
10.00
11.00
12.00
2003 2007 2011 2015 2019 2023 2027 2031 2035 2039
Victoria New South Wales
South Australia Queensland
Tasmania
4.00
5.00
6.00
7.00
8.00
9.00
10.00
11.00
12.00
2003 2007 2011 2015 2019 2023 2027 2031 2035 2039
Victoria New South Wales
South Australia Queensland
Tasmania

NGFR Gas Price Assessment
Core Energy Group © 2016 October 2016 15
A1. AEMO 2016 NGFR Forecasting and Planning Scenarios
Dimension Impact area Type Weak Neutral (most probable) estimate Strong
Economy Economy Aus Business Conditions
Variable Weak Neutral Strong
Consumer Economy Aus Business Conditions
Variable Low confidence, less engaged. Average confidence and engagement High confidence, more engaged.
Population/Population Growth
Economy Aus Business Conditions
Variable ABS Population trajectory low ABS Population trajectory med ABS Population trajectory high
Elec Network Charges- 5 years
Energy prices Electricity Prices Fixed Current AER determinations, fixed after 5 years
Current AER determinations, fixed after 5 years
Current AER determinations, fixed after 5 years
Gas Network Charges- 5 years
Energy prices Gas/Oil Price Fixed Current AER determinations, fixed after 5 years
Current AER determinations, fixed after 5 years
Current AER determinations, fixed after 5 years
Elec Network Charges- long run
Energy prices Electricity Prices Fixed Constant real Constant real Constant real
Gas Network Charges- long run
Energy prices Gas/Oil Price Fixed Constant real Constant real Constant real
Retail costs and margins
Energy prices Electricity Prices Fixed Assume current margins throughout
Assume current margins throughout Assume current margins throughout
Tariff structure Energy prices Electricity Prices Fixed Same as current Same as current Same as current

NGFR Gas Price Assessment
Core Energy Group © 2016 October 2016 16
LREC/SRES Energy prices Electricity Prices Fixed Assume current to 2020, with LGCs/SSTC deemable to 2030
Assume current to 2020, with LGCs/SSTC deemable to 2030
Assume current to 2020, with LGCs/SSTC deemable to 2030
Weather Energy prices Electricity Prices Fixed
Neutral weather assumption for consumption forecasts, probabilistic weather settings for peak demand
Neutral weather assumption for consumption forecasts, probabilistic weather settings for peak demand
Neutral weather assumption for consumption forecasts, probabilistic weather settings for peak demand
Rainfall - Hydro gen Energy prices Electricity Prices Fixed Medium value for water availability (last 15 years)
Medium value for water availability (last 15 years)
Medium value for water availability (last 15 years)
LNG growth Energy prices Gas/Oil Price Fixed Australian LNG export growth per Oil price projections
Australian LNG export growth per Oil price projections
Australian LNG export growth per Oil price projections
Oil Prices/ Gas Prices Energy prices Gas/Oil Price Variable USD30/bbl (BR) with pricing affecting the industry as existing contracts expire
USD60/bbl (BR) with pricing affecting the industry as existing contracts expire
USD90/bbl (BR) with pricing affecting the industry as existing contracts expire
Exchange rate Energy prices Gas/Oil Price, business conditions for trade exposed businesses
Variable AUD/USD 0.65 Five-year linear glide-path from current value
AUD/USD 0.75 Five-year linear glide-path from current value
AUD/USD 0.95 Five-year linear glide-path from current value
Elec Wholesale Price Energy prices Electricity Prices Variable
As per the supply-side impact of this scenario. Assumes some abatement cost affecting end-user prices.
As per the supply-side impact of this scenario. Assumes some abatement cost affecting end-user prices.
As per the supply-side impact of this scenario. Assumes some abatement cost affecting end-user prices.
Electricity Demand Energy prices Electricity Prices Variable Based on end-point consumption (behind the meter), translated back to the grid.
Based on end-point consumption (behind the meter), translated back to the grid.
Based on end-point consumption (behind the meter), translated back to the grid.
Other policy and regulatory settings affecting electricity prices
Energy prices Electricity Prices Fixed Status quo Status quo Status quo
Technology uptake Technology End use and energy efficiency measures/technologies
Variable Hesitant consumer, weak economy.
Neutral consumer, neutral economy Confident consumer, strong economy
Energy Efficiency Technology End use and energy efficiency measures/technologies
Variable Policy measures deliver lower uptake of EE
Policy measures deliver med uptake of EE
Policy measures deliver high uptake of EE
Technology cost and uptake curve
Technology End use and energy efficiency measures/technologies
Variable
Technology cost and uptake curve assumptions for weak economy, low consumer confidence/engagement.
Median technology cost and uptake curve assumptions
Technology cost and uptake curve assumptions for strong economy, high consumer confidence/engagement.
Climate Policy up to 2030
Climate Policy Prices, plant-shut-downs, renewables and energy efficiency
Fixed Assume Australia's Paris commitment is achieved
Assume Australia's Paris commitment is achieved
Assume Australia's Paris commitment is achieved

NGFR Gas Price Assessment
Core Energy Group © 2016 October 2016 17
Climate Policy post 2030
Climate Policy Prices, plant-shut-downs, renewables and energy efficiency
Fixed 2030 status quo maintained to 2040, but including announced coal plant closures post 2030.
2030 status quo maintained to 2040, but including announced coal plant closures post 2030.
2030 status quo maintained to 2040, but including announced coal plant closures post 2030.
Climate Policy impacts Climate Policy Energy prices Fixed
Scenario assumes most abatement cost hits the pricing mechanisms of the industry. Proxy emissions abatement price of $25/tonne in 2020 rising to $50/tonne by 2030. Emissions Intensive Trade Exposed Industry pays only 20% of this cost in 2020, rising to 100% in 2030.
Scenario assumes most abatement cost hits the pricing mechanisms of the industry. Proxy emissions abatement price of $25/tonne in 2020 rising to $50/tonne by 2030. Emissions Intensive Trade Exposed Industry pays only 20% of this cost in 2020, rising to 100% in 2030.
Scenario assumes most abatement cost hits the pricing mechanisms of the industry. Proxy emissions abatement price of $25/tonne in 2020 rising to $50/tonne by 2030. Emissions Intensive Trade Exposed Industry pays only 20% of this cost in 2020, rising to 100% in 2030.
Climate Policy impacts Climate Policy Plant-shut-downs and generation replacement.
Fixed
Fossil fuel plant shut-down list informs scenario, assumes 2030 targets are achieved. Announced shutdowns beyond 2030 assumed in scenario. Technology replacement options do not include coal and are least cost.
Fossil fuel plant shut-down list informs scenario, assumes 2030 targets are achieved. Announced shutdowns beyond 2030 assumed in scenario. Technology replacement options do not include coal and are least cost.
Fossil fuel plant shut-down list informs scenario, assumes 2030 targets are achieved. Announced shutdowns beyond 2030 assumed in scenario. Technology replacement options do not include coal and are least cost.
Climate Policy impacts Climate Policy Other Fixed Energy efficiency initiatives consistent with National Energy Productivity Plan
Energy efficiency initiatives consistent with National Energy Productivity Plan
Energy efficiency initiatives consistent with National Energy Productivity Plan

NGFR Gas Price Assessment
Core Energy Group © 2016 October 2016 18
Terms of Use
This Report has been prepared by Core Energy Group Pty Limited, A.C.N. 110 347 085, for the sole purpose of
providing AEMO, with gas price analysis in accordance with the terms of an executed Engagement Letter.
This document has been prepared on the basis of a specific scope and does not purport to contain all the information
that a particular party may require. The information contained in this document may not be appropriate for all persons
and it is not possible for Core to have regard to the objectives, financial and other circumstances and particular needs
of each party who reads or uses this document.
Core believes that the information contained in this document has been obtained from sources that are accurate at
the time of issue, but makes no representation or warranty as to the accuracy, reliability, completeness or suitability of
the information contained within this document. To the extent permitted by law, Core, its employees, agents and
consultants accept no liability (including liability to any person by reason of negligence or negligent misstatement) for
any statements, opinions, information or matter (expressed or implied) arising out of the information contained within
this document.
© Core Energy Group – All material in this document is subject to copyright under the Copyright Act 1968
(Commonwealth) and international law and permission to use the information must be obtained in advance and in
writing from Core.

Core Energy Group © 2016 October 2016 19
Core Energy Group
Level 1, 276 Flinders St
Adelaide SA 5000
T: +61 8470 0050 | w: coreenergy.com.au
Paul Taliangis
Chief Executive Officer
T: +61 8470 0050