ngn-2a technical manual - optec, inc · model ngn-2a open-air integrating nephelometer technical...
TRANSCRIPT

MODEL NGN-2A
OPEN-AIR INTEGRATING
NEPHELOMETER
TECHNICAL MANUAL FOR
THEORY OF OPERATION AND OPERATING PROCEDURES
OPTEC, Inc.
OPTICAL AND ELECTRONIC PRODUCTS 199 Smith St. Lowell, MI 49331 U.S.A. [email protected] (616) 897-9351 http://www.optecinc.com (616) 897-8229 FAX
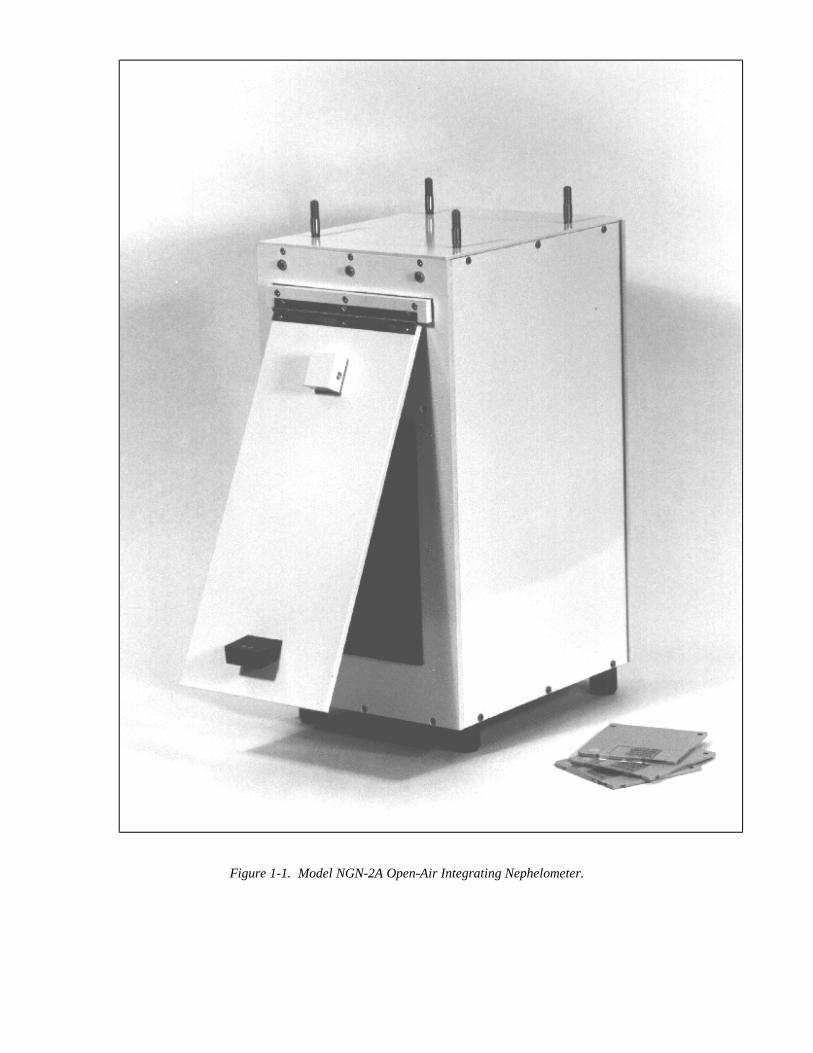
Figure 1-1. Model NGN-2A Open-Air Integrating Nephelometer.

i
TABLE OF CONTENTS March 2005
Section Page 1.0 Introduction . . . . . . . . . . . . . . . . . . . . . . . . . . . . . . . . . . . . . . . . . . . . . . 1 2.0 Theory of Operation . . . . . . . . . . . . . . . . . . . . . . . . . . . . . . . . . . . . . . . 3 2.1 Optical Design . . . . . . . . . . . . . . . . . . . . . . . . . . . . . . . . . . . . . . . 3 2.2 Photodetectors . . . . . . . . . . . . . . . . . . . . . . . . . . . . . . . . . . . . . . 5 2.3 Electrometer . . . . . . . . . . . . . . . . . . . . . . . . . . . . . . . . . . . . . . . . 6 2.4 Signal Pre-Processing . . . . . . . . . . . . . . . . . . . . . . . . . . . . . . . . . 7 2.5 Computer Processing . . . . . . . . . . . . . . . . . . . . . . . . . . . . . . . . . 7 2.6 Clean Air & Span Gas Calibrations . . . . . . . . . . . . . . . . . . . . . . 10 2.7 Mechanical Design . . . . . . . . . . . . . . . . . . . . . . . . . . . . . . . . . . . 11 2.8 Rain Detection and Temperature . . . . . . . . . . . . . . . . . . . . . . . . 13 3.0 Operating Procedure . . . . . . . . . . . . . . . . . . . . . . . . . . . . . . . . . . . . . . . 14 3.1 Basic Operation . . . . . . . . . . . . . . . . . . . . . . . . . . . . . . . . . . . . . 14 3.2 Outputs & Inputs . . . . . . . . . . . . . . . . . . . . . . . . . . . . . . . . . . . . 14 3.3 Power Supply . . . . . . . . . . . . . . . . . . . . . . . . . . . . . . . . . . . . . . 15 3.4 Serial I/O . . . . . . . . . . . . . . . . . . . . . . . . . . . . . . . . . . . . . . . . . . 15 3.5 Analog Output . . . . . . . . . . . . . . . . . . . . . . . . . . . . . . . . . . . . . . 16 4.0 Serial Communications . . . . . . . . . . . . . . . . . . . . . . . . . . . . . . . . . . . . . 18 4.1 PC Control Program . . . . . . . . . . . . . . . . . . . . . . . . . . . . . . . . . . 18 4.2 Basic Program Commands . . . . . . . . . . . . . . . . . . . . . . . . . . . . . . 18 5.0 Specifications . . . . . . . . . . . . . . . . . . . . . . . . . . . . . . . . . . . . . . . . . . . . 21 Appendices A NGN & Belfort 1590 Comparison . . . . . . . . . . . . . . . . . . . . . . . . . . . . . A-1 B Span Gas Calibration . . . . . . . . . . . . . . . . . . . . . . . . . . . . . . . . . . . . . . . B-1 C Wiring Diagram . . . . . . . . . . . . . . . . . . . . . . . . . . . . . . . . . . . . . . . . . . . C-1 D Computer / Interface Board . . . . . . . . . . . . . . . . . . . . . . . . . . . . . . . . . . D-1 E Scatter Light Board . . . . . . . . . . . . . . . . . . . . . . . . . . . . . . . . . . . . . . . . E-1 F Feedback Light Board . . . . . . . . . . . . . . . . . . . . . . . . . . . . . . . . . . . . . . F-1 G Span Gas Apparatus . . . . . . . . . . . . . . . . . . . . . . . . . . . . . . . . . . . . . . . . G-1 H 13.8 VDC Power Supply . . . . . . . . . . . . . . . . . . . . . . . . . . . . . . . . . . . . H-1

ii
LIST OF FIGURES Figure Page 1-1 Photograph of the NGN-2A . . . . . . . . . . . . . . . . . . . . . . . . . . . . . . . Cover 1-2 Cross-Sectional View of the NGN-2A . . . . . . . . . . . . . . . . . . . . . . . . 2 2-1 Electro/Optical Function Diagram . . . . . . . . . . . . . . . . . . . . . . . . . . . 4 2-2 Photopic Spectral Response . . . . . . . . . . . . . . . . . . . . . . . . . . . . . . . . 5 2-3 Current-to-Voltage Amplifier Configuration . . . . . . . . . . . . . . . . . . . 6 2-4 Signal and Control Processing Waveforms . . . . . . . . . . . . . . . . . . . . 9 3-1 Sample Output from Serial I/O Port . . . . . . . . . . . . . . . . . . . . . . . . . 15 A-1 Optec/Belfort Nephelometer Output Comparison . . . . . . . . . . . . . . . A-1 B-1 NGN-1 Output with Various Span Gases . . . . . . . . . . . . . . . . . . . . . B-1
LIST OF TABLES Table Page 2-1 Photodiode Physical and Electrical Characteristics . . . . . . . . . . . . . . 6 2-2 Important Computer Specifications . . . . . . . . . . . . . . . . . . . . . . . . . . 8 3-1 Pin-out and Function for the Power / Communication Connector . . 14 3-2 Description of Columnar Data in Sample Output . . . . . . . . . . . . . . . 16 3-3 Operating Sequences for Standalone Operation . . . . . . . . . . . . . . . . 17 4-1 Important Computer Commands and Their Use . . . . . . . . . . . . . . . . 18-20
1
SECTION 1.0
INTRODUCTION
The Model NGN-2A is based on the design principals of an integrating polar nephelometer. This model uses a unique integrating open-air design that allows accurate measurement of the scattering extinction coefficient of ambient air which was impossible with past designs of this type. Because of the open-air design features, relative humidity and temperature of the air sample are essentially unchanged, thus the aerosol is negligibly modified when brought into the optical measuring chamber. The instrument alters the temperature of the air sample by less than 0.5°C and the path flow is direct without bends. The NGN-2A is an improved version of the NGN-2 which has been in production since 1986. The main difference is that the NGN-2A replaces the paired interface and computer boards with a single circuit board using PIC microcontroller technology. This change results in fewer parts, added reliability, and easier servicing. The NGN-2A features low power consumption, solid compact design, and easy operation - all necessary parameters when installing and operating a measuring instrument in remote locations. Housed in a single environmentally sealed enclosure, the nephelometer contains all the necessary components for ambient stand-alone operation. The NGN-2A consists of a large inlet with motorized door, measuring chamber, clean air pump for calibration, blower, solenoid activated inlet for a span gas, temperature sensor, real time clock and rain detector for closing the inlet during wet conditions. See Figure 1-2 for a cross-sectional view of the NGN-2A. A PIC microcontroller controls all operating functions and outputs data either in digital or analog format. External to the NGN-2A unit, a 13.8V DC, 5-amp power supply, compressed span gas and a data logger or printer are required.

2
Figure 1-2. Cross-Sectional View of the NGN-2A.

3
SECTION 2.0
THEORY OF OPERATION
2.1 OPTICAL DESIGN
The NGN-2A integrating nephelometer measures the scattering coefficient Bscat of a known volume of air. Refer to Figure 2-1. This air volume is illuminated by a near Lambertian diffuser made from flashed opal glass with a cos T fall off. More specifically, the diffuser radiates into a 2π steradian (180°) hemisphere using the following functional relationship
Nθ = N0 cosθ where N0 is the radiance normal to the diffuser's surface and T is the angle from a line normal to the plane of the diffuser to a point on the hemisphere. Because of optical and mechanical limitations in the design of this type of nephelometer, a small amount of truncation near 0° and 180° is necessary. The NGN-2A truncates at 5° and 175°. A low voltage (13.8 volt DC) quartz halogen projector bulb with dichroic reflector illuminates the opal glass diffuser. In the light path between the diffuser and bulb, a heat absorbing glass filter blocks all radiation longer than 700 nm in wavelength and a mechanical chopper modulates the beam at a 10 Hz rate. The modulation principal allows a lock-in amplifier technique to be employed to separate the weak scattered light signal from ambient light and amplifier/detector noise. Within the optical measuring chamber and directly in front of the diffuser, a photodiode detector with photopic spectral response measures N0 and produces an output current directly proportional to the chopped light signal. This signal is used by the computer to lock-in to the scattered light signal and to normalize the scattered light signal with the N0 value. Normalizing the scattered light signal compensates for lamp brightness changes due to power supply fluctuations, lamp aging and dust on the optical surfaces. All further discussion of this detector refers to it as the N0 detector. A telescope with a precisely defined field of view observes through a cylindrical pencil of air slightly above the diffuser. This pencil size volume of air is approximately 6 mm in diameter and 260 mm long and terminates in a light trap which reflects very little light back in the direction of the telescope. A small lens (Fabry lens) behind the field stop images the entrance pupil of the telescope (objective or front lens) onto the active area of a small silicon photodiode. This method of photometry is very common in stellar light photometers and is used to reduce the effect of response differences across the detector's surface and to allow all the light flux that passes through the field stop to be collected by the photodiode detector. Light flux measured by this photodiode is proportional to light scattered by the air sample plus light reflecting from the surfaces and stop edges in the
4
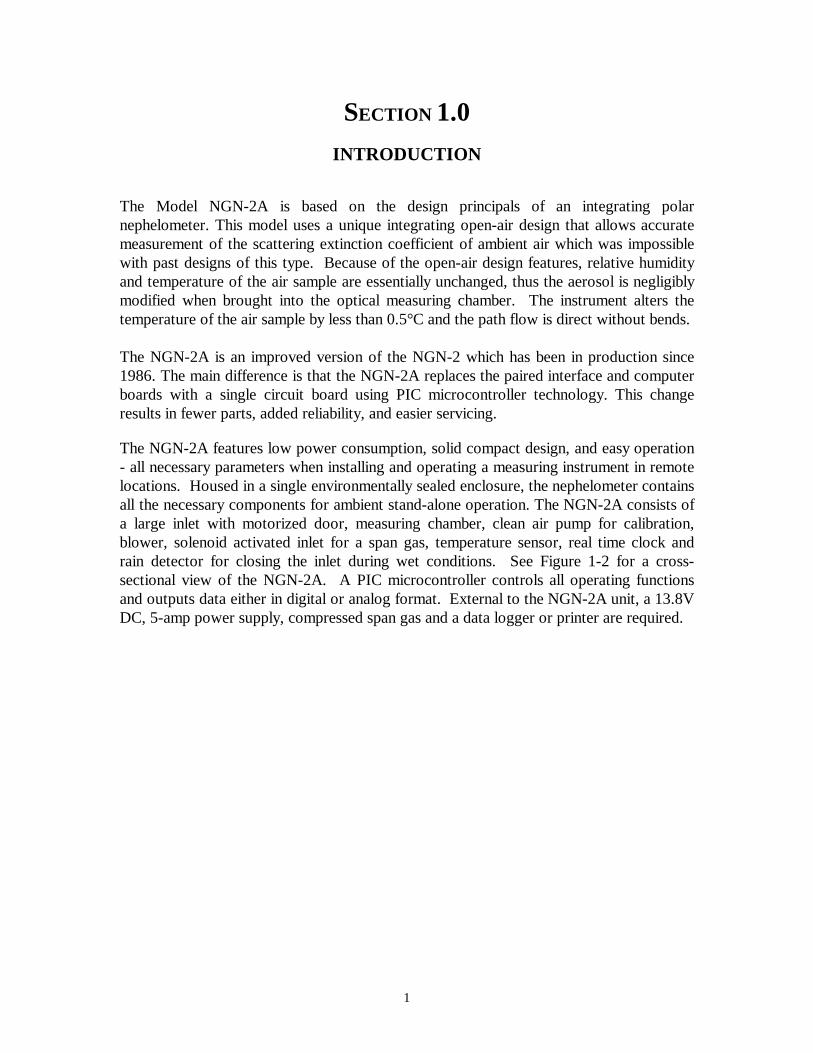
optical chamber. This chamber wall component of the measured light is constant and small, usually only 3 to 4 Rayleighs. Similar to the photodiode measuring N0, this photodiode has a photopic response filter. All further discussion of this detector refers to it as the scattered light detector.
Figure 2-1. Electro/Optical Function Diagram.

5
2.2 PHOTODETECTORS The detectors used for measuring both the scattered light and direct output from the diffuser Nθ, are P-N silicon photodiodes operating in the photovoltaic mode. Photons absorbed within the silicon layer of the photodiode excite electrons into the conduction band. Because of the instrinsic electric field generated across the P-N junction, these excited electrons cause a small current to flow when a connection is made between the P and N junctions. The quantum efficiency, QE, is defined as the ratio of the number of incident photons to the resulting photoelectrons in the output current. The photodiodes used has a QE of approximately 75% in the photopic spectral band of interest. However, even with this high QE, photodiodes are unable to detect individual photons since amplifier plus detector noise is many times higher than the signal expected from an individual photoelectron.
Figure 2-2. Photopic Spectral Response.
A photopic response filter is mounted on the photodiode with an optical adhesive. The spectral response of the detector/filter combination is shown in Figure 2-2. Important physical and electrical characteristics for this photodiode are shown in Table 2-1.

6
Size 1.3 x 1.3
Effective Area 1.6 sq. mm Spectral Range 320 - 730 nm (5% cut-off) Peak Response 550±20nm
Shunt Resistance 50 GΩ typical Noise Equivalent Power 1x10
-15 W/ Hz
Table 2-1. Photodiode Physical and Electrical Characteristics.
2.3 ELECTROMETER Figure 2-3 shows the basic current-to-voltage amplifier used in the NGN-2A for both the scattered light and N0 detectors. Photocurrent from the photodiode is balanced by an equal current in the feedback resistor but flowing in the opposite direction so that the inverting input is kept near zero potential. The output voltage is thus
Eout = Rf Is
where Rf is the feedback resistance and Is is the photocurrent.
Gain stability of this circuit in AC operation is a function of changes in the feedback resistance. With temperature, the prime forcing function on gain stability, the T-C coefficient of the scattered light electrometer amplifier is less than ±200 ppm/C°.
Figure 2-3. Current-to-Voltage Amplifier Configuration.

7
2.4 SIGNAL PRE-PROCESSING
Before processing by the computer, the signals from the scattered light and N0 detectors are filtered and/or wave shaped to reduce noise and errors in the digitization process. The current from the scattered light detector is converted to a voltage and amplified by a low-bias current electrometer op-amp as discussed in Section 2.3. The high level signal from the electrometer is then passed through a DC blocking capacitor and a 3rd order low pass filter with a cut-off set for 35 Hz. This filter reduces noise pick-up and aliasing with higher frequency noise voltages. The resulting processed signal is ready for digitization by a 10-bit A/D converter. Similarly, current from the N0 detector is converted to a voltage and amplified by a low-bias current op-amp. The signal at that point is directed to two different functional routes. Lamp brightness is measured to scale the scattered light output and the phase of the chopper is determined in order to phase-detect (lock-in) the weak scattered light signal. The lamp brightness signal, N0, is passed directly to a 10-bit A/D converter for digitization. The same signal is also processed by a 2nd order bandpass filter centered at 10 Hz (chopper frequency) and then wave shaped by a zero-cross comparator with TTL level output. When the bandpass amplifier is properly centered at 10 Hz, the resulting square wave signal from the comparator is exactly in phase with the chopped light. Lamp-on and lamp-off parts of the cycle can be accurately determined by observing the edge transitions of the comparator signal and determining if they are negative or positive going. This signal is routed to one of the available I/O ports of the computer.
2.5 COMPUTER PROCESSING
The Computer/Interface board has been designed by Optec to take advantage of low power ICs entirely. Based on the PIC 16F877 microcontroller, the Interface/Computer consists of a single 9" by 7.5" board with the important specifications listed in Table 2-2. The computer operating system and signal-processing program are written in a PIC Basic Pro, a basic compiler written specifically for PIC microcontrollers. In the absence of noise, the difference between the signal level at the top of the cycle when the lamp is on and the bottom of the cycle when the lamp is off would give an accurate measurement of scattered light. Since noise due to the detector and amplifier electronics is usually several orders of magnitude greater than the signal, the average difference must be calculated over many hundreds of cycles.

8
TYPE 16F877 flash microcontroller, Microchip
8.000 MHz clock rate 40-pin DIP socket
Memory 8K program memory, EPROM 368 bytes RAM 256 bytes EEPROM
I/O 32 lines bidirectional A/D 10-bit resolution
+2.5 to -2.5 input voltage range 4 µsec conversion time
D/A 12-bit resolution 2-outputs 0 to +10 or 0 to +5 output range
Real Time Clock year:month:day:hour:minute:second 120 day operation w/ full charge on 1F
cap Serial Port RS-232 port at 9600 baud, 8 data bits
no parity and 1 stop bit, no handshake
Table 2-2. Important Computer Specifications.
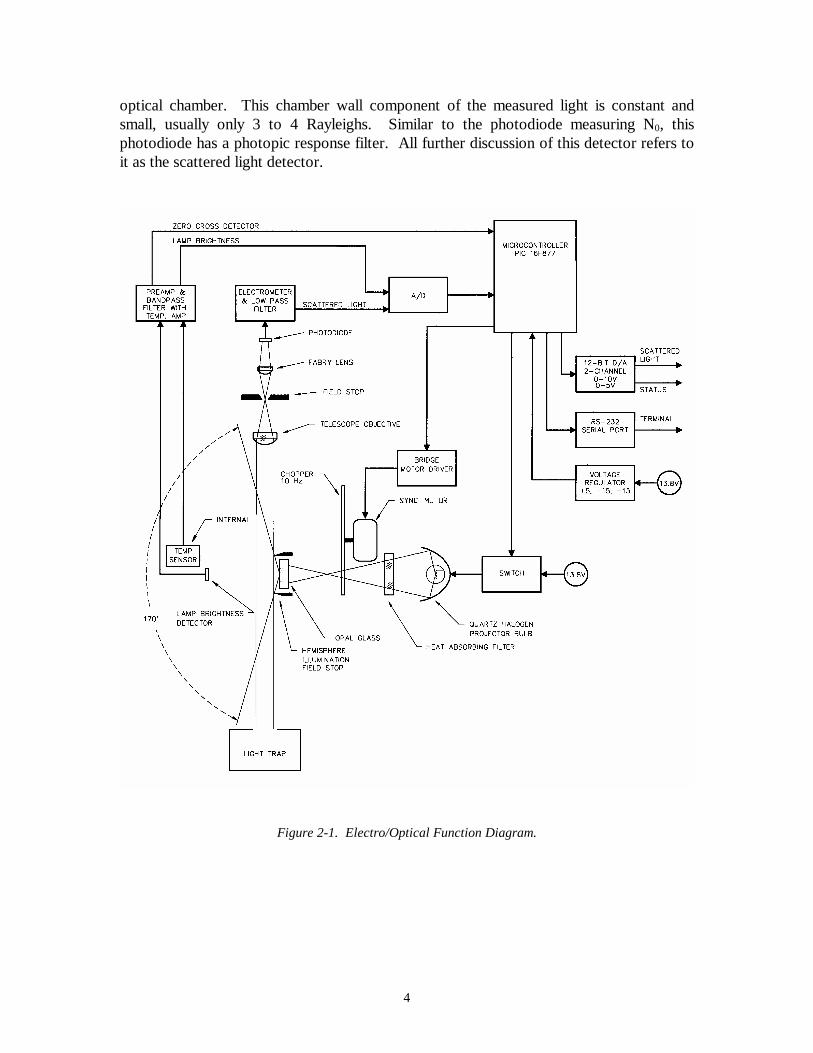
The lock-in amplifier technique allows the computer to sample (take a voltage reading) at the same top and bottom points of the scattered light signal for many hundreds of cycles and then compute the average. The zero-cross detector signal from the N0 detector allows the computer to determine the precise times when the chopper uncovers the lamp or covers it. Once those times are detected, a ¼ period delay is initiated before sampling is commenced to determine the top and bottom points of the waveform. The negative transition of the zero-cross detector signals a lamp-on condition and a positive transition signals a lamp-off condition. See Figure 2-4. If a negative or positive transition is not detected within a short time, an error condition code is transmitted on the serial port which would normally indicate a burned out bulb. Before taking a reading, the system samples the scattered light value for 3.2 seconds in order to obtain an approximation of the signal level. If the level is low which would be the result if the sampled air is within 5 Rayleighs of clean air, the gain of the differential preamp to the A/D converter is changed to 4. Otherwise, for air scattering greater than 5 Rayleighs, the gain is left at 1. This allows a greater range of scatter to be measured with higher precision. The instrument then integrates for 51.2 seconds the scattered light signal and then integrates for 2 seconds the signal from the N0 detector, lamp brightness, for normalizing the scattered light result. With processing overhead, the entire reading takes approximately 60.0 seconds to accomplish. Longer N-minute integration times are computed from the sum of N one-minute readings. Integration times less than one minute are not obtainable.
9
Figure 2-4. Signal and Control Processing Waveforms.
The NGN-2A begins operation using its default setting, MODE = 1, which uses the default integration time to two minutes and then outputs the results on the serial and analog data lines. Clean air calibrations are performed approximately every 27 hours and span gas calibrations are performed when invoked by PC control. Both clean air and span gas calibrations take approximately 15 minutes to perform. At the end of each integration, the results along with time, temperature and status are transmitted on the serial output line and the two D/A converters are updated in case of external analog data recording. Other operating sequences are easily selected and are discussed in Section 3.0. Operating sequences unique to an individual user are possible but must be programmed at the factory.

10
2.6 CLEAN AIR & SPAN GAS CALIBRATION
Periodic clean air and span gas calibrations are performed in order to monitor and correct for instrument gain and zero intercept drift due to temperature changes and/or dirt accumulating on the measurement chamber optics. Clean air calibrations are usually performed more often since they are easy to do and use no source of expendable gas. Span gas calibrations with a dense gas such as Freon-22 (CHClF2), Sulfur Hexafluoride (SF6) or HFC-134a (SUVA 134a from DuPont) are usually done on power up or computer reset with an operator present. However, the operating program can be easily modified to accomplish this periodically and without an operator. The scattering value for clean air reading is considered equal to one Rayleigh or 0.01 km-1 if temperature and pressure values are compensated for. A span gas such as SUVA 134a would have a scattering coefficient equal to 7.1 times the clean air value. Knowing these two values allows a solution to be found for the following linear equation
y = ax + b where, y = scattered light due to molecular and aerosol scatter in user selected units a = scaling factor x = normalized scattered light output for clean air or span gas b = scattered light from the measurement chamber walls.
Clean Rayleigh quality air is obtained by recirculating the measuring chamber air through a 0.3 µm microfiber filter with the inlet door closed. This filter retains 99.97% of all particles larger then 0.3 µm. The clean air pumping requires approximately 5 minutes to completely filter all particles from the measuring chamber before a 10 integration is commenced. During the clean air cycle, a 7.0-volt Status signal is held on D/A channel-2 to indicate that a clean air calibration is in process. When the clean air calibration is completed, a 2.0-volt status signal is sent to D/A channel-2 to indicate that the output on D/A channel-1 is a clean air reading. Simultaneously, the clean air value is sent to both the serial and D/A channel-1 lines. A cylinder of compressed span gas pressure regulated to approximately 10 psi is connected to the solenoid activated gas inlet valve with a critical orifice to meter the flow to approximately 2 l/m. When a span gas calibration is started, this inlet is opened for 10 minutes to allow the span gas to completely fill the measuring chamber before a 10-minute integration is commenced. During the span gas cycle, a 7.0-volt status signal is held on D/A channel-2 to indicate that a span gas calibration is in process. The measured

11
scattered light value is transmitted to the serial port along with a status code indicating a span gas calibration value. This value is also converted to an analog voltage and passed to the D/A channel-1 output. A 3.0-volt Status signal is held on D/A channel-2 to indicate a span gas reading.
2.7 MECHANICAL DESIGN
The NGN-2A contains nearly all of the equipment needed for an integrating nephelometer in one environmentally sealed enclosure which measures 10.7 x 8.2 x 16.5 inches and weighs 27 lbs. Only a source of low voltage DC power, span gas cylinder and data logging means are needed to complete a working instrument. Usually, the NGN-2A mounts from the top under some sort of protective roof such as a building overhang. The clean air filter module, access door for lamp changing, data/power cable connector and span gas inlet are mounted on one side of the unit for easy accessibility and maintenance. The interior of the instrument is separated into three areas - measuring chamber, exhaust/pump chamber and the electronics/computer chamber. See Figure 1-1. Separated by a double wall, the optical measuring chamber is completely sealed from the rest of the enclosure to prevent either air or heat from the internal parts of the instrument from contaminating the measuring process. A large air inlet with motorized door allows ambient air to flow unmodified a short distance to the viewing volume. To prevent unwanted insects and large floating masses from entering the chamber, a 24 mesh (24 wires to the inch) stainless screen covers the inlet window. One side of the measuring chamber wall is easily removed to allow access to the chamber for cleaning and service. The exhaust fan mounted in the exhaust/pump chamber creates a strong negative pressure behind the rear wall of the measuring chamber which is perforated. This causes the ambient air to laminar flow through the measuring chamber without much turbulence. To allow the span gas to fill the chamber and the overflow to vent outside, a small plastic tube is coupled from the top of the chamber to the exhaust/pump chamber. The heavier than air span gas will fill the bottom of the chamber first and force air out through the top vent tube. Separate and sealed from the electronics/computer chamber, the exhaust/pump chamber houses the lamp cooling heat sink, clean air pump, exhaust port door, exhaust fan and span gas solenoid activated inlet valve. The exhaust air from the measuring chamber passes through the exhaust/pump chamber before being expelled. In the process, this air passes through a finned heat sink which helps to reduce the internal heat of the instrument which comes primarily from the 25-watt halogen lamp. A low voltage diaphragm pump is used to circulate the measuring chamber air at a rate of approximately 2 liters/minute. On the positive pressure side of the pump, tubing directs the airflow to the externally mounted clean air filter which mounts on the outside rear panel much like an automobile oil filter.

12
A solenoid-activated door allows the measuring chamber exhaust port to be completely sealed during calibration measurements. The span gas inlet uses a 1/8" barbed tubing insert for coupling to the compressed gas cylinder which should be pressure regulated to 10 psi. Coupled to the barbed inlet, a 1/8” pipe coupling with a critical orifice having a 0.5 mm diameter hole meters the span gas to a 2 l/m flow rate. A solenoid-activated valve allows the span gas to fill the measuring chamber on computer command. The electronics/computer chamber contains the projector lamp, chopper motor, scattered light detector/electrometer, computer, interface board and door open/close motor. A 13.8-volt DC 25 watt projector bulb with dichroic reflector focuses most of its light energy onto the opal glass diffuser. Around the bulb a thick metal shield absorbs and conducts much of the heat energy from the bulb to the rear outside panel and to the exhaust chamber where a small fan helps to expel the excess heat. Lamp life is estimated at around 700 hours of operation at the rated voltage. Connected directly to the 13.8 volt DC supply voltage through a relay switch, the lamp brightness is not well regulated and changes slightly when the various power functions of the instrument are activated. However, the N0 detector continually monitors these brightness changes and scales the scattered light detector output accordingly. Controlled by a crystal oscillator, the low voltage synchronous chopper motor's rotational speed is precisely held to 2.5 rps. The four-blade chopper thus interrupts the lamp beam at a 10 Hz rate. The chopper is activated when the lamp is turned on. A geared 12-volt DC motor is used to open and shut the inlet port. The torque of this motor is governed to close the door securely without providing too much torque which could be dangerous to trapped fingers. About 4 seconds is required for the motor to close or open the door. The door is opened to an approximate 30° angle from the front panel of the NGN-2A. To conserve power and prevent internal heat from building up, the voltage to the motor is turned off after 10 seconds of operation. The 13.8-volt DC input power is first routed to the interface board where current, voltage and transient protection devices provide safe power for the rest of the instrument. On board regulators provide +5, +15 and -15 volt power to the various digital and analog circuits. The maximum continuous current required during operation is approximately 4.5 amps. Either solid-state HEXFET devices, or mechanical relay switch is connected to the I/O ports of the computer control the electromechanical devices within the instrument. All devices are connected to the 13.8-volt DC input power and are turned on when the circuit is completed to the power return through the switch.

13
2.8 RAIN DETECTION & TEMPERATURE
Because the optical measuring chamber is open to the outside, wind driven moisture could be blown in the chamber causing erroneous readings and possibly disabling the measurement process for some period of time after the event. To prevent this, a moisture detector is mounted at the bottom of the door for the purpose of interrupting the measurement process in the event of rain or snow. The rain detector is essentially two stainless steel terminals mounted about 6 mm apart with a 12 volt potential difference between them. Any moisture between the two terminals will allow a small amount of current to flow which will be detected and the measurement process interrupted. At that point the computer closes the instrument and turns off all but essential systems. A small 2-watt heater below the terminals is turned on in order to speed the drying process. Once the surface between the two terminals is dry for one hour, the NGN-2A continues with the measurement cycle where it left off. Clean air and span gas calibrations are not affected by the detection of rain since they operate with the inlet door closed. Temperature within the measuring chamber is also measured and transmitted to the serial output along with the scattered light values. Besides the importance of recording temperature along with the data for post processing, temperature information is needed for the proper detection of moisture when ambient condition are near and below the freezing point. At 2°C a small 2 watt heater mounted under the terminals is turned on to prevent water from freezing between the terminals. The volume resistance of ice is high enough so as not to be detected by this method if left on the terminals. The temperature sensor and amplifier are accurate to 0.8°C and has a range of -50 to +50°C.
14
SECTION 3.0
OPERATING PROCEDURES – STAND ALONE MODE
3.1 BASIC OPERATION
Because of Optec's long association with the National Park Service in its field-testing program of our visibility instruments, the design philosophy used for the NGN-2A was to keep it simple. For operation with an analog recording device connected to the two D/A channels, the only operating procedure is to plug it in and walk away. A PC can also be used to store the serial data using a variety of serial data collection programs. A simple PC data collection program is supplied with the distribution disk for this instrument. Three possible operating sequences are available and are selected by using the terminal command NOxxxn where n is the user's choice of 1, 2 or 3 which represent the three possible sequences. Mode 1 is the default choice. See Table 3-3 for a complete description of these operating sequences. If defined by the user before delivery, custom-operating routines unique to the customer’s requirements can be programmed at Optec. Changes afterwards would require a reprogrammed PIC microcontroller and the customer swapping the new IC with the currently installed version. The user is then expected to post process this data to extinction, visual range, mass concentration or other visibility related parameters. The advantage of this procedure is that the raw data set is retained and computer generated graphical output of data is superior to most instrument outputs of finished time-stamped data.
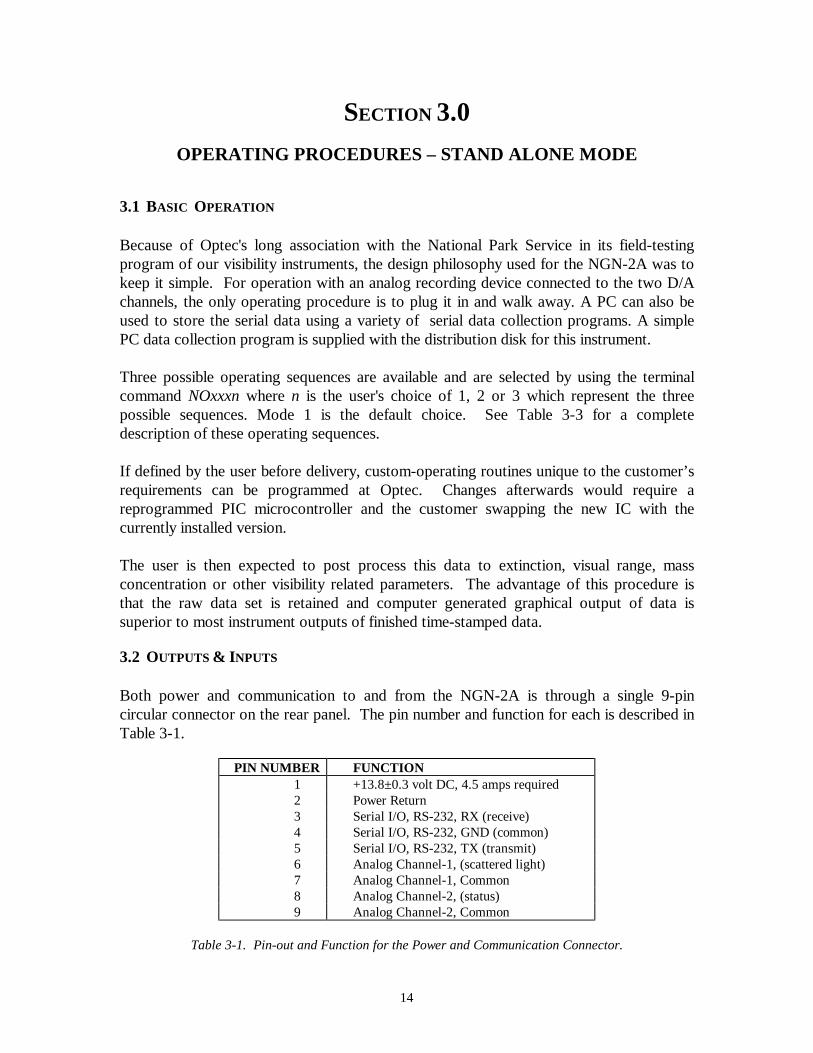
3.2 OUTPUTS & INPUTS Both power and communication to and from the NGN-2A is through a single 9-pin circular connector on the rear panel. The pin number and function for each is described in Table 3-1.
PIN NUMBER FUNCTION 1 +13.8±0.3 volt DC, 4.5 amps required 2 Power Return 3 Serial I/O, RS-232, RX (receive) 4 Serial I/O, RS-232, GND (common) 5 Serial I/O, RS-232, TX (transmit) 6 Analog Channel-1, (scattered light) 7 Analog Channel-1, Common 8 Analog Channel-2, (status) 9 Analog Channel-2, Common
Table 3-1. Pin-out and Function for the Power and Communication Connector.

15
3.3 POWER SUPPLY
Any high quality low voltage source can be used to supply DC power if it can supply a minimum of 4.5 amps continuously and be set for 13.8±0.3 volts. The user should take into account voltage loses on the power cable due to the finite resistance of copper when planning cable lengths. A heavy gage cable may have to be used if the distance from the NGN-2A unit to the power supply is great. Normally, a 16 AWG cable is adequate for distances up to 20 feet. Optec can supply a power supply mounted in a NEMA 12 enclosure. See Appendix I for a description of the power supply available from Optec.
3.4 SERIAL I/O
At present, the serial output supports RX, TX and GND for the RS-232 interface. Default values for this interface are: 8 data bits, 1 stop bit, no parity and 9600 baud. For connection to a printer, only RX and GND need to be connected. A sample of output data is shown in Figure 3-1 where the columns labeled A through H represent data as described in Table 3-2. Low capacitance cables would allow lengths up to 150 feet to be used without problem. For greater lengths, high current drivers or fiber optic cables would be required. Since this is a direct electrical connection to the computer circuitry, not electrically isolated, great care should be used in planning to protect against lightning and power surges in the AC line or building structures from damaging the NGN-2A. Further discussion of this topic is beyond the scope of this manual but Optec will help plan a safe wiring strategy when requested.
A B C D E F G H Comments 3 383 3841 199 10 23.43 030425 1500 Span Calibration 2 98 3839 51 10 23.49 030425 1516 Clean Air Calibration 1 290 3752 154 2 23.03 030425 1520 Beginning of Ambient Air Readings 1 287 3723 154 2 22.89 030425 1522 1 282 3714 152 2 22.87 030425 1524 1 276 3708 149 2 22.80 030425 1526 5 Measurements Interrupted by Rain 1 265 3682 144 2 21.34 030425 1636 Rain Stops, 1 267 3685 145 2 21.37 030425 1638 . . . . . . . . . . . . . . . . . . . . . . . . Data Deleted 1 225 3671 122 2 20.75 030425 1759 2 95 3813 50 10 21.32 030425 1820 Clean Air Calibration after 3 Hours 1 223 3736 119 2 20.52 030425 1824
Figure 3-1. Sample Output from Serial I/O Port.

16
Serial digital data may be recorded with a variety of means. The simplest would be a serial interface printer connected to RX and GND. Of course, this method makes it difficult to transport the data to a computer for post processing. A more desirable method would be to use a PC or similar computer with a data capture program. Again, only RX and GND in a two-wire cable need to be connected to the computer. A simple serial data acquisition program is supplied with the distribution disk. NEPHREAD can read and store date on operates on most PC computer platforms with a COM port. The program runs in the background and is accessible via an icon on the system tray toolbar. Unpack the file named NEPHREAD.ZIP to access this program.
COLUMN DESCRIPTION A Status 1 = Ambient Air Measurement 2 = Clean Air Calibration 3 = Span Gas Calibration 4 = Lamp Low or Burned Out 5 = Rain Detected 6 = Chopper Motor Failure 7 = Span/Clean Air Calib. in Process 8 = Fog Level Reached 9 = Supply Voltage out of Spec.
B Raw Scattered Light Value C Raw Lamp Brightness Value D Normalized Scattered Light Value E Integration Time in Minutes F Temperature in °C G DATE: Year - Month - Day H TIME: Hour (24 hr. clock) - Minute
Table 3-2. Description of Columnar Data in Sample Output (Figure 3-1).
At start up, system information is transmitted first in what is referred to as a ”POST”. This lists all the the various set points for one’s configuration such as operating mode, integration time, date & time, intervals etc. If this transmission interferes with a serial data logger, it can me turned off. Refer to table 4-1 for the proper command.
3.5 ANALOG OUTPUT
The analog output channels 1 and 2 provide a 0 to 10.00 volt full-scale signal which is directly proportional to the normalized scattered light and status values respectively. For the status values described in Table 3-2, that is the 1, 2, 3 etc. digital codes, the analog channel 2 represents these as 1.00, 2.00, 3.00 etc. volts with an accuracy of ±0.02 volts. An internal jumper on the computer board can be set to allow for a 0 to 5.00 volt full-scale signal if required. Of course, the scatted light and status values will be one half their digital values. The D/A converter has 12-bit resolution which allows for 4096 voltage states between 0 and 10 volts. Thus, each bit represents a voltage change of 0.00244 volts. A scattered

17
light digital reading of 100 would produce an output on analog channel 1 of 0.100 volts and 10,000 an output of 10.000 volts. Since the digital output is an unsigned single precision number having 65,536 states, both greater resolution and dynamic range are available with the digital output. Through simple programming changes at the factory, the analog output can be tailored to have greater dynamic range at the expense of resolution. The reverse is also possible. Typically, Rayleigh air can be resolved to about 15% precision (± least significant bit) and the high end (10.00 volts) limits extinction readings to about 7.0 km-1. Care should be exercised when connecting a data logger to these analog voltage outputs. It is recommended that only high impedance, preferably differential amplifiers, be used to buffer these outputs. Most high quality data loggers and strip chart recorders have suitable input amplifiers. Low capacitance shielded cable is recommended and the distance to the data logger should not exceed 20 feet. Since this is a direct electrical connection to the computer circuitry and not electrically isolated, great care should be used in planning to protect against lightning and power surges in the AC line or building structures from damaging the NGN-2A. Transient voltage suppressors are used to protect the analog outputs which do offer some measure of protection. Further discussion of this topic is beyond the scope of this manual but Optec engineers will help plan a safe wiring strategy when requested.
OPERATING SEQUENCE DESCRIPTION 1
(OPERATE-1) Continuous 2 minute integrations with a clean air calibration approximately every 27 hours. A total of 810 integrations (1620 minutes total) with 15 minutes allotted to perform a clean air calibration. This mode is not synchronized with the real time clock but begins whenever the program is initiated.
2 (OPERATE-2)
A single 10-minute integration is initiated at the beginning of each hour. At 6, 12, and 18 hours a clean air calibration is performed. This mode is synchronized with the real time clock.
3 (OPERATE-3)
Begins with a clean air calibration and then performs a 2 minute integration followed by a 3 minute low power vent mode. This maintains the optical chamber at near ambient temperatures. A clean air calibration is performed approximately every 6 hours. This mode is synchronized with the real time clock to begin a reading a time divisible by 5. The start time is reported on the serial data line.
Table 3-3. Operating Sequences for Standalone operation.

18
SECTION 4.0
SERIAL COMMUNICATIONS
4.1 NGN-2A CONTROL PROGRAM Normal computer interface to the NGN-2A is with the NGN-2A control program which is a Microsoft windows based program that controls all aspects of the instrument. In addition to control, the program allows configuration of all operating variables and can be used as a data logging program. The program is freeware and the latest version is available for download from the Optec web site at: www.optecinc.com. Select the software download link from the NGN-2a page to download the latest version. Once installed, consult the help file for more information about the features and operation of the program.
4.2 BASIC PROGRAM COMMANDS
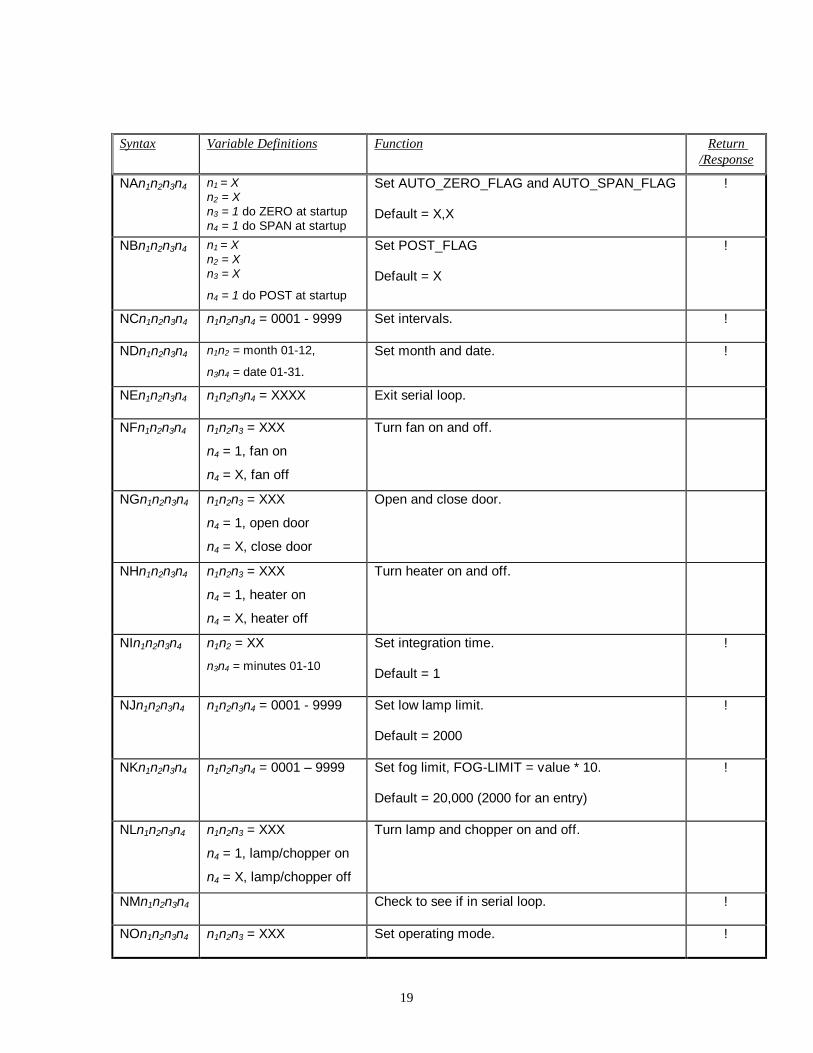
The following discussion is only for those who wish to write an interface or data logging program that uses the basic commands for the NGN-2A. Controlling and modifying the operating program on a basic level begins with the proper interfacing with a terminal or telecommunication program running on a PC computer. Read Section 3.4 first to insure proper connection to the NGN-2A computer. The TX line should also be connected. If a terminal program such as PROCOMM is used, it is necessary to configure the terminal program to “CHAT” mode so that all the characters in the command are sent in one data stream with minimum pause between characters. A number of functions can be controlled directly from the terminal keyboard including setting the real time clock, operating various mechanical functions to determine proper operation and starting a span gas or clean air calibration under user command. To operate the computer in the monitor mode, enter “NM” without the quotes. The computer may take up to 60 seconds before it interprets the entry from the keyboard. An "!" is returned when the program is in the program monitor mode. The monitor only accepts capital letters and numbers. Table 4-1 lists the important commands that can be used easily. After changes have been made, the command “NExxxx” where “x” can be anything will restart the operating program. The program will run from the start and incorporate any changes made while in the monitor program.
19
Syntax Variable Definitions Function Return
/Response
NAn1n2n3n4 n1 = X n2 = X n3 = 1 do ZERO at startup n4 = 1 do SPAN at startup
Set AUTO_ZERO_FLAG and AUTO_SPAN_FLAG
Default = X,X
!
NBn1n2n3n4 n1 = X n2 = X n3 = X
n4 = 1 do POST at startup
Set POST_FLAG
Default = X
!
NCn1n2n3n4 n1n2n3n4 = 0001 - 9999 Set intervals. !
NDn1n2n3n4 n1n2 = month 01-12,
n3n4 = date 01-31.
Set month and date. !
NEn1n2n3n4 n1n2n3n4 = XXXX Exit serial loop.
NFn1n2n3n4 n1n2n3 = XXX
n4 = 1, fan on
n4 = X, fan off
Turn fan on and off.
NGn1n2n3n4 n1n2n3 = XXX
n4 = 1, open door
n4 = X, close door
Open and close door.
NHn1n2n3n4 n1n2n3 = XXX
n4 = 1, heater on
n4 = X, heater off
Turn heater on and off.
NIn1n2n3n4 n1n2 = XX
n3n4 = minutes 01-10
Set integration time.
Default = 1
!
NJn1n2n3n4 n1n2n3n4 = 0001 - 9999 Set low lamp limit.
Default = 2000
!
NKn1n2n3n4 n1n2n3n4 = 0001 – 9999 Set fog limit, FOG-LIMIT = value * 10.
Default = 20,000 (2000 for an entry)
!
NLn1n2n3n4 n1n2n3 = XXX
n4 = 1, lamp/chopper on
n4 = X, lamp/chopper off
Turn lamp and chopper on and off.
NMn1n2n3n4 Check to see if in serial loop. !
NOn1n2n3n4 n1n2n3 = XXX Set operating mode. !

20
n4 = 1, 2, or 3
Default = 1
NPn1n2n3n4 n1n2n3 = XXX
n4 = 1, pump on
n4 = X, pump off
Turn pump on and off.
NRn1n2n3n4 n1n2n3n4 = XXXX Initialize DS1302 timer chip. !
NSn1n2n3n4 n1n2n3 = XXX
n4 = 1, solenoid on
n4 = X, solenoid off
Turn solenoid on and off.
NTn1n2n3n4 n1n2 = hours 01-24
n3n4 = minutes 01-59
Set time, hours and minutes. !
NUn1n2n3n4 n1n2 = XX
n3n4 = 00 – 99
Set DAC multiplier.
Default = 1
!
NVn1n2n3n4 n1n2n3 = XXX
n4 = 1, valve on
n4 = X, valve off
Turn valve on and off.
NWn1n2n3n4 n1n2 = XX
n3n4 = 00 – 99
Initiate a WORK reading, take a data point. n3n4
determine the number of intervals.
Line of data displayed when finished, STATUS = 1.
!
NXn1n2n3n4 n1n2n3n4 = XXXX Initiate a SPAN calibration routine.
Line of data displayed when finished, STATUS = 3.
NYn1n2n3n4 n1n2n3n4 = 1900 – 2099 Set year. !
NZn1n2n3n4 n1n2n3n4 = XXXX Initiate ZERO calibration routine.
Line of data displayed when finished, STATUS = 2.
n1 = A, Test A/D ports.
n1 = D, Test D/A ports.
n1 = T, Test temperature sensor, “NM” to stop.
n1 = P, Display POST information
n1 = R, Test rain sensor, 0 = no rain, 1 = rain.
N@n1n2n3n4
n1 = S, Do system test
n2n3n4 = XXX
Initiate various test routines
Table 4-1. Important Computer Commands and Their Use.

21
SECTION 5.0
SPECIFICATIONS
EXTINCTION RANGE 0 to 65,536 count (Serial Output) (typically equal to 0.01 to 24.00 km-1 after post processing)
0 to 10.00 volts (Analog Channel 1 or 2) (typically equal to 0.01 to 7.00 km-1 after post processing)
RESOLUTION ±1 count, (Serial Output) (one Rayleigh is approximately 12 counts)
±2.44 mv (Analog Channel 1 or 2) (one Rayleigh is ˜12.0 mv with multiplier = 1)
ACCURACY ±10% of true value for air near Rayleigh and using two minutes of integration (longer integrations will increase the S/N by INTEGRATION-½ ie. 10 minutes of integration will increase accuracy to ±4.5%)
MEASURED WAVELENGTH 550 nm Center Wavelength, 100 nm Bandwidth Photopic Response
OUTPUT, SERIAL RS-232, RX, TX, GND 8 data bits, 1 stop bit, no parity Televideo 920 emulation, FULL-DUPLEX mode 9600 baud default, others selected
OUTPUT DATA, SERIAL STATUS, Raw SCATTERED LIGHT Count, Raw LAMP BRIGHTNESS Count, NORMALIZED
SCATTERED LIGHT Count, INTEGRATION TIME in Minutes, TEMPERATURE, DATE in year:month:day, TIME in hour:minutes
OUTPUTS, ANALOG 2 analog channels 0 to 10.000 volt, 0.00244 volt steps or 0 to 5.000 volt, 0.00122 volt steps, jumper selected 2 Ω output impedance, current limited
OUTPUT DATA, ANALOG Channel 1: NORMALIZED SCATTERED LIGHT Channel 2: STATUS value (see Table 3-2.)
POWER SUPPLY 13.8±0.3 volt DC, 4.5 amps, regulation required. The unit will operate with an input voltage of 12.0 to
14.5 volts without shutting down.
OPERATING TEMPERATURE -20 to +45°C
SIZE 10.7 x 8.2 x 16.5 inches
WEIGHT 27 lbs.
FINISH high gloss white powered metal paint
A-1
Appendix A
NGN-1 & BELFORT 1590 COMPARISON
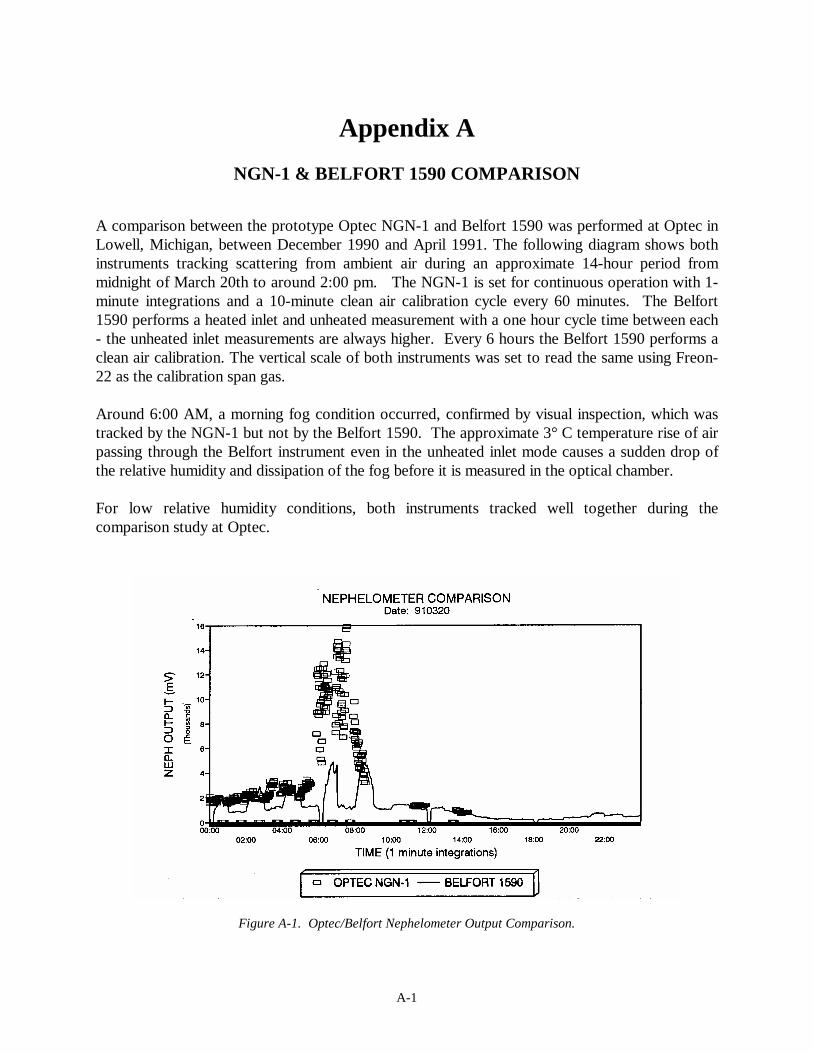
A comparison between the prototype Optec NGN-1 and Belfort 1590 was performed at Optec in Lowell, Michigan, between December 1990 and April 1991. The following diagram shows both instruments tracking scattering from ambient air during an approximate 14-hour period from midnight of March 20th to around 2:00 pm. The NGN-1 is set for continuous operation with 1-minute integrations and a 10-minute clean air calibration cycle every 60 minutes. The Belfort 1590 performs a heated inlet and unheated measurement with a one hour cycle time between each - the unheated inlet measurements are always higher. Every 6 hours the Belfort 1590 performs a clean air calibration. The vertical scale of both instruments was set to read the same using Freon-22 as the calibration span gas. Around 6:00 AM, a morning fog condition occurred, confirmed by visual inspection, which was tracked by the NGN-1 but not by the Belfort 1590. The approximate 3° C temperature rise of air passing through the Belfort instrument even in the unheated inlet mode causes a sudden drop of the relative humidity and dissipation of the fog before it is measured in the optical chamber. For low relative humidity conditions, both instruments tracked well together during the comparison study at Optec.
Figure A-1. Optec/Belfort Nephelometer Output Comparison.

B-1
Appendix B
SPAN GAS CALIBRATION
Span gas calibrations have been performed with Helium, Argon, Clean Air, Carbon Dioxide, Freon-22 and Freon-12. The prototype NGN-1 output, like the production Model NGN-2A output, is shown to be extremely linear when plotted with the known scattering coefficients of these gases.
Figure B-1. NGN-1 Output with Various Span Gases.

C-1
Appendix C
WIRING DIAGRAM

C-2

D-1
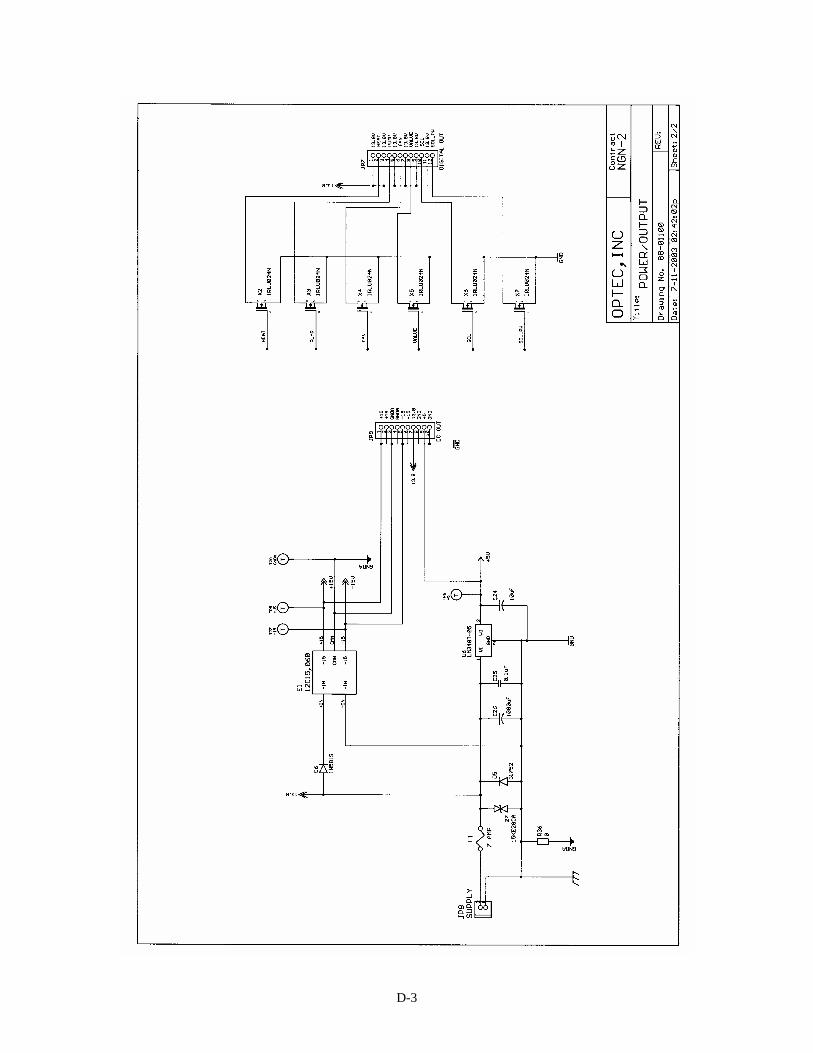
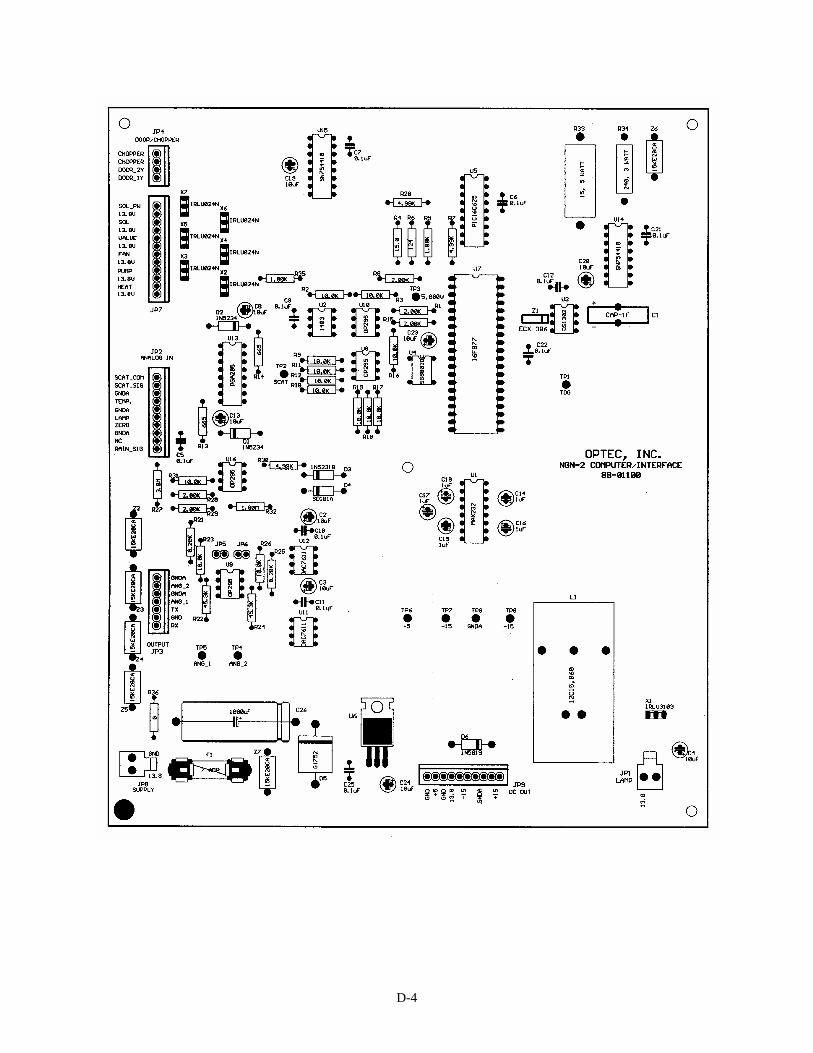
Appendix D
COMPUTER / INTERFACE BOARD

D-2
D-3
D-4

E-1
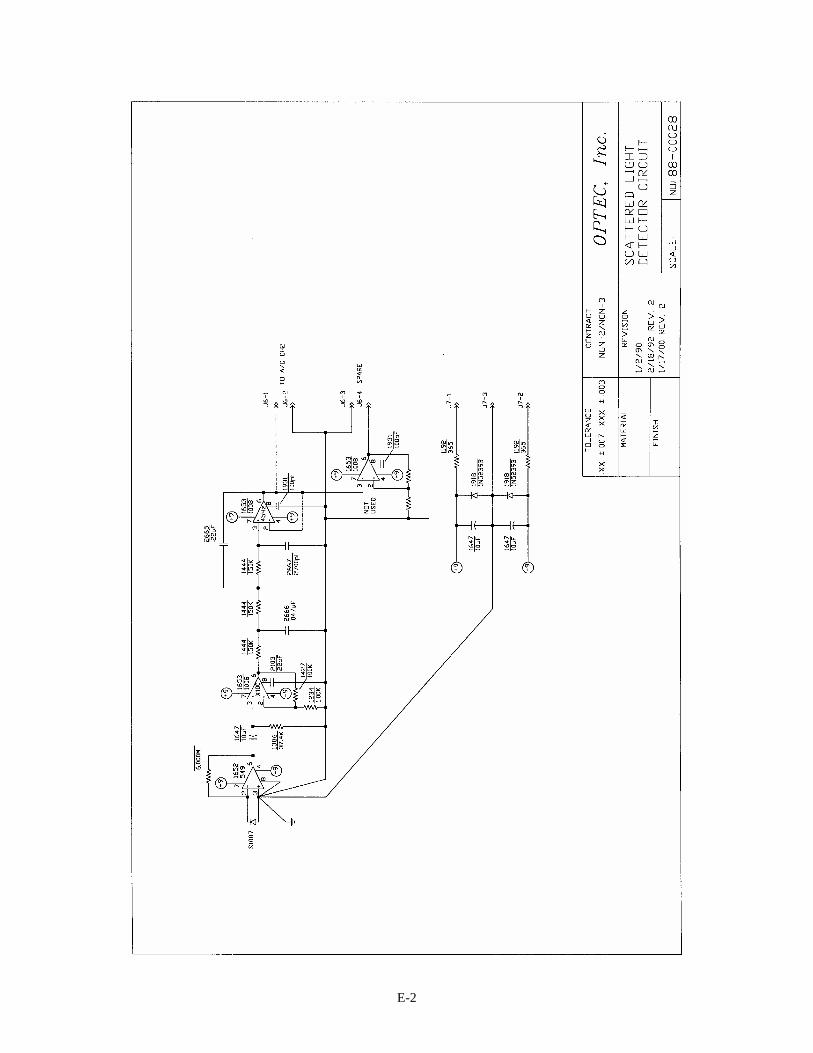
Appendix E
SCATTER LIGHT BOARD
E-2

E-3

E-4

F-1
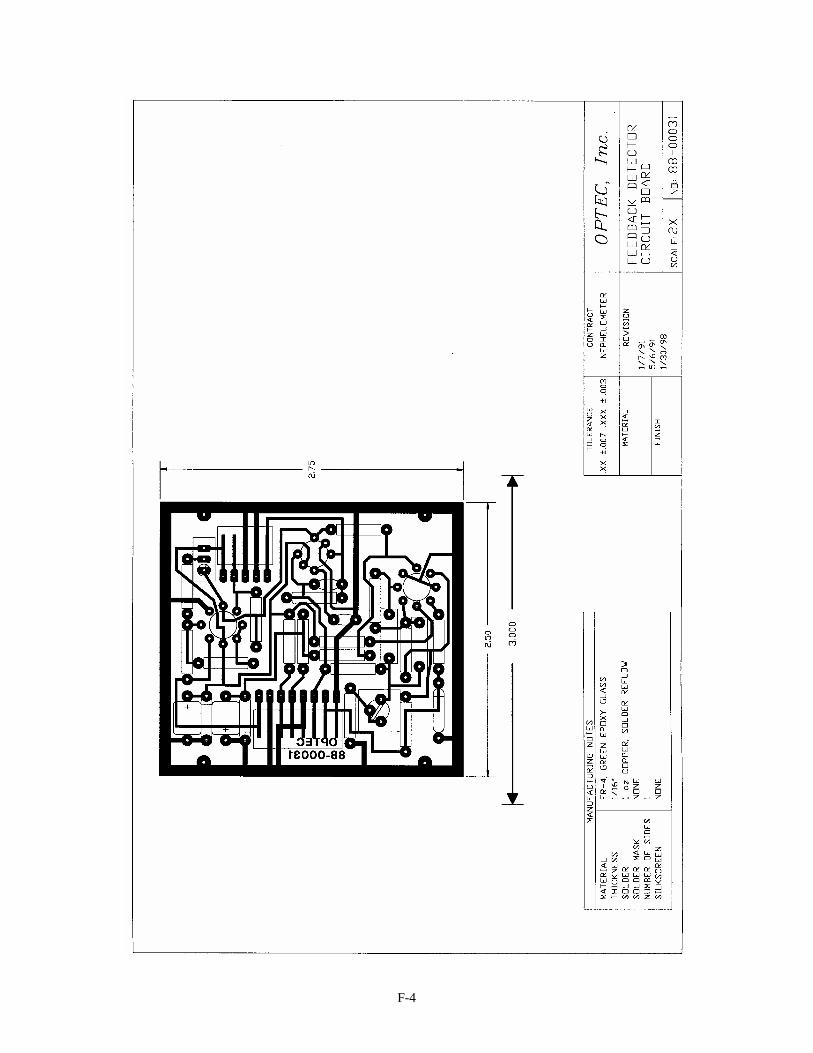
Appendix F
FEEDBACK LIGHT BOARD

F-2

F-3
F-4

G-1
Appendix G
SPAN GAS APPARATUS

G-2

H-1
Appendix H
13.8 VDC POWER SUPPLY
For AC installations, the 13.8 V DC power supply (Optec stock #86905) is required. This power supply measures 8 x 6 x 2 inches and will accept any of two switched inputs of 90-132 VAC 50/60Hz or 180-264 VAC 50/60 Hz. The unit will supply 13.8±0.3 VDC at up to 10 amps to the NGN-2/3 nephelometer. Two different output connectors are available depending on distance to the nephelometer. For distances up to 20 feet, connection to the 4-pin Amp circular connector is recommended. Parts for the plug with crimp terminals compatible with 16 or 18 AWG wire are included with the power supply. Connect as follows:
Pin 1 (not connected) Pin 2 +13.8 VDC Pin 3 13.8 V return Pin 4 (not connected)
For distances greater than 20 feet, connection to the banana jacks are recommended to limit voltage loss due to the resistance of the power cable. Use of 12 AWG wire would allow the power supply to be mounted 50 feet from the nephelometer. Of course, the wire size would have to be reduced to 18 or 16 AWG near the nephelometer to accommodate the terminals to the circular connector going into the instrument. Connect as follows:
Red terminal +13.8 VDC Black terminal 13.8 V return