nhdc additional development assessment · technical note direct tel: +44 (0)121 262 1985 t +44...
TRANSCRIPT

Technical Note
Direct Tel: +44 (0)121 262 1985
T +44 (0)121 262 1900
F +44 (0)121 262 1999
www.aecom.com
Colmore Plaza
Colmore Circus Queensway
Birmingham B4 6AT
United Kingdom
Page: 1 of 27
\\ukbhm2fp001\UKBHM2FP001-V1TP\TP\PROJECT\Transport Planning - Hitchin Urban Transport Plan\17 - NHDC Addtional Site\Reporting\TN-NHDC Additional
Development Assessment_200613_v3.docx
Project: Hertfordshire County Council Transport
Planning Contract
Job No: 60271338
Subject: North Hertfordshire District Council Additional Housing Assessment
Prepared by: Abigail Finch Date: 23/06/13
Checked/
revised by:
Adrian Hewitt Date: 25/06/13
Approved by: Nick Secker Date: 01/07/13
1 Introduction
AECOM was asked by North Hertfordshire District Council (NHDC) to look at future transport issues in
the Borough resulting from new housing development proposals. This assessment focuses on the
evaluation of two large development sites; one East of Luton and one north of Baldock along with a
small number of dwellings between Little Wymondley, Todds Green and Stevenage.
To inform the model testing the Stevenage and Hitchin UTP Model (SHUM) has been utilised. This
model covers the whole of the Stevenage Borough and the majority of the North Hertfordshire District
around Hitchin, Letchworth and Baldock. The locations of the two main development sites fall outside
the core model area, therefore it is not possible to assess the developments impacts on the immediate
road network surrounding the sites. Instead, the developments are assessed by way of their impact on
key routes in the vicinity of the sites, within the core SHUM network area. The impact will also be
evaluated at particular network pinch points that were identified in the previous work from the NHDC
Local Development Framework Housing Assessment undertaken in November 2012.
The development proposal identified one housing development scenario to be considered for the future
year 2031. This scenario is referred to as Scenario 6 following on from the previous housing
assessment undertaken in November 2012, discussed below. The scenarios development components
are:
Scenario 6: North of Baldock and East of Luton
a. 4,700 baseline dwellings (commitments plus priority 1 and 2 sites from the SHLAA
assessment);
b. 3,000 dwellings east of Luton;
c. 3,000 dwellings north of Baldock; and
d. 400 between Little Wymondley/Todds Green and Stevenage
This technical note serves two key purposes:
• Firstly, to explain the stages undertaken during the forecasting of the future year development
demand (Section 2 to 4).
• Secondly, to present details of potential transport issues on the highway network as a result of
additional housing development proposals (Section 5).
2 Background
The Stevenage and Hitchin Urban Transport Model (SHUM), covering Stevenage and some of the North
Hertfordshire area (primarily Hitchin, with elements of Letchworth included) was developed by AECOM
in 2009 and subsequently updated in October 2011 following a review and advice from the Highways
Agency (HA). SHUM was developed to assist the preparation of the Hitchin and Stevenage Urban
Transport Plans (UTP) and is validated to a 2008 base against observed traffic count data and journey
times. The HA signed off the 2008 base year model (October 2011 version) on 8th December 2011.
Technical Note
Page: 2 of 27 Doc. F8/10 Revised: April 2009
\\ukbhm2fp001\UKBHM2FP001-V1TP\TP\PROJECT\Transport Planning - Hitchin Urban Transport Plan\17 - NHDC Addtional Site\Reporting\TN-NHDC Additional
Development Assessment_200613_v3.docx
It should be noted that the development that has taken place with the modelled study area between
2008 and 2011 has been incorporated within the model to ensure that it robustly reflects the today’s
base year situation. This therefore means there may appear to be slight discrepancies between
modelled development figures and those numbers included in the Local Plan. Using SHUM in
forecasting mode seeks to determine the impact on the future transport network as a consequence of
shifting patterns of demand over time, and forms the basis of the forecasting and analysis of the
additional housing development proposal.
In November 2012, AECOM was asked by North Hertfordshire District Council (NHDC) to identify future
transport issues in the district, in response to housing development proposals forecast as part of the
scenario testing to inform the development of Local Plan allocations. A series of 5 development
scenarios were tested and it was found that many of the resulting highway problems were consistent between
each situation, as particular pinch points on the network act as constraints to effective operation of the network. The
outcome was the establishment of some mitigation proposals to address the problems and enable the growth to
come forward. The latest assessment follows on from that work, evaluating the new development scenario in
reference to the pinch point.
3 Network Development
This section discusses the extent of the future year highway network, including constructed and
committed infrastructure.
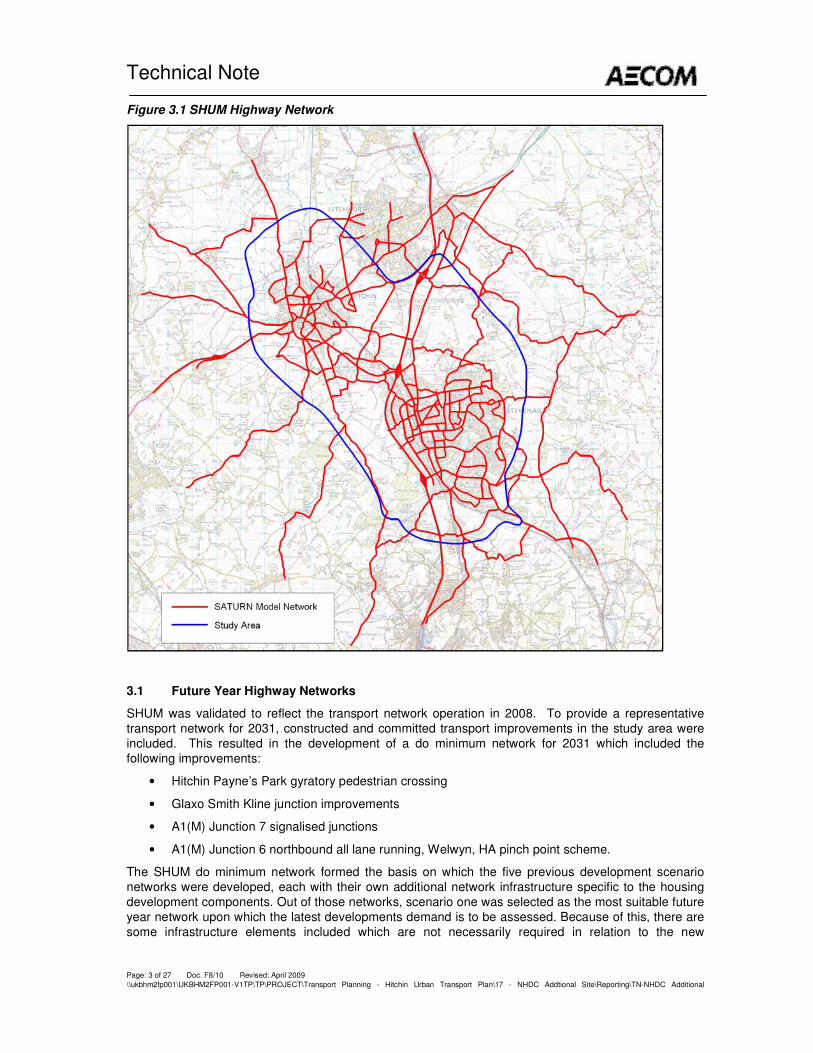
As discussed, the basis for the model forecasting was SHUM, which covers North Hertfordshire and Stevenage, with the extent of the highway network shown in Figure 3.1.
Technical Note
Page: 3 of 27 Doc. F8/10 Revised: April 2009
\\ukbhm2fp001\UKBHM2FP001-V1TP\TP\PROJECT\Transport Planning - Hitchin Urban Transport Plan\17 - NHDC Addtional Site\Reporting\TN-NHDC Additional
Development Assessment_200613_v3.docx
Figure 3.1 SHUM Highway Network
3.1 Future Year Highway Networks
SHUM was validated to reflect the transport network operation in 2008. To provide a representative
transport network for 2031, constructed and committed transport improvements in the study area were
included. This resulted in the development of a do minimum network for 2031 which included the
following improvements:
• Hitchin Payne’s Park gyratory pedestrian crossing
• Glaxo Smith Kline junction improvements
• A1(M) Junction 7 signalised junctions
• A1(M) Junction 6 northbound all lane running, Welwyn, HA pinch point scheme.
The SHUM do minimum network formed the basis on which the five previous development scenario
networks were developed, each with their own additional network infrastructure specific to the housing
development components. Out of those networks, scenario one was selected as the most suitable future
year network upon which the latest developments demand is to be assessed. Because of this, there are
some infrastructure elements included which are not necessarily required in relation to the new

Technical Note
Page: 4 of 27 Doc. F8/10 Revised: April 2009
\\ukbhm2fp001\UKBHM2FP001-V1TP\TP\PROJECT\Transport Planning - Hitchin Urban Transport Plan\17 - NHDC Addtional Site\Reporting\TN-NHDC Additional
Development Assessment_200613_v3.docx
development scenario. Given their location it is not expected to have an effect on the assessment of
these sites.
4 Demand Development
An important part of forecasting the likely traffic conditions on the highway network includes
understanding changes to travel demand. Demand changes are a reflection of changes in income,
transport prices, demographics and land use changes. The methodology employed for developing the
forecast demand matrices for the 2031 future year is discussed below.
The methodology can be broken down into four stages. Stage 1 of the process is the same, irrespective
of the level of future year development. However, details of Stages 2 to 4 differ depending on the
development scenario being tested.
• Stage 1 – Development of background growth factors for internal to internal (within the modelled
area) and internal to external trips. These factors were derived using the National Trip End
Model (NTEM) forecasts and TEMPRO. The latest version of the dataset, NTEM 6.2 was used
in conjunction with the current version of TEMPRO 6.2. This ensured the forecasts benefit from
nationally and locally derived growth projections in accordance with government guidance. For
external to external movements, the East of England Regional Model (EERM) version 1.3
forecasts were used to provide growth factors. The growth factors were applied to the 2008
calibrated SHUM base year demand through a Furnessing process.
• Stage 2 – Collection and assessment of development information in the area is undertaken to
calculate the number of trips that specific developments can be expected to generate. These
trips are then allocated to a relevant model year (2031 in this instance), development scenarios
and trip demand purposes.
• Stage 3 – The trip distribution for the development trips is determined using a gravity model.
• Stage 4 – The future background growth (Stage 1) and proposed development trips (Stage 2
and 3) are added to the base year demand to produce final future year trip demand matrices.
Trips were not constrained back to TEMPRO growth.
Two separate sets of matrices have been created for the assessment; a reference case and
development scenario 6 (DS), both built from the future year demand defined in scenario one. The
reference case demand takes the scenario one demand but removes the specific housing development
components and leaving in the 4,700 baseline dwellings which are consistent across all the
development scenarios.
For development Scenario 6 the demand is the sum of the reference case demand plus the new
housing allocations:
a. 3,000 dwellings east of Luton;
b. 3,000 dwellings north of Baldock; and
c. 400 between Little Wymondley/Todds Green and Stevenage.
On account of the east of Luton development being located outside of the SHUM modelled network
area, the decision was taken to assume that 50% (1,500) of the trip associated with housing allocation
would enter the SHUM modelled network, based on the assumption that not all the traffic generated by
the development will travel through the model area. Also, it was assumed that the routes that the
development traffic would use meant the dwellings were split across two external model zones which
represent traffic travelling along the A505, and B565 London Road via Preston Road. Dwellings were
proportioned out 90%/10% to A505 and B565 respectively.
A similar approach has been applied to the development quantum for North of Baldock as it primarily
falls outside the model area. In this instance, 70% of the trips associated with the dwellings (2,100) have
been assumed to enter the SHUM modelled network.
The 400 dwellings specified for Little Wymondley, Todds Green and Stevenage was initially evenly split
across the three areas, then the Stevenage proportion (133 dwellings) further disaggregated across 48

Technical Note
Page: 5 of 27 Doc. F8/10 Revised: April 2009
\\ukbhm2fp001\UKBHM2FP001-V1TP\TP\PROJECT\Transport Planning - Hitchin Urban Transport Plan\17 - NHDC Addtional Site\Reporting\TN-NHDC Additional
Development Assessment_200613_v3.docx
previously identified development sites within the core area of Stevenage. This equates to 2.77
additional dwellings per development site. Table 4.1 summarises, by development site, the housing
quantities applied and the zones it was allocated to. Appendix A contains the full list of development
sites included as future year demand.
Table 4.1 Housing quantum and zone allocations
Development Sites Dwellings Zone
East of Luton – along A505 1,350 4310
East of Luton – along B565 150 4309
North of Baldock 2,100 4315
Little Wymondley 133 3302
Todds Green 133 3303
Stevenage 133 Multiple
Total Dwellings 4,000 -
The outcome of the anticipated levels of growth between the Base Year of 2008 and the future year of
2031, for the reference case and development scenario, are summarised in Table 4.2. This shows that
there is a growth in traffic levels across the model area of around 40% in 2031, and that the proposed
quantum of housing yields a 3% increase in trips. Table 4.3 provides a breakdown of demand by user
class.
Table 4.2 Summary of growth in demand in the model area for each Scenario
Peak Base Year (2008)
Matrix Total
Ref. Case
2031
DS
2031
Additional
Trips
AM 40,001 53,868 55,447 1,580 (3%)
% growth over base year - 35% 39% -
PM 38,624 53,099 54,758 1,660 (3%)
% growth over base year - 37% 42% -
Note: DS 2031 represents the new housing scenario with sites east of Luton, north of Baldock and Little
Wymondley and Todds Green.
Table 4.3 2031 Peak Demand Matrices (Vehicles)
AM Peak PM Peak
Journey Purpose Ref Case Development
Scenario
Ref Case Development
Scenario
Home Based Work 30568 31512 21757 22581
Home Based Education 2616 2717 1418 1498
Home Based Other 8266 8672 15808 16406
Non Home Based 3091 3190 6477 6613
Employers Business 2040 2069 1747 1769
LGV 4786 4786 4430 4430
HGV 2501 2501 1460 1460

Technical Note
Page: 6 of 27 Doc. F8/10 Revised: April 2009
\\ukbhm2fp001\UKBHM2FP001-V1TP\TP\PROJECT\Transport Planning - Hitchin Urban Transport Plan\17 - NHDC Addtional Site\Reporting\TN-NHDC Additional
Development Assessment_200613_v3.docx
Total 53,868 55,447 53,099 54,758
5 Scenario Testing
This section discusses the transport impact of the new housing development scenario on the highway
network along routes in the vicinity of the sites and at particular network pinch points.
The new demand forecasts were assigned to the SHUM model 2031 network for the AM peak (08:00-
09:00) and PM peak (16:00-17:00) hour. Outputs generated for use in analysing the impacts include a
number of plots displaying changes in assigned traffic volumes, changes in junction delays and out-turn
volume over capacity ratios (V/C%) for key routes in the vicinity of the sites.
The analysis has shown in the vicinity of the sites that the additional development trips do not have an
overly significant impact on the performance of the network beyond its condition without them. Sizable
increases in vehicle flows have been seen along the main routes from the sites as shown in Figures 5.1
to 5.3 below for the AM peak, it’s a similar picture in the PM Peak (Appendix B.1-B.3). Flows across
the rest of the network do not show many significant changes, typically changing by less than 50 PCU’s
(car equivalents). This demonstrates that the developments are not causing large re-routing of trips
beyond the immediate vicinity of the sites.

Technical Note
Page: 7 of 27 Doc. F8/10 Revised: April 2009
\\ukbhm2fp001\UKBHM2FP001-V1TP\TP\PROJECT\Transport Planning - Hitchin Urban Transport Plan\17 - NHDC Addtional Site\Reporting\TN-NHDC Additional
Development Assessment_200613_v3.docx
Figure 5.1 AM Peak East of Luton Area difference in flows
Figure 5.2 AM Peak North of Baldock Area difference in flows
Key
Increase in link flow from Ref. Case
Decrease in link flow from Ref. Case
Key
Increase in link flow from Ref. Case
Decrease in link flow from Ref. Case
East of Luton Site
North of Baldock Site
A505
B655
A602
B656
Preston Rd
A505
A507
Stotfold Rd
B656 Royston Rd
A1(M)
Hatch La
Technical Note
Page: 8 of 27 Doc. F8/10 Revised: April 2009
\\ukbhm2fp001\UKBHM2FP001-V1TP\TP\PROJECT\Transport Planning - Hitchin Urban Transport Plan\17 - NHDC Addtional Site\Reporting\TN-NHDC Additional
Development Assessment_200613_v3.docx
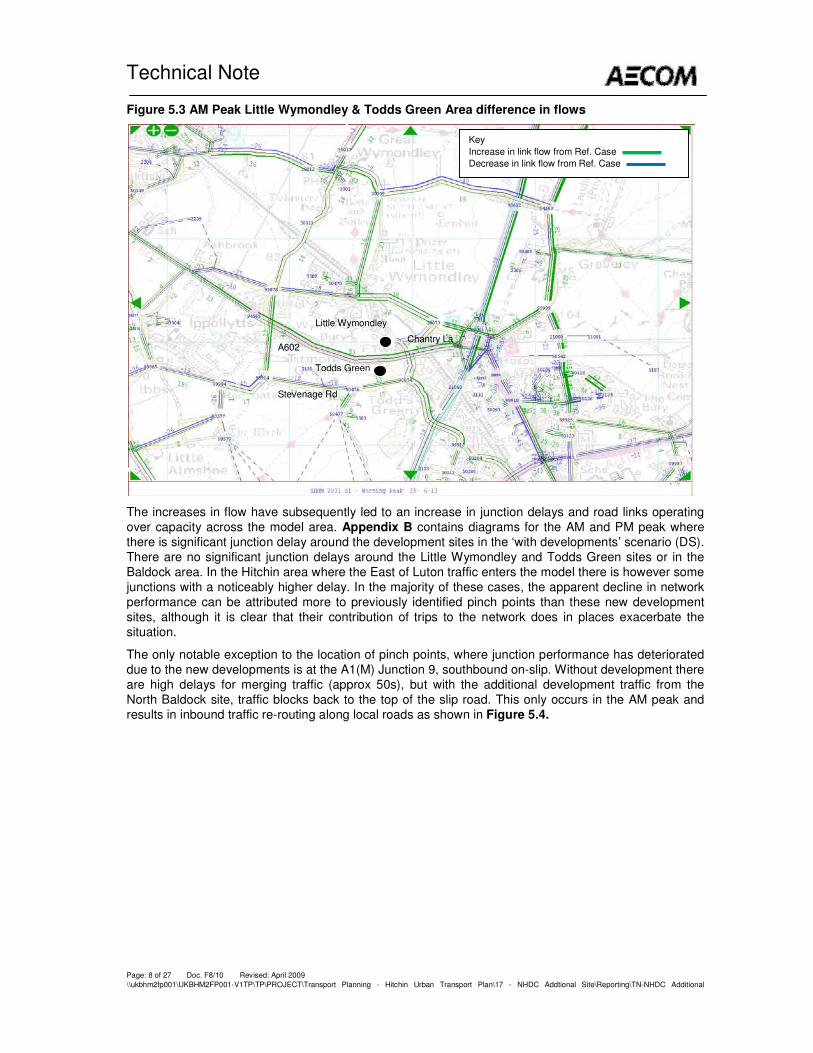
Figure 5.3 AM Peak Little Wymondley & Todds Green Area difference in flows
The increases in flow have subsequently led to an increase in junction delays and road links operating
over capacity across the model area. Appendix B contains diagrams for the AM and PM peak where
there is significant junction delay around the development sites in the ‘with developments’ scenario (DS).
There are no significant junction delays around the Little Wymondley and Todds Green sites or in the
Baldock area. In the Hitchin area where the East of Luton traffic enters the model there is however some
junctions with a noticeably higher delay. In the majority of these cases, the apparent decline in network
performance can be attributed more to previously identified pinch points than these new development
sites, although it is clear that their contribution of trips to the network does in places exacerbate the
situation.
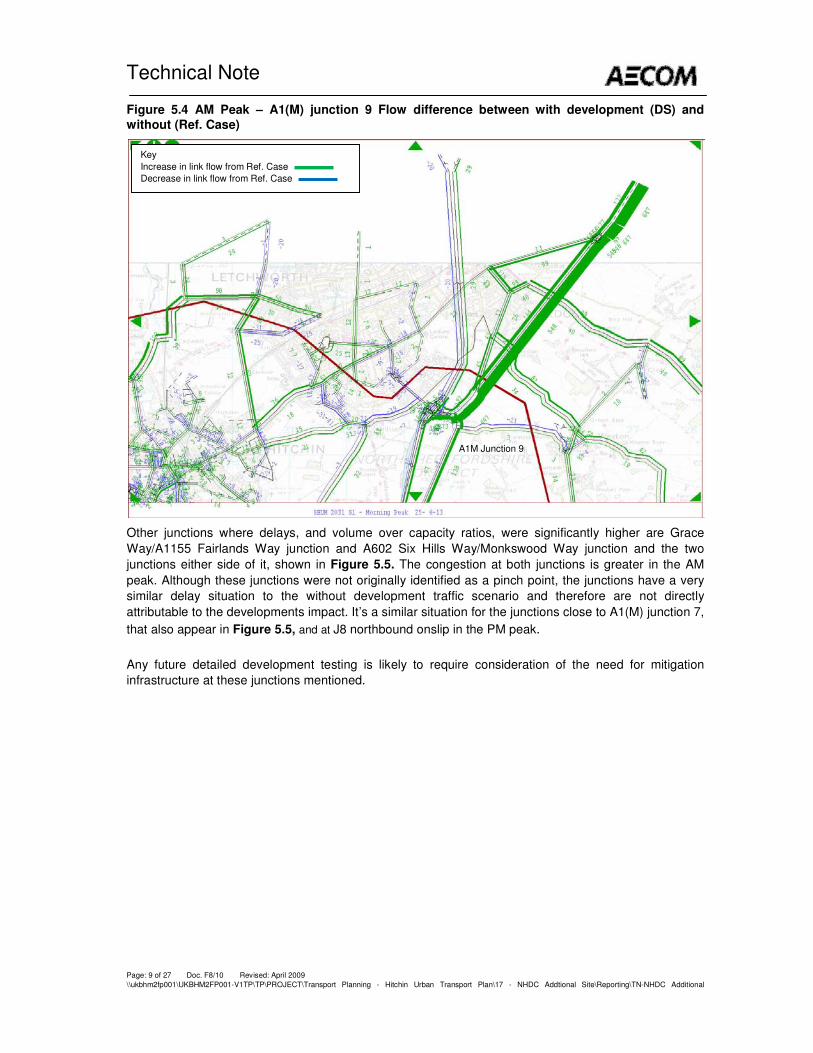
The only notable exception to the location of pinch points, where junction performance has deteriorated
due to the new developments is at the A1(M) Junction 9, southbound on-slip. Without development there
are high delays for merging traffic (approx 50s), but with the additional development traffic from the
North Baldock site, traffic blocks back to the top of the slip road. This only occurs in the AM peak and
results in inbound traffic re-routing along local roads as shown in Figure 5.4.
Key
Increase in link flow from Ref. Case
Decrease in link flow from Ref. Case
Todds Green
Little Wymondley
A602 Chantry La
Stevenage Rd
Technical Note
Page: 9 of 27 Doc. F8/10 Revised: April 2009
\\ukbhm2fp001\UKBHM2FP001-V1TP\TP\PROJECT\Transport Planning - Hitchin Urban Transport Plan\17 - NHDC Addtional Site\Reporting\TN-NHDC Additional
Development Assessment_200613_v3.docx
Figure 5.4 AM Peak – A1(M) junction 9 Flow difference between with development (DS) and
without (Ref. Case)
Other junctions where delays, and volume over capacity ratios, were significantly higher are Grace
Way/A1155 Fairlands Way junction and A602 Six Hills Way/Monkswood Way junction and the two
junctions either side of it, shown in Figure 5.5. The congestion at both junctions is greater in the AM
peak. Although these junctions were not originally identified as a pinch point, the junctions have a very
similar delay situation to the without development traffic scenario and therefore are not directly
attributable to the developments impact. It’s a similar situation for the junctions close to A1(M) junction 7,
that also appear in Figure 5.5, and at J8 northbound onslip in the PM peak.
Any future detailed development testing is likely to require consideration of the need for mitigation
infrastructure at these junctions mentioned.
Key
Increase in link flow from Ref. Case
Decrease in link flow from Ref. Case
A1M Junction 9

Technical Note
Page: 10 of
27 Doc. F8/10 Revised: April 2009
\\ukbhm2fp001\UKBHM2FP001-V1TP\TP\PROJECT\Transport Planning - Hitchin Urban Transport Plan\17 - NHDC Addtional Site\Reporting\TN-NHDC Additional
Development Assessment_200613_v3.docx
Figure 5.5 AM Peak Reference Case significant junction delays.
5.1 Pinch Points
Particular pinch points on the network act as constraints to effective operation of the network.
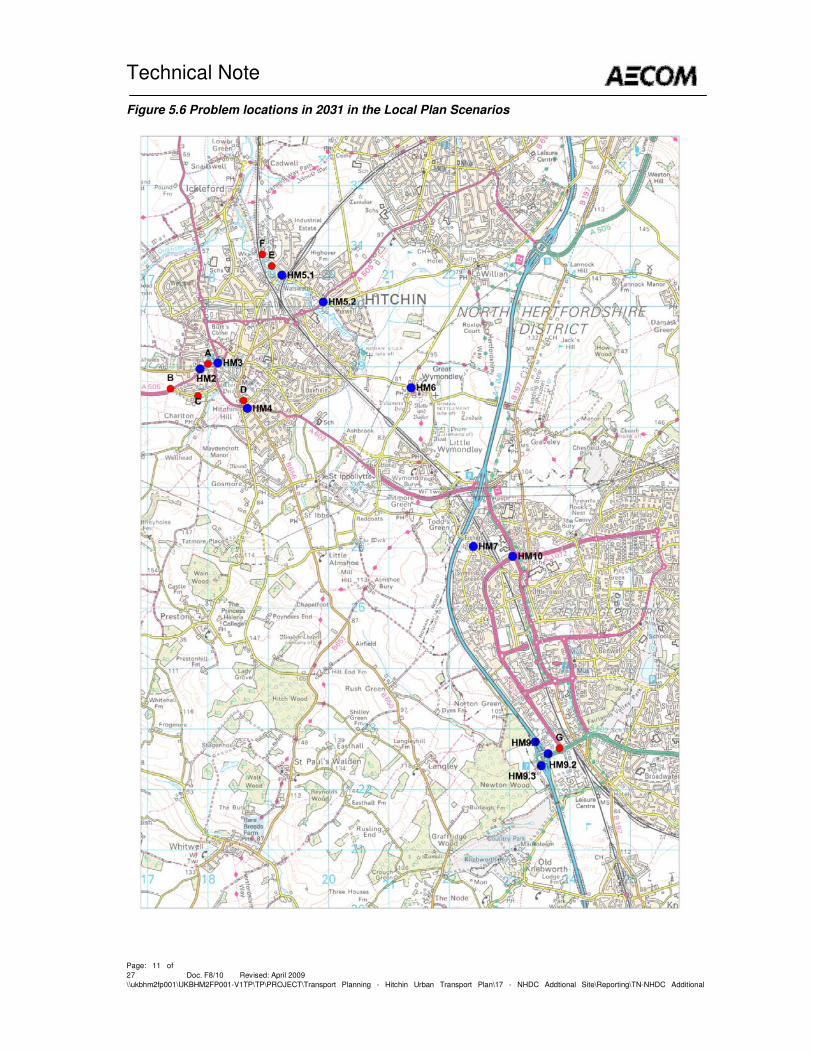
The diagram Figure 5.6 identifies where the model analysis has indicated that in 2031 there is a problem with network operation which corresponds with those junctions identified as pinch points in LDF
Housing Assessment undertaken in November 2012. The junctions have been identified through
modelling indicators which show where there are still more than 100 vehicles queuing at the end of the
AM or PM peak hour. There are a range of indicators that could be used, but queuing traffic at particular
locations at the end of the modelled peak hour enables us to focus on the pinch points on the network
and identify in more detail what the issues are.
Grace Way
Six Hills Way
A602 Broadhall Way A1(M) Junction 7
Technical Note
Page: 11 of
27 Doc. F8/10 Revised: April 2009
\\ukbhm2fp001\UKBHM2FP001-V1TP\TP\PROJECT\Transport Planning - Hitchin Urban Transport Plan\17 - NHDC Addtional Site\Reporting\TN-NHDC Additional
Development Assessment_200613_v3.docx
Figure 5.6 Problem locations in 2031 in the Local Plan Scenarios
Technical Note
Page: 12 of
27 Doc. F8/10 Revised: April 2009
\\ukbhm2fp001\UKBHM2FP001-V1TP\TP\PROJECT\Transport Planning - Hitchin Urban Transport Plan\17 - NHDC Addtional Site\Reporting\TN-NHDC Additional
Development Assessment_200613_v3.docx
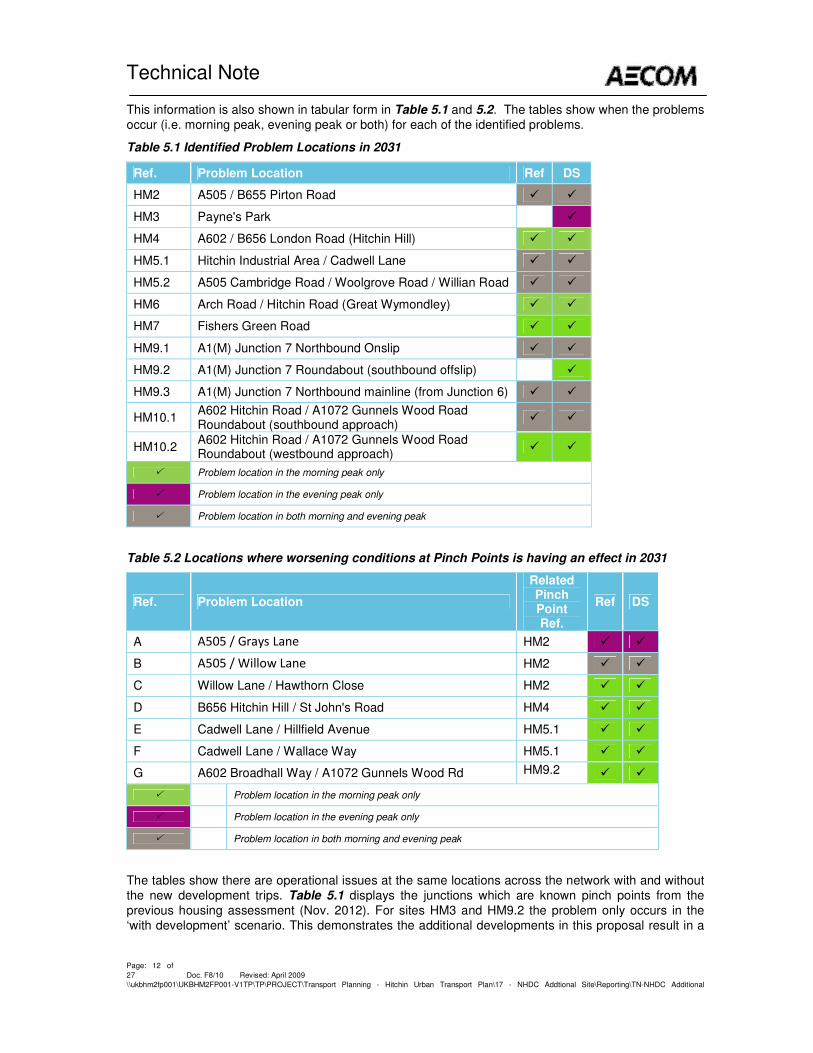
This information is also shown in tabular form in Table 5.1 and 5.2. The tables show when the problems
occur (i.e. morning peak, evening peak or both) for each of the identified problems.
Table 5.1 Identified Problem Locations in 2031
Ref. Problem Location Ref DS
HM2 A505 / B655 Pirton Road � �
HM3 Payne's Park
�
HM4 A602 / B656 London Road (Hitchin Hill) � �
HM5.1 Hitchin Industrial Area / Cadwell Lane � �
HM5.2 A505 Cambridge Road / Woolgrove Road / Willian Road � �
HM6 Arch Road / Hitchin Road (Great Wymondley) � �
HM7 Fishers Green Road � �
HM9.1 A1(M) Junction 7 Northbound Onslip � �
HM9.2 A1(M) Junction 7 Roundabout (southbound offslip)
�
HM9.3 A1(M) Junction 7 Northbound mainline (from Junction 6) � �
HM10.1 A602 Hitchin Road / A1072 Gunnels Wood Road Roundabout (southbound approach)
� �
HM10.2 A602 Hitchin Road / A1072 Gunnels Wood Road Roundabout (westbound approach)
� �
� Problem location in the morning peak only
� Problem location in the evening peak only
� Problem location in both morning and evening peak
Table 5.2 Locations where worsening conditions at Pinch Points is having an effect in 2031
Ref. Problem Location
Related Pinch Point Ref.
Ref DS
A A505 / Grays Lane HM2 � �
B A505 / Willow Lane HM2 � �
C Willow Lane / Hawthorn Close HM2 � �
D B656 Hitchin Hill / St John's Road HM4 � �
E Cadwell Lane / Hillfield Avenue HM5.1 � �
F Cadwell Lane / Wallace Way HM5.1 � �
G A602 Broadhall Way / A1072 Gunnels Wood Rd HM9.2 � �
� Problem location in the morning peak only
� Problem location in the evening peak only
� Problem location in both morning and evening peak
The tables show there are operational issues at the same locations across the network with and without
the new development trips. Table 5.1 displays the junctions which are known pinch points from the
previous housing assessment (Nov. 2012). For sites HM3 and HM9.2 the problem only occurs in the
‘with development’ scenario. This demonstrates the additional developments in this proposal result in a

Technical Note
Page: 13 of
27 Doc. F8/10 Revised: April 2009
\\ukbhm2fp001\UKBHM2FP001-V1TP\TP\PROJECT\Transport Planning - Hitchin Urban Transport Plan\17 - NHDC Addtional Site\Reporting\TN-NHDC Additional
Development Assessment_200613_v3.docx
further exacerbation of the network problems. The mitigation options proposed for those pinch point
junctions from the previous assessment will be even more critical under the current development
proposals.
Table 5.2 highlights additional junctions found to have queues over 100 vehicles as a knock on effect of
the pinch point junctions. In these instances, pinch points HM2 and HM5.1 are the contributors to the
deterioration of these additional junctions. The excessive delays at the pinch points and their
neighbouring junctions are shown by the blue circles in Figures 5.7 below. The size of the circles
represents the size of delay.
A602 Broadhall Way / A602 Monkswood Way (Eastbound approach) is the only junction with more than
100 vehicles queuing at the end of the period but not obviously related to any pinch point. It was
however identified to be a problem in the Stevenage Core Strategy Testing work conducted in April 2013
and mitigation in the form of a traffic signal upgrade was recommended.
Figure 5.7 DS AM Peak Junction Delay in East Luton Area
6.0 Summary
The additional development assessment for 2031, highlights that there will be a number of highway
impacts across the network when the developments are in place, and not all of them concentrated in the
vicinity of the development sites. Despite this, no new junction problems were identified in this
assessment. Rather, the development traffic only seems to exacerbate pre-existing problems in the
network. This demonstrates that the highway networks performance does not significantly decline as a
direct impact of the additional development traffic. It should be noted that some coarse assumptions
have been made about the level of traffic that will enter the SHUM network from these development
sites, and variations in these assumptions may alter this conclusion,
It is important to note, this assessment is not able to specifically identify the highway impacts that occur
immediately surrounding the development sites for East of Luton and North of Baldock because of their
location outside of the model network. Instead this assessment provides a broad overview of potential
problem locations identified in the future year of 2031, when specific housing development scenarios are
in place. Any further assessment, relating to a particular scenario would require further testing to fully
Cadwell Lane
B655
A505
A602
Hitchin Hill

Technical Note
Page: 14 of
27 Doc. F8/10 Revised: April 2009
\\ukbhm2fp001\UKBHM2FP001-V1TP\TP\PROJECT\Transport Planning - Hitchin Urban Transport Plan\17 - NHDC Addtional Site\Reporting\TN-NHDC Additional
Development Assessment_200613_v3.docx
understand the potential of any transport intervention(s) relating to a land-use scenario or individual
development components.