nhs gp practices
TRANSCRIPT
Intelligent Monitoring
NHS GP practices
Indicators and methodology
December 2014

Page 1 of 39
Contents
Contents ............................................................................................................................. 1
Introduction ........................................................................................................................ 2
Summary statistics for each practice .............................................................................. 4
Background information on intelligent monitoring for GPs .......................................... 5
Descriptions of the indicators .......................................................................................... 7
Effective ............................................................................................................................... 7
Caring ................................................................................................................................ 29
Responsive ........................................................................................................................ 36
List of data providers ...................................................................................................... 38
Appendix: MyNHS GP Scorecard ................................................................................... 39

Page 2 of 39
Introduction
The Care Quality Commission (CQC) has developed a new model for monitoring a range of key indicators for NHS GP practices. These indicators relate to the five key questions we will ask of all services – are they safe, effective, caring, responsive, and well-led. This guidance provides the full details for each indicator used in the model and explains how we have created an overall ‘priority band for inspection’ for each individual NHS GP practice. We will use our analysis of these indicators to raise questions, not make judgements, about the quality of care. Our judgements will always follow inspections, which take into account the results of our intelligent monitoring and reports from other organisations. This is the first version of the indicators that we will use to help monitor quality in NHS GP practices. We have developed this set of indicators through consultation and testing – for further details please refer to the “NHS GP practices and GP out-of-hours services provider handbook” (October 2014). For the majority of indicators, we use data from each practice to see the difference between its actual performance and what we would expect to see. We do this using a ‘z-score’. We use this score to allocate each indicator to the following three levels using a set of thresholds, for each NHS GP practice:
‘no evidence of risk’
‘risk’
‘elevated risk’
The indicators that do not use a ‘z-score’ to determine these three levels are ones that are based on categorical data: For these indicators, we have determined the level of risk according to a set of rules.
All the indicators used are statistically combined into six priority bands for inspection. We
do this by:
Calculating the number of indicators identified as ‘risk’ and ‘elevated risk’ and then weighting it to ensure that ‘elevated risks’ have a greater impact on the banding.
Dividing this by the score that would have been calculated if every indicator were identified as ‘elevated risk’.
Applying thresholds to allocate the resulting proportion to a band, where Band 1 indicates the highest priority for inspection.
For full details concerning how we have calculated the priority bands for inspection, see the section, ‘Summary statistics for each practice’.
Page 3 of 39
This guidance details how we have created the summary view for each NHS GP practice as well as the individual indicator definitions. For each indicator we explain:
how the numerator and denominator have been constructed,
how we have determined ‘risk’, ‘elevated risk’ and ‘no evidence of risk’,
the time period of the data source, and
the data source and links to the original source (where this is available).
There is also a separate methodology document to supplement this document which describes the statistical methods we have used, including how we have determined ‘z-scores’ for different indicator types.
Page 4 of 39
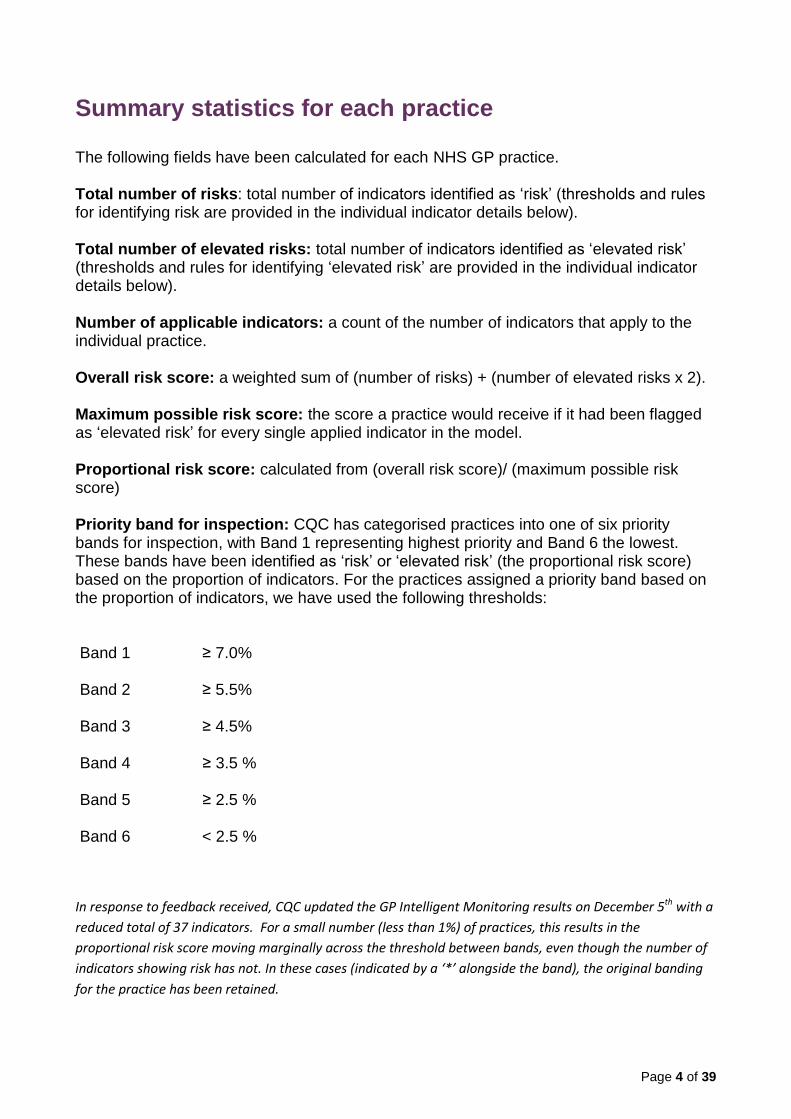
Summary statistics for each practice
The following fields have been calculated for each NHS GP practice. Total number of risks: total number of indicators identified as ‘risk’ (thresholds and rules for identifying risk are provided in the individual indicator details below). Total number of elevated risks: total number of indicators identified as ‘elevated risk’ (thresholds and rules for identifying ‘elevated risk’ are provided in the individual indicator details below). Number of applicable indicators: a count of the number of indicators that apply to the individual practice. Overall risk score: a weighted sum of (number of risks) + (number of elevated risks x 2). Maximum possible risk score: the score a practice would receive if it had been flagged as ‘elevated risk’ for every single applied indicator in the model. Proportional risk score: calculated from (overall risk score)/ (maximum possible risk score) Priority band for inspection: CQC has categorised practices into one of six priority bands for inspection, with Band 1 representing highest priority and Band 6 the lowest. These bands have been identified as ‘risk’ or ‘elevated risk’ (the proportional risk score) based on the proportion of indicators. For the practices assigned a priority band based on the proportion of indicators, we have used the following thresholds: Band 1 ≥ 7.0%
Band 2 ≥ 5.5%
Band 3 ≥ 4.5%
Band 4 ≥ 3.5 %
Band 5 ≥ 2.5 %
Band 6 < 2.5 %
In response to feedback received, CQC updated the GP Intelligent Monitoring results on December 5th with a
reduced total of 37 indicators. For a small number (less than 1%) of practices, this results in the
proportional risk score moving marginally across the threshold between bands, even though the number of
indicators showing risk has not. In these cases (indicated by a ‘*’ alongside the band), the original banding
for the practice has been retained.

Page 5 of 39
Background information on intelligent monitoring for GPs
GP intelligent monitoring is an initial list of 37 indicators that currently cover three of our five key questions - Effective, Responsive and Caring. The indicators used in intelligent monitoring are already included within the location data packs that can be accessed pre inspection. As with the approach followed in the Hospitals sector, the tool draws on existing and established national data sources (e.g. QOF, GP Patient Survey), and each GP practice has been categorised into one of six priority bands for inspection, with Band 1 representing the highest priority. These bandings have not been included in the data packs in advance of the publication, but will be afterwards. The intelligent monitoring methodology identifies indicator scores that are significantly worse than the expected value, which is usually defined as the national average. Indicators are flagged as showing ‘no evidence of risk’, ‘risk’ or ‘elevated risk’ depending on the difference between the indicator score and the expected value. This terminology may change for future releases, given the differences between primary and secondary care, and that practices generally perform well in QOF / GP Patient Survey data. An overall score for each practice is calculated, based on the proportion of their indicators that are a ‘risk’ or ‘elevated risk’, and this is used to allocate the practice to a priority band for inspection. This guidance document explains the methodology in more detail, but any of the following combinations of risks would be sufficient to categorise a practice with 37 indicators as Band 1 (highest priority):
3 indicators flagging as ‘elevated risk’, or
2 with elevated risk and 2 with a ‘risk’, or
1 with ‘elevated risk’ and 4 with a ‘risk’
The priority bandings help to identify:
scheduling decisions
potential risks
key lines of enquiry
In respect of intelligent monitoring, it is important to note the context. This is the first release, we have partial domain coverage and future developments are planned - it should therefore be viewed as part of our wider approach to corroborate intelligence including:
Intelligence sharing relationships with Quality Surveillance Groups, NHS England area teams, Clinical Commissioning Groups (CCGs), GP practices and the public
Views of other systems holding data (NHS England primary care web tool, local Healthwatch, Public Health England practice profiles)
Additional information held in the CCG and location level data packs

Page 6 of 39
CQC Pre inspection ‘information sharing meetings’
CQC Post inspection feedback
Page 7 of 39
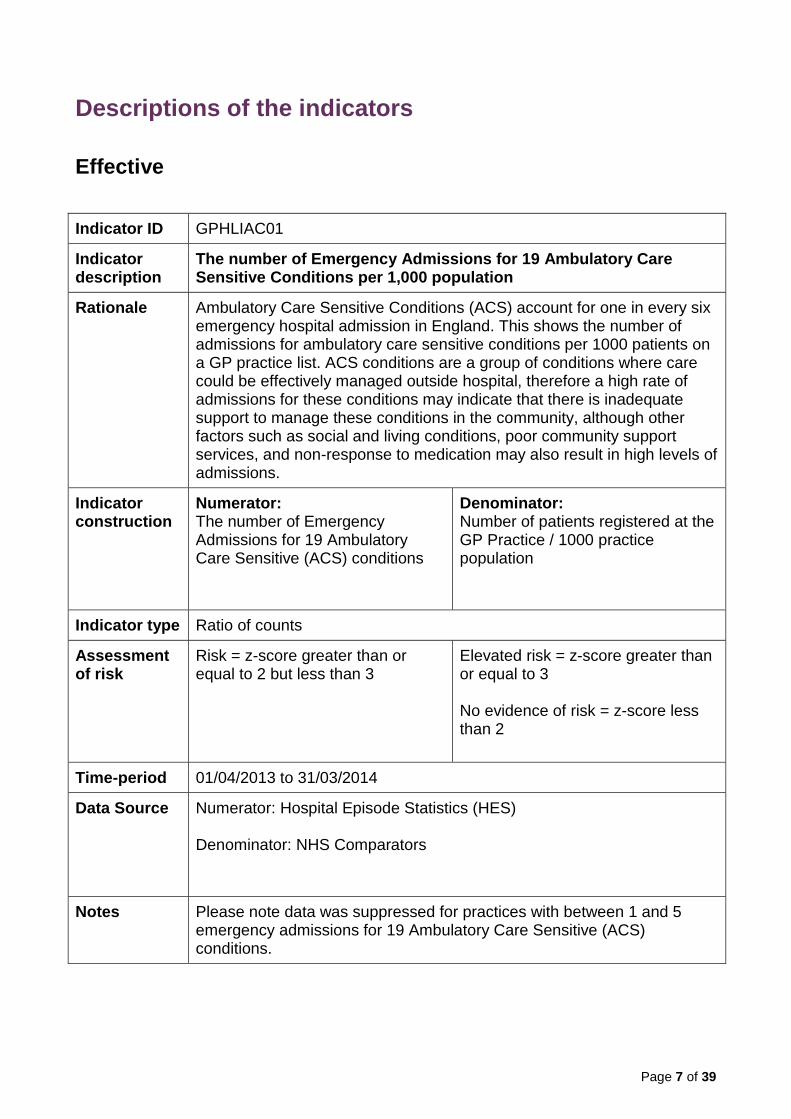
Descriptions of the indicators
Effective
Indicator ID GPHLIAC01
Indicator description
The number of Emergency Admissions for 19 Ambulatory Care Sensitive Conditions per 1,000 population
Rationale Ambulatory Care Sensitive Conditions (ACS) account for one in every six emergency hospital admission in England. This shows the number of admissions for ambulatory care sensitive conditions per 1000 patients on a GP practice list. ACS conditions are a group of conditions where care could be effectively managed outside hospital, therefore a high rate of admissions for these conditions may indicate that there is inadequate support to manage these conditions in the community, although other factors such as social and living conditions, poor community support services, and non-response to medication may also result in high levels of admissions.
Indicator construction
Numerator: The number of Emergency Admissions for 19 Ambulatory Care Sensitive (ACS) conditions
Denominator: Number of patients registered at the GP Practice / 1000 practice population
Indicator type Ratio of counts
Assessment of risk
Risk = z-score greater than or equal to 2 but less than 3
Elevated risk = z-score greater than or equal to 3 No evidence of risk = z-score less than 2
Time-period 01/04/2013 to 31/03/2014
Data Source Numerator: Hospital Episode Statistics (HES) Denominator: NHS Comparators
Notes Please note data was suppressed for practices with between 1 and 5 emergency admissions for 19 Ambulatory Care Sensitive (ACS) conditions.

Page 8 of 39
Indicator ID GPHLIAP
Indicator description
Number of antibacterial prescription items prescribed per Specific Therapeutic group Age-sex Related Prescribing Unit (STAR PU)
Rationale Antibiotics are used to treat infections caused by bacteria. This comparator measures the overall volume of antibiotics prescribed by a general practice, taking into account the size of the practice and the mix of ages and gender balance of the patients it treats. Antibiotic resistance is driven by over-using antibiotics and prescribing them inappropriately. There is a need to preserve specific antibiotics for the future and discourage their use for common infections. Keeping levels of antibacterial prescribing low, by only prescribing antibiotics when appropriate, will help reduce the spread of the antibacterial resistance that can be a serious threat to patients who have infections that do not respond to antimicrobial drugs. An unusually high value for this comparator may indicate some inappropriateness in the use of antibiotics.
Indicator construction
Numerator: Total number of items for Antibacterial drugs (BNF 5.1)
Denominator: Total number of oral antibacterials (BNF 5.1 sub-set) items based STAR_PU
Indicator type Ratio of counts
Assessment of risk
Risk = z-score greater than or equal to 2 but less than 3
Elevated risk = z-score greater than or equal to 3 No evidence of risk = z-score less than 2
Time-period 01/04/2013 to 31/03/2014
Data Source Numerator: electronic Prescribing Analysis and Costs (ePACT) Denominator: electronic Prescribing Analysis and Costs (ePACT)
Notes A STAR-PU (or Specific Therapeutic group Age-sex Related Prescribing Unit) is a value calculated to reflect not only the number of patients in a practice, but also the age and sex mix of that group. Because the need for particular drugs within a group of patients is affected by their ages and gender balance, using the number of STAR-PUs, instead of the number of patients, as the basis the indicator, means that comparisons between general practices better reflect differences in prescribing practice, and are less influenced by differences between the groups of patients being treated.

Page 9 of 39
Indicator ID GPHLICH01
Indicator description
The ratio of expected to reported prevalence of coronary heart disease (CHD)
Rationale The Coronary Heart Disease National Service Framework (CHD NSF) and now the new (General Medical Services) GMS contract state that general practitioners and primary care teams should develop a register of CHD patients, through which they can review medication, offer advice on diet and lifestyle, and maintain the necessary contact with patients most at risk of suffering renewed heart problems.
Indicator construction
Numerator: The Coronary Heart Disease (CHD) disease register from the Quality and Outcomes Framework (QOF)
Denominator: Expected prevalence adjusted by practice list and disease register.
Indicator type Indirect standardised ratio
Assessment of risk
Risk = z-score greater than or equal to 2 but less than 3
Elevated risk = z-score greater than or equal to 3 No evidence of risk = z-score less than 2
Time-period 01/04/2013 to 31/03/2014
Data Source Numerator: Quality and Outcomes Framework (QOF) Denominator: NHS Comparators
Notes Denominator is the modelled number of patients in the practice estimated to have coronary heart disease. Practice List, modelled estimated disease register, and percentage. For information on the estimated prevalence model, the data used in the model, and methodology behind it, please go to the Public Health Observatories’ website: http://www.apho.org.uk/DISEASEPREVALENCEMODELS

Page 10 of 39
Indicator ID GPHLICPD
Indicator description
Ratio of reported versus expected prevalence for Chronic Obstructive Pulmonary Disease (COPD)
Rationale Clinicians in primary care have the skills to assess patients' symptoms for COPD and adequacy of their control, monitor progression of their disease, and identify the development of complications and the need for referral to secondary care or other specialists. Failure to identify cases early in the progression of the disease will impact on sensitivity to treatment, increase secondary care requirements and reduce quality of life.
Indicator construction
Numerator: Observed prevalence of patients with chronic obstructive pulmonary disease (COPD)
Denominator: Expected prevalence of patients with chronic obstructive pulmonary disease (COPD) adjusted by practice list and disease register.
Indicator type Indirect standardised ratio
Assessment of risk
Risk = z-score greater than or equal to 2 but less than 3
Elevated risk = z-score greater than or equal to 3 No evidence of risk = z-score less than 2
Time-period 01/04/2013 to 31/03/2014
Data Source Numerator: Quality and Outcomes Framework (QOF) Denominator: NHS Comparators
Notes Denominator is the modelled number of patients in the practice estimated to have Chronic Obstructive Pulmonary Disease. Practice List, modelled estimated disease register, and percentage. For information on the estimated prevalence model, the data used in the model, and methodology behind it, please go to the Public Health Observatories’ website: http://www.apho.org.uk/DISEASEPREVALENCEMODELS High values are good. However, extremely high values may be indicative of over diagnosis or misdiagnosis.

Page 11 of 39
Indicator ID GPHLICQI
Indicator description
Percentage of Cephalosporins & Quinolones Items as a proportion of antibiotic items prescribed
Rationale Broad spectrum antibiotics, such as Quinolones and Cephalosporins, need to be reserved to treat resistant disease, and should generally be used only when standard and less expensive antibiotics are ineffective.
Indicator construction
Numerator: Number of prescribed items for Cephalosporins (0501021)* and Quinolones (050112) *BNF Code in brackets
Denominator: Number of prescribed items for Penicillins (050101) Cephalosporins (0501021) Tetracyclines (050103), Macrolides (050105), Sulphonamides And Trimethoprim (050108), Metronidazole, Tinidazole & Ornidazole (050111), Quinolones (050112) and Urinary-Tract Infections (050113) *BNF Code in brackets
Indicator type Proportional
Assessment of risk
Risk = z-score greater than or equal to 2 but less than 3
Elevated risk = z-score greater than or equal to 3 No evidence of risk = z-score less than 2
Time-period 01/04/2013 to 31/03/2014
Data Source Numerator: electronic Prescribing Analysis and Costs (ePACT) Denominator: electronic Prescribing Analysis and Costs (ePACT)
Indicator ID GPHLIEC01
Indicator description
Emergency cancer admissions per 100 patients on disease register
Rationale Individual practices/ GPs will vary in their ability to recognise the early symptoms of cancer and or/screening of patients for condition. Failure to identify these less severe cases will impact on 1 year survival rates, as cancer will be further advanced when finally diagnosed.
Indicator construction
Numerator: The number of emergency admissions with primary diagnoses of malignant neoplasms
Denominator: Number of patients on the cancer disease register / 100

Page 12 of 39
Indicator type Ratio of counts
Assessment of risk
Risk = z-score greater than or equal to 2 but less than 3
Elevated risk = z-score greater than or equal to 3 No evidence of risk = z-score less than 2
Time-period Numerator: 01/04/2013 to 31/03/2014 Denominator: 01/04/2013 to 31/03/2014
Data Source Numerator: Hospital Episode Statistics (HES) Denominator: Quality and Outcomes Framework (QOF)
Notes Please note data was suppressed for practices with between 1 and 5 emergency cancer admissions.
Indicator ID GPHLIFV01
Indicator description
The percentage of patients aged over 6 months to under 65 years in the defined influenza clinical risk groups that received the seasonal influenza vaccination
Rationale People in clinical risk groups (pregnant women, people with chronic respiratory disease, chronic heart disease, chronic renal disease, chronic liver disease, chronic neurological disease, or diabetes, carers, children, and people who are immuno suppressed) are more vulnerable to the effects of flu, and more at risk of developing complications such as bronchitis and pneumonia which can result in hospitalisation. Nationally, there is a target for at least 75% of the population in clinical risk groups to have received the flu vaccination.
Indicator construction
Numerator: The number of patients aged over 6 months to under 65 years in the defined influenza clinical risk groups that received the seasonal influenza vaccination
Denominator: All patients between 6 months to under 65 in clinical risk groups
Indicator type
Proportional

Page 13 of 39
Assessment of risk
Risk = z-score greater than or equal to 2 but less than 3
Elevated risk = z-score greater than or equal to 3 No evidence of risk = z-score less than 2
Time-period 01/09/2013 to 28/02/2014
Data Source Numerator: Information Centre Indicator Portal Denominator: Information Centre Indicator Portal
Notes Flu vaccinations are available within a GP practice between the months of September and March. The indicator reflects this time period for the relevant year.
Indicator ID GPHLIFV02
Indicator description
The percentage of patients aged 65 and older who have received a seasonal flu vaccination
Rationale People aged 65 and older are more vulnerable to the effects of flu, and more at risk of developing complications such as bronchitis and pneumonia which can result in hospitalisation. Nationally, there is a target for at least 75% of the population aged over 65 years to have received the flu vaccination.
Indicator construction
Numerator: Number of patients over 65 who have received a flu vaccination
Denominator: All patients aged over 65 on the practice list
Indicator type Proportional
Assessment of risk
Risk = z-score greater than or equal to 2 but less than 3
Elevated risk = z-score greater than or equal to 3 No evidence of risk = z-score less than 2
Time-period 01/09/2013 to 28/02/2014
Data Source Numerator: Information Centre Indicator Portal Denominator: Information Centre Indicator Portal
Notes Flu vaccinations are available within a GP practice between the months of September and March. The indicator reflects this time period for the relevant year.
Page 14 of 39
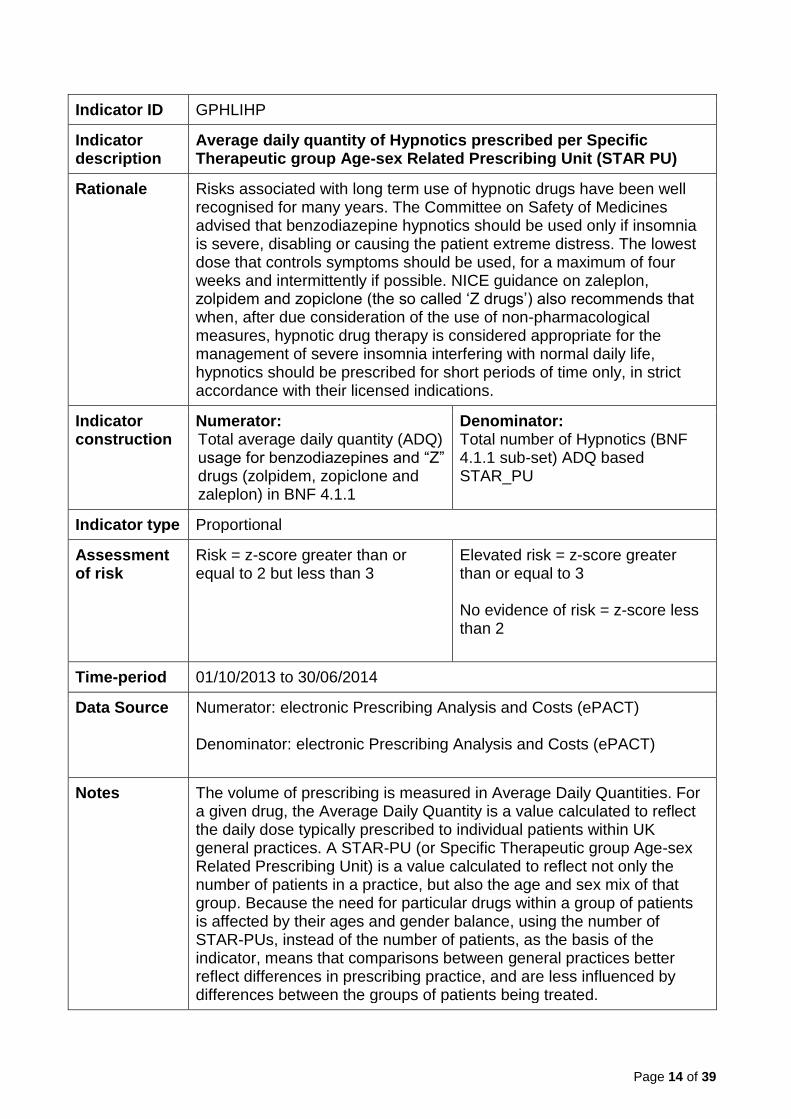
Indicator ID GPHLIHP
Indicator description
Average daily quantity of Hypnotics prescribed per Specific Therapeutic group Age-sex Related Prescribing Unit (STAR PU)
Rationale Risks associated with long term use of hypnotic drugs have been well recognised for many years. The Committee on Safety of Medicines advised that benzodiazepine hypnotics should be used only if insomnia is severe, disabling or causing the patient extreme distress. The lowest dose that controls symptoms should be used, for a maximum of four weeks and intermittently if possible. NICE guidance on zaleplon, zolpidem and zopiclone (the so called ‘Z drugs’) also recommends that when, after due consideration of the use of non-pharmacological measures, hypnotic drug therapy is considered appropriate for the management of severe insomnia interfering with normal daily life, hypnotics should be prescribed for short periods of time only, in strict accordance with their licensed indications.
Indicator construction
Numerator: Total average daily quantity (ADQ) usage for benzodiazepines and “Z” drugs (zolpidem, zopiclone and zaleplon) in BNF 4.1.1
Denominator: Total number of Hypnotics (BNF 4.1.1 sub-set) ADQ based STAR_PU
Indicator type Proportional
Assessment of risk
Risk = z-score greater than or equal to 2 but less than 3
Elevated risk = z-score greater than or equal to 3 No evidence of risk = z-score less than 2
Time-period 01/10/2013 to 30/06/2014
Data Source Numerator: electronic Prescribing Analysis and Costs (ePACT) Denominator: electronic Prescribing Analysis and Costs (ePACT)
Notes The volume of prescribing is measured in Average Daily Quantities. For a given drug, the Average Daily Quantity is a value calculated to reflect the daily dose typically prescribed to individual patients within UK general practices. A STAR-PU (or Specific Therapeutic group Age-sex Related Prescribing Unit) is a value calculated to reflect not only the number of patients in a practice, but also the age and sex mix of that group. Because the need for particular drugs within a group of patients is affected by their ages and gender balance, using the number of STAR-PUs, instead of the number of patients, as the basis of the indicator, means that comparisons between general practices better reflect differences in prescribing practice, and are less influenced by differences between the groups of patients being treated.
Page 15 of 39
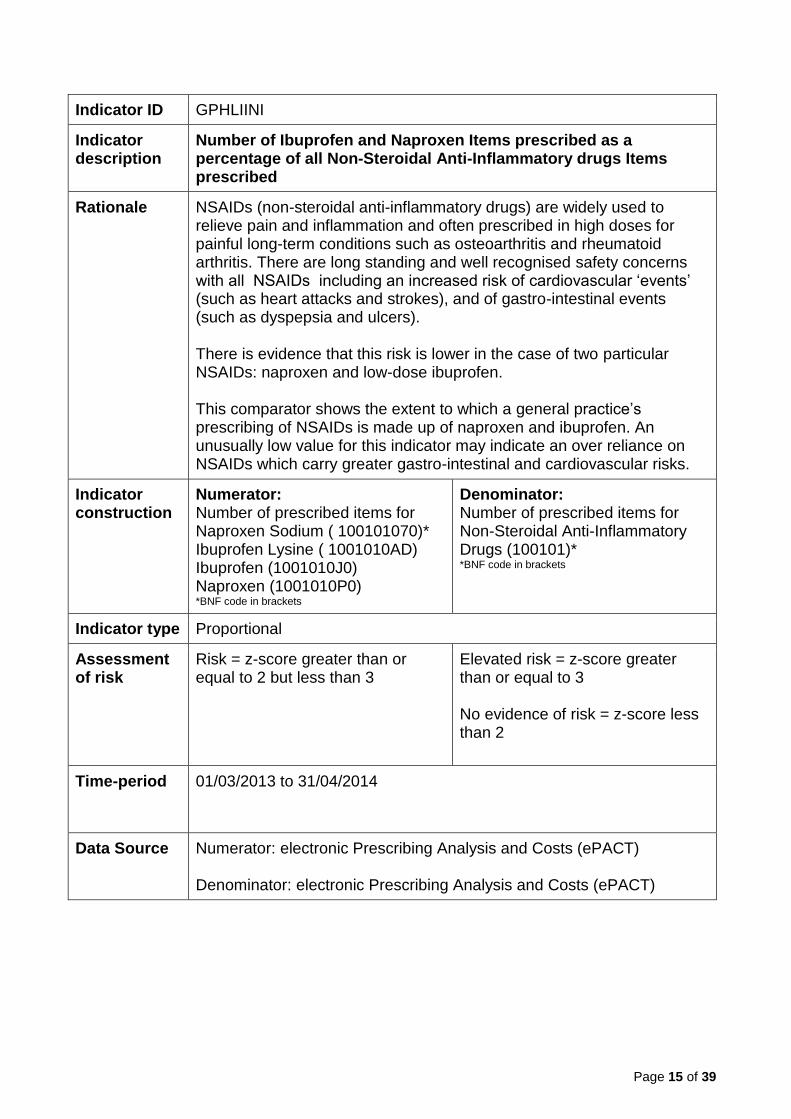
Indicator ID GPHLIINI
Indicator description
Number of Ibuprofen and Naproxen Items prescribed as a percentage of all Non-Steroidal Anti-Inflammatory drugs Items prescribed
Rationale NSAIDs (non-steroidal anti-inflammatory drugs) are widely used to relieve pain and inflammation and often prescribed in high doses for painful long-term conditions such as osteoarthritis and rheumatoid arthritis. There are long standing and well recognised safety concerns with all NSAIDs including an increased risk of cardiovascular ‘events’ (such as heart attacks and strokes), and of gastro-intestinal events (such as dyspepsia and ulcers). There is evidence that this risk is lower in the case of two particular NSAIDs: naproxen and low-dose ibuprofen. This comparator shows the extent to which a general practice’s prescribing of NSAIDs is made up of naproxen and ibuprofen. An unusually low value for this indicator may indicate an over reliance on NSAIDs which carry greater gastro-intestinal and cardiovascular risks.
Indicator construction
Numerator: Number of prescribed items for Naproxen Sodium ( 100101070)* Ibuprofen Lysine ( 1001010AD) Ibuprofen (1001010J0) Naproxen (1001010P0) *BNF code in brackets
Denominator: Number of prescribed items for Non-Steroidal Anti-Inflammatory Drugs (100101)* *BNF code in brackets
Indicator type Proportional
Assessment of risk
Risk = z-score greater than or equal to 2 but less than 3
Elevated risk = z-score greater than or equal to 3 No evidence of risk = z-score less than 2
Time-period 01/03/2013 to 31/04/2014
Data Source Numerator: electronic Prescribing Analysis and Costs (ePACT) Denominator: electronic Prescribing Analysis and Costs (ePACT)
Page 16 of 39
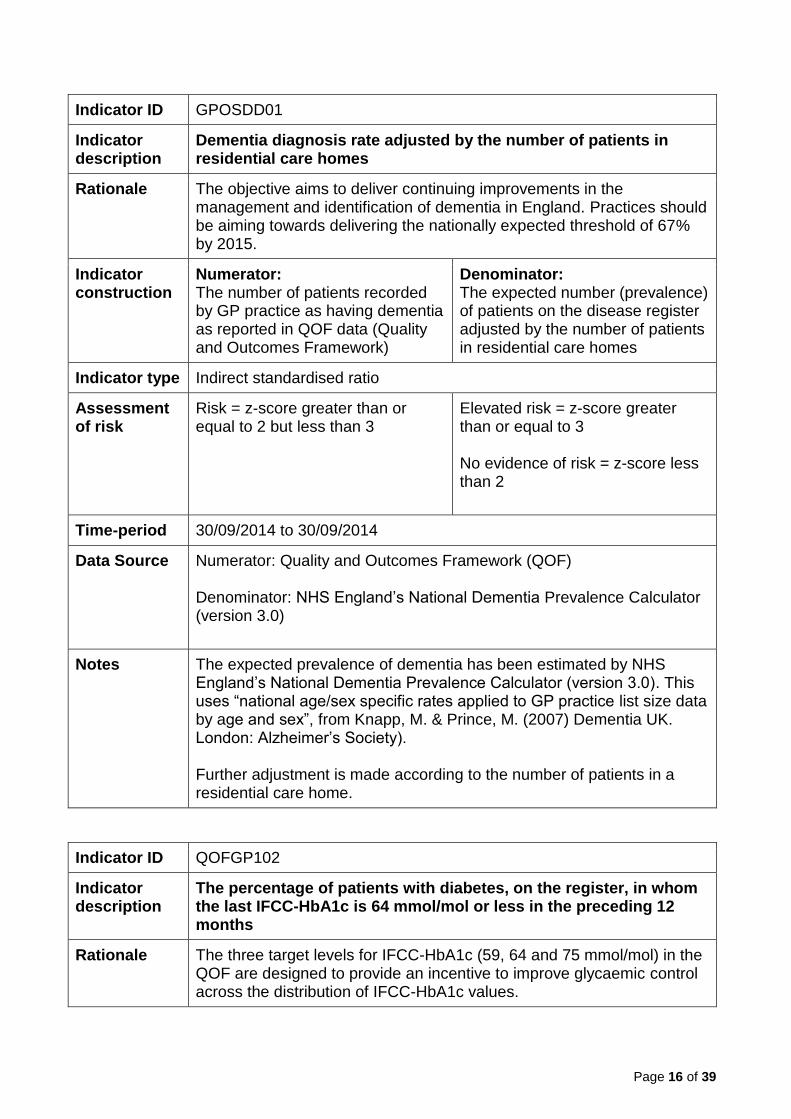
Indicator ID GPOSDD01
Indicator description
Dementia diagnosis rate adjusted by the number of patients in residential care homes
Rationale The objective aims to deliver continuing improvements in the management and identification of dementia in England. Practices should be aiming towards delivering the nationally expected threshold of 67% by 2015.
Indicator construction
Numerator: The number of patients recorded by GP practice as having dementia as reported in QOF data (Quality and Outcomes Framework)
Denominator: The expected number (prevalence) of patients on the disease register adjusted by the number of patients in residential care homes
Indicator type Indirect standardised ratio
Assessment of risk
Risk = z-score greater than or equal to 2 but less than 3
Elevated risk = z-score greater than or equal to 3 No evidence of risk = z-score less than 2
Time-period 30/09/2014 to 30/09/2014
Data Source Numerator: Quality and Outcomes Framework (QOF) Denominator: NHS England’s National Dementia Prevalence Calculator (version 3.0)
Notes The expected prevalence of dementia has been estimated by NHS England’s National Dementia Prevalence Calculator (version 3.0). This uses “national age/sex specific rates applied to GP practice list size data by age and sex”, from Knapp, M. & Prince, M. (2007) Dementia UK. London: Alzheimer’s Society). Further adjustment is made according to the number of patients in a residential care home.
Indicator ID QOFGP102
Indicator description
The percentage of patients with diabetes, on the register, in whom the last IFCC-HbA1c is 64 mmol/mol or less in the preceding 12 months
Rationale The three target levels for IFCC-HbA1c (59, 64 and 75 mmol/mol) in the QOF are designed to provide an incentive to improve glycaemic control across the distribution of IFCC-HbA1c values.
Page 17 of 39
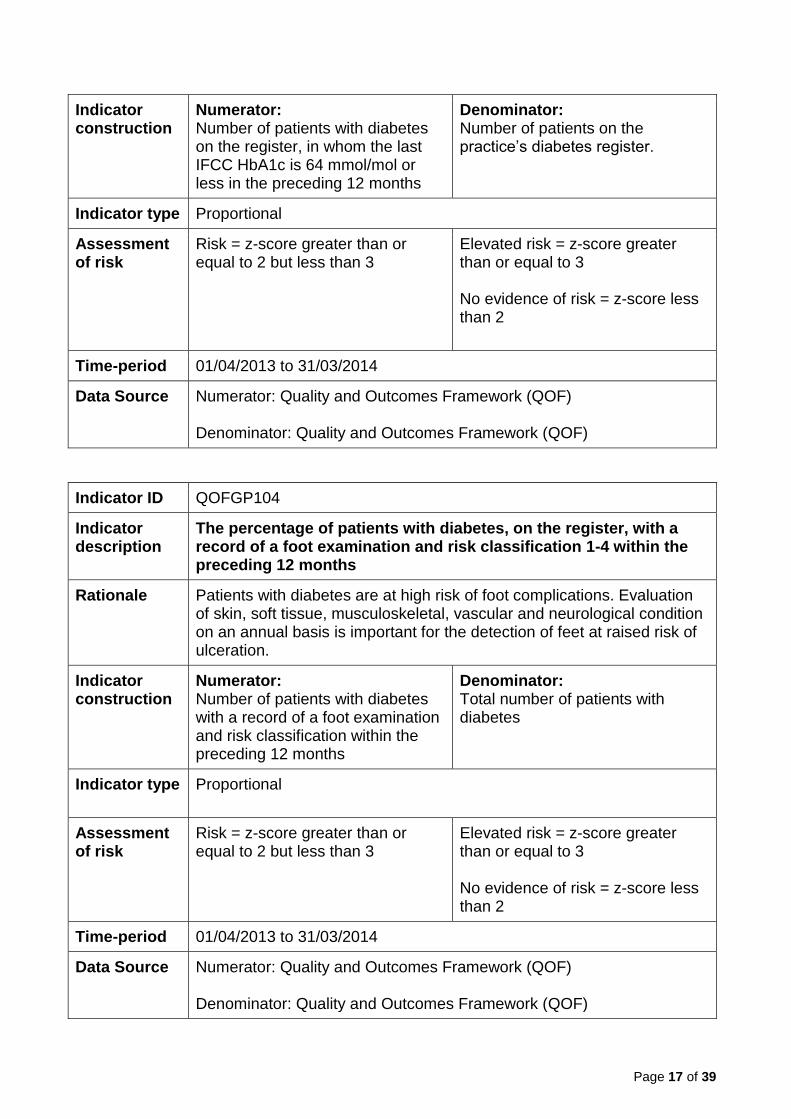
Indicator construction
Numerator: Number of patients with diabetes on the register, in whom the last IFCC HbA1c is 64 mmol/mol or less in the preceding 12 months
Denominator: Number of patients on the practice’s diabetes register.
Indicator type Proportional
Assessment of risk
Risk = z-score greater than or equal to 2 but less than 3
Elevated risk = z-score greater than or equal to 3 No evidence of risk = z-score less than 2
Time-period 01/04/2013 to 31/03/2014
Data Source Numerator: Quality and Outcomes Framework (QOF) Denominator: Quality and Outcomes Framework (QOF)
Indicator ID QOFGP104
Indicator description
The percentage of patients with diabetes, on the register, with a record of a foot examination and risk classification 1-4 within the preceding 12 months
Rationale Patients with diabetes are at high risk of foot complications. Evaluation of skin, soft tissue, musculoskeletal, vascular and neurological condition on an annual basis is important for the detection of feet at raised risk of ulceration.
Indicator construction
Numerator: Number of patients with diabetes with a record of a foot examination and risk classification within the preceding 12 months
Denominator: Total number of patients with diabetes
Indicator type Proportional
Assessment of risk
Risk = z-score greater than or equal to 2 but less than 3
Elevated risk = z-score greater than or equal to 3 No evidence of risk = z-score less than 2
Time-period 01/04/2013 to 31/03/2014
Data Source Numerator: Quality and Outcomes Framework (QOF) Denominator: Quality and Outcomes Framework (QOF)
Page 18 of 39
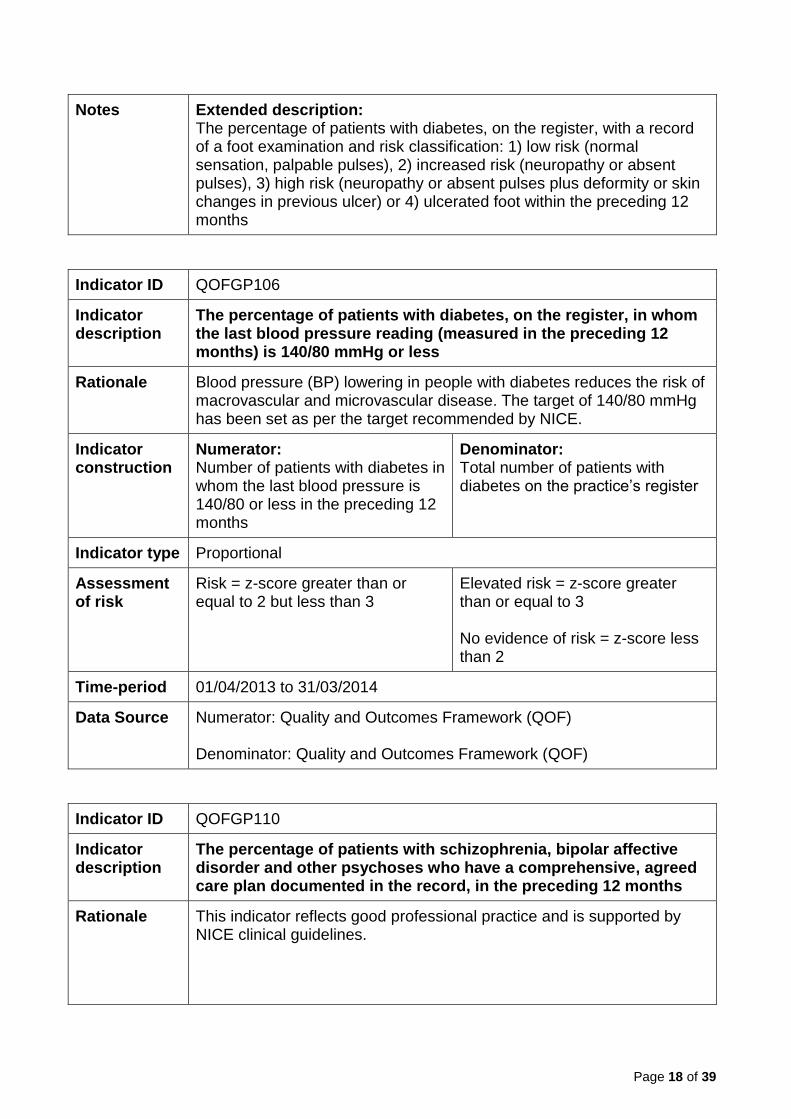
Notes Extended description: The percentage of patients with diabetes, on the register, with a record of a foot examination and risk classification: 1) low risk (normal sensation, palpable pulses), 2) increased risk (neuropathy or absent pulses), 3) high risk (neuropathy or absent pulses plus deformity or skin changes in previous ulcer) or 4) ulcerated foot within the preceding 12 months
Indicator ID QOFGP106
Indicator description
The percentage of patients with diabetes, on the register, in whom the last blood pressure reading (measured in the preceding 12 months) is 140/80 mmHg or less
Rationale Blood pressure (BP) lowering in people with diabetes reduces the risk of macrovascular and microvascular disease. The target of 140/80 mmHg has been set as per the target recommended by NICE.
Indicator construction
Numerator: Number of patients with diabetes in whom the last blood pressure is 140/80 or less in the preceding 12 months
Denominator: Total number of patients with diabetes on the practice’s register
Indicator type Proportional
Assessment of risk
Risk = z-score greater than or equal to 2 but less than 3
Elevated risk = z-score greater than or equal to 3 No evidence of risk = z-score less than 2
Time-period 01/04/2013 to 31/03/2014
Data Source Numerator: Quality and Outcomes Framework (QOF) Denominator: Quality and Outcomes Framework (QOF)
Indicator ID QOFGP110
Indicator description
The percentage of patients with schizophrenia, bipolar affective disorder and other psychoses who have a comprehensive, agreed care plan documented in the record, in the preceding 12 months
Rationale This indicator reflects good professional practice and is supported by NICE clinical guidelines.

Page 19 of 39
Indicator construction
Numerator: Number of patients with schizophrenia, bipolar affective disorder and other psychoses who have a comprehensive care plan agreed and documented in the records
Denominator: Total number of patients with schizophrenia, bipolar affective disorder and other psychoses
Indicator type Proportional
Assessment of risk
Risk = z-score greater than or equal to 2 but less than 3
Elevated risk = z-score greater than or equal to 3 No evidence of risk = z-score less than 2
Time-period 01/04/2013 to 31/03/2014
Data Source Numerator: Quality and Outcomes Framework (QOF) Denominator: Quality and Outcomes Framework (QOF)
Notes Extended description: The percentage of patients with schizophrenia, bipolar affective disorder and other psychoses who have a comprehensive care plan documented in the record, in the preceding 12 months, agreed between individuals, their family and/or carers as appropriate
Indicator ID QOFGP111
Indicator description
The percentage of patients with schizophrenia, bipolar affective disorder and other psychoses who have a record of alcohol consumption in the preceding 12 months
Rationale Substance misuse by people with schizophrenia is increasingly recognised as a major problem, both in terms of its prevalence and its clinical and social effects. The National Psychiatric Morbidity Survey in England found that 16% of people with schizophrenia were drinking over the recommended limits of 21 units of alcohol for men and 14 units of alcohol for women a week. Bipolar affective disorder is also highly comorbid with alcohol and other substance misuse.
Indicator construction
Numerator: Number of patients with schizophrenia, bipolar affective disorder and other psychoses who have a record of alcohol consumption in preceding 12 months
Denominator: Total number of patients with schizophrenia, bipolar affective disorder and other psychoses
Indicator type Proportional
Page 20 of 39
Assessment of risk
Risk = z-score greater than or equal to 2 but less than 3
Elevated risk = z-score greater than or equal to 3 No evidence of risk = z-score less than 2
Time-period 01/04/2013 to 31/03/2014
Data Source Numerator: Quality and Outcomes Framework (QOF) Denominator: Quality and Outcomes Framework (QOF)
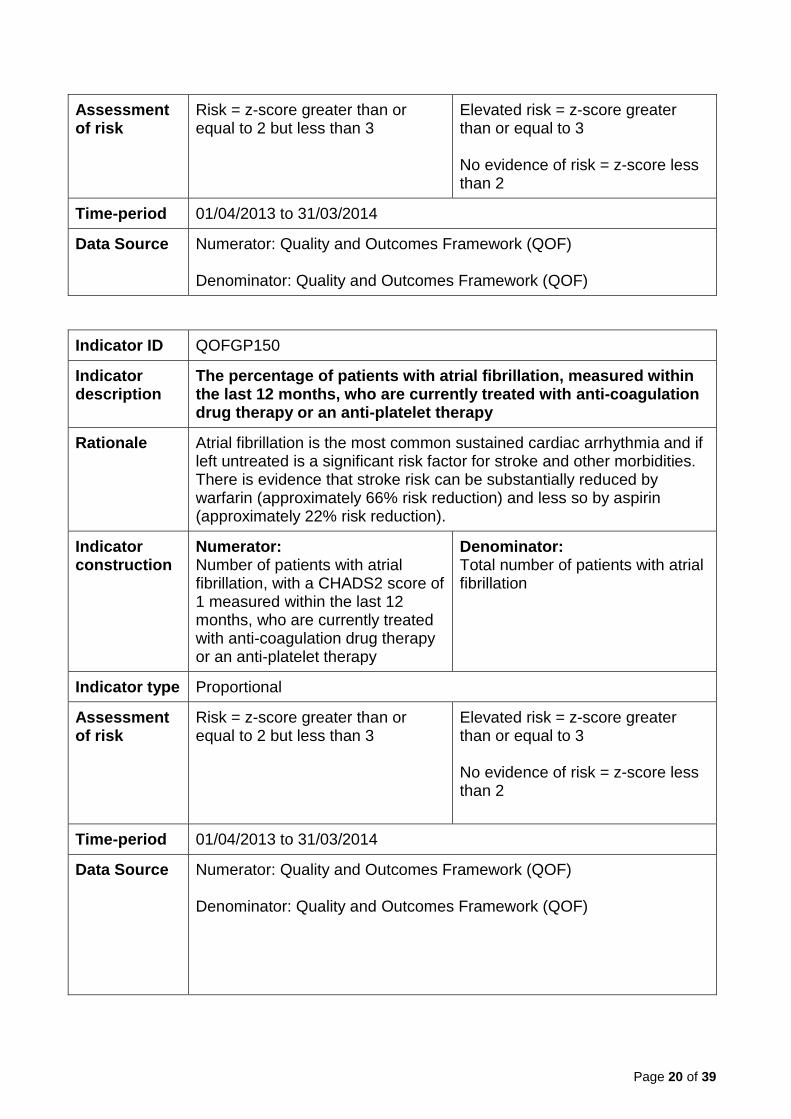
Indicator ID QOFGP150
Indicator description
The percentage of patients with atrial fibrillation, measured within the last 12 months, who are currently treated with anti-coagulation drug therapy or an anti-platelet therapy
Rationale Atrial fibrillation is the most common sustained cardiac arrhythmia and if left untreated is a significant risk factor for stroke and other morbidities. There is evidence that stroke risk can be substantially reduced by warfarin (approximately 66% risk reduction) and less so by aspirin (approximately 22% risk reduction).
Indicator construction
Numerator: Number of patients with atrial fibrillation, with a CHADS2 score of 1 measured within the last 12 months, who are currently treated with anti-coagulation drug therapy or an anti-platelet therapy
Denominator: Total number of patients with atrial fibrillation
Indicator type Proportional
Assessment of risk
Risk = z-score greater than or equal to 2 but less than 3
Elevated risk = z-score greater than or equal to 3 No evidence of risk = z-score less than 2
Time-period 01/04/2013 to 31/03/2014
Data Source Numerator: Quality and Outcomes Framework (QOF) Denominator: Quality and Outcomes Framework (QOF)

Page 21 of 39
Notes Extended description: In those patients with atrial fibrillation in whom there is a record of a CHADS2 score of 1 (latest in the preceding 12 months), the percentage of patients who are currently treated with anti-coagulation drug therapy or anti-platelet therapy
Indicator ID QOFGP155
Indicator description
The percentage of patients with hypertension in whom the last blood pressure reading measured in the preceding 9 months is 150/90mmHg or less
Rationale This indicator measures the intermediate health outcome of a blood pressure of 150/90 or less in patients with hypertension. Its intent is to promote the primary and secondary prevention of CVD through satisfactory blood pressure control. This intermediate outcome can be achieved through lifestyle advice and the use of drug therapy. For most patients a target of 140/85 is recommended. However, the British Hypertension Society suggests an audit standard of 150/90 which has been adopted for the QOF.
Indicator construction
Numerator: Number of patients with hypertension in whom the last blood pressure reading measured in the preceding 9 months is 150/90mmHg or less
Denominator: Total number of patients with hypertension
Indicator type Proportional
Assessment of risk
Risk = z-score greater than or equal to 2 but less than 3
Elevated risk = z-score greater than or equal to 3 No evidence of risk = z-score less than 2
Time-period 01/04/2013 to 31/03/2014
Data Source Numerator: Quality and Outcomes Framework (QOF) Denominator: Quality and Outcomes Framework (QOF)
Page 22 of 39
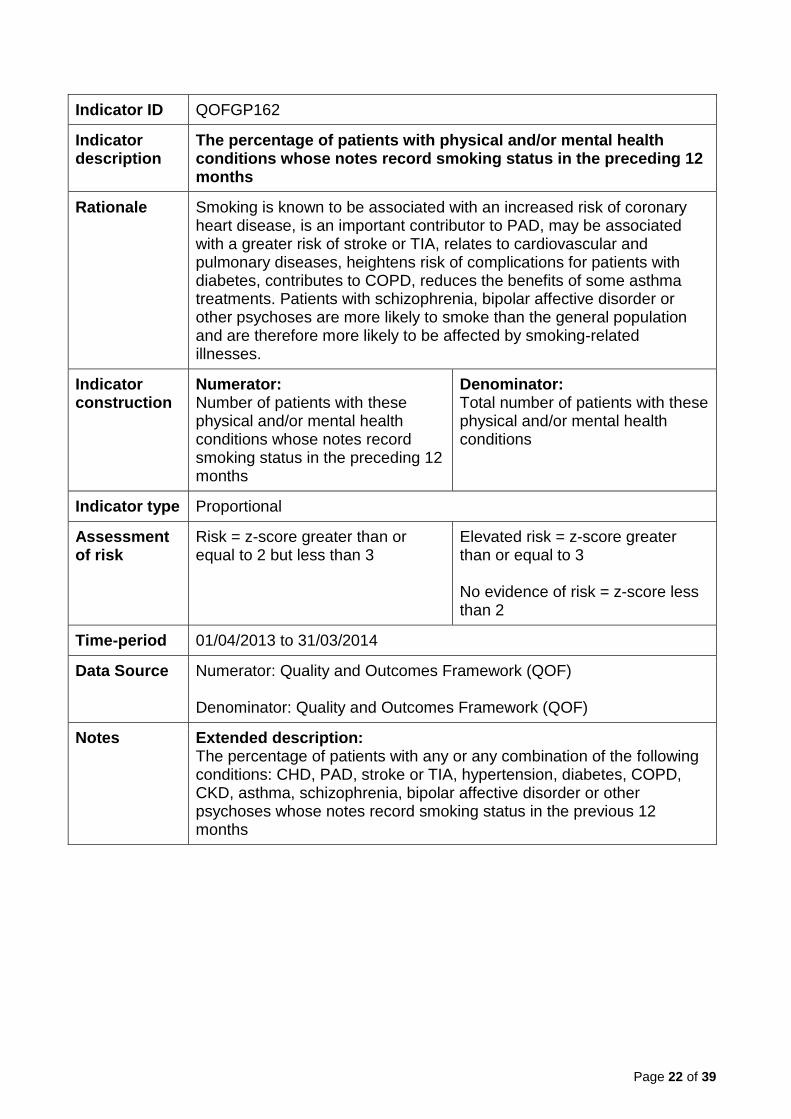
Indicator ID QOFGP162
Indicator description
The percentage of patients with physical and/or mental health conditions whose notes record smoking status in the preceding 12 months
Rationale Smoking is known to be associated with an increased risk of coronary heart disease, is an important contributor to PAD, may be associated with a greater risk of stroke or TIA, relates to cardiovascular and pulmonary diseases, heightens risk of complications for patients with diabetes, contributes to COPD, reduces the benefits of some asthma treatments. Patients with schizophrenia, bipolar affective disorder or other psychoses are more likely to smoke than the general population and are therefore more likely to be affected by smoking-related illnesses.
Indicator construction
Numerator: Number of patients with these physical and/or mental health conditions whose notes record smoking status in the preceding 12 months
Denominator: Total number of patients with these physical and/or mental health conditions
Indicator type Proportional
Assessment of risk
Risk = z-score greater than or equal to 2 but less than 3
Elevated risk = z-score greater than or equal to 3 No evidence of risk = z-score less than 2
Time-period 01/04/2013 to 31/03/2014
Data Source Numerator: Quality and Outcomes Framework (QOF) Denominator: Quality and Outcomes Framework (QOF)
Notes Extended description: The percentage of patients with any or any combination of the following conditions: CHD, PAD, stroke or TIA, hypertension, diabetes, COPD, CKD, asthma, schizophrenia, bipolar affective disorder or other psychoses whose notes record smoking status in the previous 12 months

Page 23 of 39
Indicator ID QOFGP178
Indicator description
The percentage of patients aged 75 or over with a fragility fracture on or after 1 April 2012, who are currently treated with an appropriate bone-sparing agent
Rationale Osteoporotic fragility fractures can cause substantial pain and severe disability, and are associated with decreased life expectancy. Osteoporotic fragility fractures occur most commonly in the spine (vertebrate), hip (proximal femur) and wrist (dustal radius). They also occur in the arm (humerus), pelvis, ribs and other bones.
Indicator construction
Numerator: Number of patients aged 75 years and over, with a fragility fracture on or after 1 April 2012, who are currently treated with an appropriate bone-sparing agent
Denominator: Total number of patients aged 75 years and older with a fragility fracture on or after 1 April 2012
Indicator type Proportional
Assessment of risk
Risk = z-score greater than or equal to 2 but less than 3
Elevated risk = z-score greater than or equal to 3 No evidence of risk = z-score less than 2
Time-period 01/04/2013 to 31/03/2014
Data Source Numerator: Quality and Outcomes Framework (QOF) Denominator: Quality and Outcomes Framework (QOF)
Indicator ID QOFGP182
Indicator description
The percentage of women aged 25 or over and who have not attained the age of 65 whose notes record that a cervical screening test has been performed in the preceding 5 years
Rationale This indicator is designed to encourage and incentivise contractors to continue to achieve high levels of uptake in cervical screening. Cervical screening can prevent cervical cancer.
Indicator construction
Numerator: Number of women aged 25-64 whose notes record a cervical
Denominator: Total number of females aged 25-64, except those who have

Page 24 of 39
screening test within the preceding 5 years.
withdrawn from the screening programme.
Indicator type Proportional
Assessment of risk
Risk = z-score greater than or equal to 2 but less than 3
Elevated risk = z-score greater than or equal to 3 No evidence of risk = z-score less than 2
Time-period 01/04/2013 to 31/03/2014
Data Source Numerator: Quality and Outcomes Framework (QOF) Denominator: Quality and Outcomes Framework (QOF)
Indicator ID QOFGP27
Indicator description
The percentage of patients diagnosed with dementia whose care has been reviewed in a face-to-face review in the preceding 12 months
Rationale A series of well-designed cohort and case control studies have demonstrated that people with Alzheimer-type dementia do not complain of common physical symptoms, but experience them to the same degree as the general population. As the illness progresses, and more agencies are involved, the review should additionally focus on assessing the communication between health and social care and nonstatutory sectors as appropriate, to ensure that potentially complex needs are addressed.
Indicator construction
Numerator: Number of patients diagnosed with dementia whose care has been reviewed in a face-to-face review in the previous 12 months
Denominator: Total number of patients diagnosed with dementia
Indicator type Proportional
Assessment of risk
Risk = z-score greater than or equal to 2 but less than 3
Elevated risk = z-score greater than or equal to 3 No evidence of risk = z-score less than 2
Time-period 01/04/2013 to 31/03/2014
Data Source Numerator: Quality and Outcomes Framework (QOF) Denominator: Quality and Outcomes Framework (QOF)

Page 25 of 39
Indicator ID QOFGP33
Indicator description
The percentage of patients with diabetes, on the register, who have a record of an albumin: creatinine ratio test in the preceding 12 months
Rationale Diabetic patients are at risk of developing nephropathy. Measurements of urinary albumin loss and serum creatinine are the best screening tests for diabetic nephropathy. All patients with diabetes should have their urinary albumin concentration and serum creatinine measured at diagnosis and at regular intervals, usually annually.
Indicator construction
Numerator: Number of patients, on the diabetes register, who have a record an albumin: creatinine ratio test in the preceding 12 months
Denominator: Total number of patients on the diabetes register
Indicator type Proportional
Assessment of risk
Risk = z-score greater than or equal to 2 but less than 3
Elevated risk = z-score greater than or equal to 3 No evidence of risk = z-score less than 2
Time-period 01/04/2013 to 31/03/2014
Data Source Numerator: Quality and Outcomes Framework (QOF) Denominator: Quality and Outcomes Framework (QOF)
Indicator ID QOFGP35
Indicator description
The percentage of patients with diabetes, on the register, whose last measured total cholesterol (measured within the preceding 12 months) is 5 mmol/l or less
Rationale The age when a statin should be initiated is unclear. It is pragmatically suggested that the prescription of a statin should be considered for all diabetic patients over the age of 40, particularly if their cholesterol is greater than 5.0mmol/l. Below the age of 40 a decision needs to be reached between the doctor and the patient and may involve assessment of other risk factors and the actual age of the patient.
Page 26 of 39
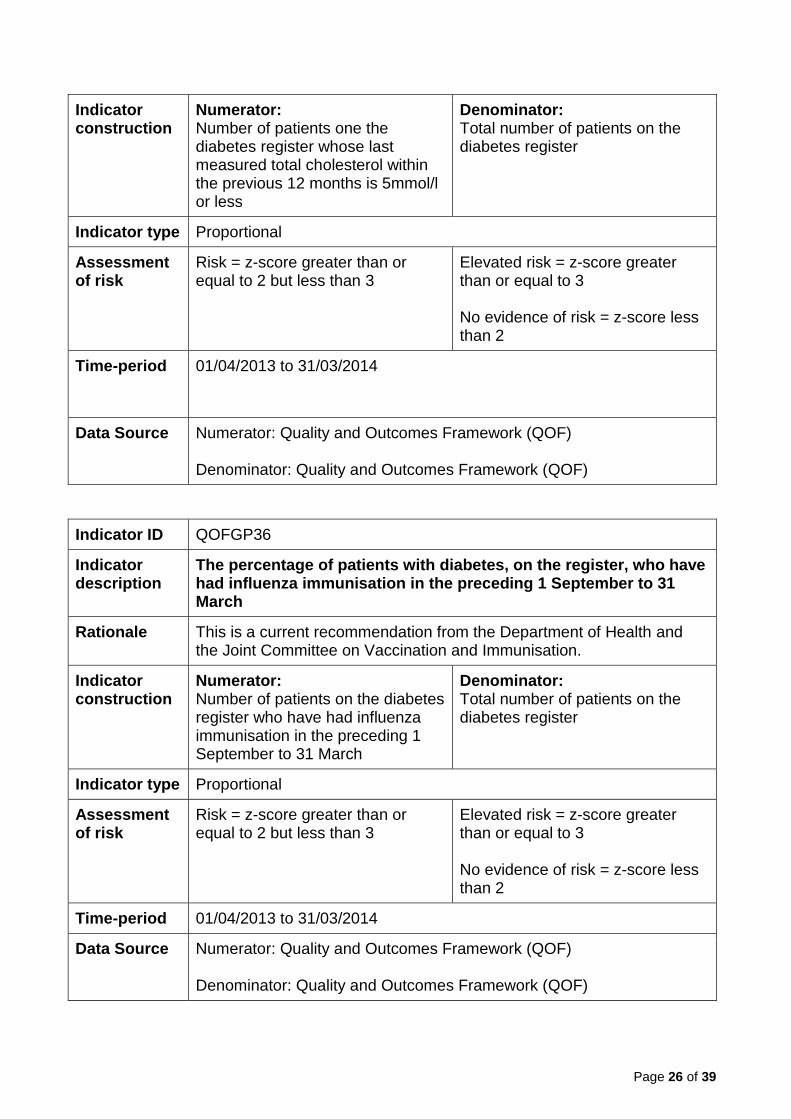
Indicator construction
Numerator: Number of patients one the diabetes register whose last measured total cholesterol within the previous 12 months is 5mmol/l or less
Denominator: Total number of patients on the diabetes register
Indicator type Proportional
Assessment of risk
Risk = z-score greater than or equal to 2 but less than 3
Elevated risk = z-score greater than or equal to 3 No evidence of risk = z-score less than 2
Time-period 01/04/2013 to 31/03/2014
Data Source Numerator: Quality and Outcomes Framework (QOF) Denominator: Quality and Outcomes Framework (QOF)
Indicator ID QOFGP36
Indicator description
The percentage of patients with diabetes, on the register, who have had influenza immunisation in the preceding 1 September to 31 March
Rationale This is a current recommendation from the Department of Health and the Joint Committee on Vaccination and Immunisation.
Indicator construction
Numerator: Number of patients on the diabetes register who have had influenza immunisation in the preceding 1 September to 31 March
Denominator: Total number of patients on the diabetes register
Indicator type Proportional
Assessment of risk
Risk = z-score greater than or equal to 2 but less than 3
Elevated risk = z-score greater than or equal to 3 No evidence of risk = z-score less than 2
Time-period 01/04/2013 to 31/03/2014
Data Source Numerator: Quality and Outcomes Framework (QOF) Denominator: Quality and Outcomes Framework (QOF)

Page 27 of 39
Indicator ID QOFGP51
Indicator description
The contractor establishes and maintains a register of patients aged 18 or over with learning disabilities
Rationale This is good professional practice and is consistent with other clinical domains within the QOF as a building block for further evidence based interventions. A register makes it possible to call and recall patients effectively to provide systematic care and to audit care.
Indicator construction
For categorical indicators such as this, either zero points or full points are awarded by QOF. Where zero points have been awarded, a ‘No’ category has been assigned for the scorecard, and where full points have been awarded, the practice has been assigned to the ‘Yes’ category.
Indicator type Categorical rules-based
Assessment of risk
Risk = No
No evidence of risk = Yes
Time-period 01/04/2013 to 31/03/2014
Data Source Quality and Outcomes Framework (QOF)
Indicator ID QOFGP54
Indicator description
The contractor establishes and maintains a register of all patients in need of palliative care/support irrespective of age
Rationale Identifying patients in need of palliative care, assessing their needs and preferences and proactively planning their care, are the key steps in the provision of high quality care at the end of life in general practice.
Indicator construction
For categorical indicators such as this, either zero points or full points are awarded by QOF. Where zero points have been awarded, a ‘No’ category has been assigned for the scorecard, and where full points have been awarded, the practice has been assigned to the ‘Yes’ category.
Indicator type Categorical rules-based
Assessment of risk
Risk = No
No evidence of risk = Yes
Time-period 01/04/2013 to 31/03/2014
Data Source Quality and Outcomes Framework (QOF)
Page 28 of 39
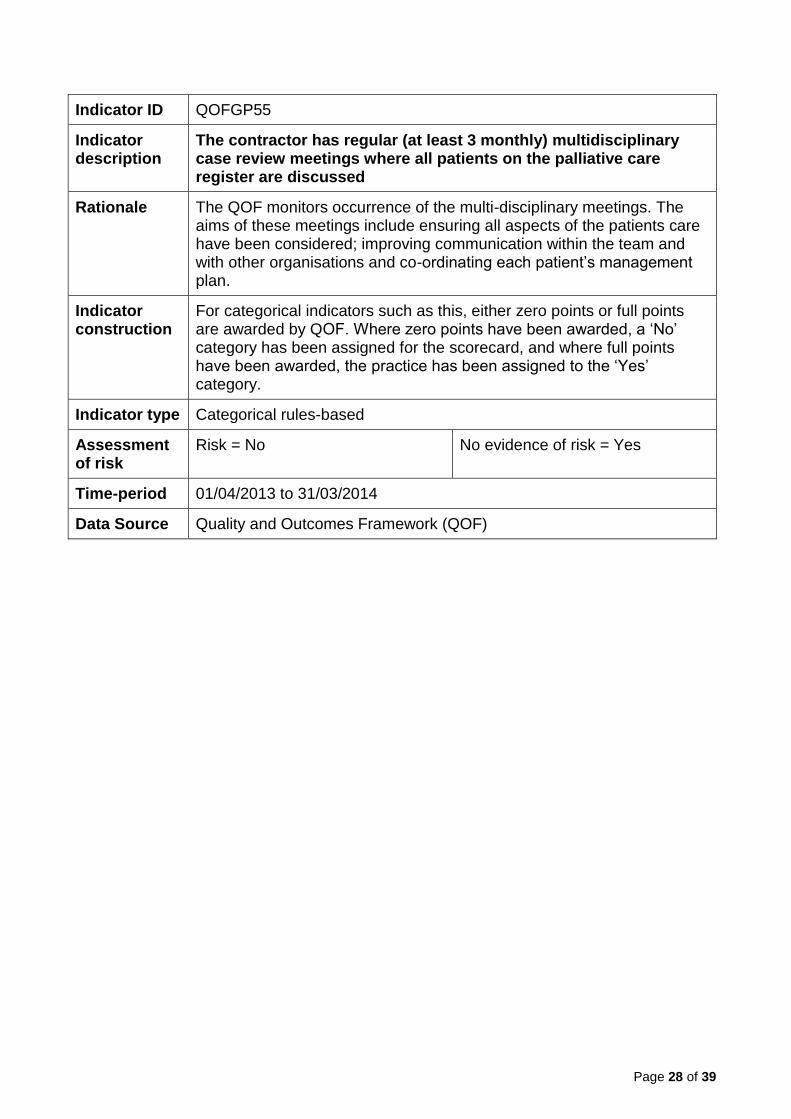
Indicator ID QOFGP55
Indicator description
The contractor has regular (at least 3 monthly) multidisciplinary case review meetings where all patients on the palliative care register are discussed
Rationale The QOF monitors occurrence of the multi-disciplinary meetings. The aims of these meetings include ensuring all aspects of the patients care have been considered; improving communication within the team and with other organisations and co-ordinating each patient’s management plan.
Indicator construction
For categorical indicators such as this, either zero points or full points are awarded by QOF. Where zero points have been awarded, a ‘No’ category has been assigned for the scorecard, and where full points have been awarded, the practice has been assigned to the ‘Yes’ category.
Indicator type Categorical rules-based
Assessment of risk
Risk = No No evidence of risk = Yes
Time-period 01/04/2013 to 31/03/2014
Data Source Quality and Outcomes Framework (QOF)

Page 29 of 39
Caring
Indicator ID GPPS003
Indicator description
The proportion of respondents to the GP patient survey who stated that in the reception area other patients can’t overhear’
Rationale Service users should be able to access care and treatment promptly.
Indicator construction
Numerator: Total responses who answered "No, other patients can’t overhear" to question 5 "In the reception area, can other patients overhear what you say to the receptionist?"
Denominator: Total responses to question 5 “In the reception area, can other patients overhear what you say to the receptionist?" excluding "Don’t Know".
Indicator type Proportional
Time Period 01/07/2013 to 31/03/2014
Assessment of risk
Risk = z-score greater than or equal to 2 but less than 3
Elevated risk = z-score greater than or equal to 3
No evidence of risk = z-score less than 2
Data Source The Numerator and Denominator have been extracted from the most recent publication of the GP Patient Survey. A link to both past and present publications can be found at: https://gp-patient.co.uk/surveys-and-reports.
Notes Locations that have denominators below the value of 10 will be suppressed in final extract of the data. The results of the survey for each GP practice have been weighted to adjust the data to account for potential differences between the demographic profile of all eligible patients in a practice and the patients who actually complete a questionnaire. More information about the weighing of the data can be found at https://gppatient.co.uk/faq/weighted-data.

Page 30 of 39
Indicator ID GPPS004
Indicator description
The proportion of respondents to the GP patient survey who stated that they always or almost always see or speak to the GP they prefer
Rationale Service users should be able to access care and treatment promptly.
Indicator construction
Numerator: Total responses who answered "Always or almost always" to question 9 "How Often do you see or speak to the GP you prefer?"
Denominator: Total responses to question 9 “How Often do you see or speak to the GP you prefer?" excluding "Not tried at this GP Surgery".
Indicator type Proportional
Time Period 01/07/2013 to 31/03/2014
Assessment of risk
Risk = z-score greater than or equal to 2 but less than 3
Elevated risk = z-score greater than or equal to 3
No evidence of risk = z-score less than 2
Data Source The Numerator and Denominator have been extracted from the most recent publication of the GP Patient Survey. A link to both past and present publications can be found at: https://gp-patient.co.uk/surveys-and-reports.
Notes Locations that have denominators below the value of 10 will be suppressed in final extract of the data. The results of the survey for each GP practice have been weighted to adjust the data to account for potential differences between the demographic profile of all eligible patients in a practice and the patients who actually complete a questionnaire. More information about the weighing of the data can be found at https://gppatient.co.uk/faq/weighted-data.

Page 31 of 39
Indicator ID GPPS014
Indicator description
The proportion of respondents to the GP patient survey who stated that the last time they saw or spoke to a GP, the GP was good or very good at involving them in decisions about their care
Rationale Service users should be involved in and informed of the care and treatment they receive.
Indicator construction
Numerator: Total responses who answered "Very good" and "Good" to question 21 part iv "Last time you saw or spoke to a GP from your GP surgery, how good was that GP at involving you in decisions about your care?"
Denominator: Total responses to question 21 part iv "Last time you saw or spoke to a GP from your GP surgery, how good was that GP at involving you in decisions about your care?" excluding "Doesn't apply".
Indicator type Proportional
Time Period 01/07/2013 to 31/03/2014
Assessment of risk
Risk = z-score greater than or equal to 2 but less than 3
Elevated risk = z-score greater than or equal to 3
No evidence of risk = z-score less than 2
Data Source The Numerator and Denominator have been extracted from the most recent publication of the GP Patient Survey. A link to both past and present publications can be found at: https://gp-patient.co.uk/surveys-and-reports.
Notes Locations that have denominators below the value of 10 will be suppressed in final extract of the data. The results of the survey for each GP practice have been weighted to adjust the data to account for potential differences between the demographic profile of all eligible patients in a practice and the patients who actually complete a questionnaire. More information about the weighing of the data can be found at https://gppatient.co.uk/faq/weighted-data.
Page 32 of 39
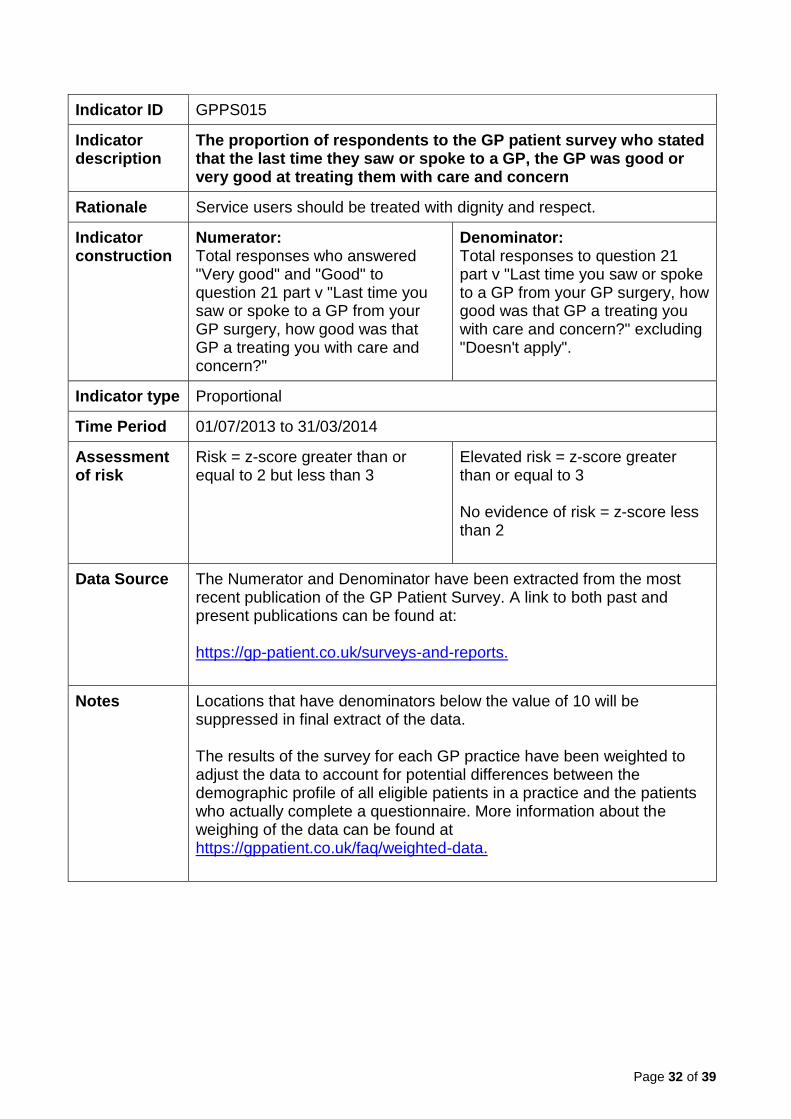
Indicator ID GPPS015
Indicator description
The proportion of respondents to the GP patient survey who stated that the last time they saw or spoke to a GP, the GP was good or very good at treating them with care and concern
Rationale Service users should be treated with dignity and respect.
Indicator construction
Numerator: Total responses who answered "Very good" and "Good" to question 21 part v "Last time you saw or spoke to a GP from your GP surgery, how good was that GP a treating you with care and concern?"
Denominator: Total responses to question 21 part v "Last time you saw or spoke to a GP from your GP surgery, how good was that GP a treating you with care and concern?" excluding "Doesn't apply".
Indicator type Proportional
Time Period 01/07/2013 to 31/03/2014
Assessment of risk
Risk = z-score greater than or equal to 2 but less than 3
Elevated risk = z-score greater than or equal to 3
No evidence of risk = z-score less than 2
Data Source The Numerator and Denominator have been extracted from the most recent publication of the GP Patient Survey. A link to both past and present publications can be found at: https://gp-patient.co.uk/surveys-and-reports.
Notes Locations that have denominators below the value of 10 will be suppressed in final extract of the data. The results of the survey for each GP practice have been weighted to adjust the data to account for potential differences between the demographic profile of all eligible patients in a practice and the patients who actually complete a questionnaire. More information about the weighing of the data can be found at https://gppatient.co.uk/faq/weighted-data.

Page 33 of 39
Indicator ID GPPS020
Indicator description
The proportion of respondents to the GP patient survey who stated that the last time they saw or spoke to a nurse, the nurse good or very good at involving them in decisions about their care
Rationale People who use services should experience effective, safe and appropriate care, treatment and support that meets their needs and protects their rights.
Indicator construction
Numerator: Total responses who answered "Very good" and "Good" to question 23 part iv "Last time you saw or spoke to a nurse from your GP surgery, how good was that nurse in involving you in decisions about your care?"
Denominator: Total responses to question 23 part iv "Last time you saw or spoke to a nurse from your GP surgery, how good was that nurse in involving you in decisions about your care?" excluding "Doesn't apply".
Indicator type Proportional
Time Period 01/07/2013 to 31/03/2014
Assessment of risk
Risk = z-score greater than or equal to 2 but less than 3
Elevated risk = z-score greater than or equal to 3
No evidence of risk = z-score less than 2
Data Source The Numerator and Denominator have been extracted from the most recent publication of the GP Patient Survey. A link to both past and present publications can be found at: https://gp-patient.co.uk/surveys-and-reports.
Notes Locations that have denominators below the value of 10 will be suppressed in final extract of the data. The results of the survey for each GP practice have been weighted to adjust the data to account for potential differences between the demographic profile of all eligible patients in a practice and the patients who actually complete a questionnaire. More information about the weighing of the data can be found at https://gppatient.co.uk/faq/weighted-data.

Page 34 of 39
Indicator ID GPPS021
Indicator description
The proportion of respondents to the GP patient survey who stated that the last time they saw or spoke to a nurse, the nurse was good or very good at treating them with care and concern
Rationale Service users should be treated with dignity and respect.
Indicator construction
Numerator: Total responses who answered "Very good" and "Good" to question 23 part v "Last time you saw or spoke to a nurse from your GP surgery, how good was that nurse at treating you with care and concern?"
Denominator: Total responses to question 23 part v "Last time you saw or spoke to a nurse from your GP surgery, how good was that nurse at treating you with care and concern?" excluding "Doesn't apply".
Indicator type Proportional
Time Period 01/07/2013 to 31/03/2014
Assessment of risk
Risk = z-score greater than or equal to 2 but less than 3
Elevated risk = z-score greater than or equal to 3
No evidence of risk = z-score less than 2
Data Source The Numerator and Denominator have been extracted from the most recent publication of the GP Patient Survey. A link to both past and present publications can be found at: https://gp-patient.co.uk/surveys-and-reports.
Notes Locations that have denominators below the value of 10 will be suppressed in final extract of the data. The results of the survey for each GP practice have been weighted to adjust the data to account for potential differences between the demographic profile of all eligible patients in a practice and the patients who actually complete a questionnaire. More information about the weighing of the data can be found at https://gppatient.co.uk/faq/weighted-data.

Page 35 of 39
Indicator ID GPPS025
Indicator description
The proportion of respondents to the GP patient survey who described the overall experience of their GP surgery as fairly good or very good
Rationale People who use services should experience effective, safe and appropriate care, treatment and support that meets their needs and protects their rights.
Indicator construction
Numerator: Total responses who answered "Very good" and "Fairly good" to question 28 "Overall, how would you describe your experience of your GP surgery?"
Denominator: Total responses to question 28 "Overall, how would you describe your experience of your GP surgery?"
Indicator type Proportional
Time Period 01/07/2013 to 31/03/2014
Assessment of risk
Risk = z-score greater than or equal to 2 but less than 3
Elevated risk = z-score greater than or equal to 3
No evidence of risk = z-score less than 2
Data Source The Numerator and Denominator have been extracted from the most recent publication of the GP Patient Survey. A link to both past and present publications can be found at: https://gp-patient.co.uk/surveys-and-reports.
Notes Locations that have denominators below the value of 10 will be suppressed in final extract of the data. The results of the survey for each GP practice have been weighted to adjust the data to account for potential differences between the demographic profile of all eligible patients in a practice and the patients who actually complete a questionnaire. More information about the weighing of the data can be found at https://gppatient.co.uk/faq/weighted-data.
Page 36 of 39
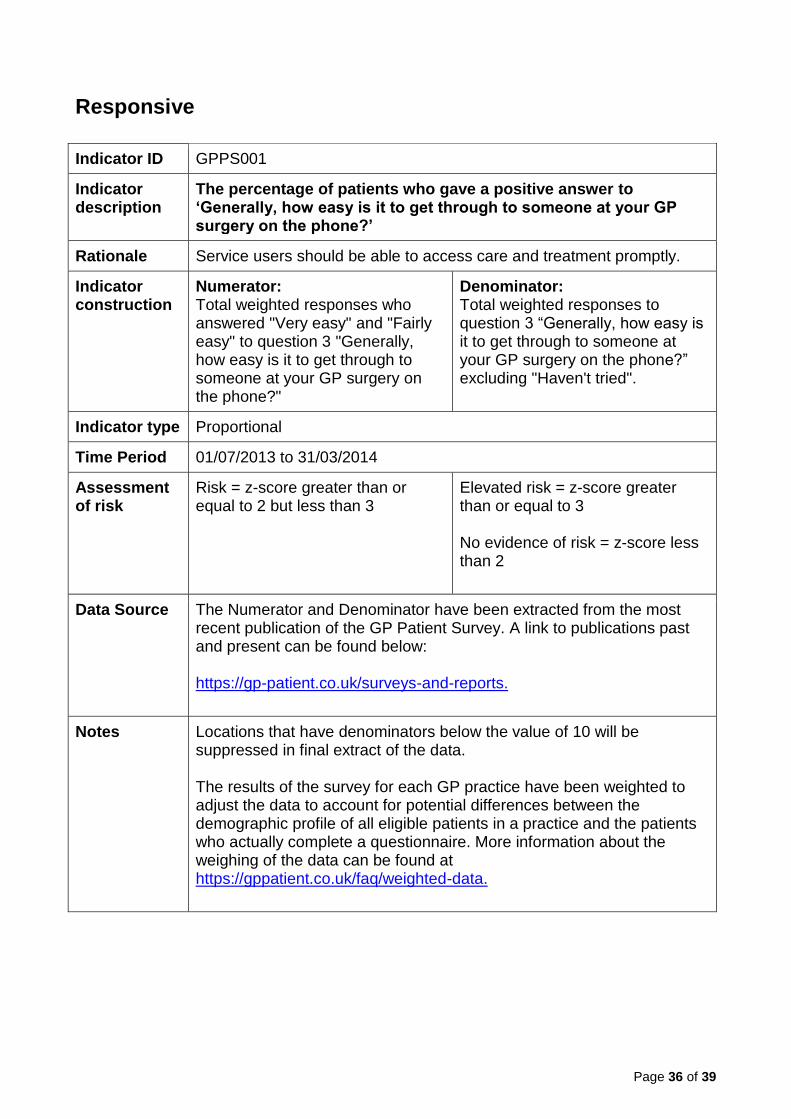
Responsive
Indicator ID GPPS001
Indicator description
The percentage of patients who gave a positive answer to ‘Generally, how easy is it to get through to someone at your GP surgery on the phone?’
Rationale Service users should be able to access care and treatment promptly.
Indicator construction
Numerator: Total weighted responses who answered "Very easy" and "Fairly easy" to question 3 "Generally, how easy is it to get through to someone at your GP surgery on the phone?"
Denominator: Total weighted responses to question 3 “Generally, how easy is it to get through to someone at your GP surgery on the phone?” excluding "Haven't tried".
Indicator type Proportional
Time Period 01/07/2013 to 31/03/2014
Assessment of risk
Risk = z-score greater than or equal to 2 but less than 3
Elevated risk = z-score greater than or equal to 3
No evidence of risk = z-score less than 2
Data Source The Numerator and Denominator have been extracted from the most recent publication of the GP Patient Survey. A link to publications past and present can be found below: https://gp-patient.co.uk/surveys-and-reports.
Notes Locations that have denominators below the value of 10 will be suppressed in final extract of the data. The results of the survey for each GP practice have been weighted to adjust the data to account for potential differences between the demographic profile of all eligible patients in a practice and the patients who actually complete a questionnaire. More information about the weighing of the data can be found at https://gppatient.co.uk/faq/weighted-data.

Page 37 of 39
Indicator ID GPPS023
Indicator description
The percentage of patients who were ‘Very satisfied’ or ‘Fairly satisfied’ with their GP practice opening hours
Rationale Service users should be able to access care and treatment promptly.
Indicator construction
Numerator: Total responses who answered "Very satisfied" and "Fairly satisfied" to question 25 "How satisfied are you with the hours that your GP surgery is open?"
Denominator: Total responses to question 25 "How satisfied are you with the hours that your GP surgery is open?" excluding "I'm not sure when my GP surgery is open”.
Indicator type Proportional
Time Period 01/07/2013 to 31/03/2014
Assessment of risk
Risk = z-score greater than or equal to 2 but less than 3
Elevated risk = z-score greater than or equal to 3
No evidence of risk = z-score less than 2
Data Source The Numerator and Denominator have been extracted from the most recent publication of the GP Patient Survey. A link to publications past and present can be found below: https://gp-patient.co.uk/surveys-and-reports.
Notes Locations that have denominators below the value of 10 will be suppressed in final extract of the data. The results of the survey for each GP practice have been weighted to adjust the data to account for potential differences between the demographic profile of all eligible patients in a practice and the patients who actually complete a questionnaire. More information about the weighing of the data can be found at https://gppatient.co.uk/faq/weighted-data.

Page 38 of 39
List of data providers
ePACT, Electronic Prescribing Analysis and Cost: a system which allows authorised users at primary care organisations (PCOs) / Area Teams / NHS trusts and national users to electronically access prescription data.
GPPS, The GP Patient Survey is an independent survey run by IPSOS MORI on behalf of
NHS England. The survey is sent out to over a million people across the UK. The results
show how people feel about their GP practice.
HES, Hospital Episode Statistics: a data warehouse containing details of all admissions,
outpatient appointments and A&E attendances at NHS hospitals in England.
HSCIC, Health & Social Care Information Centre: the national provider of information, data and IT systems for health and social care.
ICIP, Information Centre Indicator Portal: The Health & Social Care Information Centre's Indicator Portal brings a range of health indicators together in one place. Providing quick and easy access to hundreds of indicators, it's a valuable information resource for all health and social care professionals, not just information specialists.
NICE, the National Institute for Health and Care Excellence: a Non Departmental Public
Body that provides national guidance and advice to improve health and social care, and
develops guidance and quality standards.
NHS BSA, the NHS Business Services Authority: a Special Health Authority and an Arms- Length Body of the Department of Health which provides a range of critical central services to NHS organisations, NHS contractors, patients and the public.
NHS Comparators: an analytical service for commissioners and providers. It helps
improve the quality of care delivered by benchmarking and comparing activity and costs on
a local, regional and national level. NHS Comparators pulls together:
activity and costed data through the Payment by Results (PbR) tariff from the Secondary Uses Service (SUS),
information from The Quality and Outcomes Framework (QOF), and
GP practice demographic population profile data.
QOF, Quality and Outcomes Framework: set of data collected from GP practices for the
stated aims of 1) rewarding practices for providing quality care and 2) helping to
standardise improvements in the delivery of quality care to patients.
Page 39 of 39
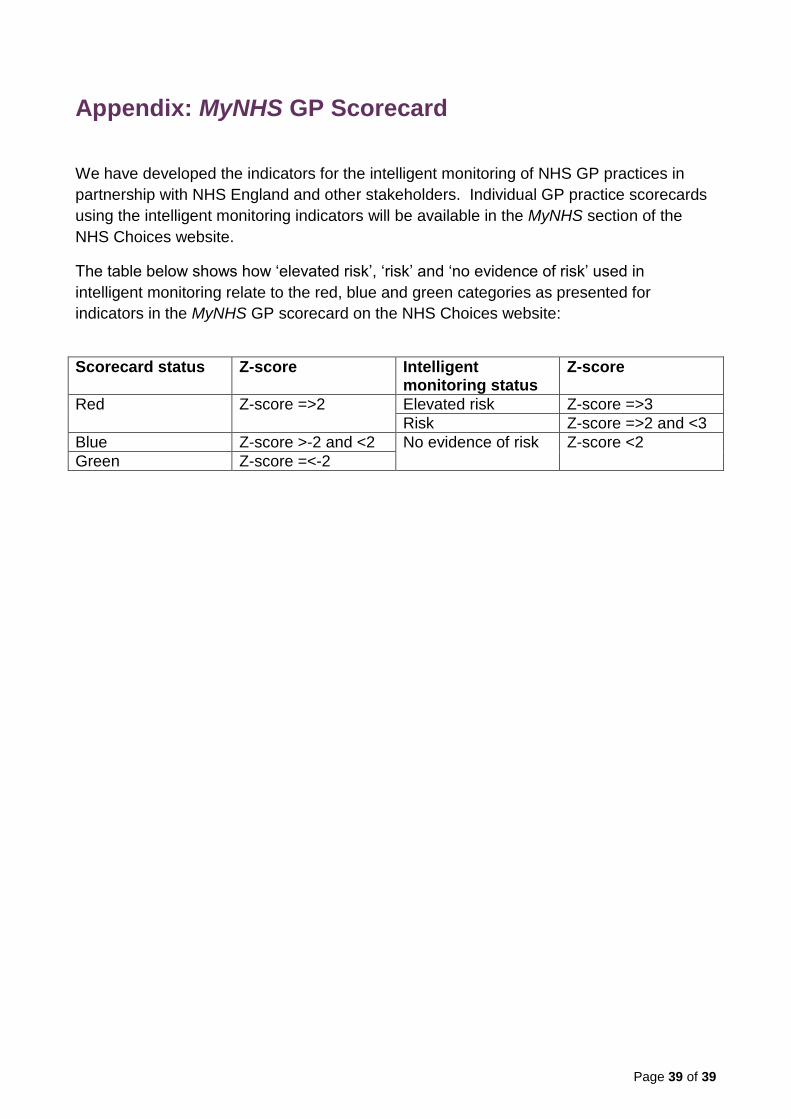
Appendix: MyNHS GP Scorecard
We have developed the indicators for the intelligent monitoring of NHS GP practices in
partnership with NHS England and other stakeholders. Individual GP practice scorecards
using the intelligent monitoring indicators will be available in the MyNHS section of the
NHS Choices website.
The table below shows how ‘elevated risk’, ‘risk’ and ‘no evidence of risk’ used in
intelligent monitoring relate to the red, blue and green categories as presented for
indicators in the MyNHS GP scorecard on the NHS Choices website:
Scorecard status Z-score Intelligent monitoring status
Z-score
Red Z-score =>2 Elevated risk Z-score =>3
Risk Z-score =>2 and <3
Blue Z-score >-2 and <2 No evidence of risk Z-score <2
Green Z-score =<-2