nhs greater glasgow and clyde 2014/15 health and ... greater glasgow and clyde 2014/15 health and...
TRANSCRIPT

NHS Greater Glasgow and Clyde2014/15 Health and Wellbeing Survey
Thriving PlacesFinal Report
Prepared for NHS Greater Glasgow and Clyde byTraci Leven Research
November 2015
Contents 1 Introduction 1
1.1 Introduction 1 1.2 Thriving Places Sample Profile 3 1.3 This Report 3
2 People’s Perceptions of Their Health & Illness 4
2.1 Self-Perceived Health and Wellbeing 4 2.2 Illness 4 2.3 Mental Wellbeing 6
3 Health Behaviours 8
3.1 Smoking 8 3.2 Drinking 10 3.3 Physical Activity 14 3.4 Diet 15 3.5 Body Mass Index (BMI) 17 3.6 Unhealthy and Healthy Behaviour Indices 18
4 Social Health 19
4.1 Social Connectedness 19 4.2 Experience of Discrimination, Experience of Crime and Feelings of Safety 19 4.3 Social Issues in the Local Area 20 4.4 Environmental Issues in the Local Area 21 4.5 Perceived Quality of Services in the Area 22 4.6 Individual Circumstances 23
5 Social Capital 25
5.1 Social Capital 25

APPENDIX A: SURVEY METHODOLOGY & RESPONSE 1
APPENDIX B: DATA WEIGHTING 5
APPENDIX C: ASSUMPTIONS OF NUMBER OF UNITS OF ALCOHOL IN EACH TYPE OF DRINK (1999-2005 and 2008-2014) 7

NHS Greater Glasgow & Clyde 2014/15 Health and Wellbeing Survey Page 1
1 Introduction
1.1 Introduction1
This report contains the findings of a research study on health and wellbeing carried out in 2014 on behalf of NHS Greater Glasgow and Clyde. The fieldwork and data entry were performed by BMG. Analysis and reporting were performed by Traci Leven Research. It is the follow up in a series of studies which started in 1999 when NHS Greater Glasgow conducted a health and wellbeing study of their population. The study has been repeated every three years. In 2008 the study expanded to take in the area covered by NHS Greater Glasgow and Clyde, this study represents the second follow-up of the expanded study and also allows trends to be explored in the area administered by the former NHS Greater Glasgow.
Background The original aims of the study were:
• to provide intelligence to inform the health promotion directorate; • to explore the different experience of health and wellbeing in our most deprived communities2
• to provide information that would be useful for monitoring health promotion interventions. compared to other areas; and
There have been many policy changes over the decade the health and wellbeing study has been in operation. For example, the dissolution of social inclusion partnership areas (SIPs) as a focus of tackling area based deprivation and the emergence of using the Scottish Index of Multiple Deprivation (SIMD) as the main tool for measuring area based deprivation and focusing of resources; the emergence of Community Health (and Care) Partnerships as a vehicle for integrated planning and delivery of health (and social) care services at a local level and changes to the performance assessment framework have led to an increased focus on some health behaviours such as use of alcohol; diet and exercise. The health and wellbeing survey was formed around core questions which have remained the same. Prior to the 2014 survey an extensive consultation exercise took place to modernise the questionnaire. Questions were included which will provide the potential for record linkage with other health records. This meant that questions on use of health services could be removed. New questions were included on welfare reform, acceptability of alcohol use. Questions that had been removed on social capital and volunteering were re-
1 This section has been prepared by NHS Greater Glasgow & Clyde 2 In 1999, our most deprived communities were given additional resources with the aim of reducing the gap between deprived and least deprived areas. The initiative was part of an umbrella programme of support which focused on Social Inclusion Partnership areas.

NHS Greater Glasgow & Clyde 2014/15 Health and Wellbeing Survey Page 2
introduced. The 2014 survey provides an opportunity to explore trends over time while also exploring some contemporary public health issues. The survey continues to offer flexible solutions for monitoring the health of the population in a range of geographies within NHSGGC. In 2014 we introduced neighbourhood level boosts for the first time. Intensive interviewing took place in Govanhill (to provide intelligence for the monitoring and evaluation of Sistema); Possil; Gorbals; Parkhead and Garthamlock (to provide intelligence for monitoring the Thriving Places Programme). Boosts which enable the exploration of our most deprived areas compared to our more affluent areas have taken place in Renfrewshire; Inverclyde and East Dunbartonshire. East Renfrewshire boosted to enable an exploration of their area as a whole. All the reports will be posted on http://www.phru.net as they become available. Thanks are due to the working group that led the survey: Allan A Boyd Senior Analyst Margaret McGranachan Public Health Researcher Elaine Torley Health Improvement Lead Julie Truman Programme Manager Objectives The objectives of the study are:
• to continue to monitor the core health indicators • to use data from all 5 health and wellbeing surveys to determine trends • to compare attitudes and behaviour of those living in the bottom 15% SIMD areas and other areas and address whether changes
in attitudes and behaviour apply across the board or just in the most deprived/other areas, thereby tracking progress towards reducing health inequalities
• to provide intelligence for health improvement policy, programmes and information to enhance performance management. Summary of Methodology In total, 8,633 face-to-face in-home interviews were conducted with adults (aged 16 or over) in the NHSGGC area. The fieldwork was conducted between mid August 2014 and end of January 2015. The response rate for all in-scope attempted contacts was 75% as illustrated in Table A3 in Appendix A.

NHS Greater Glasgow & Clyde 2014/15 Health and Wellbeing Survey Page 3
The sample was stratified proportionately by local authority and SIMD quintile, with addresses selected at random from the residential postcode address file within each stratum. Adults were randomly selected within each sampled household using the last birthday technique. A full account of the sampling procedures, fieldwork and survey response can be found in Appendix A. The survey questionnaire is in Appendix D. 1.2 Thriving Places Sample Profile
Specific neighbourhoods had a boosted sample to allow analysis of findings for Thriving Places in Glasgow. The neighbourhoods reported here and the number of interviews are shown in Table 1.1. Table 1.1 Number of Interviews by Neighbourhood Neighbourhood Unweighted
base (n) Thriving Places: Greater Gorbals 538 Parkhead & Dalmarnock 436 Ruchill & Possilpark 564 1.3 This Report
Chapters 2-5 report on all the survey findings. For each indicator, tables are presented showing the proportion of the sample which met the criteria in each of the neighbourhoods. Comparisons are made for each of the indicators for each of the Thriving Places with the Glasgow City as a whole. Significantly different (p<0.05) comparisons are indicated with the symbol . Where findings show a more positive indicator, compared to Glasgow City, the symbol is shown in green (). Where findings show a more negative indicator compared to Glasgow City, the symbol is shown in red ().

NHS Greater Glasgow & Clyde 2014/15 Health and Wellbeing Survey Page 4
2 People’s Perceptions of Their Health & Illness
2.1 Self-Perceived Health and Wellbeing
Table 2.1 shows the indicators relating to self-perceived health and wellbeing. For all five measures of self-perceived health and wellbeing, those in Greater Gorbals had less positive indicators than those in Glasgow City as a whole. Findings for those in Ruchill & Possilpark were less positive than those in Glasgow City as a whole for four of the five indicators of self-perceived health. Those in Parkhead & Dalmarnock were less likely than those in Glasgow City as a whole to be positive about their general health. However, those in Parkhead & Dalmarnock were more likely than those in Glasgow City as a whole to definitely feel in control of the decisions affecting their daily life. Table 2.1: Indicators for Self-Perceived Health and Wellbeing Thriving Places Comparison Greater
Gorbals Parkhead & Dalmarnock
Ruchill & Possilpark
Glasgow City
Positive perception of general health (Q1)
68% 68% 61% 74%
Positive perception of physical wellbeing (Q29b)
73% 77% 72% 78%
Positive perception of mental or emotional wellbeing (Q29c)
80% 82% 76% 84%
Feel definitely in control of decisions affecting daily life (Q50)
54% 73% 61% 64%
Positive perception of quality of life (Q29a) 79% 83% 77% 85% 2.2 Illness
Table 2.2 and Figure 2.1 shows the proportion of respondents in each area who had a limiting long-term condition or illness and those proportion who were receiving treatment for at least one condition. In all three thriving places, respondents were more likely than those

NHS Greater Glasgow & Clyde 2014/15 Health and Wellbeing Survey Page 5
in Glasgow City as a whole to have a limiting condition or illness. Those in Parkhead & Dalmarnock and those in Ruchill & Possilpark were more likely than those in Glasgow City as a whole to be receiving treatment for at least one condition. Table 2.2: Indicators for Illness Thriving Places Comparison Greater
Gorbals Parkhead & Dalmarnock
Ruchill & Possilpark
Glasgow City
Have a limiting long-term condition or illness (Q2)
29% 32% 36% 22%
Receiving treatment for at least one condition (Q3)
40% 47% 48% 38%
Figure 2.1: Indicators for Illness
29% 32% 36%
22%
40% 47% 48%
38%
0% 10% 20% 30% 40% 50% 60% 70% 80% 90%
100%
Greater Gorbals Parkhead & Dalmarnock
Ruchill & Possilpark Glasgow City
Have a limiting long-term condition Receiving treatment for at least one condition

NHS Greater Glasgow & Clyde 2014/15 Health and Wellbeing Survey Page 6
2.3 Mental Wellbeing
Warwick-Edinburgh Mental Wellbeing Scale (WEMWBS) Scores The survey used the Warwick-Edinburgh Mental Wellbeing Scale (WEMWBS)3
to assess positive mental health (mental wellbeing). This uses 14 positively worded questions. Scores are derived by summing responses to each of the 14 questions on a 1-5 likert scale. Thus, the maximum score is 70 and the minimum score is 14. The scale is designed to allow the measurement of mean scores in population samples. The Scottish Health Survey has consistently shown the mean WEMWBS score for the Scottish adult population to be around 50, with the 2012 survey showing a mean score of exactly 50.0.
The mean WEMWBS score was 52.5 for Glasgow City. Those in Greater Gorbals and those in Ruchill & Possilpark had lower mean WEMWBS scores than those in Glasgow City as a whole.
3 http://www2.warwick.ac.uk/fac/med/research/platform/wemwbs/

NHS Greater Glasgow & Clyde 2014/15 Health and Wellbeing Survey Page 7
Table 2.3: Mean WEMWBS Scores Thriving Places Comparison Greater
Gorbals Parkhead & Dalmarnock
Ruchill & Possilpark
Glasgow City
Mean WEMWBS Score 50.6 52.4 50.9 52.5

NHS Greater Glasgow & Clyde 2014/15 Health and Wellbeing Survey Page 8
3 Health Behaviours
3.1 Smoking
Table 3.1 shows the indicators relating to smoking. Key significant findings include:
• Those in Parkhead & Dalmarnock and Ruchill & Possilpark were more likely to be exposed to second hand smoke than those in Glasgow City.
• All three thriving places had higher smoking rates than Glasgow City as a whole. • Among smokers, those in Greater Gorbals were less likely than those in Glasgow City as a whole to intend to stop smoking. • Those in Greater Gorbals and Parkhead & Dalmarnock were more likely than those in Glasgow City as a whole to have used e-
cigarettes. Table 3.1: Indicators Relating to Smoking Thriving Places Comparison Greater
Gorbals Parkhead & Dalmarnock
Ruchill & Possilpark
Glasgow City
Exposed to second hand smoke most/some of the time (Q8)
39% 61% 48% 39%
Current smoker (Q9)
34% 46% 36% 28%
Intend to stop smoking (among smokers) (Q10)
20% 28% 35% 31%
Used e-cigarettes in last year (Q11)
18% 22% 16% 14%

NHS Greater Glasgow & Clyde 2014/15 Health and Wellbeing Survey Page 9
Figure 3.1 Proportion currently smoking
Respondents were also asked the extent to which they agreed or disagreed with five statements about e-cigarettes. The proportion who agreed with each statement, for each area, is shown in Table 3.2.
34%
46%
36% 28%
0%
10%
20%
30%
40%
50%
60%
70%
80%
90%
100%
Greater Gorbals Parkhead & Dalmarnock
Ruchill & Possilpark Glasgow City
% c
urre
nt sm
oker
s

NHS Greater Glasgow & Clyde 2014/15 Health and Wellbeing Survey Page 10
Table 3.2: Proportion Agreeing With Statements about E-Cigarettes Thriving Places Comparison Greater
Gorbals Parkhead & Dalmarnock
Ruchill & Possilpark
Glasgow City
Agree: E-cigarettes encourage people to stop smoking
47% 56% 48% 46%
Agree: E-cigarettes encourage people to start smoking
18% 22% 30% 22%
Agree: E-cigarettes are harmless to health
23% 41% 35% 20%
Agree: E-cigarettes are as harmful to health as normal cigarettes
17% 27% 24% 21%
Agree: E-cigarettes are helping smoking to become more acceptable
26% 40% 34% 33%
3.2 Drinking
Frequency of Drinking Alcohol Respondents were asked how often they drank alcohol. Just over one in three (35%) of those in Glasgow City said they never drank alcohol. Those in Greater Gorbals were more likely than those in Glasgow City to say they never drank alcohol. Respondents were also asked whether they had had a drink of alcohol in the preceding week. Just under two in five (38%) of those in Glasgow City had drunk alcohol during the preceding week. Those in all three thriving places were less likely than those in Glasgow City as a whole to have drunk alcohol in the preceding week.

NHS Greater Glasgow & Clyde 2014/15 Health and Wellbeing Survey Page 11
Table 3.3: Indicators for Frequency of Drinking Alcohol Thriving Places Comparison Greater
Gorbals Parkhead & Dalmarnock
Ruchill & Possilpark
Glasgow City
Never drink alcohol (Q13)
41% 33% 38% 35%
Drank alcohol in last week (Q14)
28% 29% 28% 38%
Figure 3.2: Proportion who Drank Alcohol in the Last Week
28% 29% 28%
38%
0%
10%
20%
30%
40%
50%
60%
70%
80%
90%
100%
Greater Gorbals Parkhead & Dalmarnock
Ruchill & Possilpark Glasgow City
% d
rank
alc
ohol
in la
st w
eek

NHS Greater Glasgow & Clyde 2014/15 Health and Wellbeing Survey Page 12
Alcohol Consumption in Previous Week Respondents were asked how many of each type of drink they had consumed on each of the past seven days. Responses were used to calculate the total units of alcohol consumed on each day, and a total number of units for the week. For the 2008 and 2011 surveys, in calculating the number of units, new assumptions were applied for the number of units in each type of drink which differed from those which were applied in earlier surveys in the Greater Glasgow area. Appendix D shows the assumptions of units in each type of drink for both the current survey (and 2008 and 2011 surveys) and for the surveys up to 2005. The data presented here show indicators for the new unit measures. The recommended weekly limit for alcohol consumption is 21 units per week for men and 14 units per week for women. Binge drinkers were defined as:
• Men who consumed eight or more units of alcohol on at least one day in the previous week; • Women who consumed six or more units of alcohol on at least one day in the previous week.
It is recommended that men should drink no more than four units of alcohol a day and women should drink no more than three units per day. Those in all three thriving places were less likely than those in Glasgow City as a whole to have been binge drinkers in the previous week. Those in all three thriving places were also less likely than those in Glasgow City as a whole to exceed the daily limit for alcohol consumption on at least one day per week. Table 3.4: Indicators for Alcohol Consumption During Previous Week Thriving Places Comparison Greater
Gorbals Parkhead & Dalmarnock
Ruchill & Possilpark
Glasgow City
Exceed weekly limit for alcohol consumption
8% 9% 6% 8%
Binge drank in last week
13% 12% 13% 17%
Had two or more alcohol-free days in last week
97% 96% 97% 97%
NHS Greater Glasgow & Clyde 2014/15 Health and Wellbeing Survey Page 13
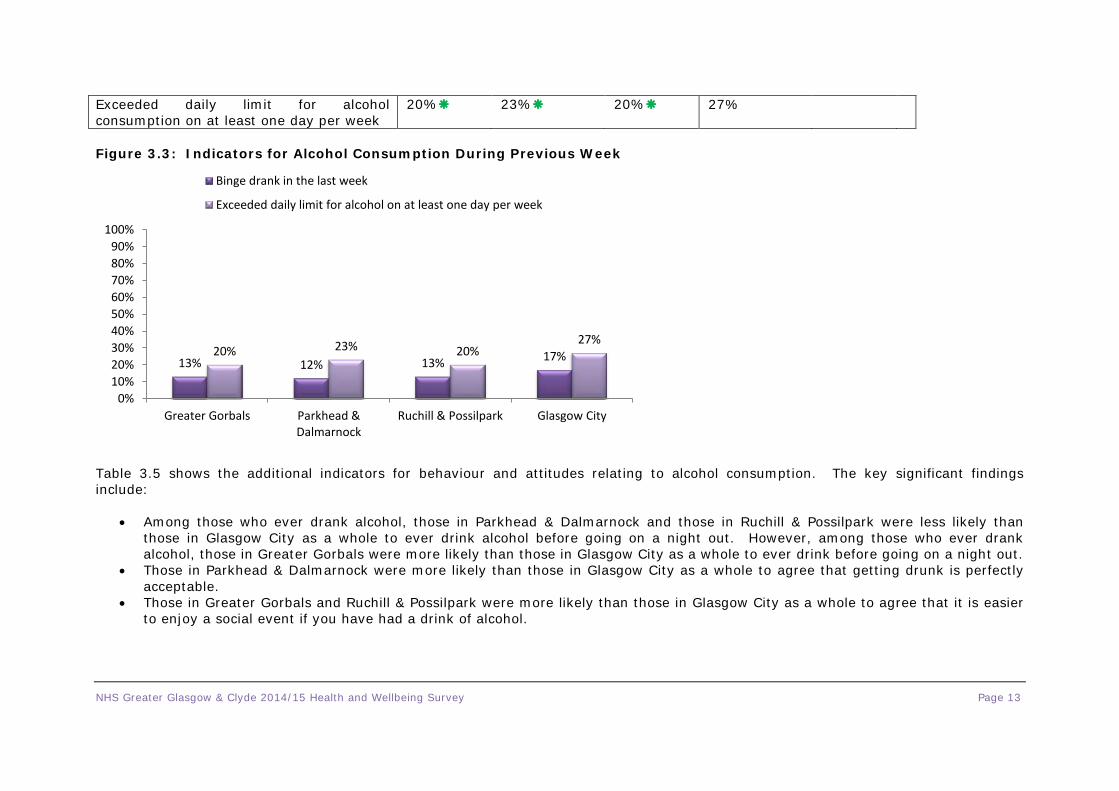
Exceeded daily limit for alcohol consumption on at least one day per week
20% 23% 20% 27%
Figure 3.3: Indicators for Alcohol Consumption During Previous Week
Table 3.5 shows the additional indicators for behaviour and attitudes relating to alcohol consumption. The key significant findings include:
• Among those who ever drank alcohol, those in Parkhead & Dalmarnock and those in Ruchill & Possilpark were less likely than those in Glasgow City as a whole to ever drink alcohol before going on a night out. However, among those who ever drank alcohol, those in Greater Gorbals were more likely than those in Glasgow City as a whole to ever drink before going on a night out.
• Those in Parkhead & Dalmarnock were more likely than those in Glasgow City as a whole to agree that getting drunk is perfectly acceptable.
• Those in Greater Gorbals and Ruchill & Possilpark were more likely than those in Glasgow City as a whole to agree that it is easier to enjoy a social event if you have had a drink of alcohol.
13% 12% 13% 17% 20% 23% 20% 27%
0% 10% 20% 30% 40% 50% 60% 70% 80% 90%
100%
Greater Gorbals Parkhead & Dalmarnock
Ruchill & Possilpark Glasgow City
Binge drank in the last week
Exceeded daily limit for alcohol on at least one day per week

NHS Greater Glasgow & Clyde 2014/15 Health and Wellbeing Survey Page 14
• Those in Parkhead & Dalmarnock and those in Ruchill & Possilpark were more likely than those in Glasgow City as a whole to say there were too many places selling alcohol in their area. However, those in Greater Gorbals were less likely than those in Glasgow City as a whole to say there were too many places selling alcohol.
• Those in Parkhead & Dalmarnock and those in Ruchill & Possilpark were less likely than those in Glasgow City as a whole to have had alcohol delivered to their home.
Table 3.5: Other Indicators for Behaviours and Attitudes Relating to Alcohol Consumption Thriving Places Comparison Greater
Gorbals Parkhead & Dalmarnock
Ruchill & Possilpark
Glasgow City
(Of those who ever drink alcohol) Ever drink before going on a night out (Q16)
47% 28% 31% 37%
Agree: getting drunk is a perfectly acceptable thing to do (Q18a)
16% 23% 17% 19%
Agree: it is easier to enjoy a social event if you've had a drink of alcohol (Q18b)
51% 38% 46% 36%
Perceived too many places selling alcohol in local area (Q20)
23% 39% 57% 30%
Ever had alcohol delivered to home (Q19)
7% 3% 3% 6%
3.3 Physical Activity
Table 3.6 shows the indicators relating to physical activity. The physical activity target is to be active for at least 150 minutes per week. Those in Greater Gorbals and those in Parkhead & Dalmarnock were less likely than those in Glasgow City as a whole to meet this target. However, those in Ruchill & Possilpark were more likely than those in Glasgow City as a whole to meet this target. Those in Parkhead & Dalmarnock were less likely than those in Glasgow City as a whole to have participated in any sport or activity in the last week.

NHS Greater Glasgow & Clyde 2014/15 Health and Wellbeing Survey Page 15
Table 3.6: Indicators for Physical Activity Thriving Places Comparison Greater
Gorbals Parkhead & Dalmarnock
Ruchill & Possilpark
Glasgow City
Met target of taking 150 minutes or more of moderate physical activity per week
60% 63% 74% 69%
Participated in at least one sport or activity in previous week
84% 78% 87% 86%
Participated in: Domestic activity
54% 42% 59% 51%
Walking for commuting
52% 42% 56% 48%
Walking for recreation
22% 31% 20% 34%
Any sport (leisure centre based activity, team sports, water based sports, racket sports, dancing, cycling, athletics, martial arts)
32% 28% 30% 36%
3.4 Diet
Fruit and Vegetables The national target for fruit and vegetable consumption is to have at least five portions of fruit and/or vegetables per day. Those in all three thriving places were less likely than those in Glasgow City as a whole to meet this target.

NHS Greater Glasgow & Clyde 2014/15 Health and Wellbeing Survey Page 16
Table 3.7: Indicators for Diet Thriving Places Comparison Greater
Gorbals Parkhead & Dalmarnock
Ruchill & Possilpark
Glasgow City
Met target of 5+ portions of fruit/vegetables per day
33% 21% 22% 37%
Consume no fruit/vegetables per day
11% 15% 19% 9%
Figure 3.4: Proportion who Met Target of Consuming Five or More Portions of Fruit/Vegetables Per Day
33%
21% 22%
37%
0%
10%
20%
30%
40%
50%
60%
70%
80%
90%
100%
Greater Gorbals Parkhead & Dalmarnock
Ruchill & Possilpark Glasgow City
% m
et ta
rget
of 5
+ po
rtio
ns o
f fru
it/ve
g pe
r day

NHS Greater Glasgow & Clyde 2014/15 Health and Wellbeing Survey Page 17
3.5 Body Mass Index (BMI)
Respondents were asked to state their height and weight, from which their Body Mass Index (BMI) was calculated. BMI classification points are defined as follows: Underweight BMI below 18.5 Ideal weight BMI between 18.5 and 24.99 Overweight BMI between 25 and 29.99 Obese BMI between 30 and 39.99 Very obese BMI 40 or over
However, due to a recognised tendency for people to over-report height and under-report weight, a revised cut off for obesity has been applied at 29.2. The proportion of overweight and obese respondents in each thriving place is shown in Table 3.8. These did not differ significantly with findings for Glasgow City as a whole. Table 3.8: Proportion Overweight and Obese Thriving Places Comparison Greater
Gorbals Parkhead & Dalmarnock
Ruchill & Possilpark
Glasgow City
BMI indicating overweight (25+)
50% 47% 51% 48%
BMI indicating obese (29.2+)
22% 22% 26% 22%

NHS Greater Glasgow & Clyde 2014/15 Health and Wellbeing Survey Page 18
3.6 Unhealthy and Healthy Behaviour Indices
An ‘unhealthy’ behaviour index has been derived from the following five unhealthy behaviours:
• Smoking; • Having a BMI of 25 or over; • Not meeting the recommended levels of physical activity; • Not meeting the recommended level of fruit and vegetable consumption; and • Binge drinking.
A ‘healthy behaviour index’ was also developed, which examined the extent to which respondents exhibited multiple healthy behaviours. The five healthy behaviours used in the index were:
• Not smoking; • Having a BMI within the ideal range (18.5 to 24.99); • Meeting the physical activity recommendations; • Consuming five or more portions of fruit/vegetables per day; and • Either not drinking or drinking within safe limits (i.e. not binging or drinking too much in a week).
Table 3.9 shows the mean number of unhealthy and healthy behaviours exhibited by respondents in each area. The mean number of unhealthy behaviours was 2.07 in Glasgow City. The mean number of healthy behaviours was 2.88 in Glasgow City. Those in Parkhead & Dalmarnock and Ruchill & Possilpark had a higher mean number of unhealthy behaviours and lower mean number of healthy behaviours than those in Glasgow City. Table 3.9: Mean Number of Unhealthy and Healthy Behaviours Thriving Places Comparison Greater
Gorbals Parkhead & Dalmarnock
Ruchill & Possilpark
Glasgow City
Mean number of unhealthy behaviours
2.13 2.42 2.33 2.07
Mean number of healthy behaviours
2.82 2.52 2.61 2.88
NHS Greater Glasgow & Clyde 2014/15 Health and Wellbeing Survey Page 19
4 Social Health
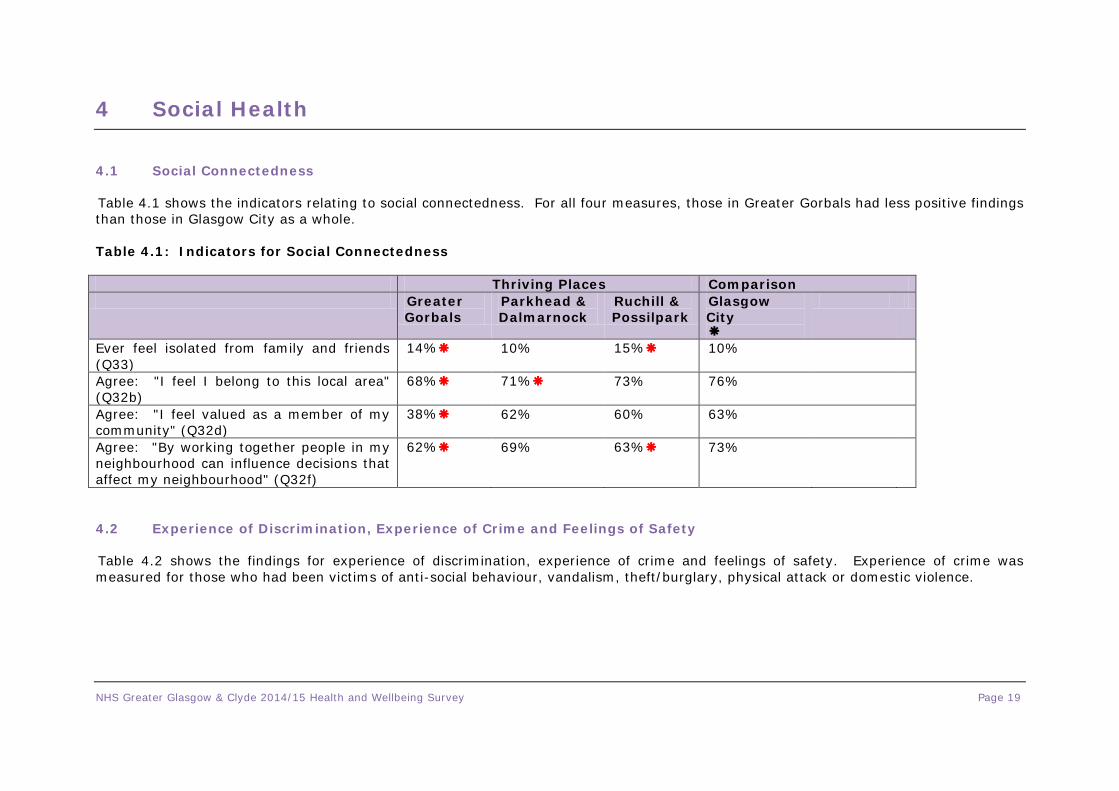
4.1 Social Connectedness
Table 4.1 shows the indicators relating to social connectedness. For all four measures, those in Greater Gorbals had less positive findings than those in Glasgow City as a whole. Table 4.1: Indicators for Social Connectedness Thriving Places Comparison Greater
Gorbals Parkhead & Dalmarnock
Ruchill & Possilpark
Glasgow City
Ever feel isolated from family and friends (Q33)
14% 10% 15% 10%
Agree: "I feel I belong to this local area" (Q32b)
68% 71% 73% 76%
Agree: "I feel valued as a member of my community" (Q32d)
38% 62% 60% 63%
Agree: "By working together people in my neighbourhood can influence decisions that affect my neighbourhood" (Q32f)
62% 69% 63% 73%
4.2 Experience of Discrimination, Experience of Crime and Feelings of Safety
Table 4.2 shows the findings for experience of discrimination, experience of crime and feelings of safety. Experience of crime was measured for those who had been victims of anti-social behaviour, vandalism, theft/burglary, physical attack or domestic violence.

NHS Greater Glasgow & Clyde 2014/15 Health and Wellbeing Survey Page 20
Key significant findings include:
• Those in Ruchill & Possilpark were more likely than those in Glasgow City as a whole to feel they had been discriminated against in the last year.
• Those in Parkhead & Dalmarnock were more likely than those in Glasgow City as a whole to have been a victim of crime in the last year.
• Those in Parkhead & Dalmarnock and those in Ruchill & Possilpark were less likely than those in Glasgow City as a whole to feel safe walking alone in their local area, even after dark.
Table 4.2: Indicators for Experience of Discrimination, Experience of Crime and Feelings of Safety Thriving Places Comparison Greater
Gorbals Parkhead & Dalmarnock
Ruchill & Possilpark
Glasgow City
Been discriminated against in the last year (Q60)
3% 5% 7% 4%
Been victim of crime in the last year (Q40)
11% 17% 12% 13%
Feel safe using local public transport (Q39a)
89% 86% 89% 89%
Feel safe walking alone in local area even after dark (Q39b)
64% 54% 54% 67%
4.3 Social Issues in the Local Area
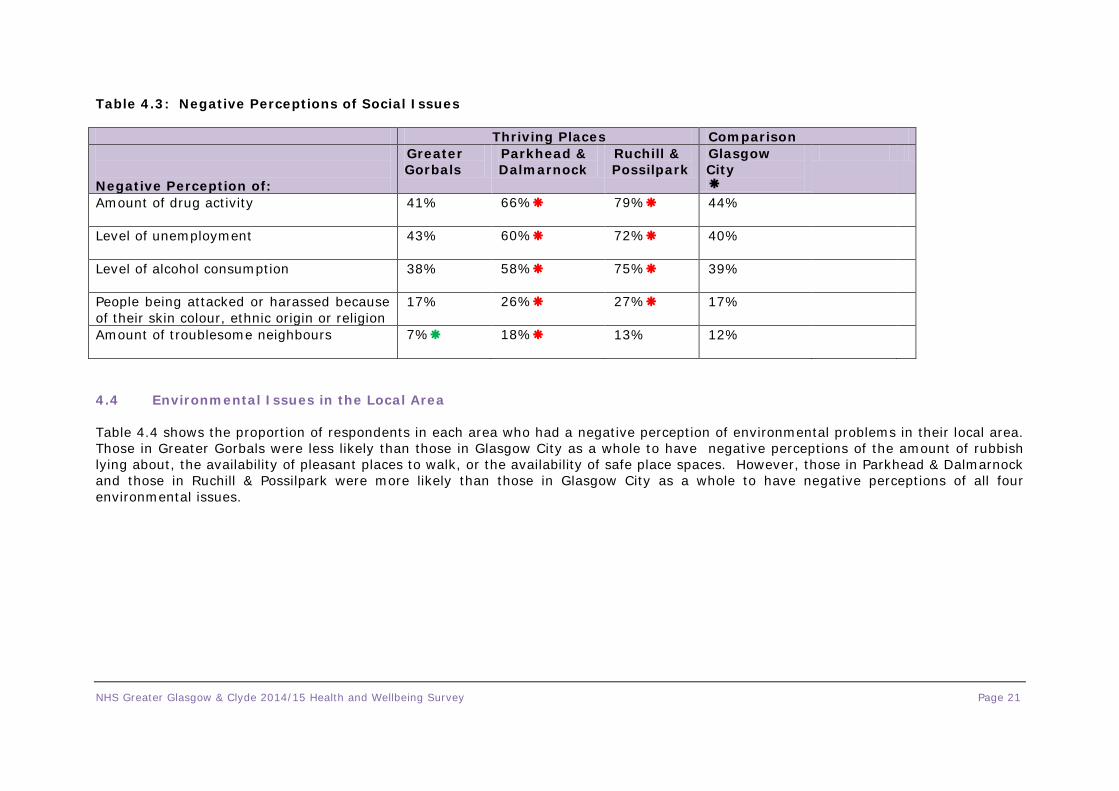
Table 4.3 shows the proportion of respondents in each area who had a negative perception of social problems in their area. Those in Parkhead & Dalmarnock were more likely than those in Glasgow City as a whole to have a negative perception of all five social issues. Those in Ruchill & Possilpark were more likely than those in Glasgow City as a whole to have a negative perception of four of the five social issues. Those in Greater Gorbals were less likely than those in Glasgow City as a whole to have a negative perception of the amount of troublesome neighbours.
NHS Greater Glasgow & Clyde 2014/15 Health and Wellbeing Survey Page 21
Table 4.3: Negative Perceptions of Social Issues Thriving Places Comparison Negative Perception of:
Greater Gorbals
Parkhead & Dalmarnock
Ruchill & Possilpark
Glasgow City
Amount of drug activity
41% 66% 79% 44%
Level of unemployment
43% 60% 72% 40%
Level of alcohol consumption
38% 58% 75% 39%
People being attacked or harassed because of their skin colour, ethnic origin or religion
17% 26% 27% 17%
Amount of troublesome neighbours
7% 18% 13% 12%
4.4 Environmental Issues in the Local Area
Table 4.4 shows the proportion of respondents in each area who had a negative perception of environmental problems in their local area. Those in Greater Gorbals were less likely than those in Glasgow City as a whole to have negative perceptions of the amount of rubbish lying about, the availability of pleasant places to walk, or the availability of safe place spaces. However, those in Parkhead & Dalmarnock and those in Ruchill & Possilpark were more likely than those in Glasgow City as a whole to have negative perceptions of all four environmental issues.

NHS Greater Glasgow & Clyde 2014/15 Health and Wellbeing Survey Page 22
Table 4.4: Negative Perceptions of Environmental Issues Thriving Places Comparison Negative perception of:
Greater Gorbals
Parkhead & Dalmarnock
Ruchill & Possilpark
Glasgow City
Amount of dogs' dirt
34% 49% 53% 38%
Amount of rubbish lying about
19% 43% 42% 31%
Availability of safe play spaces
16% 36% 42% 23%
Availability of pleasant places to walk
8% 28% 33% 15%
4.5 Perceived Quality of Services in the Area
Respondents were given a list of seven local services and asked to rate each (excellent, good, adequate, poor or very poor). Table 4.5 shows proportion who rated each service positively (i.e. excellent or good). The number of respondents answering ‘don’t know’ varied for different types of service reflecting the level of use. ‘Don’t know’ responses have been excluded from analysis. Those in Greater Gorbals were more likely than those in Glasgow City as a whole to give a positive rating of local public transport, police, leisure/sports facilities, childcare provision and activities for young people. However, those in Greater Gorbals were less likely than those in Glasgow City as a whole to rate local food shops positively. Six of the seven local services were rated less positively by those in Ruchill & Possilpark than those in Glasgow City as a whole. However, those in Ruchill & Possilpark were more likely than those in Glasgow City as a whole to rate local public transport positively.

NHS Greater Glasgow & Clyde 2014/15 Health and Wellbeing Survey Page 23
Table 4.5: Positive Perceptions of Local Services Thriving Places Comparison Positive perception of:
Greater Gorbals
Parkhead & Dalmarnock
Ruchill & Possilpark
Glasgow City
Local schools
73% 71% 61% 75%
Public transport
87% 76% 82% 78%
Food shops
42% 70% 48% 69%
Police
75% 54% 37% 57%
Leisure/sports facilities
74% 49% 18% 46%
Childcare provision
55% 41% 28% 47%
Activities for young people
44% 34% 18% 38%
4.6 Individual Circumstances
Table 4.6 shows the indicators relating to individual circumstances. Among the significant findings, all three thriving places were more likely than those in Glasgow City as a whole to:
• Have no educational qualifications; • Receive all household income from benefits; • Ever have difficulty meeting the costs of rent/mortgage, fuel bills, telephone bills, council tax/insurance, food or clothes/shoes; • Have a problem meeting unexpected expenses of £20, £100 or £1,000.
Also, those in all three thriving places were less likely than those in Glasgow City to be economically active or to live in an owner-occupied home.

NHS Greater Glasgow & Clyde 2014/15 Health and Wellbeing Survey Page 24
Those in Parkhead & Dalmarnock were more likely than those in Glasgow City as a whole to have caring responsibilities. Those in Greater Gorbals and those in Ruchill & Possilpark were more likely than those in Glasgow City as a whole to live in a home with a working smoke alarm.
Table 4.6: Indicators for Individual Circumstances Thriving Places Comparison Positive perception of:
Greater Gorbals
Parkhead & Dalmarnock
Ruchill & Possilpark
Glasgow City
Caring responsibilities (Q58)
5% 11% 8% 6%
No educational qualifications (Q47)
24% 32% 29% 19%
All household income from state benefits (Q56)
38% 32% 44% 20%
Any type of gambling in the last month (Q51) 32% 34%
38% 32%
Ever have difficulty meeting costs of rent/mortgage, fuel bills, telephone bills, council tax/insurance, food or clothes/shoes
46% 38% 48% 33%
Problem meeting unexpected expense of £20
14% 20% 22% 11%
Problem meeting unexpected expense of £100
59% 61% 59% 46%
Problem meeting unexpected expense of £1,000
85% 90% 86% 76%
Positive perception of adequacy of household income
62% 69% 55% 72%
Economically active (Q45)
37% 39% 37% 47%
Live in owner-occupied home (Q55)
19% 21% 20% 44%
Live in home with a working smoke alarm
96% 94% 98% 92%

NHS Greater Glasgow & Clyde 2014/15 Health and Wellbeing Survey Page 25
5 Social Capital
5.1 Social Capital
Table 5.1 shows the indicators for social capital. These have been derived as follows:
• Respondents were asked to indicate the extent to which they agree or disagree with the following statements: “This is a neighbourhood where neighbours look out for each other”, and “Generally speaking, you can trust people in my local area”. Those agreeing with the first statement were categorised as having a positive view of reciprocity, and those agreeing with the second were categorised as having a positive view of trust.
• Respondents were asked to indicate the extent to which they agree or disagree with the statement: “The friendships and
associations I have with other people in my local area mean a lot to me”. Those agreeing with this statement ere categorised as valuing local friendships.
• Respondents were asked to indicate the extent to which they agree or disagree with the statement: “If I have a problem, there is
always someone to help me”. Those agreeing with this statement were categorised as having a positive view of social support.
• Volunteers were those who had given up any time to help any clubs, charities, campaigns or organisations in an unpaid capacity in the last year.
• To measure 'social activism', respondents were asked whether, in the last 12 months they had taken any of the following actions
in an attempt to solve a problem affecting people in their local area: • contacted any media, organisation, council, councillor or MP; • attended a public meeting, tenants/residents group, protest meeting or action group; • organised a petition on a local issue; or • some other types of social activism.
Compared to those in Glasgow City as a whole, those in Greater Gorbals and those in Ruchill & Possilpark has less favourable findings for six of the seven measures of social capital, and those in Parkhead & Dalmarnock had less favourable findings for four measures.

NHS Greater Glasgow & Clyde 2014/15 Health and Wellbeing Survey Page 26
Table 5.1: Indicators for Social Capital Thriving Places Comparison Positive perception of:
Greater Gorbals
Parkhead & Dalmarnock
Ruchill & Possilpark
Glasgow City
Positive perception of reciprocity (Q32a)
65% 69% 65% 70%
Positive perception of trust (Q32e)
65% 61% 56% 72%
Value local friendships (Q32c)
56% 69% 66% 73%
Positive perception of social support (Q32g)
75% 75% 76% 78%
Volunteered in last year (Q34)
10% 10% 15% 19%
Belong to clubs/associations/groups (Q35)
15% 7% 17% 21%
Participated in social activism (Q36)
5% 5% 6% 15%

NHS Greater Glasgow & Clyde 2014/15 Health and Wellbeing Survey Page A1
APPENDIX A: SURVEY METHODOLOGY & RESPONSE
This appendix has been prepared by BMG Research. NHSGGC provided BMG Research with a datazone definition file that identified the key criteria of each datazone within the study area, including SIMD 2012, CHCP, neighbourhood etc. Datazones formed the sampling points within each area, with their selection based on a stratification by SIMD within each of the target areas to ensure a representative datazone selection by deprivation. The postcode address file (PAF) was then used to randomly select 25 addresses per datazone to form the sampling frame, with a target of 10 interviews to achieve per datazone. It was found that during this process, a number of target areas (for example, Parkhead/Dalmarnock neighbourhood boost) did not have sufficient datazones to achieve the target using the ‘25 addresses sampled to achieve 10 interviews’ process. In these instances, a greater number of addresses were sampled within each datazone to achieve the sample, but at all times only 2.5 times to number of addresses were supplied to achieve the target, thus ensuring the response rates were protected and consistent. Therefore, in summary:
• 579 datazones were sampled in total. • 21,793 addresses were sampled in total across these datazones. • Each address received a pre-survey letter in the post prior to being approached for interview, which gave the household the
opportunity to ‘opt out’, and responding households were left with an information leaflet on completion of the interview. • The sample was de-duped wherever possible against other survey fieldwork being conducted in the study area (i.e. GoEast). • The datazones were allocated to one of four ‘survey waves’, which ensured a broad spread of interviews in any given target area
across the survey period, thus controlling for seasonal affects. The resulting number of achieved interviews per CHCP per wave is shown in the table below.

NHS Greater Glasgow & Clyde 2014/15 Health and Wellbeing Survey Page A2
Table A1: Number of interviews achieved per CHCP per wave
CHCP
Wave 1 (August to mid Sept)
Wave 2 (mid Sept
to end Oct)
Wave 3 (end Oct to mid Dec)
Wave 4 (mid Dec
to end Jan)
Total
East Dunbartonshire 53 638 191 236 1118
East Renfrewshire 116 15 277 195 603
Glasgow North East 365 747 266 183 1561
Glasgow North West 308 282 183 343 1116
Glasgow South 342 522 350 452 1666
Inverclyde 200 128 566 284 1178
Renfrewshire 251 1 596 355 1203
West Dunbartonshire 0 188 0 0 188
Total 1635 2521 2429 2111 86334 Prior to fieldwork commencing, a pilot was conducted to test a number of aspects of the methodology, including sampling, questionnaire content/flow, CAPI script functionality, and contact management in terms of recording call outcomes at addresses. A total of 43 interviews were conducted as part of the pilot, with achieved interviews split proportionately according to the following:
• Glasgow City / East Dunbartonshire & East Renfreshire / Renfrewshire & Inverclyde. • Index of multiple deprivation. • Age (16-44, 45-64, 65+). • Gender.
A total of 52 interviewers were briefed and worked on this project. The initial briefing session took place in early August, with NHSGGC in attendance. A further 5 briefing sessions took place subsequent to this with interviewers who were unable to attend the initial briefing. The
4 Although the original target was set at 8674.The final number of interviews was short of this target. The main reason for this was a shortfall in the Parkhead/ Dalmarnock area where fieldwork was also taking place for the Go Well study. This placed a restriction on the number of datazone that were available for the study.

NHS Greater Glasgow & Clyde 2014/15 Health and Wellbeing Survey Page A3
maximum number of interviews conducted by any one interviewer was 843, which is below BMG Research’s policy of 10% of all interviews achieved. The minimum and maximum numbers achieved per interviewer ranged from 3 to 843, with the average being 169 each. The interviews lasted an average of 35 minutes, with the maximum length of 1hr 23mins. All interviewers were briefed that each address must be attempted up to four times before it is deemed exhausted. However, to effectively manage this, each of the four attempts was to be made at different times of the day and week. This ensures the greatest opportunity for all resident groups to be captured, particularly those in work. The following table provides the breakdown of interviews achieved by time of day and weekday or weekend, and it can be seen that more than half of the interviews were completed at weekends or evenings. Table A2: Number of achieved interviews by time of day and week
Number of interviews completed %
Weekday before 12 465 5%
Weekday 12-4 3685 43%
Weekday after 4 2139 25%
Weekend 2344 27%

NHS Greater Glasgow & Clyde 2014/15 Health and Wellbeing Survey Page A4
Table A3 Call outcomes and response rates
% of all contacts
% of valid contacts
% where contact was
made Interview obtained 8633 39.6 46.3 75.3
No reply 5225 24.0 28.0 -
Exhausted after 4 knocks 228 1.0 1.2 -
Opt out prior to interview 1742 8.0 9.3 -
Hard refusal 1159 5.3 6.2 10.1
Refused - illness / dementia 138 0.6 0.7 1.2
Refused - no time 787 3.6 4.2 6.9
Other refused 629 2.9 3.4 5.5
Call back / appointment 35 0.2 0.2 0.3
Language issues 54 0.2 0.3 0.5
Away at hospital during survey period 31 0.1 0.2 0.3
Non-valid contacts
Not attempted because target achieved 2887 13.2 - -
Business / institution 40 0.2 - -
Empty/derelict 200 0.9 - -
No-one aged 16+ 5 0.0 - -
Sample base 21793 18661 11466

NHS Greater Glasgow & Clyde 2014/15 Health and Wellbeing Survey Page A5
APPENDIX B: DATA WEIGHTING
Introduction Data were weighted to ensure that they were as representative as possible of the adult population in the NHSGGC area. This appendix describes the weighting processes. Household Size Weighting In this survey, households were selected at random and therefore had equal probability of selection. However within the household the probability of an individual's selection is not necessarily equal to that of others, since it is inversely proportional to the number of people available to be selected. For example, in a single-person household the probability of selection is exactly 1 whereas in a four-person household the probability of selection is 1/4. The logic of this implies that the respondent from the single-person household represents one person (him/herself) while the respondent from the four-person household is in fact representing four people. It is normal to allow for this bias by 'weighting' the sample to give the respondent from the four-person household four times the 'weight' of the respondent from the one-person household. It is usual to calculate this weighting in such a way that the sum of the weights matches the sample size. The formula for calculating the household size weight was:
ATFWf ×=
Where: Wf is the household size weighting factor for a respondent living in a household size F. F is the household size T is the total number of respondents A is the total number of adults in all households where a successful interview took place.

NHS Greater Glasgow & Clyde 2014/15 Health and Wellbeing Survey Page A6
Weighting by Age/Gender/Bottom 15%/CH(C)P or Neighbourhood Firstly the household size weighting was applied to the dataset. This produced the new ‘actual’ counts to which we applied the age/sex/bottom15%5
/CH(C)P or Neighbourhood weighting frame to produce the final weighting factors. This ensured that the weighted data would reflect the overall Greater Glasgow and Clyde population in terms of age, gender, bottom 15%/other areas and CH(C)P areas (or neighbourhoods in the case of Glasgow City). The formula for this stage of the weighting process was:
CciWi =
tiT
×
Where:
Wi is the individual weighting factor for a respondent in age/gender/bottom15% versus other areas/CH(C)P or neighbourhood group i
ci is the known population in age/gender/bottom15% versus other areas/CH(C)P or neighbourhood group i
C is the total adult population in the NHS Greater Glasgow and Clyde area
T is the total number of interviews
ti is the number of interviews (weighted by the household size weighting factor) for age/gender/bottom15% versus other areas/CH(C)P or neighbourhood group i
5 Bottom 20% in the case of East Dunbartonshire

NHS Greater Glasgow & Clyde 2014/15 Health and Wellbeing Survey Page A7
APPENDIX C: ASSUMPTIONS OF NUMBER OF UNITS OF ALCOHOL IN EACH TYPE OF DRINK (1999-2005 and 2008-2014)
The table below shows the assumed number of units of alcohol in each type of drink that were used for the calculation of unit consumption up to 2005, and the new assumptions that have been applied since 2008.
UNIT ASSUMPTION USED FOR ANALYSIS 1999, 2002 and 2005
UNIT ASSUMPTION USED FOR ANALYSIS 2008, 2011 and 2014
Normal strength beer - pints 2.30 2.80 Normal strength beer - cans 1.80 2.20 Normal strength beer bottles 1.00 1.70 Strong beer - pints 2.80 3.40 Strong beer - cans 2.25 2.60 Strong beer - bottles 1.80 2.00 Extra strong beer - pints 5.00 5.10 Extra strong beer - cans 4.00 4.00 Extra strong beer - bottles 3.00 3.00 Single measures spirits 1.00 1.00 Single measure martini/sherry/buckfast etc 1.00 1.00 Small glass wine 1.00 1.75 Large glass wine 2.00 3.50 1/2 bottle wine 4.50 5.25 Full bottle wine 8.75 10.50 Small bottle of alcopops 1.50 1.40 Large bottle of alcopops n/a 5.45