nhs lothian primary care strategy · · 2014-04-07our health, our care, our future - appendix 3...
TRANSCRIPT

Our Health, Our Care, Our Future - Appendix 3 Doc 1
Appendix 1 – Developing Person-Centred Primary and Community Services
NHS Lothian
Primary Care Strategy Demand, Capacity and Access
An Overview

Our Health, Our Care, Our Future - Appendix 3 Doc 1
1
Introduction Primary Care Services consist of four distinct professional groups, these are: General Medical Practices (GP practices) General Dental Practices Community Pharmacy Services Optometry Services All the above services are provided, in the main, by practitioners operating as or within independent businesses. It is therefore difficult for the NHS to prescribe what range and quantity of resources each should provide to deliver the services contracted for, or to ascertain what resources each has in place. Demand, Capacity and Access issues will differ markedly between localities and between providers within the same locality. The main drivers for the above differences centre on local population growth, deprivation, demographics, the impacts of Shifting the Balance of Care, availability of adequate resources in Community Services, the efficiency of the structure (man-power/staff mix), systems and processes internal to the individual provider and the suitability and capacity of premises. Each of the above will have its own impact and, where more than one factor is present; will have as minimum a cumulative, if not an exponential, impact.

2
Demand The growth in demand on Primary Care Services is affected by numerous factors, few of which can be immediately influenced by Practices or the NHS. These include: Population Growth in locality (impact on Practice lists size) Demographics of Practice population (particularly those impacts related to a growing elderly population, in terms of consultation frequency, complexity and duration, and the increase in the incidence of domiciliary visits. Nationality (where patient communication difficulties impact on length of consultation and cultural expectations) Deprivation Levels/Volume (historically high-end users of health services, particularly Primary Care) Housing Development Plans (impacts of recent and future housing developments on population growth, practices list sizes and thereby demand) The movement of condition specific patient care into the Primary Care setting and the further expectations of “Shifting the Balance of Care” from the acute sector into the Primary Care and Community setting. The reduction in Community Services (Health Visitors, District Nurses, AHPs etc) over time has increased the need for patients to access GP services. Population Growth Determining what the population growth in Lothian has been and projecting what it may be in the future is subject to a number of data variables, dependant upon the source of the data in question. Traditionally, most planning assumptions for public services, including the NHS, have been based on General Registrar Office (GRO) [now National Records Scotland (NRS)] data and information. To inform the production of this document and in addition to the NRS data, various other data and information sources were examined to obtain a broader picture, with a significant degree variance becoming apparent This included Local Authorities Housing Land Audits, which predict the level of house completions by locality each year, from which the rise in population for an area and therefore for Primary Care services can be calculated. The other source of information examined was that produced by the Practitioner Services Division (PSD) of National Services Scotland (NSS). This data reports the size of General Practice lists as of 1st April each year.

3
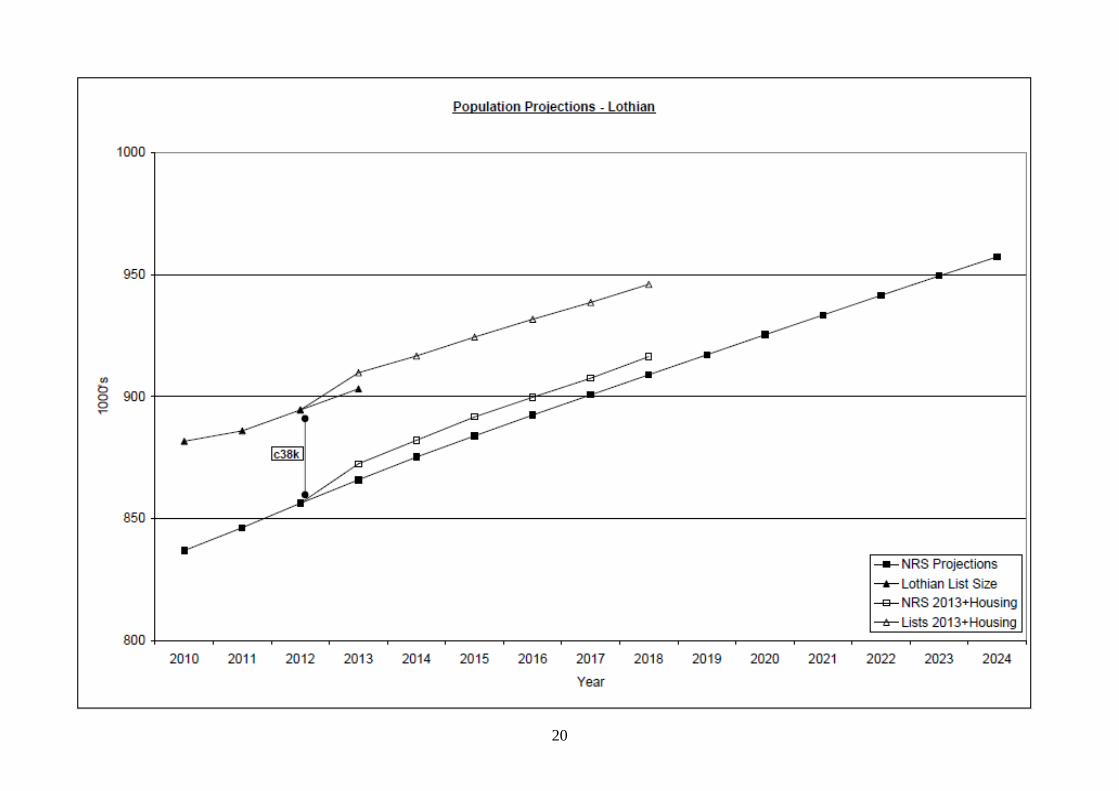
Table 1 below demonstrates the variance between NRS projections and the actual size of GP patient lists over time.
1000’s 2012 2013 2014 2015 2016 2017 2018
NRS Projections 856.20 865.86 875.18 883.86 892.43 900.69 908.96 Lothian List Size 894.50 903.16 Total HLA Impact 6.59 6.91 7.76 7.31 6.85 7.43 NRS 2013+Housing 856.20 872.45 882.08 891.62 899.73 907.55 916.39 Lists 2013+Housing 894.50 909.75 916.66 924.42 931.72 938.58 946.01
Table 1: Comparison between NRS projections1 and cumulative GP Lists2 with population impacts of Lothian Local Authorities’ Housing Land Audits
Graph 1: Lothian Population Projections The graph above clearly demonstrates the disparity between NRS (GRO) projections and the apparent reality at GP practice level. Whilst it is accepted that there will be a degree of churn in practice list sizes the data from each practice, as of 1ST April each year, is compared and validated against the NHS Central Register (NHSCR) Demographic Extract. Using 2012 as a common point of origin (NRS estimate based on 2011 Census and GP lists size for that year), the population impacts of the Lothian local authorities Housing Land Audits has also been projected. The full pan-Lothian population projections are available in Appendix 1 to this document.
1 http://www.gro-scotland.gov.uk/files2/stats/population-projections/scottish-areas-2010-based/j21704310.htm
2 Source: National Services Scotland, Practitioner Services Division

4
Since 2009/10 Practice list sizes, across NHS Lothian, have grown by circa 29k, the equivalent of circa 6 good sized practices. In 2013 there has been an increase in the incidence of practices reporting their patient lists as full or restricted, albeit still open, within Edinburgh City (see Appendix 5), whilst practices in other Health and Social Care Partnerships (HSCPs) report growing pressures. This is at variance with the projections forecast by NRS as, at 2012; there was a gap of circa 38,000 between the reported cumulative NHS Lothian list size and the NRS population estimate for that year. Factors to be considered when looking at this disparity include cross-boundary (external to Lothian) residents registered with Lothian practices, non-notification of emigration and unreported deaths occurring abroad. One conclusion that could be drawn from the above is that the practice list size is the stronger determinant of the demand upon an individual practice and that this should form the basis of any planning for the future. It would, however, be equally important to take cognisance of the projected growth in population for the South-East of Scotland and the Lothian area in particular, combined with the changing demographic profile of that population. Demographics It has been long accepted that the changing demographics across Scotland will have a significant impact upon all NHS services, over time. This is particularly true of Primary Care and Community services and increasingly so when ‘Shifting the Balance of Care’ is factored into planning for the future. The aging population and non-UK immigration are the two main demographic factors high-lighted by GPs as impacting upon their capacity. The growing, elderly, population across Lothian brings with it issues of increasing numbers of patients with multi-morbidity and frailty. This patient group frequently requires a disproportionate time for each consultation and access GP services with greater frequency than younger patients. Visits, either to homes or care homes, are particularly time consuming and more likely in this group for both practice and community services.
1000’s Projected Change Age Group 2010 2015 2020 2010-20 % All Ages 836.7 883.7 925.2 88.5 10.58% 0-15 141.4 147.4 157.1 15.7 11.10% 16-64 571.4 595.5 613 41.6 7.28% 65+ 124 140.8 155.3 31.3 25.24%
Table 2: Change in Population by Age Group 2010 to 20203
3 http://www.gro-scotland.gov.uk/files2/stats/population-projections/scottish-areas-2010-based/j21704310.htm

5
Graph 2: Projected Demographic Change in Lothian 2010 to 2020 Data Source: http://www.gro-scotland.gov.uk/files2/stats/population-projections/scottish-areas-2010-based/j21704310.htm
Of the Lothian wide increase (25.24%) the projected proportional increase, for each HSCP, in aging populations (+65) in the time period above, across Lothian are: West Lothian (36.17%)
Midlothian (27.74%)
East Lothian (24.43%)
Edinburgh (20.61%) Although Edinburgh shows the least, proportionate, increase it is worthy of note that this represents a potential increase of over 14,000 in its elderly population. The percentage increases in the aging populations above help to illustrate the proportional increase in demand that will impact on both Primary and Community services, particularly where concentrations of care homes and sheltered housing occur.

6
The full projections by Local Authority and Age Group are demonstrated in Appendix 2. Non-UK In-Migration There has been a large influx of non-UK immigrants over recent years and this is projected to continue. The larger proportion of these has been from former Eastern European countries, post EEC membership and is anticipated to increase as more countries take up EEC membership. There has also been a rise in the proportion of the, relatively stable, student population who are foreign nationals. Migration is the most difficult element of population change to estimate as, unlike births and deaths, there no comprehensive system of registration of movement to and from the rest of the world, nor moves within the UK. A number of information sources must be brought together with the NRS estimates of migration to create a fuller picture. Accepting this, in-migration has fluctuated over the years although the trend continues to be upward and out-migration has shown a gradual decline. This has resulted in an average, between 2006 and 2011, net in-migration of circa 7,000 per annum, i.e. more than a GP Practice worth of new patients. Deprivation Levels and Inequality At the end of 2012/13, there were fifteen practices in which more than a third of the practice population lived in one of the 20% most deprived areas of Scotland, measured by SIMD. (See Appendix 3) At a Scotland level the impact of deprivation inequalities are stark, including:
• Average life expectancy of men in the most deprived areas is 70.1 years , in the least deprived areas it is 81 years ;
• For women it is 76.8 years in the most deprived areas, in the least deprived areas it is 84.2 years ;
• Exclusive breastfeeding rate at 6-8 weeks is 15% in the most deprived areas, in the least deprived areas it is 40%;
• GP consultations for anxiety per 1,000 patients is 62 in the most deprived areas, in the least deprived areas it is 28; and
• Alcohol-related hospital admissions per 100,000 of population in the most deprived areas are 1,621, in the least deprived areas it is 214.
People in more deprived areas have higher rates of vascular disease, mental health problems, obesity, alcohol and drug misuse problems, diabetes and most types of cancer. Children in deprived areas have significantly worse health than those in more affluent areas. For example, they have lower

7
average birth weights and breastfeeding rates, have poorer dental health and are more likely to be obese. GPs working in deprived areas will have a workload that reflects the prevalence of multi-morbidity in their population. Their population will also have a higher need for support with other social needs, which often impacts on their use of healthcare services. As well as high need for primary medical care, their patients will have greater need for other community health and social care services. However, although Scotland has a higher ratio of GPs to people compared with every other UK country, the distribution of GPs does not necessarily reflect the respective needs of people according to the level of deprivation in their area. From the perspective inequity of access, the distribution of primary care services across Lothian does not fully reflect the higher levels of ill health and wider needs found in deprived areas, or the need for more preventative health care. The distribution of other primary health care services, such as pharmacies, is more closely matched to need. The Deep End group of practices, which serve the most deprived populations in Scotland, argues for better integrated care for these patients. The group has made the following recommendations to meet their enhanced needs:
• Provide extra time for consultations and best use of serial encounters for patients in the most deprived areas.
• Provide additional clinical capacity, equivalent to one additional GP per 1000 patients in the most deprived areas.
• Develop a stepped approach to engagement for attached workers in general practice.
• Provide attached alcohol workers.
• Develop a National Enhanced Service for Vulnerable Families (NES).
• Recruit practice attached community link workers.
• Enhancements to GP training to give GP trainees experience of work in deprived areas.
Shifting the Balance of Care Shifting the Balance of Care has moved demand out of the acute sector into the Primary and Community care sectors. This has impacted most upon GP practices and Community Services (see Demand section below). The effect of this shift has been to impact on the resources, already stretched through the drivers mentioned above, available within GP Practices.

8
Further planned shifts of activity from the acute sector to the Primary and Community setting will need to be defined, the resource impacts explicitly identified and the required resource transfer and structural changes put in place, before any relocation of activity takes place. Housing Developments The South East of Scotland and Lothian in particular, have been identified as the area that will see the greatest growth in population over the next 20 years. The period up to 2020 will be no exception to this with a projected average increase in Lothian population of circa 7,000 per annum. This is based on the 2012 Housing Land Audits (HLSs) from each of the, Lothian, Local Authorities (LA). HLA’s however do not portray the full measure of population growth although their impact will be contributory. The Housing Land Audits provide clarity as to where and how many houses are planned to be built and the population impact on the local practice, or practices, can be calculated from this. In Graph 1 on page 3 above and in Appendix 1, and using 2012 as a common point of origin, the projected population impacts of the cumulative data from the Lothian local authorities Housing Land Audits have been demonstrated. The projections in the Housing Land Audits mentioned above (See Appendix 1) are based on land, and its housing capacity, identified for this purpose by each local authority in their local development plans. The decision on when to commence building and at what rate, for individual housing developments, is a purely commercial one and therefore subject to fluctuating market conditions. Resource Levels in Community Services The work and work-load of Primary Care services, and specifically General Practice, is directly affected by the movement in the levels, types and capacity of services available to support them in the community. The reduction and/or lack of these services will result in increased patient demand for General Practice services which, in turn often translates into increased demand upon Out-of-Hours, acute hospital beds and A&E services. Capacity The capacity of Primary Care services can be affected by a range of factors, not all within the control of primary care service providers. The area of Primary Care that reports significant capacity issues is that of General Practice (GP).

9
There is now an acute crisis of capacity, many practices having already expanded and adapted to their limits and patients may now have to access several practices before being accepted. Edinburgh CHP has identified a non –recurring, short term payment scheme to help practices grow by 500 patients, known as List Extension Growth Uplift (LEGUP). Funding is being sought from NHS Lothian to enable a pilot to progress in Edinburgh. General Medical Practices
• The number, whole time equivalents (WTE) and status of GPs within a practice i.e. partner, salaried, long-term/short-term locum.
• GP practices now have a mainly female, part time, profile. Many are younger GPs, who do not aspire to partnership status may not wish to work full time and are often more interested in salaried posts.
• Practices are not obliged to provide information on their GP staffing nor the WTE GPs in a practice. As a result it is impossible to estimate the true ratio of GP resource available against a practice list size.
• Although the Primary Care Workforce Survey (PCWS) 2013 estimates that the GP WTE has risen to 610, from the 590 estimate in 2009, these calculations are based on a much reduced return rate for 2013. It is interesting to note that, at variance to the above, the estimated sessional commitment has reduced from 634, in 2009, to 520 in 2013
• The number, WTE and status of practice nursing staff, all of which determines how much and what GPs can, or cannot, appropriately delegate/sign-post to for care. The PCWS 2013 count of nurses employed in practices was carried out in a very different way, than that undertaken in 2009, so no direct correlation can be made.
• The number, grades, experience and abilities of Practice Managers and administrative staff to deal with first contact from patients, ensure procedures are efficient and implemented effectively and that policies and procedures are regularly reviewed and updated.
• The capacity of community services (District Nursing, Health Visitors and School Nursing etc) to reduce the need for patients to contact a practice in the first instance and to deal with patients within the community avoiding condition exacerbation and repeat access to GP services, and maintaining independence.
• The capacity of Social Services to provide services and equipment for patients to aid recovery and re-enablement, avoiding condition exacerbation and maintaining independence.
• Demography, particularly the rapidly growing elderly population, levels and volume of local deprivation and in-migration also impact upon the capacity of general practice. This is due to the additional time these patients require, albeit for different reasons i.e. medical condition and

10
physical communication disability, chaotic life-styles or second language communication issues and cultural expectations.
• The application of appropriate and/or innovative activities, processes and procedures ensuring efficient practices are in place, avoiding negative and seeking positive impacts on the capacity of the practice and patient access to its services.
• Other factors which have had a negative effect on GP practice capacity include:
o increase in IT requirements, with some degradation in consultation functionality including prescribing;
o increase in QOF requirements for a flat resource; o increase in GP training requirements, again with a flat resource; o more care home patients; o shift of ‘tasks’ from secondary care, not formally recognised; o the impact of welfare and benefit reforms (both consultations
and administrative time, again under-resourced)
• Premises – the suitability and capacity of facilities to support the activity required to deal appropriately with the volume of patient contacts.
General Dental Services There are a known number of practices who are taking on new NHS patients but, at the current time, no capacity issues have been identified. Community Pharmacy Services There are no known capacity issues, for Community Pharmacy Services, within Lothian General Ophthalmic Services There are no known capacity issues, for Ophthalmic Services, within Lothian Community Services There has been erosion in the numbers of ‘trained’ nursing staff (Health Visitors, Community Nurses and School Nurses) in the community, off-set to a degree by an increase in community Health Care Assistants (HCA). However, whilst the WTE of community ‘nursing’ staff between 2009 and 2013 has risen over-all, by 1.34% (13.19 wte), practice list size has increased by over 3% ( circa 29,000). Preparedness for Vision 20:20 would indicate a need for more, rather than fewer community nurses. This is particularly important if community-based palliative care is to be maintained or increased.

11
Access The quality of access to Primary Care services is, for most patients, determined by the immediacy of that access to a service, or range of services, suitable to address their need. Pharmacy services are provided by high street retailers to which the public and patients have immediate access when their services are open. General Practitioner, General Dental and Optometry services normally operate an appointment system, the latter two through negotiation between the practice and the patient. General Practices have historically operated a first-come-first-served system of one kind or another, although there are good examples where practices are moving away from this to address demand, capacity and access issues. Dentistry The decision whether or not to register with any, or a particular, Dental Practitioner is solely the choice of the individual patient. The registration status available to the patient, NHS or private, and whether they are accepted will be determined by the Dental Practitioner. Data on the number of purely private registrations with Dental Practitioners is not available; therefore the information below is confined to patients registered with a NHS General Dental Service (NHS GDS) Dentist. The level of the Scottish population (all ages) registered with an NHS GDS dentist was 81.8% as at 31st March 2013, up from 79.8% as at 30th September 2012. Within the 6-12 and 13-17 age groups, over 99% of the population was registered with an NHS GDS dentist. However, as will be seen in Table 3 below, Lothian falls short of the above by a significant margin and appear in the lower half of Health Boards, for both children and adults, for the proportion of registrations against population. This should be viewed with the caveat that a significant, but unknown, number of the Lothian population will be registered as private patients.
NHS Board Number of
children % of child population
Number of adults
% of adult population
Shetland 4,574 94.80 13,497 76.40 Orkney 3,647 93.10 10,529 64.80 Greater Glasgow & Clyde 212,316 89.90 817,023 83.90 Scotland 927,330 89.50 3,370,982 79.90 Ayrshire & Arran 64,112 89.00 253,188 85.90 Dumfries & Galloway 24,743 88.70 90,603 75.40 Highland 53,017 87.80 161,885 64.40

12
Forth Valley 53,116 86.60 191,779 81.80 Lanarkshire 102,160 85.60 376,427 84.90 Tayside 66,059 84.80 254,055 77.50 Borders 18,884 84.30 62,167 68.50 Fife 62,226 84.20 210,226 71.60 Lothian 134,889 83.40 511,925 74.50 Western Isles 3,975 80.00 15,108 71.60 Grampian 86,636 79.00 264,622 59.40
Table 3: Number of people and level (%) of the population registered with an NHS GDS dentist, as at 31st March 2013 Source: ISD, MIDAS Pharmacy Within each CHP pharmacies are located in the areas of greater population density, the more dense the population the higher number of pharmacies there are. Pharmacies also tend to be on or near local and main routes of access, particularly in the more rural areas of Lothian.
Location NHS
Lothian East
Lothian Edinburgh Midlothian West
Lothian Number 182 23 107 20 32 Open until 6pm 159 23 90 18 28 Open between 6pm-10pm 23 0 17 2 4 Open on Saturdays AM 85 9 54 8 14 Open all day Saturday 94 14 52 12 16 Open Sunday 19 0 14 1 4
Table 4: Community Pharmacy Opening Hours in NHS Lothian Source: Provision of Pharmaceutical Care Services Delivered via Community Pharmacy 1st April 2013 FINAL
Area Induction
Loop Wheelchair
Access Private Consulting
Area or Room NHS Lothian 146 (80%) 165 (91%) 165 (91%) East Lothian 20 (87%) 21 (91%) 19 (82%) Midlothian 16 (80%) 17 (85%) 19 (95%) Edinburgh 85 (79%) 97 (91%) 98 (92%) West Lothian 25 (78%) 30 (91%) 29 (88%)
Table 5: Physical Access Resources Provided by Lothian Pharmacies The new community pharmacy contract replaces one where NHS pharmacy services mainly related to dispensing of medication. The new contract aims to use the skills and knowledge of pharmacists better. Pharmacists now graduate at a Masters level of degree education. The location and facilities of pharmacies could be better utilised to meet the needs of patients. All pharmacies are required to provide 4 core pharmaceutical care services:
13
• Chronic Medication Service
• Acute Medication Service
• Minor Ailment Service
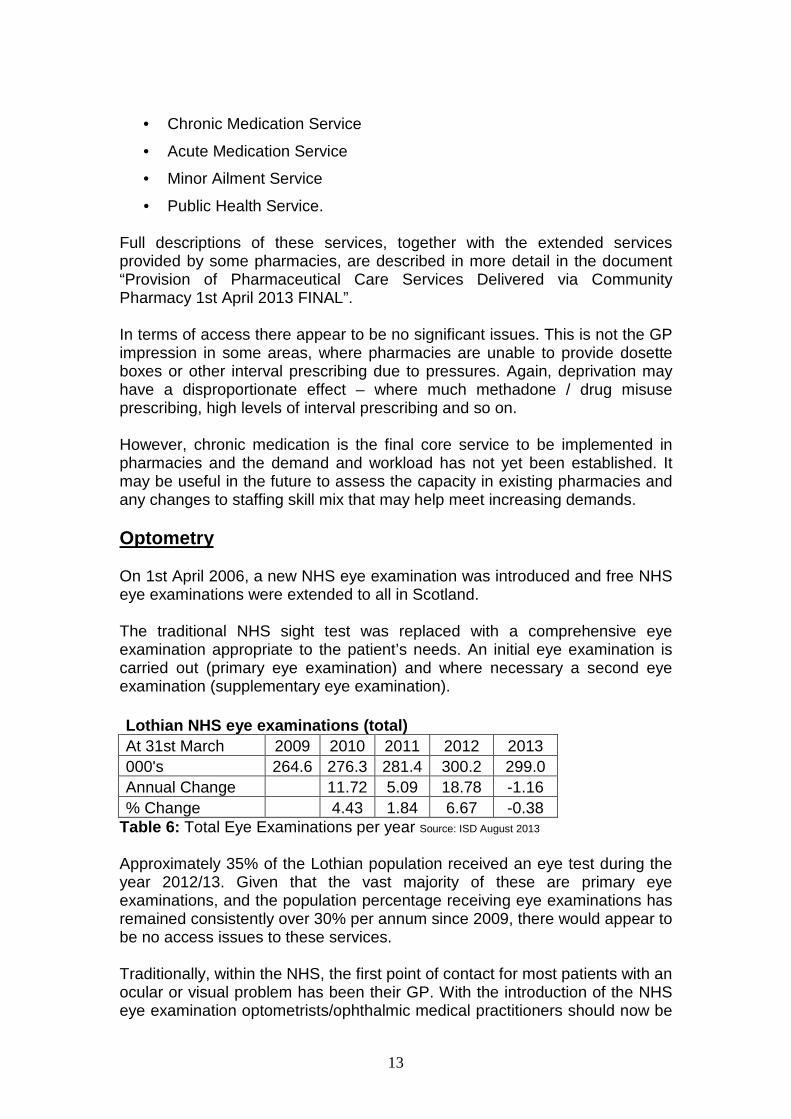
• Public Health Service. Full descriptions of these services, together with the extended services provided by some pharmacies, are described in more detail in the document “Provision of Pharmaceutical Care Services Delivered via Community Pharmacy 1st April 2013 FINAL”. In terms of access there appear to be no significant issues. This is not the GP impression in some areas, where pharmacies are unable to provide dosette boxes or other interval prescribing due to pressures. Again, deprivation may have a disproportionate effect – where much methadone / drug misuse prescribing, high levels of interval prescribing and so on. However, chronic medication is the final core service to be implemented in pharmacies and the demand and workload has not yet been established. It may be useful in the future to assess the capacity in existing pharmacies and any changes to staffing skill mix that may help meet increasing demands. Optometry On 1st April 2006, a new NHS eye examination was introduced and free NHS eye examinations were extended to all in Scotland. The traditional NHS sight test was replaced with a comprehensive eye examination appropriate to the patient’s needs. An initial eye examination is carried out (primary eye examination) and where necessary a second eye examination (supplementary eye examination). Lothian NHS eye examinations (total) At 31st March 2009 2010 2011 2012 2013 000's 264.6 276.3 281.4 300.2 299.0 Annual Change 11.72 5.09 18.78 -1.16 % Change 4.43 1.84 6.67 -0.38
Table 6: Total Eye Examinations per year Source: ISD August 2013
Approximately 35% of the Lothian population received an eye test during the year 2012/13. Given that the vast majority of these are primary eye examinations, and the population percentage receiving eye examinations has remained consistently over 30% per annum since 2009, there would appear to be no access issues to these services. Traditionally, within the NHS, the first point of contact for most patients with an ocular or visual problem has been their GP. With the introduction of the NHS eye examination optometrists/ophthalmic medical practitioners should now be

14
promoted as the first point of contact for patients with eye related problems. This message is still not getting through to many patients resulting in many, unnecessary, GP consultations General Practice Improving access, for patients who need to interact with General Practices is a key issue in ensuring the patient's experience of the NHS is improved. This includes improved access to a wider range of services, increasing core capacity, redesigning services by making full and effective use of professional skills, and harnessing information, technology and communications. In practice this means, NHS Boards and primary care teams working together to improve access through, for example:
• increased capacity
• fit for purpose premises
• service redesign
• skill-mix
• development and more effective use of the skills of all primary care staff
• direct access to the full range of primary care staff
• local protocols for interdisciplinary referrals within primary care
• local protocols for interdisciplinary referrals to Community Services i.e. Community Nursing, CPN’s, Health Visitors, AHP services, OT and Social Services etc
• Fully resourced work transfer from secondary care
• information to local people about how to access and make the best use of services
• telephone triage arrangements
• use of NHS24 (08454 24 24 24) A number of practices across Lothian are struggling to maintain the 48 hour access target, set by the QOF requirements. This is due to the increased demand they are experiencing and poor access to GP services remains the main point of concern for most patients. GP practices in Lothian overall see around 10% of their entire practice weekly, which offers an extremely high level of access but which continues to be outstripped by rising demand.
15
Community Services Access to Community Services is restricted by manpower availability and skill-mix within all the professional groups under this heading. As mentioned above, under Capacity, whilst the WTE of community ‘nursing’ staff between 2009 and 2013 has risen over-all, by 1.34% (13.19 wte), practice list size has increased by 3.42% (C29k), 2 ½ times the rate of increase in (non-Psychiatric) nursing staff in the community. This has led to the range of services delivered by these staff to become increasingly reduced with consequent impact on patient care and practices. This will have a domino effect upon Out-of-Hours services and, inevitably, on A&E services and unscheduled admissions. The reduction is particularly noticed in the care of patients who are frail, have multiple morbidity or palliative needs where spare capacity is required to manage unexpected clinical events. Primary Care Premises Primary Care Premises is dealt with under its own heading as the issues involved impact on both Capacity and Access, in part driven by Demand but by other factors also. There are currently 94 premises providing accommodation for 127 GP Practices. These range from NHS owned health centres, GP owned medical centres and developer owned medical centres and premises leased from private landlords. The quality of these premises range from relatively new facilities that accommodate Primary Care, NHS community and Council services, to GP practices based in converted residential premises such as Gullane Surgery, in East Lothian, currently being re-provided through a joint project with East Lothian Council. The maps in Appendix 5 show the distribution of GP premises across Lothian. There are also NHS Community services provided from a range of GP premises and from NHS premises. These face the same range of issues as the GP services. Some GP premises cannot accommodate NHS staff. There are 164 premises providing General Dental Services and 9 premises in which the Public Dental Service operate. There are some “state of the art” premises, but also some premises that will never fully comply with legislation or decontamination requirements in their current premises.

16
The Salaried Primary Care Dental Service is managed by West Lothian Health and Social Care Partnership (HSCP), but all HSCPs also have some responsibilities since some of the services are located in shared premises. There are major issues of Disability Discrimination Act (DDA) compliance and functional suitability with some. GP/GDP owned, developer owned and private landlord owned premises range from modern compliant multipurpose buildings to old, non-compliant single purpose buildings. Attached at Appendix 4 is the NHS Lothian GP premises development priorities list based on condition, compliance and functional suitability. In dentistry there are two key issues with some practices being unable to achieve DDA compliance and decontamination standards. Primary Care Contractors Organisation (PCCO) is actively engaging Dental Practices to bring all facilities up to the “Glennie” standards for decontamination. PCCO is also the enforcement arm for the comprehensive three yearly GDP practice inspection regime. Wherever possible and as opportunities present, the HSCPs and the relevant Council should develop multipurpose joint facilities to bring together a range of NHS and Council services in communities; the recently completed Wester Hailes project being an example. Wester Hailes Healthy Living Centre provides new accommodation for over 300 NHS Lothian and Edinburgh Council and voluntary sector staff. This includes accommodation for the Wester Hailes Medical Practice and a wide range of other community health services including:
• Physiotherapy
• Salaried Primary Care Dental Service
• Podiatry
• Midwifery
• Learning Disabilities
• Community Child Health
• Mental Health
• Speech and Language Therapy At various times in the week, other NHS outreach services will conduct clinics in the new Centre. Council services located in the building consist of the Health and Social Care, Children and Families and Criminal Justice social work teams. The Centre will also accommodate the Wester Hailes Health Agency and the Wester Haven Cancer support Project.
17
The Health Agency will provide a range of therapeutic services, such as counselling, massage and relaxation as well as group activities such as walking groups, exercise classes and volunteering opportunities. Another example, although not including council services is Musselburgh Primary Care Centre, completed in 2012, providing accommodation for: Three GP practices; Inveresk Medical Practice Riverside Practice Eskbridge Medical Centre Children Health Services; Speech and Language Therapy Occupational Therapy Physiotherapy School Nurses Community Child Health Together with; Salaried Primary Care Dental Service Podiatry Outpatients District Nurses and Health Visitors Midwives Clinical Psychology Adult Psychiatry Adult Physiotherapy Dietetics Facilities, such as above, could provide services for a whole community such as GP practices and practice based community health services, mental health services, social work services and day services and other public and voluntary sector services as appropriate to the locality. These facilities would deliver all or some of the following benefits:
a. Allow the NHS and the Council to significantly improve some of their worst premises and ensure compliance with legislation.
b. Improve access to services for those communities. c. Support NHS and shared strategies by providing space for shifting the
balance of care where critical mass justifies the location of services. d. Improve services through the co-location of NHS and Council teams. e. Maximise efficiency in use of capital and revenue by sharing space and
through joint procurement. f. Provide physical capacity to allow general practices to register extra
patients in the areas of population growth g. Provide space for other independent contractor services, particularly
pharmacy and dentistry. NHS Lothian should continue to facilitate the re-provision of premises for GP

18
practices that are on the premises priority list (see Appendix 4), but which are not placed to take advantage of joint working opportunities. Within this priority the HSCPs should seek to reduce the number of separate premises and encourage small practices to share facilities. These facilities would deliver the following benefits:
a. Allow the NHS and GPs to significantly improve the worst premises and ensure compliance with legislation.
b. Allow existing GP practices to expand to provide the capacity needed to accommodate population growth.
c. Allow GP practices to support Shifting the Balance of Care. In improving premises for Community Services HSCPs should seek to incorporate as much NHS and Council owned estate into these developments wherever possible. Some could be incorporated into the proposed joint facilities discussed above. This could facilitate the merging of NHS and Council teams and the disposal of assets to support the capital programme. These facilities would deliver the benefits described above. Of note, there have not been any new, additional, practices in Lothian for a decade although there have been cases of practices sub-dividing, such as in the case of Durham Road and Niddrie Medical Practices, where the existing list was shared. Edinburgh CHP has also identified a significant number of practices, city wide, who could increase their capacity by using a modest investment to internally reorganise rooms or build an extension, rather than address their needs by re-providing their premises. By linking this to an agreed increase in practice list size, population growth as well as premises constraints could be accommodated.

Our Health, Our Care, Our Future - Appendix 3 Doc 1
APPENDICES

Our Health, Our Care, Our Future - Appendix 3 Doc 1
19
APPENDIX 1: Population Projections and GP List Size
20

Our Health, Our Care, Our Future - Appendix 3 Doc 1
1
APPENDIX 2: Projected Population Growth by Local Authority and Age Group
0000's Projected Change
Age Group 2010 2015 2020 2010-20 %
SCOTLAND
All Ages 5,222.10 5,365.40 5,485.80 263.7 5.05%
0-15 911.8 922.3 958.6 46.8 5.13%
16-64 3430.8 3457.2 3452.4 21.6 0.63%
65+ 879.5 985.8 1074.8 195.3 22.21%
Lothian
All Ages 836.7 883.7 925.2 88.5 10.58%
0-15 141.4 147.4 157.1 15.7 11.10%
16-64 571.4 595.5 613 41.6 7.28%
65+ 124 140.8 155.3 31.3 25.24%
East Lothian
All Ages 97.5 103.3 109.3 11.8 12.10%
0-15 18.8 19 20.4 1.6 8.51%
16-64 61.2 64.4 67 5.8 9.48%
65+ 17.6 19.9 21.9 4.3 24.43%
Edinburgh
All Ages 486.1 517.2 543.8 57.7 11.87%
0-15 72.3 77.8 84.2 11.9 16.46%
16-64 344.3 362.6 375.8 31.5 9.15%
65+ 69.4 76.9 83.7 14.3 20.61%
Midlothian
All Ages 81.1 83.4 85.6 4.5 5.55%
0-15 15.5 15.4 15.9 0.4 2.58%
16-64 52 52.2 52.1 0.1 0.19%
65+ 13.7 15.9 17.5 3.8 27.74%
West Lothian
All Ages 172.1 179.9 186.7 14.6 8.48%
0-15 34.9 35.3 36.6 1.7 4.87%
16-64 113.7 116.4 118 4.3 3.78%
65+ 23.5 28.1 32 8.5 36.17% http://www.gro-scotland.gov.uk/files2/stats/population-projections/scottish-areas-2010-based/j21704310.htm

2
APPENDIX 3: Lothian Practices Ranked by % of List in Deprivation Quintile 1 Data Source: SIMD 2012 Data Base & CHI Data Base
Practice Practice Name LHP Q1 SIMD
(most deprived)
% in Quintile
1
List Size
70215 Craigmillar Medical Group SE 6,675 75.9% 8,790 70978 Wester Hailes Health Centre SW 4,903 72.0% 6,805 70662 Muirhouse Medical Group NW 7,638 63.1% 12,110 70573 Crewe Medical Centre NW 4,177 52.9% 7,896 70516 Gracemount Medical Practice SE 3,573 50.6% 7,059 78311 The Craigshill Partnership WL 4,087 47.7% 8,573 70911 Sighthill Green Medical Practice SW 3,666 43.3% 8,458 70906 Drs Sharpe, Putta & Burns Practice SW 1,352 42.1% 3,208 70959 Dr Guy Johnson And Dr Helga Rhein SW 628 41.6% 1,509 70605 Durham Road Medical Group SE 2,658 39.2% 6,786 78109 Braehead Medical Practice WL 1,201 38.9% 3,087 78330 Ashgrove Group Practice WL 2,556 38.3% 6,674 71171 Challenging Behaviour Practice SC 9 36.0% 25 78043 Breich Valley Medical Practice WL 1,732 35.5% 4,875 70253 Whinpark Medical Practice SW 3,737 34.5% 10,834 78185 Blackridge Health Centre WL 698 30.1% 2,317 70427 Milton Surgery SE 2,168 30.1% 7,199 70569 Restalrig Park Medical Centre NE 1,955 29.5% 6,630 78190 Whitburn Group Medical Practice WL 3,306 29.0% 11,410 70164 Ferniehill Surgery SE 1,820 26.7% 6,824 70376 Liberton Medical Group SE 1,663 25.5% 6,527 71097 The Firrhill Medical Centre SC 1,196 25.2% 4,739 70126 Southfield Medical Practice NE 826 24.3% 3,394 77106 Newbattle Medical Practice ML 3,288 23.1% 14,223 70709 Davidson's Mains Medical Centre NW 1,133 22.7% 4,996 70588 The Southern Medical Group SE 1,473 21.6% 6,830 77197 Dalkeith Medical Practice ML 2,277 21.4% 10,655 70696 Rose Garden Medical Centre NE 1,769 20.7% 8,531 70658 The Baronscourt Medical Partnership NE 1,540 19.6% 7,850 78128 Kingsgate Medical Practice WL 1,564 19.2% 8,139 78132 Simpson Medical Group WL 1,549 19.1% 8,125 70963 Edinburgh Access Practice SE 104 19.0% 546 76122 Prestonpans Group Practice EL 1,669 19.0% 8,784 78241 Armadale Group Practice WL 2,477 18.9% 13,114 78147 West Calder Medical Practice WL 1,643 18.3% 8,962 70785 St Triduana's Medical Practice NE 1,752 18.1% 9,661 77159 Newbyres Medical Group ML 1,451 18.0% 8,077 70747 Summerside Medical Practice NE 1,028 17.1% 6,022 70291 Inchpark Surgery SE 997 16.8% 5,926

3
Practice Practice Name LHP Q1 SIMD
(most deprived)
% in Quintile
1
List Size
71114 Leith Mount Surgery NE 1,513 16.4% 9,240 70022 Bangholm Medical Centre (White Practice) NE 522 16.1% 3,250 78077 Newland Medical Practice WL 1,219 16.0% 7,611 70677 Dr J W Paterson & Partners NE 1,318 15.5% 8,492 78260 Dedridge Medical Group WL 1,567 14.8% 10,608 78010 Carmondean Medical Group WL 1,281 13.7% 9,333 70272 Dr Anne G Stevenson & Partners NW 644 12.6% 5,092 70841 St Leonard's Medical Centre SE 670 11.8% 5,691 78255 Howden Health Centre WL 1,441 11.8% 12,243 70766 Marchmont Medical Practice SC 270 10.4% 2,592 70610 Craiglockhart Medical Group SC 980 10.3% 9,472 70179 Leith Walk Surgery NE 769 10.3% 7,453 76226 Tranent Medical Practice EL 1,327 9.6% 13,816 77286 Loanhead Practice, Sutherland House ML 430 9.4% 4,581 70381 Mackenzie Medical Centre SE 476 8.7% 5,488 70234 The Long House Surgery NE 615 8.0% 7,728 76141 Inveresk Medical Practice EL 620 7.2% 8,632 77060 Dr Stanley A Moonsawmy ML 16 7.1% 225 78024 East Calder Medical Practice WL 768 6.9% 11,103 76048 Eskbridge Medical Practice EL 601 6.9% 8,696 76033 Riverside Medical Practice EL 633 6.8% 9,263 70893 Southside Surgery SE 362 6.8% 5,355 70997 Slateford Medical Practice SW 494 6.3% 7,877 70357 Inverleith Medical Practice NW 222 6.1% 3,661 70925 Riccarton General Practice SW 567 5.9% 9,685 70470 Dalkeith Road Medical Practice SE 196 5.4% 3,623 77111 Penicuik Medical Practice ML 612 5.3% 11,473 70535 Blackhall Medical Centre NW 341 5.0% 6,817 77125 Pathhead Medical Practice ML 212 4.9% 4,321 78325 Deans & Eliburn Medical Practice WL 561 4.8% 11,580 76052 The Harbours Medical Practice EL 450 4.7% 9,515 77036 Eastfield Medical Practice ML 219 4.2% 5,259 78166 Linlithgow Group Medical Practice WL 536 3.9% 13,741 78217 Linlithgow Family Practice WL 65 3.6% 1,796 70268 Brunton Place Surgery NE 278 3.6% 7,705 70451 Meadows Medical Practice SC 113 3.2% 3,521 70131 Colinton Surgery SW 335 3.1% 10,967 78359 Winchburgh Medical Practice WL 75 3.0% 2,497 71025 Murrayfield Medical Centre NW 204 2.9% 6,968 70499 Dr Gray & Partners NE 168 2.8% 6,034 70639 Dr L Taylor & Partners SE 271 2.6% 10,227

4
Practice Practice Name LHP Q1 SIMD
(most deprived)
% in Quintile
1
List Size
70521 Dr Martin Tolley & Partners NE 193 2.5% 7,721 70094 The Green Practice NW 190 2.3% 8,206 70732 Boroughloch Medical Practice SC 56 2.3% 2,476 71326 The Group Practice - Eyre NW 211 2.2% 9,391 71011 Polwarth Surgery SC 96 2.1% 4,590 77093 Roslin Medical Practice ML 105 2.1% 5,106 70361 Ladywell Medical Centre (East) NW 198 1.8% 10,753 70860 Newington Surgery SC 36 1.8% 2,036 70220 Ladywell Medical Centre (West) NW 182 1.7% 10,865 77074 Quarryfoot Practice ML 78 1.5% 5,141 71129 Cramond Medical Practice NW 131 1.5% 8,639 70408 Dr Wilson & Partners NW 126 1.4% 9,126 70592 University Health Service SE 296 1.3% 23,445 70501 Murrayfield Medical Practice NW 73 1.1% 6,504 77271 Strathesk Medical Group ML 91 1.1% 8,302 70643 Drs Donaldson, Morris & Larkin SC 36 1.1% 3,349 71082 Springwell Medical Group SC 96 0.9% 10,372 70075 Braids Medical Practice SC 78 0.9% 9,026 70107 Leven Medical Practice SC 55 0.8% 6,504 70037 Drs Ayles, Rigg & Mcculloch SC 27 0.8% 3,195 77055 Dalhousie Medical Practice ML 61 0.8% 7,512 78344 Murieston Medical Practice WL 32 0.7% 4,354 70319 West End Medical Practice NW 60 0.7% 9,052 78113 Dr Gunn & Partners WL 32 0.5% 6,681 78151 Kirkliston Medical Practice WL 22 0.5% 4,656 77200 Danderhall Medical Practice ML 12 0.4% 2,994 78062 Ferguson Medical Practice WL 23 0.4% 5,963 70111 Parkgrove & East Craigs Medical Centre NW 32 0.3% 9,914 70790 Morningside Medical Practice SC 10 0.1% 7,980 71222 Gilmore Medical Practice SW 8 0.1% 7,213 76180 Drs Horn, Bagley & Lavelle EL 2 0.1% 3,603 78306 The Wood Medical Practice WL 3 0.0% 7,509 70930 The Pentlands Medical Practice SW 4 0.0% 12,499 70412 Grange Medical Group SC 2 0.0% 7,702 76086 Dr D A Cassells & Partners EL 1 0.0% 4,245 70323 Bruntsfield Medical Practice SC 2 0.0% 11,532 76137 North Berwick Group Practice EL 1 0.0% 7,875 78171 South Queensferry Medical Practice NW 1 0.0% 10,790 76103 The Orchard Medical Practice EL 0 0.0% 4,649 76000 Tyne Medical Practice EL 0 0.0% 5,681 76071 Dr R W D Langlands & Partners EL 0 0.0% 4,780

5
Practice Practice Name LHP Q1 SIMD
(most deprived)
% in Quintile
1
List Size
76161 Drs Black, Mcphail & Campbell EL 0 0.0% 3,333 76194 East Linton Surgery EL 0 0.0% 2,510 76211 Ormiston Medical Practice EL 0 0.0% 3,164 77089 Ratho Surgery NW 0 0.0% 2,160 76029 Gullane Medical Practice EL 0 0.0% 5,027
CHP/HSCP/LHP Q1 SIMD
(most deprived)
% in Quintile 1 List Size
East Lothian 5304 5.1% 103573
Midlothian 8,852 10.1% 87,869 West Lothian 28,438 15.4% 184,951 North East Edinburgh 14,246 14.3% 99,711 North West Edinburgh 15,563 10.9% 142,940 South Central Edinburgh 3,062 3.4% 89,111
South East Edinburgh 23,402 21.2% 110,316 South West Edinburgh 15,694 19.9% 79,055 Lothian Total 114,561 12.8% 897,526

6
Appendix 4: NHS Lothian Draft Primary Care Premises Priority List Rank Existing Premises CHP/CHCP Priority Score Notes
2 Leith Walk Surgery Edin 26 3 Southside Surgery Edin 24 5 Brunton Place Surgery Edin 22 5 Granton Waterfront Development Edin 22 6 Dalkeith Road Surgery Edin 21 7 Ferniehill Surgery Edin 20 7 Southern Medical Group Edin 20
10 Edinburgh Homeless Practice, Cowgate Edin 17 11 Meadows Surgery Edin 16 12 Hermitage Terrace Surgery Edin 15 15 Edinburgh University Health Centre Edin 11 16 Morningside Surgery Edin 10 17 Polwarth Surgery Edin 9 17 Rose Garden Surgery Edin 9 18 Durham Road Surgery Edin 8 20 New Leith Practice Edin 6 4 Blindwells Development East 23 9 Prestonpans Health Centre East 18
12 Cockenzie Health Centre East 15 13 North Berwick Health Centre East 14 13 Tranent Health Centre East 14 14 Newton Port Surgery, Haddington East 12 19 East Linton Surgery East 7 4 Shawfair Development Mid 23 8 Gorebridge Surgery Mid 19 8 Sutherland House, Loanhead Mid 19 9 Danderhall Surgery Mid 18
11 Loanhead Surgery Mid 16 1 Armadale Medical Centre West 28 1 East Calder Health Centre West 28 5 Linlithgow Health Centre West 22 6 Winchburgh Health Centre West 21 7 Murieston Health Centre West 20 8 Dedridge Health Centre West 19 9 Carmondean Health Centre West 18
10 Whitburn Health Centre West 17 14 Craigshill Health Centre West 12 15 Bathgate Primary Care Centre West 11 16 Boghall Clinic West 10 16 Howden Health Centre West 10 17 Stoneyburn Health Centre West 9 18 Blackridge Health Centre West 8 20 Kirkliston Health Centre West 6 20 Strathbrock Centre West 6 21 Fauldhouse Partnership Centre West 4 21 West Calder Medical Centre West 4

7
Appendix 5: Lothian GP Premises and List Status (No vember 2013)

8

9