nhs wales - table 4: population density: persons … · web viewrates of infant mortality, child...
TRANSCRIPT

Public Health Wales
How are current and future population health needs likely to impact on the use of maternity, neonatal, gynaecology and paediatric services in North Wales? – A population profile.
Author: Siobhan Jones, Specialty Registrar Public Health, Rachel Andrew, Specialty Registrar Public Health, Claire Jones, Public Health Intelligence Specialist, Siwan Jones, Principal Practitioner Public Health, Gill Richardson, Executive Director Public Health Aneurin Bevan Health Board, Andrew Jones, Executive Director of Public Health BCU HBDate: 06/07/11 Version: 1Status: FINALIntended Audience:
North Wales Maternity and Child Health Review Project Team North Wales Maternity and Child Health Review Key Stakeholders Public Health Wales
Purpose and Summary of Document: To describe the population of North Wales and health status of the
population in relation to maternal and child health To provide information on population health need to support the
North Wales review of maternity, neonatal, gynaecology and paediatric services
Publication/Distribution: To be determined
Author: Siobhan Jones, Specialty Registrar in Public Health, Andrew Jones, DPH, BCU HB
Date: 06/07/11 Status: Final
Version: 1 Page: 1 of 87 Intended Audience:

Public Health Wales
Contents
KEY MESSAGES 41 BACKGROUND 62 DEMOGRAPHY 72.1 Population estimates 72.2 Females population of childbearing age 72.3 Population structure 82.4 Population aged under 18 years 82.5 Population projections 112.6 Population density 133 DEPRIVATION 173.1 Economy and Income 173.1.1 Welsh Index of Multiple Deprivation 2008 173.2 Impacts of deprivation 203.3 Deprivation and maternal/neonatal health 223.4 Deprivation and child health 233.5 Deprivation and lifestyle factors 264 LIFESTYLE FACTORS IMPACTING ON MATERNAL
AND CHILD HEALTH27
4.1 Tobacco 274.1.1 Smoking in pregnancy 274.1.2 Exposure to second hand smoke in childhood 284.1.3 Smoking in teenagers 284.2 Overweight & obesity 304.2.1 Obesity in pregnancy 304.2.2 Childhood obesity 324.3 Substance misuse: alcohol 344.3.1 Alcohol in pregnancy 354.3.2 Alcohol use and young people 354.4 Substance misuse: illicit drugs 364.4.1 Use of illicit drugs in pregnancy 375 DATA ANALYSIS 395.1 Maternal and neonatal factors 395.1.1 Fertility and birth rates 405.1.2 Birth rate projections 405.1.3 Total Fertility Rate 405.1.4 General Fertility Rate 415.1.5 Conception and abortion rates 445.1.6 Maternal mortality 455.1.7 Neonatal and infant mortality 465.1.8 Stillbirth 485.1.9 Perinatal mortality 505.1.10 Neonatal mortality 505.1.11 Infant mortality 525.1.12 Low birth weight 535.2 Women’s health and impacts on gynaecology 56Author: Siobhan Jones, Specialty Registrar in Public Health, Andrew Jones, DPH, BCU HB
Date: 06/07/11 Status: Final
Version: 1 Page: 2 of 87 Intended Audience:

Public Health Wales
Services5.2.1 Sexually transmitted infections 565.2.2 Cervical screening 575.2.3 Cervical cancer 585.2.4 Human Papillomavirus 595.2.5 Human Papillomavirus vaccine uptake 595.3 Child health factors 605.3.1 Child mortality 605.3.2 Teenage conceptions 625.3.3 Immunisation 645.3.4 Injuries 685.3.5 Breastfeeding 725.3.6 Childhood physical and learning disabilities 735.3.7 Congenital anomalies 755.3.8 Child Protection 766 REFERENCES 7778
APPENDIX ONE: Super Output AreasAPPENDIX TWO: Middle Super Output Areas/Electoral Divisions
8485
Key Messages
Author: Siobhan Jones, Specialty Registrar in Public Health, Andrew Jones, DPH, BCU HB
Date: 06/07/11 Status: Final
Version: 1 Page: 3 of 87 Intended Audience:

Public Health Wales
The pre-pregnancy, pregnancy and early year’s phases of life are key in terms of influencing the future health and development of children and young people.
Deprivation impacts significantly on maternal health and neonatal care. Rates of stillbirth, preterm birth, low birth weight, neonatal deaths and admission to neonatal units have been shown to be significantly higher in areas with high levels of deprivation.
Deprivation impacts significantly on child health. Rates of infant mortality, child mortality, injuries and teenage pregnancy have been shown to be significantly higher in areas with high levels of deprivation.
A proportion of the North Wales population resides in areas of deprivation. 12% of lower super output areas within North Wales are in the most deprived fifth in Wales.
Denbighshire has the highest percentage of lower super output areas in the most deprived fifth in Wales, and contains three out of the top five most deprived areas in Wales.
Wrexham contains the second highest percentage of lower super output areas in the most deprived fifth in Wales.
Lifestyle factors are linked to deprivation and are an important contribution to health inequalities. Rates of smoking and obesity levels have been shown to be higher in areas with high levels of deprivation. Consumption of fruit and vegetables and levels of physical activity have been shown to be lower in areas with high level of deprivation.
Smoking, obesity and substance misuse during pregnancy are preventable causes of a significant proportion of morbidity and mortality for mothers and babies. Smoking and obesity in particular have a high prevalence in the population and can impact on rates of miscarriage, still birth, maternal death, neonatal deaths, admission to neonatal care and low birth weight. The impacts on the use of maternity and neonatal services are significant.
Lifestyle factors including smoking and obesity are important risk factors for some gynaecological cancers.
Exposure to second hand tobacco smoke is an important cause of morbidity in childhood. It increases risks of asthma, ear infections, respiratory infections, bacterial meningitis and sudden infant death. The cost to the health service from exposure to second hand smoke in childhood is significant.
Rising levels of childhood obesity, high levels of smoking among teenage girls and alcohol use are important factors in the future health of the next generation of mothers and could have a large impact on the future use of maternity and neonatal services.
The total number of registrable births to mothers resident in North Wales has risen for the seventh consecutive year, an increase of 20% since 2002. By 2030/2031 the total fertility rate is predicted to be higher in every Local Authority in Wales compared to 2005/2006.
Across Wales there are no significant differences in stillbirth, Author: Siobhan Jones, Specialty Registrar in Public Health, Andrew Jones, DPH, BCU HB
Date: 06/07/11 Status: Final
Version: 1 Page: 4 of 87 Intended Audience:

Public Health Wales
perinatal mortality, neonatal mortality and infant mortality rates. Cervical screening and Human Papillomavirus vaccination are
important preventative interventions, the uptake of which can have a direct influence on the demand for gynaecological services.
Wales has a higher rate of conception in females aged 15-17 years compared to England.
Rates of admission for childhood injuries are significantly higher in Gwynedd and Anglesey than the Wales average. Most injuries in 0 to five year olds occur in the home. Injuries are a largely preventable cause of ill health, are linked closely to deprivation and impact greatly on health service use by children and young people.
Immunisation is a highly effective and cost effective health care intervention. Rates in parts of North Wales currently fall below the 95% uptake rate required to protect the population from outbreaks of serious infectious diseases.
Interventions to promote breastfeeding are cost effective and can reduce demand on health care services.
Future Maternal and child health services should seek to ensure:
• a whole systems approach ensuring preventable causes of ill health are addressed at every opportunity;
• interventions are targeted to reduce health inequality & inequities; • evidence based interventions to prevent ill health are systematically
introduced as part of clinical practice;• health care delivered as part of the wider system;• NHS and partner agencies identify and agree key priorities for health
prevention and early intervention.
1 BackgroundThe purpose of this report is to provide information to support the North Wales Review of Maternity, Neonatal, and Gynaecology and Child Health services. The aim of the review is to describe the optimum service delivery model that will ensure safe, sustainable and efficient maternity, neonatal, gynaecology and paediatric health services are provided for the population of North Wales. The future model of service delivery will seek to improve
Author: Siobhan Jones, Specialty Registrar in Public Health, Andrew Jones, DPH, BCU HB
Date: 06/07/11 Status: Final
Version: 1 Page: 5 of 87 Intended Audience:

Public Health Wales
population health and optimise health and well-being outcomes for women and children.
The following principles will be used to guide and underpin the work of the Project.
Future health services for women and children will seek to:
1. Take a whole systems approach to ensure preventable causes of ill health are addressed at every opportunity.
2. Use an early intervention/primary prevention approach.
3. Provide as much clinical care in community settings as is reasonably possible.
4. Provide safe, sustainable, efficient and affordable health services.
It is vital that the options generated must: be based on assessment of population need; maximise the health and wellbeing of women, children and families; seek to reduce inequality and inequity in provision of health care
and related services.
This report describes: the demography of North Wales; deprivation and its impacts; including lifestyle factors that impact on
maternal and child health; and data on health status factors that impact on the use of health care
services for women and children.
Author: Siobhan Jones, Specialty Registrar in Public Health, Andrew Jones, DPH, BCU HB
Date: 06/07/11 Status: Final
Version: 1 Page: 6 of 87 Intended Audience:
Public Health Wales
2 Demography North Wales has a geographical area of approximately 2,500 square miles. There are six unitary authorities (UA’s) within this region – Isle of Anglesey, Gwynedd, Conwy, Denbighshire, Flintshire and Wrexham. The population is served by one Health Board (HB) – Betsi Cadwaladr University Health Board (BCU HB) (Public Health Wales 2010a).
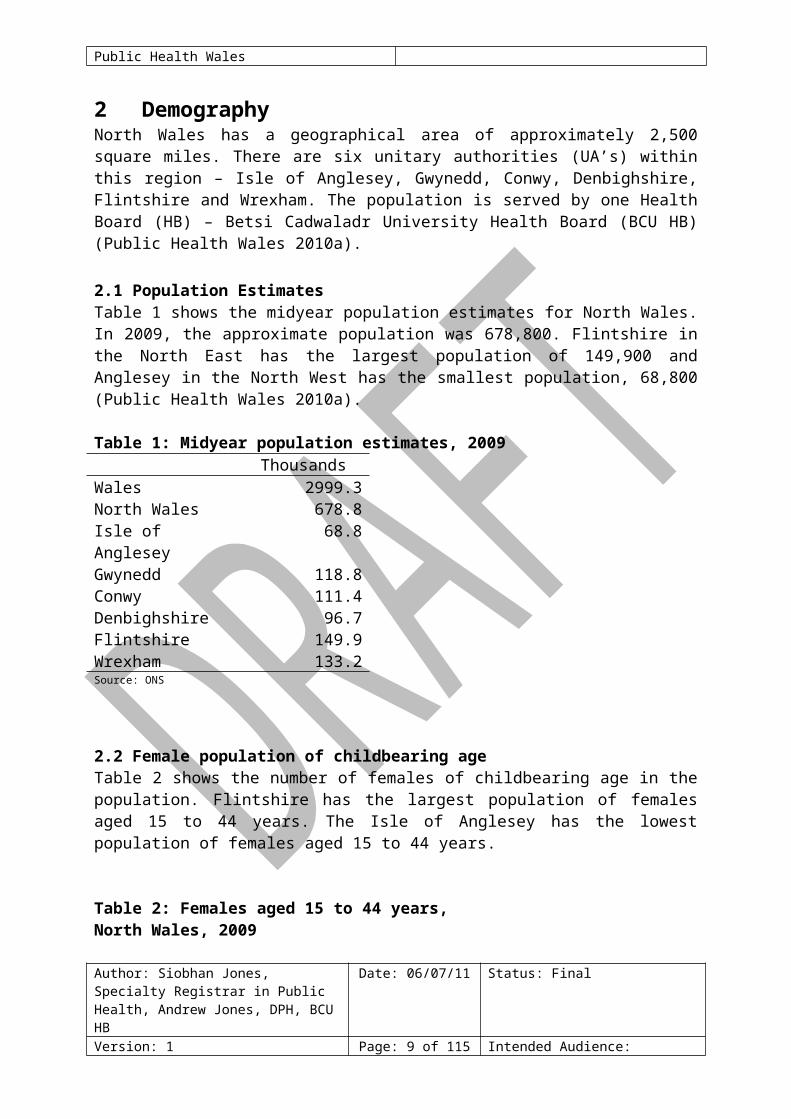
2.1 Population EstimatesTable 1 shows the midyear population estimates for North Wales. In 2009, the approximate population was 678,800. Flintshire in the North East has the largest population of 149,900 and Anglesey in the North West has the smallest population, 68,800 (Public Health Wales 2010a).
Table 1: Midyear population estimates, 2009Thousands
Wales 2999.3North Wales 678.8Isle of Anglesey 68.8Gwynedd 118.8Conwy 111.4Denbighshire 96.7Flintshire 149.9Wrexham 133.2Source: ONS
2.2 Female population of childbearing ageTable 2 shows the number of females of childbearing age in the population. Flintshire has the largest population of females aged 15 to 44 years. The Isle of Anglesey has the lowest population of females aged 15 to 44 years.
Table 2: Females aged 15 to 44 years, North Wales, 2009
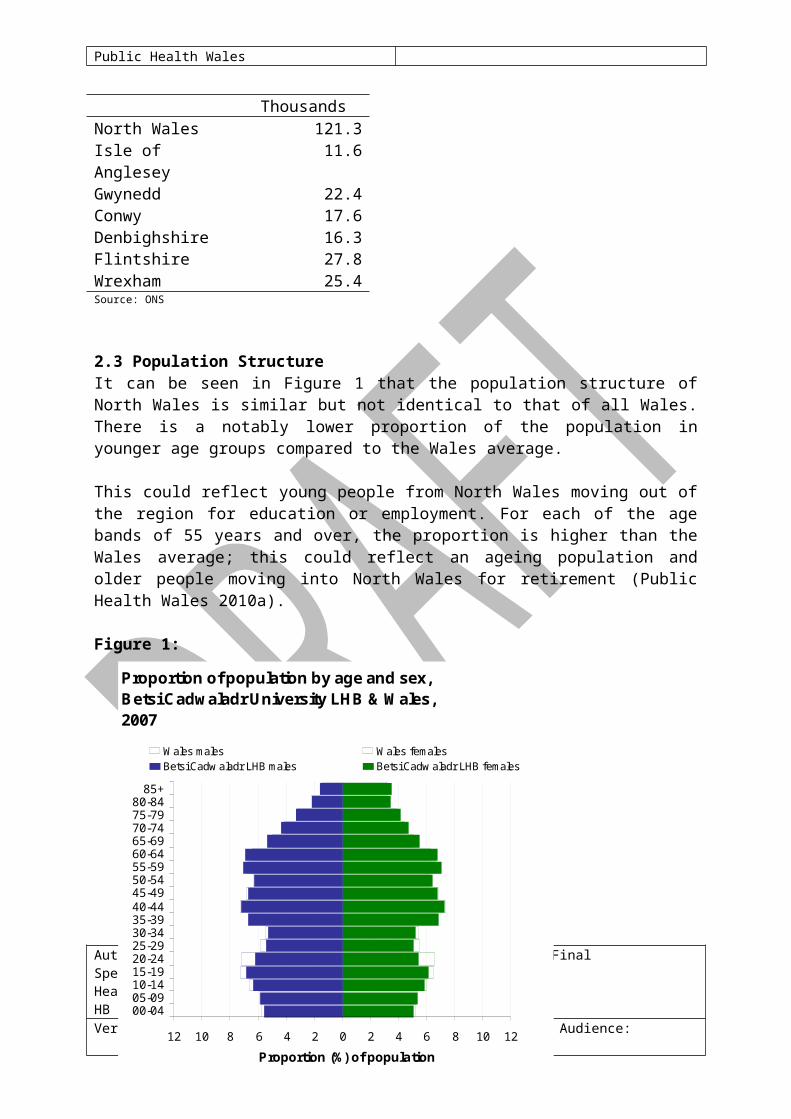
ThousandsNorth Wales 121.3Isle of Anglesey 11.6Gwynedd 22.4Conwy 17.6Denbighshire 16.3Flintshire 27.8Wrexham 25.4Source: ONS
2.3 Population StructureAuthor: Siobhan Jones, Specialty Registrar in Public Health, Andrew Jones, DPH, BCU HB
Date: 06/07/11 Status: Final
Version: 1 Page: 7 of 87 Intended Audience:

Public Health Wales
It can be seen in Figure 1 that the population structure of North Wales is similar but not identical to that of all Wales. There is a notably lower proportion of the population in younger age groups compared to the Wales average.
This could reflect young people from North Wales moving out of the region for education or employment. For each of the age bands of 55 years and over, the proportion is higher than the Wales average; this could reflect an ageing population and older people moving into North Wales for retirement (Public Health Wales 2010a).
Figure 1:
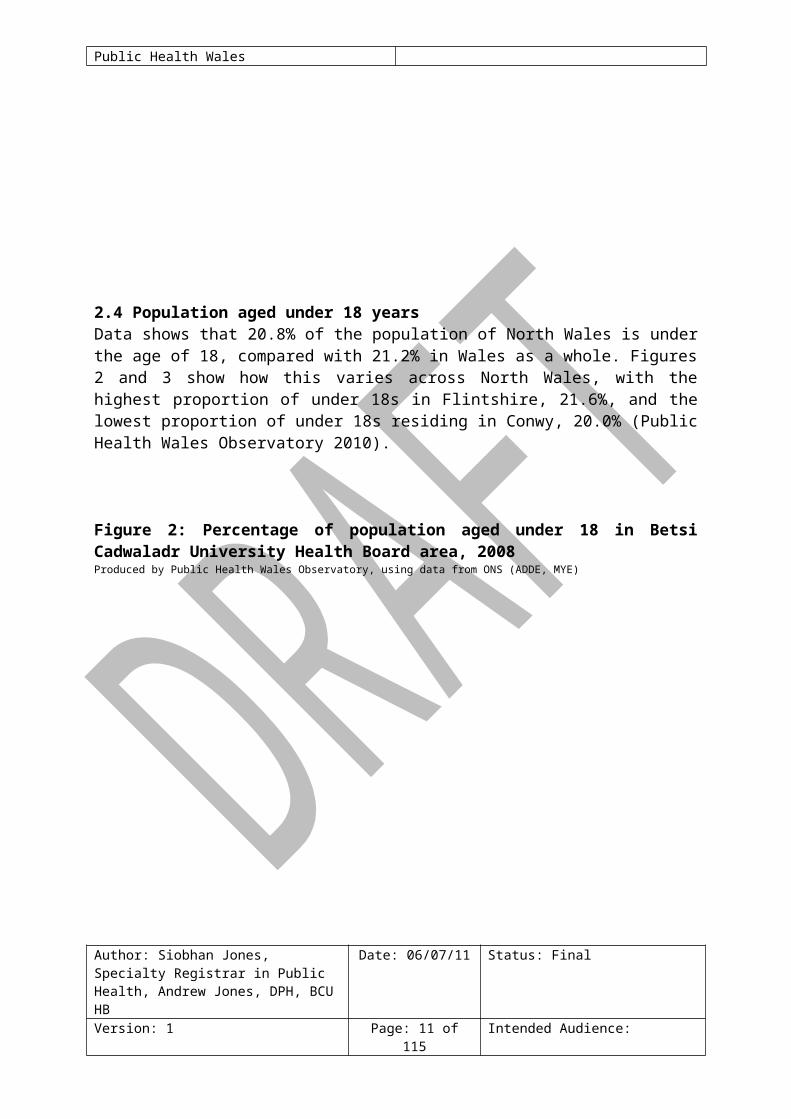
2.4 Population aged under 18 yearsData shows that 20.8% of the population of North Wales is under the age of 18, compared with 21.2% in Wales as a whole. Figures 2 and 3 show how this varies across North Wales, with the highest proportion of under 18s in Flintshire, 21.6%, and the lowest proportion of under 18s residing in Conwy, 20.0% (Public Health Wales Observatory 2010).
Figure 2: Percentage of population aged under 18 in Betsi Cadwaladr University Health Board area, 2008Produced by Public Health Wales Observatory, using data from ONS (ADDE, MYE)
Author: Siobhan Jones, Specialty Registrar in Public Health, Andrew Jones, DPH, BCU HB
Date: 06/07/11 Status: Final
Version: 1 Page: 8 of 87 Intended Audience:
Proportion of population by age and sex, Betsi Cadwaladr University LHB & Wales, 2007
12 10 8 6 4 2 0 2 4 6 8 10 12
00-0405-0910-1415-1920-2425-2930-3435-3940-4445-4950-5455-5960-6465-6970-7475-7980-84
85+
Proportion (%) of population
Wales males Wales femalesBetsi Cadw aladr LHB males Betsi Cadw aladr LHB females
Data source: MYE, ONS
Public Health Wales
Figure 3: Proportion of the population aged under 18 years, 2008
Author: Siobhan Jones, Specialty Registrar in Public Health, Andrew Jones, DPH, BCU HB
Date: 06/07/11 Status: Final
Version: 1 Page: 9 of 87 Intended Audience:
17.618.218.618.9
21.021.321.422.0
24.3
002005008004001007009006003
MSO
A
Isle of Anglesey
I sle of Anglesey % = 20.5
% under 18 10.616.2
17.918.518.819.220.021.021.521.722.222.522.823.023.623.824.1
001017013010014016012015011007008009004005003002006
MSO
A
Gwynedd
Gwynedd % = 20.5
% under 18
14.814.9
17.217.4
19.320.020.120.320.821.521.622.422.622.824.0
001004010006003012015013014011005008007002009
MSO
A
Conwy
Conwy % = 20.0
% under 18 17.117.218.518.919.019.120.120.820.921.321.521.521.922.622.6
29.4
016003010013014004001007005015009012008011002006
MSO
ADenbighshire
Denbighshire % = 20.7
% under 18
18.319.319.619.819.920.520.621.722.022.022.122.322.422.422.622.822.822.923.323.8
006019020001017011014016012008015018013002007009005003010004
MSO
A
Flintshire
Flintshire % = 21.6
% under 1816.617.617.7
19.519.820.420.520.620.721.221.822.122.322.522.522.622.923.2
29.8
011008007012002018014016019009001013005004006015003017010
MSO
A
Wrexham
Wrexham % = 21.3
% under 18
17.618.218.618.921.021.321.422.0748
0.0 5.0 10.0 15.0 20.0 25.0
002005008004001007009006003
0.0 5.0 10.0 15.0 20.0 25.0
MSOALocal AuthorityWales (21.2%)Health Board (20.8%)
Isle of Anglesey
Public Health Wales
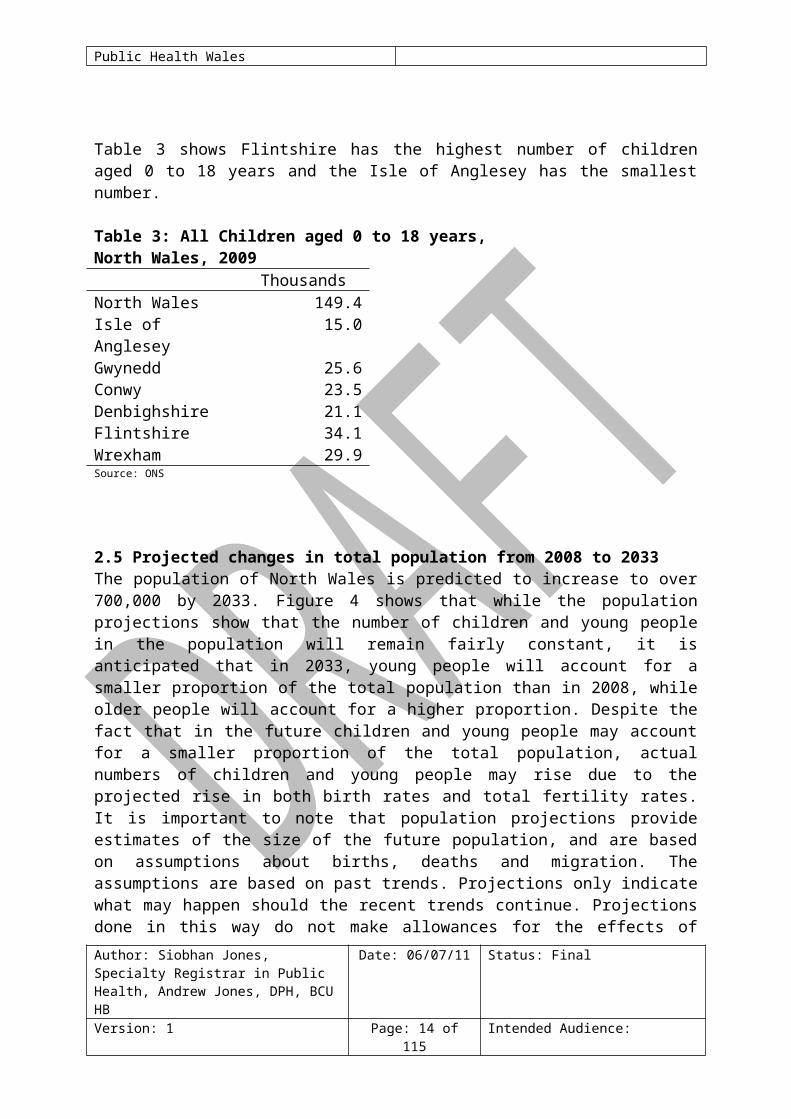
Table 3 shows Flintshire has the highest number of children aged 0 to 18 years and the Isle of Anglesey has the smallest number.
Table 3: All Children aged 0 to 18 years, North Wales, 2009Author: Siobhan Jones, Specialty Registrar in Public Health, Andrew Jones, DPH, BCU HB
Date: 06/07/11 Status: Final
Version: 1 Page: 10 of 87 Intended Audience:
Public Health Wales
ThousandsNorth Wales 149.4Isle of Anglesey 15.0Gwynedd 25.6Conwy 23.5Denbighshire 21.1Flintshire 34.1Wrexham 29.9Source: ONS
2.5 Projected changes in total population from 2008 to 2033The population of North Wales is predicted to increase to over 700,000 by 2033. Figure 4 shows that while the population projections show that the number of children and young people in the population will remain fairly constant, it is anticipated that in 2033, young people will account for a smaller proportion of the total population than in 2008, while older people will account for a higher proportion. Despite the fact that in the future children and young people may account for a smaller proportion of the total population, actual numbers of children and young people may rise due to the projected rise in both birth rates and total fertility rates. It is important to note that population projections provide estimates of the size of the future population, and are based on assumptions about births, deaths and migration. The assumptions are based on past trends. Projections only indicate what may happen should the recent trends continue. Projections done in this way do not make allowances for the effects of local or central government policies on future population levels, distribution and change (National Public Health Service & Wales Centre for Health 2009).
Figure 4: 2008-based population projections for North Wales population groups 0 to 14 years, 15 to 24 years and 25 to 44 years: 2008 to 2033 Data source: Statistical Directorate, Welsh Assembly Government / ONS
Author: Siobhan Jones, Specialty Registrar in Public Health, Andrew Jones, DPH, BCU HB
Date: 06/07/11 Status: Final
Version: 1 Page: 11 of 87 Intended Audience:

Public Health Wales
As the process of demographic change is cumulative, projections become increasingly uncertain the further they are carried forward. Demographic changes affect some populations more rapidly than others (Welsh Assembly Government 2008a). It is projected that across local authorities in Wales the number of men will increase by up to 30% and the number of women will increase by up to 19%; the average increase in the number of women in any local authority in Wales by mid-2031 is 13% (Welsh Assembly Government 2008a).
Any increase in the population is likely to cause an increase in the demand for health services. Measures to prevent ill health through primary prevention and early intervention techniques can play an important part in managing future demand for health services.
Author: Siobhan Jones, Specialty Registrar in Public Health, Andrew Jones, DPH, BCU HB
Date: 06/07/11 Status: Final
Version: 1 Page: 12 of 87 Intended Audience:
0
50
100
150
200
250
300
350
40020
08
2009
2010
2011
2012
2013
2014
2015
2016
2017
2018
2019
2020
2021
2022
2023
2024
2025
2026
2027
2028
2029
2030
2031
2032
2033
Estim
ated
pop
ulat
ion
(thou
sand
s)
0 to 14 year olds 15 to 24 year olds 25 to 44 year olds

Public Health Wales
2.6 Population DensityPopulation density provides a measure of the number of people living in an area. It is calculated by dividing the population by the geographical area in square kilometres. Population density varies across North Wales, with Flintshire and Wrexham being the most densely populated areas. Denbighshire, Conwy and Anglesey are more sparsely populated and Gwynedd has the most sparsely distributed population in North Wales. Table 4 shows the population density across the region (Public Health Wales 2010a).
Table 4: Population density: persons per square km, 2007Persons per
km2Wales 143.4North Wales 109.9Isle of Anglesey 96.9Gwynedd 46.4Conwy 98.9Denbighshire 115.7Flintshire 343.9Wrexham 261.8Source: WAG StatsWales
North Wales has 62 areas which are classed as ‘urban’ (that is, an area with a minimum population of 1,500). Forty of these areas have populations of less than 5,000 people and 14 areas have populations of 10,000 people or more (Public Health Wales 2010a). Table 5 shows that the main urban areas in North Wales are Wrexham and Colwyn Bay, followed by Rhyl and Shotton.
Table 5: Main urban areas in North Wales, 2001Author: Siobhan Jones, Specialty Registrar in Public Health, Andrew Jones, DPH, BCU HB
Date: 06/07/11 Status: Final
Version: 1 Page: 13 of 87 Intended Audience:
Public Health Wales
UA Area Resident populationWrexham, Wrexham 42,576Colwyn Bay Conwy 30,269Rhyl Denbighshire 25,390Shotton (inc. Hawarden) Flintshire 24,751Prestatyn Denbighshire 18,496Buckley Flintshire 18,268Brymbo/Gwersyllt Wrexham 17,912Abergele Conwy 17,574Connah’s Quay Flintshire 16,526Bangor Gwynedd 15,280Llandudno Conwy 14,872Rhosllanerchrugog Wrexham 13,246Flint Flintshire 11,936Holyhead Anglesey 11,237Source: ONS Census
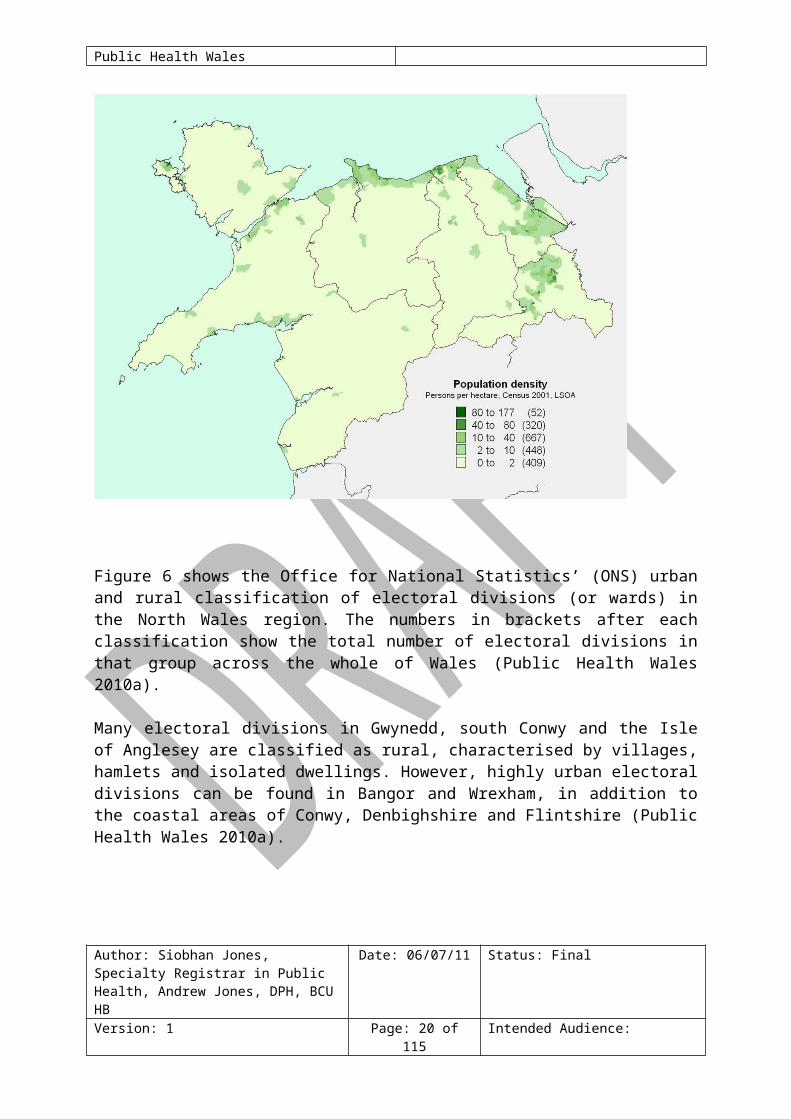
Figure 5 shows the number of people resident per hectare in North Wales at Lower Super Output Area (LSOA) level. The numbers in brackets after each range show the total number of LSOAs in that range across the whole of Wales (Public Health Wales 2010a).
It is apparent that the few densely populated areas in this region are situated around urban centres, for example in Rhyl and Wrexham and that Flintshire followed by Wrexham are the UAs with the highest population density. The majority of LSOAs in Gwynedd and the Isle of Anglesey have a population of less than two people per hectare. It is important to note that there are pockets of higher density populations within Anglesey and Gwynedd, for example, Holyhead and the Lleyn Peninsula where access to health care services needs consideration (Public Health Wales 2010a).
Figure 5: Number of people resident per hectare, Lower Super Output Area, North Wales, 2001
Author: Siobhan Jones, Specialty Registrar in Public Health, Andrew Jones, DPH, BCU HB
Date: 06/07/11 Status: Final
Version: 1 Page: 14 of 87 Intended Audience:

Public Health Wales
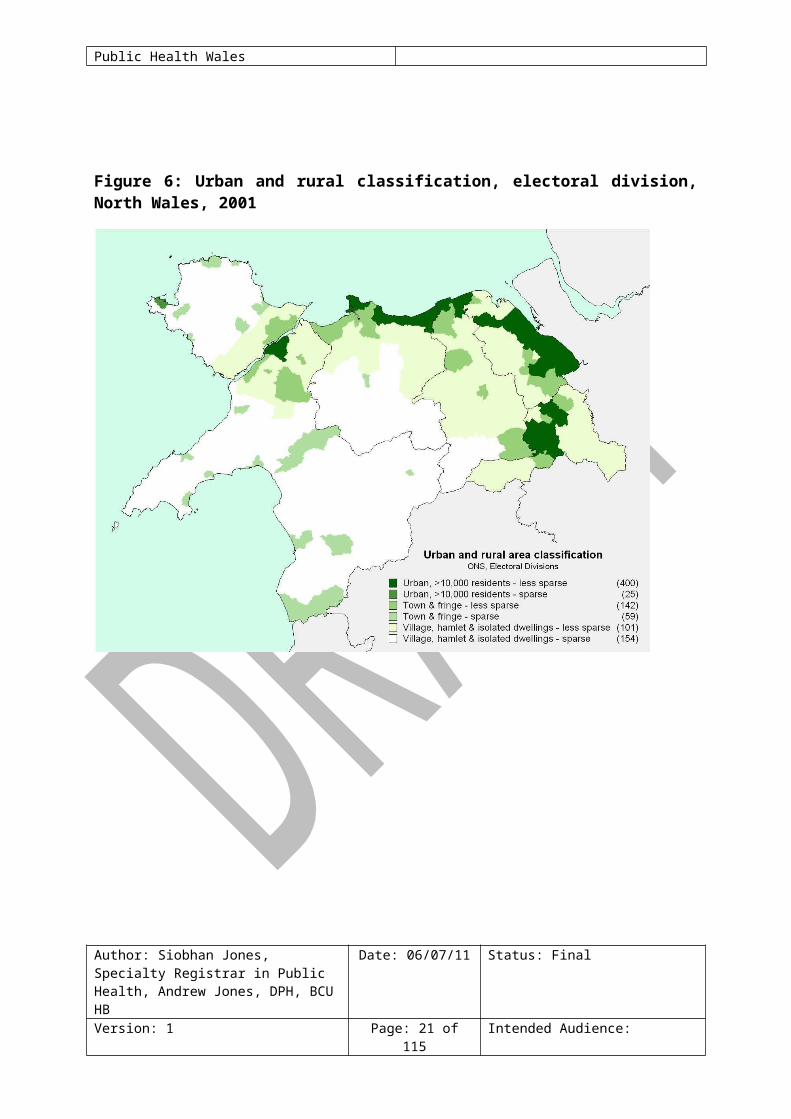
Figure 6 shows the Office for National Statistics’ (ONS) urban and rural classification of electoral divisions (or wards) in the North Wales region. The numbers in brackets after each classification show the total number of electoral divisions in that group across the whole of Wales (Public Health Wales 2010a).
Many electoral divisions in Gwynedd, south Conwy and the Isle of Anglesey are classified as rural, characterised by villages, hamlets and isolated dwellings. However, highly urban electoral divisions can be found in Bangor and Wrexham, in addition to the coastal areas of Conwy, Denbighshire and Flintshire (Public Health Wales 2010a).
Figure 6: Urban and rural classification, electoral division, North Wales, 2001
Author: Siobhan Jones, Specialty Registrar in Public Health, Andrew Jones, DPH, BCU HB
Date: 06/07/11 Status: Final
Version: 1 Page: 15 of 87 Intended Audience:

Public Health Wales
3 Deprivation 3.1 Economy and IncomeAuthor: Siobhan Jones, Specialty Registrar in Public Health, Andrew Jones, DPH, BCU HB
Date: 06/07/11 Status: Final
Version: 1 Page: 16 of 87 Intended Audience:

Public Health Wales
A number of indicators are used to measure and report deprivation. The different indices use a variety of data and, as a consequence, can produce slightly different conclusions. On the whole however, the same communities will be identified as most deprived whichever indicator is used (Public Health Wales 2010a).
3.1.1 Welsh Index of Multiple Deprivation, 2008The Welsh Index of Multiple Deprivation (WIMD) is a geographically based deprivation measure. WIMD 2008 is produced at the small area level of Lower Super Output Area (LSOA), and is derived from a broad range of factors, including income, employment, health, education, and access to services (Public Health Wales 2010a). It is well documented that areas of deprivation often have higher levels of need in relation to many different measures of health such as levels of smoking related diseases, injuries, alcohol and drug related diseases, teenage pregnancy and mental health issues (Public Health Wales 2010a).
In North Wales, 49 out of the 425 LSOAs are in the most deprived fifth in Wales (Public Health Wales 2010a). Figure 7 illustrates the WIMD across North Wales at LSOA level. In 2008 the Rhyl West 2 LSOA was identified as the most deprived in the whole of Wales, with Queensferry 1 (Wrexham) and Rhyl West 1 and Rhyl South West 2 ranked third, fourth and fifth respectively (Public Health Wales 2010a).
Figure 7: Overall Welsh Index of Multiple Deprivation, Lower Super Output Areas, fifths of deprivation, North Wales, 2008
Author: Siobhan Jones, Specialty Registrar in Public Health, Andrew Jones, DPH, BCU HB
Date: 06/07/11 Status: Final
Version: 1 Page: 17 of 87 Intended Audience:

Public Health Wales
Table 6 shows that in North Wales, Denbighshire has the highest percentage of lower super output areas in the most deprived fifth in Wales, and contains three out of the top five most deprived areas in Wales. Wrexham contains the second highest percentage of LSOAs in the most deprived fifth in Wales; Gwynedd has the lowest percentage of LSOAs in the most deprived fifth in Wales.
Table 6: Percentage of lower super output areas in most deprived fifth in Wales, 2008
%
Author: Siobhan Jones, Specialty Registrar in Public Health, Andrew Jones, DPH, BCU HB
Date: 06/07/11 Status: Final
Version: 1 Page: 18 of 87 Intended Audience:
0 10 20
miles
Bangor
Mold
Blaenau Ffestiniog
Denbigh
Flint
Wrexham
Machynlleth
LlandudnoConwy
Dolgellau
Pwllheli
Caernarfon
Prestatyn
Rhyl
Colwyn BayHolyhead
Overall Welsh Index of Multiple Deprivation 2008Fifths of deprivation, Low er Super Output Areas, Data source: WAG
Most deprived (49)Next most deprived (80)Median (107)Next least deprived (109)Least deprived (80)
A Roads
Local authority boundary
This map is reproduced from Ordnance Survey material with the permission of Ordnance Survey on behalf of the Controller of Her Majesty's Stationery Office © Crown copyright. Unauthorised reproduction infringes Crown copyright and may lead to prosecution or civil proceedings. Wales Centre for Health. Licence Number: 100044810. 2009
Public Health Wales
Wales 20North Wales 12Isle of Anglesey 11Gwynedd 5Conwy 13Denbighshire 16Flintshire 11Wrexham 14Source: WAG
Table 7 identifies those LSOAs in North Wales which fall into the most deprived 10% in Wales. Four out of the top five most deprived LSOAs in Wales are in North Wales; three are in Denbighshire and one is in Wrexham. The number of children (0-18 years) resident in each LSOA in 2008 is also shown.
Table 7: North Wales Lower Super Output Areas in most deprived 10% in Wales, 2008Lower Super Output Area
Local Authority WIMD 2008 Rank
Number of 0-18 year olds in LSOA
Rhyl West 2 Denbighshire 1 281Queensway 1 Wrexham 3 487Rhyl West 1 Denbighshire 4 393Rhyl S West 2 Denbighshire 5 597Wynnstay Wrexham 32 697Plas Madoc Wrexham 34 560Glyn 2 Conwy 44 364Rhyl West 3 Denbighshire 67 407Peblig (Caernarfon) Gwynedd 82 708Hermitage 2 Wrexham 83 276Shotton Higher 2 Flintshire 85 460Rhyl S West 1 Denbighshire 87 558Queensway 2 Wrexham 95 372Tudno 2 Conwy 117 546Morawelon Anglesey 119 367Abergele Pensarn Conwy 120 417Rhiw 3 Conwy 143 317Holywell Central Flintshire 145 496Rhyl East 3 Denbighshire 152 268Greenfield 1 Flintshire 165 319Mold West 1 Flintshire 166 309Flint Castle Flintshire 171 534Marchog 1 Gwynedd 176 490Marchog 2 Gwynedd 178 301Cartrefle 2 Wrexham 184 446Source: WAG
Author: Siobhan Jones, Specialty Registrar in Public Health, Andrew Jones, DPH, BCU HB
Date: 06/07/11 Status: Final
Version: 1 Page: 19 of 87 Intended Audience:
Public Health Wales
3.2 Impacts of DeprivationIn 2006, the National Public Health Service produced a series of reports which analysed routine datasets at Electoral Division level, in order to compare outcomes between those in the most and least deprived fifths of the population across Wales, using the Townsend Index (National Public Health Service 2006a). The reports show whether health and associated indicators are statistically different in the most deprived fifth compared with the least deprived fifth. Although the analysis was undertaken at all Wales level, we can reasonably expect people living in the most deprived areas in North Wales to have statistically significantly higher levels of ill-health and a greater exposure to the major risk factors affecting health (Public Health Wales 2010a).
It is also important to consider the issue of rurality when considering the impacts of deprivation for the North Wales population. Large areas of North Wales are classed as rural with low population density. People living in these areas can be vulnerable to particular types of poverty such as poverty of participation and access to vital services. Figure 8 details the impacts of the wider determinants of health; these wider determinants and socioeconomic circumstances have an important influence on the health and wellbeing of a population. The potential consequences of socioeconomic deprivation are multiple and complex (Public Health Wales 2010a).
Figure 8: Determinants of health and well-being (Dahlgren G. & Whitehead M.) Author: Siobhan Jones, Specialty Registrar in Public Health, Andrew Jones, DPH, BCU HB
Date: 06/07/11 Status: Final
Version: 1 Page: 20 of 87 Intended Audience:
Public Health Wales
Table 8 shows some of the known associations between ill health and deprivation. The lifestyle health determinants in Table 8 are in keeping with those identified by the World Health Organisation (WHO) that across Europe are responsible for about 60% of the burden of disease: high blood pressure, tobacco use, excessive alcohol use, high serum cholesterol, overweight, unhealthy diet and insufficient physical activity (World Health Organisation, 2009).
Table 8: Rate Ratios and Significance for indicatorsRate ratio
Significant difference?
Author: Siobhan Jones, Specialty Registrar in Public Health, Andrew Jones, DPH, BCU HB
Date: 06/07/11 Status: Final
Version: 1 Page: 21 of 87 Intended Audience:

Public Health Wales
Lifestyle Health DeterminantsPhysical inactivity 2.08 YesSmoking (daily or occasional) 1.64 YesObesity 1.47 YesAlcohol consumption (excessive) 1.05 NoHealthy diet* 0.65 Yes
Health StatusSF-36 mental component summary**
0.95 Yes
Illness & InjuryPedestrian injury 2.15 YesMental illness 1.90 YesDeathsUnintentional fall 1.21 YesRoad traffic injury* 0.96 NoSuicide 1.51 Yes Source: NPHS*Where the ratio is less than one, this means that the most deprived group exhibit a lower level for that particular indicator. For example, the rate ratio of 0.65 for healthy diet means that people living in the most deprived fifth of wards are about a third less likely to have a healthy diet than their counterparts in the least deprived fifth or wards.
**The rate ratio is reserved in this case, due to the way in which the SF36 is scored. The rate ratio of 0.95 shows that people living in the most deprived fifth of wards rate their health significantly more poorly than people living in the least deprived fifth of wards.
3.3 Deprivation and maternal/neonatal healthThere are well documented links between a number of key maternal and neonatal health indicators and deprivation. Research studies have shown that:
In Wales stillbirths were increased by 41% in the most deprived enumeration districts compared to the least deprived (Guildea et al 2001).
In Wales neonatal deaths were increased by 20% in the most deprived enumeration districts compared to the least deprived (Guildea et al 2001).
In Wales Sudden Unexplained Death in Infancy (SUDI) was strongly associated with deprivation, with higher mortality rates in the most deprived enumeration districts compared to the least deprived (Guildea et al 2001).
Neonatal unit admission rates in an English district general hospital were associated with levels of deprivation. Admission rates for all
Author: Siobhan Jones, Specialty Registrar in Public Health, Andrew Jones, DPH, BCU HB
Date: 06/07/11 Status: Final
Version: 1 Page: 22 of 87 Intended Audience:

Public Health Wales
indications except jaundice and feeding problems increased with increasing deprivation (Manning et al 2005).
The rate of preterm birth in the most deprived fifth was consistently higher than the rate in the least deprived fifth (Paranjothy S et al 2008); see Figure 9.
Figure 9: Rates of preterm babies in Wales, in the lowest and the highest fifths of deprivation, 1993-2005Source: All Wales Perinatal Survey, 2008
3.4 Deprivation and child healthThere is evidence that factors such as socioeconomic conditions, which are influential in a child’s early life, will have lasting effects on their future mental and physical health and development (Acheson 1998). The pre-pregnancy, pregnancy and early year’s phases of life are key in terms of influencing the future health and development of children and young people. Children who grow up in poverty are more vulnerable and at increased risk of (Welsh Assembly Government 2008b):
poorer health; learning and behavioural difficulties; lower educational attainment; teenage pregnancy; lower income / unemployed as an adult;
Author: Siobhan Jones, Specialty Registrar in Public Health, Andrew Jones, DPH, BCU HB
Date: 06/07/11 Status: Final
Version: 1 Page: 23 of 87 Intended Audience:

Public Health Wales
social isolation.
In addition, research studies have shown that:
Infant mortality rates are higher in lower socio-economic groups (Department of Health 2007).
Children from more deprived quintiles had higher mortality rates than those in least deprived quintiles as demonstrated for selected areas in England (Centre for Maternal and Child Enquires 2008); see Figure 10.
The risk of becoming a teenage mother in the UK is ten times higher for girls whose families are in Social Class V compared with girls whose families are in Social Class I (Office for National Statistics 2007).
Those in lower socio-economic groups experience higher rates of injury morbidity and mortality than people in higher socio-economic groups (NPHS 2006b, UNICEF 2001); see Figure 11.
Figure 10: Number of cases of child mortality by deprivation quintile (based on postcode residence); selected England regions, 2006
Source: Centre for Maternal and Child Enquiries 2008
The likelihood of childhood injuries or injury related mortality is associated with single parenthood, low maternal education, low maternal age at birth, poor housing, large family size, and parental drug or alcohol abuse (UNICEF 2001). Figure 11 shows that child pedestrian injuries in the most
Author: Siobhan Jones, Specialty Registrar in Public Health, Andrew Jones, DPH, BCU HB
Date: 06/07/11 Status: Final
Version: 1 Page: 24 of 87 Intended Audience:

Public Health Wales
deprived fifth areas occurred at 2.5 times the rate in the least deprived fifth (based on place of injury occurrence) (NPHS 2006b).
Figure 11: Pedestrian injuries reported to police, children aged 4 to 16 years: 1995-2000
Data Source: STATS 19, CAPIC from : NPHS
3.5 Deprivation and lifestyle factorsThe reasons behind the consequences of socioeconomic deprivation on health are multiple and complex. It is thought that the links between some lifestyle factors and deprivation are a major cause of health inequalities. Research studies have shown that:
There are strong links between smoking and deprivation, with more than one in three people smoking in the most deprived areas of Wales, compared to around one in seven in the least deprived areas (Welsh Assembly Government 2010).
Young people in lower socio-economic groups were more likely to report that they smoked daily. Particularly among girls (World Health Organisation 2006).
Young people with low family affluence were more likely to report that they were overweight (20.5%) compared to those with higher family affluence (16%) (World Health Organisation 2006).
People living in the most deprived areas of Wales are less likely to eat five or more portions of fruit and vegetables a day (31%) than those living in the least deprived areas (38%) (Welsh Assembly Government 2010).
Author: Siobhan Jones, Specialty Registrar in Public Health, Andrew Jones, DPH, BCU HB
Date: 06/07/11 Status: Final
Version: 1 Page: 25 of 87 Intended Audience:

Public Health Wales
People living in the most deprived areas of Wales are more likely to be overweight or obese (61%) than those living in the least deprived areas (52%) (Welsh Assembly Government 2010).
Self-reported measures of drinking above guidelines and binge drinking are as common in the most deprived as in the least deprived communities. Alcohol-related mortality rates, however, show substantial inequalities with rates more than three times as high in the most deprived areas compared to the least deprived (Gartner et al. 2009)
4 Lifestyle factors impacting on maternal and child health
4.1 TobaccoTable 9 shows the percentage of adults who smoke in North Wales. Wrexham has the highest percentage of adults who smoke, 26%; higher levels of smoking are often associated with areas of higher deprivation (Welsh Assembly Government 2010).
Table 9: Percentage of adults current smokers by Local Authority, North Wales, 2008 & 2009
%Wales 24North Wales 24Isle of Anglesey 22Gwynedd 25Conwy 22Denbighshire 25Flintshire 22Wrexham 26Source: Welsh Health Survey
4.1.1 Smoking in PregnancyThe prevalence of smoking in the female population and the variation of smoking levels between the most and least deprived areas are important factors which influence levels of maternal health within a population.
Some of the potential adverse effects of exposure to smoke during pregnancy include (Royal College of Physicians 2010):
miscarriage; perinatal death; prematurity and low birth weight (LBW); congenital abnormalities of heart, face and limbs.
Author: Siobhan Jones, Specialty Registrar in Public Health, Andrew Jones, DPH, BCU HB
Date: 06/07/11 Status: Final
Version: 1 Page: 26 of 87 Intended Audience:

Public Health Wales
In 2005, 37% of mothers in Wales reported smoking at some stage during their pregnancy or the year before and 22% smoked throughout the pregnancy. The highest rates of smoking were found in mothers aged under 20 years. Mothers in Wales are more likely to smoke and less likely to give up than in other UK countries (Dolman et al. 2007).
In light of the impacts of smoking on outcomes for mothers and babies as listed above, smoking is a key factor influencing use of maternity and neonatal services. Due to the levels of harm caused by smoking in pregnancy, measures taken to support women to quit smoking are always cost effective (Richardson 2009).
4.1.2 Exposure to second hand smoke in childhoodIn 2005/06, 37% of households with children contained at least one adult who smoked daily (Dolman 2007). The health, social and economic consequences of exposure to smoke in childhood include (Royal College of Physicians 2010):
childhood asthma and wheeze; childhood middle ear infections; lower respiratory tract infections; bacterial meningitis; sudden infant death; children developing a smoking habit.
In households that smoke, children are exposed to passive smoking (Royal College of Physicians 2010):
three fold if dad smokes; six fold if mum smokes; and nine fold if both parents smoke.
Exposure to second hand smoke in childhood represents a significant factor influencing the use of health services. The burden of disease and costs to the NHS by passive smoking in UK children are substantial. The Royal College of Physicians estimate that in one year passive smoking results in over: (Royal College of Physicians 2010)
165,000 new episodes of disease; 300,000 primary care contacts (£10 million); 9,500 hospital admissions (£13.6 million); at least 200 cases of bacterial meningitis; around 40 sudden infant deaths; approximately 23,000 children will go on to start smoking.
4.1.3 Smoking in teenagers
Author: Siobhan Jones, Specialty Registrar in Public Health, Andrew Jones, DPH, BCU HB
Date: 06/07/11 Status: Final
Version: 1 Page: 27 of 87 Intended Audience:

Public Health Wales
Smoking is generally more common in younger people. More than twice as many 16 to 24 year olds are smokers (24%) compared to people aged 65 years and over (10%) (World Health Organisation 2006).
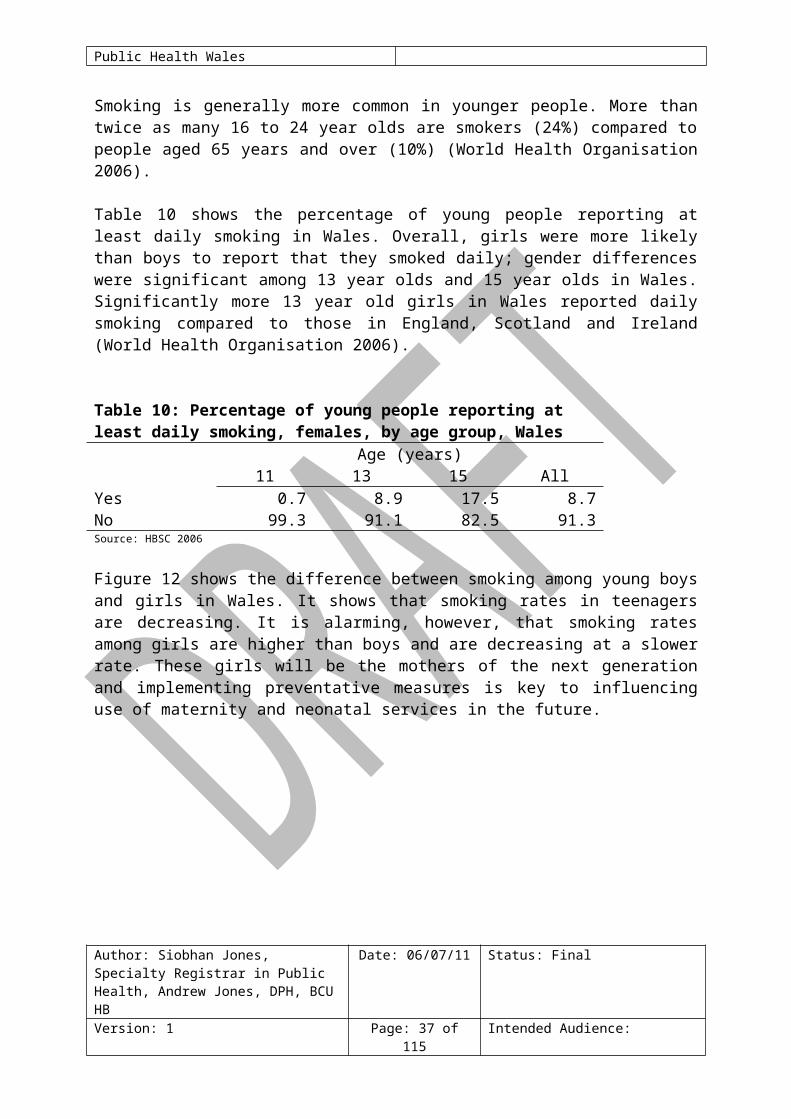
Table 10 shows the percentage of young people reporting at least daily smoking in Wales. Overall, girls were more likely than boys to report that they smoked daily; gender differences were significant among 13 year olds and 15 year olds in Wales. Significantly more 13 year old girls in Wales reported daily smoking compared to those in England, Scotland and Ireland (World Health Organisation 2006).
Table 10: Percentage of young people reporting at least daily smoking, females, by age group, Wales
Age (years)11 13 15 All
Yes 0.7 8.9 17.5 8.7No 99.3 91.1 82.5 91.3Source: HBSC 2006
Figure 12 shows the difference between smoking among young boys and girls in Wales. It shows that smoking rates in teenagers are decreasing. It is alarming, however, that smoking rates among girls are higher than boys and are decreasing at a slower rate. These girls will be the mothers of the next generation and implementing preventative measures is key to influencing use of maternity and neonatal services in the future.
Figure 12: Percentage of 15 year olds who smoked at least once a week (weekly smoking), WalesSource: HBSC 2005/06
Author: Siobhan Jones, Specialty Registrar in Public Health, Andrew Jones, DPH, BCU HB
Date: 06/07/11 Status: Final
Version: 1 Page: 28 of 87 Intended Audience:

Public Health Wales
4.2 Overweight and ObesityTable 11 shows that 54% of the adult population in North Wales are overweight or obese.
Table 11: Percentage of adults who are overweight or obese, 2008 + 2009
% of adultsWales 57North Wales 54Isle of Anglesey 56Gwynedd 57Conwy 52Denbighshire 53Flintshire 55Wrexham 52Source: Welsh Health Survey
The Welsh Health Survey 2009 found that in Wales, 34% of children were estimated to be overweight or obese, including 19% obese. The numbers of children and adolescents in Wales that are overweight or obese is a growing concern (Welsh Assembly Government 2010).
4.2.1 Obesity in pregnancyObesity in pregnancy has been recognised as a significant risk factor for both the mother and child. It has been estimated that around half of all women of childbearing age are either overweight or obese (NICE 2010). The Confidential Enquiry into Maternal and Child Health (CEMACH) state that (Centre for Maternal and Child Enquiries 2007): “The magnitude of risk means that obesity represents one of the greatest and growing overall threats to the childbearing population of the UK” Author: Siobhan Jones, Specialty Registrar in Public Health, Andrew Jones, DPH, BCU HB
Date: 06/07/11 Status: Final
Version: 1 Page: 29 of 87 Intended Audience:
0
5
10
15
20
25
30
35
1993/94 1997/98 2001/02 2005/06
Per
cen
t
Girls (Wales)
Girls (HBSC)
Boys (Wales)
Boys (HBSC)

Public Health Wales
The 2007 CEMACH report ‘Saving mothers lives’ found that thromboembolism was the commonest cause of direct maternal death and cardiac disease (including cardiovascular disease) the commonest cause of indirect maternal death, overweight and obesity are known risk factors for developing these (Centre for Maternal and Child Enquiries 2007).
Table 12 highlights the risks of obesity for both mother and child in pregnancy.
Table 12: Risks related to obesity in pregnancyMaternal Risks Fetal / child risks
o Maternal death or severe morbidity
o Cardiac diseaseo Miscarriageo Pre-eclampsiao Gestational diabeteso Thromboembolismo Increased risk of Caesarean
Section (CS)o Infection post CSo Anaesthetic challengeso Infection from other causes
/siteso Post partum haemorrhage
o Stillbirtho Neonatal deatho Congenital abnormalitieso Prematurityo macrosomiao Lower breastfeeding rateso Increased risk of obesity and
metabolic disorders in childhood
Source: CMACE 2007 and CMACE/RCOG 2010
A recent systematic review and Meta analysis concluded that overweight and obese women have higher risks of preterm birth before 32 weeks and induced preterm birth before 37 weeks. The relative risk of premature birth was found to increase as maternal weight increased. In addition maternal overweight and obesity were not found to be protective against having infants of low birth weight (McDonald et al 2010).
Increased rates of obesity in pregnancy are reflected in increased social and financial costs: (Galtier-Dereure et al, 2000)
On average obese women spend 4.43 more days in hospital; Antenatal care costs are increased five fold due to the increased
levels of complications obese women experience during pregnancy and labour;
Babies born to obese mothers are at increased risk (3.5 fold increase) of requiring admission to Neonatal Intensive Care Unit (NICU).
Author: Siobhan Jones, Specialty Registrar in Public Health, Andrew Jones, DPH, BCU HB
Date: 06/07/11 Status: Final
Version: 1 Page: 30 of 87 Intended Audience:

Public Health Wales
In light of the high levels of overweight and obesity in the population and the impacts of obesity on pregnancy and the outcomes for mothers and babies, it is a key factor influencing use of maternity and neonatal services.
4.2.2 Childhood obesityThe highest percentage of young people in the UK who reported that they were overweight can be found in Wales, 19.1% (World Health Organisation 2006). Table 13 shows the percentage of young females in Wales reported as overweight by age group (World Health Organisation 2006).
Table 13: Percentage of young females who reported overweight, by age group, Wales
Age (years)11 13 15 All
Overweight: No 78.8 83.4 81.6 81.5Overweight: Yes 21.2 16.6 18.4 18.5Source: HBSC 2006
The Department of Health estimate that if no action is taken to stem the rise in overweight and obesity in children and adolescents that by 2050, 25% of all children will be obese and 30% will be overweight (Department of Health & Department of Children Schools & Families 2009). The Health Survey for England produced some projections for childhood obesity trends; Figure 13 shows these projections (Department of Health 2005).
As with smoking, these trends are alarming. Teenage girls are the next generation of mothers and rising trends in obesity will have an important influence on the use of maternity, neonatal, gynaecology and paediatric services.
Figure 13: Future trends in obesity, boys & girls aged under 20 years 2004-2020
Author: Siobhan Jones, Specialty Registrar in Public Health, Andrew Jones, DPH, BCU HB
Date: 06/07/11 Status: Final
Version: 1 Page: 31 of 87 Intended Audience:

Public Health Wales
4.3 Substance misuse: AlcoholTable 14 shows the percentage of adults who drink above the national guidelines in North Wales. Gwynedd and Flintshire have the highest percentages in North Wales and are higher that the Wales average.
Table 14: Percentage of adults who drink alcohol above guidelines, 2008 + 2009
% of adultsWales 45Author: Siobhan Jones, Specialty Registrar in Public Health, Andrew Jones, DPH, BCU HB
Date: 06/07/11 Status: Final
Version: 1 Page: 32 of 87 Intended Audience:

Public Health Wales
North Wales 44Isle of Anglesey 43Gwynedd 47Conwy 42Denbighshire 43Flintshire 46Wrexham 43Source: Welsh Health Survey
4.3.1 Alcohol use in pregnancyIt is estimated that 55% of all women consumed some alcohol during pregnancy in Wales. 7% of pregnant women in Wales report drinking more than one to two units per week during pregnancy (Gartner et al 2009).
There is evidence that alcohol can adversely affect the outcome of a pregnancy in a number of ways (Royal College of Obstetrics & Gynaecology 2006):
miscarriage; aneuploidy (chromosomal abnormality); structural congenital anomaly; disordered fetal growth; perinatal death; developmental delay; susceptibility to disease for infant in later life.
The extent of the morbidity attributable to alcohol is dependent on the quantity and frequency of alcohol consumed during pregnancy, the most extreme cases can result in fetal alcohol syndrome (Royal College of Obstetrics & Gynaecology 2006). As discussed the consequences of excess alcohol consumption are multiple and can have long term consequences; it is therefore important to consider that the adverse effects of alcohol are potentially preventable.
4.3.2 Alcohol use and young peopleExcessive alcohol consumption in young people carries a multitude of risk to themselves, the family and society including (Gartner et al 2009, Welsh Assembly Government 2008b):
negative effect on physical health; increased risk of teenage pregnancy; increase in accident rates; mental health issues and increased risk of suicide; increased association with violence; anti-social behaviour; increased rates of youth offending; poor school performance.
Author: Siobhan Jones, Specialty Registrar in Public Health, Andrew Jones, DPH, BCU HB
Date: 06/07/11 Status: Final
Version: 1 Page: 33 of 87 Intended Audience:

Public Health Wales
According to the 2005/06 Health Behaviour in School Aged Children Survey, 6% of 11 year olds; 21% of 13 year olds; and 40% of 15 year olds in Wales reported drinking alcohol on a weekly basis (World Health Organisation 2006). There were 1,602 referrals for alcohol treatment in those aged 19 years and under in Wales during 2007/08 (Gartner et al 2009).
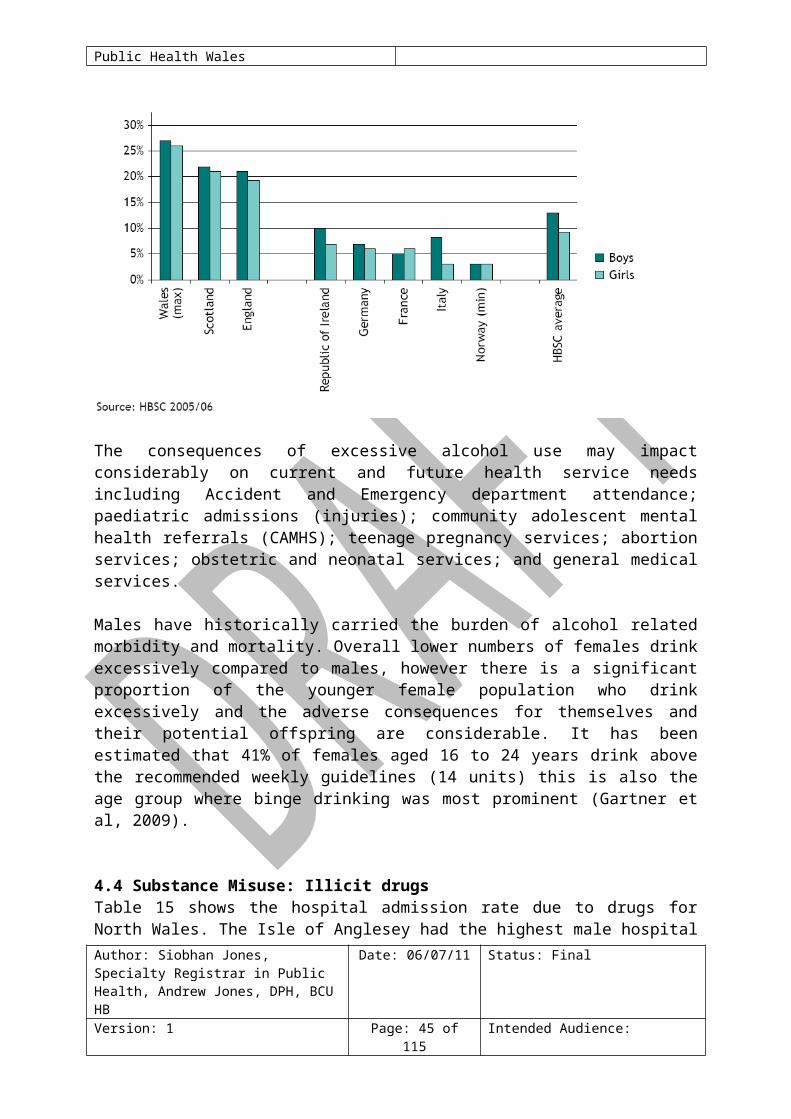
Figure 14 highlights that Welsh teenagers (aged 13 years) have reported higher rates of drunkenness than teenagers in other UK and European countries.
Figure 14: Percentage of 13-year olds who reported having been drunk at least twice for selected countries Source: adapted from fig.3 Gartner et al, 2009
The consequences of excessive alcohol use may impact considerably on current and future health service needs including Accident and Emergency department attendance; paediatric admissions (injuries); community adolescent mental health referrals (CAMHS); teenage pregnancy services; abortion services; obstetric and neonatal services; and general medical services.
Males have historically carried the burden of alcohol related morbidity and mortality. Overall lower numbers of females drink excessively compared to males, however there is a significant proportion of the younger female population who drink excessively and the adverse consequences for themselves and their potential offspring are considerable. It has been estimated that 41% of females aged 16 to 24 years drink above the recommended weekly guidelines (14 units) this is also the age group where binge drinking was most prominent (Gartner et al, 2009).
Author: Siobhan Jones, Specialty Registrar in Public Health, Andrew Jones, DPH, BCU HB
Date: 06/07/11 Status: Final
Version: 1 Page: 34 of 87 Intended Audience:

Public Health Wales
4.4 Substance Misuse: Illicit drugsTable 15 shows the hospital admission rate due to drugs for North Wales. The Isle of Anglesey had the highest male hospital admission rate due to drugs in 2008. Gwynedd had the highest female hospital admission rate due to drugs.
Table 15: Hospital admission rate per 100,000 population due to drugs, 2008
Males FemalesWales 171 112North Wales 173 125Isle of Anglesey 331 131Gwynedd 197 160Conwy 184 114Denbighshire 166 106Flintshire 105 102Wrexham 162 143Source: PEDW, 2008
4.4.1 Use of illicit drugs in pregnancySubstance misuse in pregnancy carries considerable risks for maternal and neonatal health in addition there is evidence of higher maternal hospital costs among illicit drug users and higher neonatal costs due to increased length of hospital stay (Shankaran et al 2007).
The Maternal Lifestyle Study, a prospective case control observational study within the USA, is one of the largest studies evaluating the impact of substance misuse on pregnancy outcome. Table 16 below highlights important findings from this study in relation to both maternal, neonatal and childhood effects of substance misuse in pregnancy; it should be noted that this study found the levels of opiate addiction in pregnancy to be low in comparison to cocaine, tobacco, marijuana and alcohol (Shankaran et al 2007).
Table 16: Maternal, neonatal and childhood affects of substance misuse in pregnancy
Maternal effects Neonatal effects Childhood effectso Tendency for fewer
antenatal visitso Increased medical
complicationso Higher rates of
o Preterm deliveryo Low birth weighto Intrauterine Growth
Retardation (IUGR)o Higher frequency of
o Increased referrals to child protection services
o Increased childhood behavioral
Author: Siobhan Jones, Specialty Registrar in Public Health, Andrew Jones, DPH, BCU HB
Date: 06/07/11 Status: Final
Version: 1 Page: 35 of 87 Intended Audience:

Public Health Wales
sexually transmitted infections (STI’s)
o Higher rates of psychiatric , nervous and emotional disorders
o Placental abruptiono Increased length of
hospital stay
central nervous system (CNS) and autonomic nervous system (ANS) symptoms
o Neonatal opiate abstinence syndrome (withdrawal)
o Increased length of hospital stay
o More investigations for sepsis
o More admissions to NICU
o Reduced rates of breast feeding
problemso Increased referral
to special education services in school
Source: Shankaran et al 2007
It is important to note that different illicit drugs give a myriad of effects, not all are covered in this table and not every drug will cause the risks described, in particular opiate use during pregnancy has not been associated with any medical, teratogenic or growth differences when compared to non opiate exposed controls (Shankaran et al 2007).
Over the last five years, the total number of drug related deaths in Wales has increased by over 30%. Hospital admissions for mental and behavioural disorders due to opioids and cocaine have also increased. It has been estimated that up to 17,500 children and young people in Wales live in families affected by parental drug misuse (Public Health Wales Observatory 2009).
The HBSC survey 2005/06 found that 11.0% of females aged 15 years in Wales reported cannabis use in the 30 days prior to the survey. In comparison; 15 year old females in Scotland had higher reported cannabis use (11.3%); while in England (8.1%) and Ireland (7.3%) they had lower reported cannabis use. Females (aged 15 years) in Wales from families of low affluence reported higher levels of cannabis use than those from families of medium of high affluence (World Health Organisation 2006). It has been reported that currently cannabis is the most widely used drug by adolescents in Wales (Welsh Assembly Government 2008b). When discussing cannabis, the consequences of smoking tobacco alongside the cannabis must also be considered.
5 Data AnalysisAuthor: Siobhan Jones, Specialty Registrar in Public Health, Andrew Jones, DPH, BCU HB
Date: 06/07/11 Status: Final
Version: 1 Page: 36 of 87 Intended Audience:
Public Health Wales
5.1 Maternal and neonatal factors
5.1.1 Birth RateTable 17 shows the number of registrable births in North Wales during the period 2004 to 2008. The total number of registrable births (live births and stillbirths) in 2008 to mothers resident in North Wales has risen for the seventh consecutive year. This is an increase of 20% since 2002; 96.1% of births occurred in hospitals or midwifery led units, 3.5% of births were homebirths and 0.4% of births occurred in transit or elsewhere (All Wales Perinatal Survey 2008).
Table 17 shows that in North Wales during the period 2004 to 2008, Flintshire and Wrexham had the highest number of registrable births. The Isle of Anglesey had the lowest number.
Table 17: Number of registrable births, North Wales, 2004-2008
NumberWales 169,581North Wales 36,528Isle of Anglesey 3,452Gwynedd 6,250Conwy 5,401Denbighshire 4,996Flintshire 8,532Wrexham 7,897Source: NCCHD & AWPS
5.1.2 Birth Rate ProjectionsAge-specific birth rate patterns suggest that the number of births will increase during the first few years of the projection period before decreasing until 2030/31. However, the number and age profile of women in any unitary authority will change year on year and so this will affect the number of births projected to occur (Welsh Assembly Government 2008a).
The projected birth rates for Wales, by age group of mother, are (Welsh Assembly Government 2008a):
20 to 24 year olds is expected to increase until 2007/08 and then remain fairly constant until 2030/31;
25 to 29 year olds is expected to increase in the first few years of the projection and then remain fairly constant until 2030/2031;
Author: Siobhan Jones, Specialty Registrar in Public Health, Andrew Jones, DPH, BCU HB
Date: 06/07/11 Status: Final
Version: 1 Page: 37 of 87 Intended Audience:

Public Health Wales
30 to 34 year olds and 35 to 39 year olds are expected to increase until 2010/11 and then decline to levels slightly below levels seen in 2005/2006;
40 year olds and over are expected to increase until 2010/11 and then decline slightly but remain at levels higher than seen in 2005/06.
5.1.3 Total Fertility Rate The Total Fertility Rate (TFR) is the average number of children that women would bear if the female population experienced age-specific fertility rates for the year in question throughout their childbearing lifespan (Welsh Assembly Government 2008a). Across Wales, TFR’s are generally expected to increase (in all unitary authorities) until 2010/11 and then decline slowly until 2030/31, although still remaining at levels slightly higher than in 2005/06 (Welsh Assembly Government 2008a).
Between 2020/21 and 2030/31 the TFR will remain constant in most local authorities except for some, including Isle of Anglesey and Flintshire where they will decline slightly (Welsh Assembly Government 2008a).In 2030/31 the TFR is predicted to still be higher in every LA in Wales compared with levels seen in 2005/06 therefore predicting that more births would be seen if the number and age profile of women remained the same (Welsh Assembly Government 2008a).
5.1.4 General Fertility Rate The General Fertility Rate (GFR) is defined as the total number of live births born to females who are of childbearing age in a population, i.e. those aged between 15 and 44 years. This rate provides a useful indicator when studying population growth and change (Public Health Wales 2010a). Figure 15 shows that the GFR has been slowly rising across North Wales and Wales since 2001/2002. It has been postulated that this upturn has been largely driven by increasing birth rates among older women. The North Wales GFR is higher than the Wales rate but closely reflects the Welsh pattern (Public Health Wales 2010a).
Figure 15: General Fertility Rate (GFR) trends, Wales and Betsi Cadwaladr University LHB, 1998 to 2007
Author: Siobhan Jones, Specialty Registrar in Public Health, Andrew Jones, DPH, BCU HB
Date: 06/07/11 Status: Final
Version: 1 Page: 38 of 87 Intended Audience:

Public Health Wales
Figure 16 shows the GFR for UAs and the MSOAs in North Wales. Wrexham has the highest GFR, 64 per 1,000; within the Wrexham UA area, the MSOA Wrexham 010 (Cartrefle, Queensway, and Wynnstay) has the highest GFR, 93 per 1,000. Gwynedd UA has the lowest GFR, 58 per 1,000 in North Wales.
Author: Siobhan Jones, Specialty Registrar in Public Health, Andrew Jones, DPH, BCU HB
Date: 06/07/11 Status: Final
Version: 1 Page: 39 of 87 Intended Audience:
General fertility rate (GFR) trend, Wales and Betsi Cadwaladr University LHB, 1998 to 2007
0
20
40
60
80
1998 1999 2000 2001 2002 2003 2004 2005 2006 2007
Live
birt
hs p
er 1
000
fem
ales
age
d 15
-44
Betsi Cadwaladr University LHB Wales
Data source: Office for National Statistics (Annual District Births Extract, Mid-year Population Estimates)
Error bars show 95% Confidence Intervals

Public Health Wales
Figure 16: General Fertility Rate per 1,000 in Betsi Cadwaladr University Health Board area, females aged 15-44, 2006-08Produced by Public Health Wales Observatory, using data from ONS (ADBE, MYE)
Author: Siobhan Jones, Specialty Registrar in Public Health, Andrew Jones, DPH, BCU HB
Date: 06/07/11 Status: Final
Version: 1 Page: 40 of 87 Intended Audience:
5252
58606262
686874
005008002009007004006001003
MSO
A
Isle of Anglesey
I sle of Anglesey GFR = 63
GFR 21495154545760636464676768686871
77
001017014013010016005002015011003007004008012009006
MSO
A
Gwynedd
Gwynedd GFR = 58
GFR
5151535556586061616366676971
84
012006003011008001013014015004005009002010007
MSO
A
Conwy
Conwy GFR = 62
GFR 4647525353555556565758
686972
8484
002016009005013015008012010003014007001011006004
MSO
A
Denbighshire
Denbighshire GFR = 61
GFR
4548505151525252545858586166676769717374
001019006020014010018012011017005016013015008009007002003004
MSO
A
Flintshire
Flintshire GFR = 60
GFR4747484851555859616162
68697072737376
93
002009007018011008016001014019013006004003017015005012010
MSO
A
Wrexham
Wrexham GFR = 64
GFR
494523530539549554564575576581585626656675
736941
Denbighshire EASR = 611003008015001014016012013007009002010005011
006004
Denbighshire MSOA GFR with 95% confidence interval
5252586062626868748
0 20 40 60 80 100 120
005008002009007004006001003
0 20 40 60 80 100 120
MS OALocal AuthorityWales (GFR = 60)Health Board (GFR = 61)
Isle of Anglesey

Public Health Wales
Figure 17 shows GFRs by MSOA. It also provides data on MSOAs significantly higher than the overall European Age Standardised Rate (EASR) for Wales.
Figure 17: General Fertility Rate per 1,000 females aged 15 to 44 years, Middle Super Output Area, North Wales, 2006-08
Author: Siobhan Jones, Specialty Registrar in Public Health, Andrew Jones, DPH, BCU HB
Date: 06/07/11 Status: Final
Version: 1 Page: 41 of 87 Intended Audience:
MSOAs significantly higher than overall EASR for Waleslabel MSOA name annual avg EASR label MSOA name annual avg EASR
29 Wrexham 010 146 92.6 14 Gwynedd 009 78 70.628 Denbighshire 004 134 83.9 13 Wrexham 003 110 70.227 Denbighshire 006 98 83.7 12 Flintshire 007 86 69.326 Conwy 007 91 83.5 11 Denbighshire 001 67 69.125 Gwynedd 006 129 77.2 10 Wrexham 004 85 69.124 Wrexham 012 135 76.0 9 Conwy 002 80 68.623 Isle of Anglesey 003 149 74.3 8 I sle of Anglesey 001 95 68.422 Flintshire 004 91 74.0 7 I sle of Anglesey 006 83 68.321 Wrexham 005 116 73.2 6 Gwynedd 012 89 68.320 Wrexham 015 103 73.0 5 Gwynedd 008 91 68.319 Flintshire 003 152 72.5 4 Wrexham 006 105 68.218 Wrexham 017 124 71.9 3 Conwy 009 112 67.317 Denbighshire 011 77 71.8 2 Flintshire 009 125 67.216 Flintshire 002 87 71.4 1 Flintshire 015 150 65.715 Conwy 010 103 70.7

Public Health Wales
5.1.5 Conception and Abortion RatesTable 18 shows that in North Wales, Wrexham has the highest conception rates for females aged 15 to 44 years, 83.1 per 1,000; this is higher than the rate for Wales, 75.7 per 1,000 and for England, 80.2 per 1,000. Gwynedd has the lowest conception rate, 73.7 per 1,000 females aged 15 to 44 years.
Table 18: Conceptions and outcomes, numbers and rates per 1,000 females aged 15 to 44 years, North Wales, 2008
Number (000s)
Rates per 1,000 women aged 15-44Total Maternities Abortions
England 844.9 80.2 62.6 17.5Wales 43.7 75.7 59.8 15.9Isle of Anglesey 0.9 80.2 65.1 15.1Gwynedd 1.6 73.7 58.4 15.3Conwy 1.4 79.9 62.3 17.6Denbighshire 1.3 77.0 60.9 16.1Flintshire 2.1 75.8 60.3 15.5Wrexham 2.1 83.1 64.5 18.5Source: ONS
Abortion rates as a proportion of total teenage pregnancies (abortion proportion) are inversely correlated with deprivation levels. The proportion of teenage pregnancies ending in abortion (abortion proportion) is higher in the least deprived areas compared to the most deprived areas, leading to a higher rate of teenage maternities in the most deprived areas. The absolute abortion rates remain higher in the more deprived areas due to the higher rates of teenage conceptions (Office for National Statistics 2007).
Table 19 shows that abortion rates within North Wales vary from 15 per 1,000 females aged 15 to 44 years in Gwynedd to 21 per 1,000 females aged 15 to 44 years in Conwy.
Table 19: Abortion rates per 1,000 females aged 15-44 years, 2009
Rate per 1,000Wales 16Isle of Anglesey 19Gwynedd 15Conwy 21Denbighshire 18Flintshire 17Wrexham 18Source: Department of Health
5.1.6 Maternal Mortality
Author: Siobhan Jones, Specialty Registrar in Public Health, Andrew Jones, DPH, BCU HB
Date: 06/07/11 Status: Final
Version: 1 Page: 42 of 87 Intended Audience:

Public Health Wales
The Centre for Maternal and Child Enquires (CMACE) collects data on maternal deaths (Confidential Enquiry into Maternal and Child Health (CEMACH)). There are relatively few maternal deaths in the UK per year. The data extrapolated from each case is extremely important in highlighting key factors related to each death. The confidential nature and the small number of cases reviewed means data for North Wales and UA level are not presented here (Centre for Maternal and Child Enquires 2007).
The consequences of a maternal death are far reaching. In the 2003 to 2005 triennium approximately 360 children and 160 live newborns lost their mother to a reported direct or indirect maternal death (Centre for Maternal and Child Enquires 2007).
The commonest cause of direct maternal death is thromboembolism and the commonest cause of indirect maternal death is cardiac disease. Cardiovascular disease (acquired) is increasing in frequency in pregnant women and is occurring in women of a younger age than in previous reports; this is thought to be related to less healthy lifestyles, increasing levels of obesity, smoking and increasing levels of excessive alcohol consumption. In addition, the age at which women get pregnant is older therefore the risk of a pre existing medical condition being present is higher (Centre for Maternal and Child Enquires 2007).
It is important to consider that in addition to clinical factors links have also been observed between non clinical factors and the risk of maternal death including deprivation; social isolation and vulnerable populations (Centre for Maternal and Child Enquires 2007).
Table 20 below highlights such factors as identified within the 2007 CEMACH report ‘Saving Mothers Lives 2003-2005’.
Table 20: Factors influencing the risk of maternal death o Increasing maternal ageo Maternal overweight and obesityo Smokingo Substance misuseo Absence from complete antenatal careo Lone parento Unemploymento Migrant womeno Pre existing medical condition / obstetric historyo Twin, triplet and higher order birthsSource: CMACE 2007
5.1.7 Neonatal and Infant Mortality
Author: Siobhan Jones, Specialty Registrar in Public Health, Andrew Jones, DPH, BCU HB
Date: 06/07/11 Status: Final
Version: 1 Page: 43 of 87 Intended Audience:

Public Health Wales
Neonatal and infant health is influenced by many factors. Worldwide infant mortality rates of a country are used to gauge the population’s health (Reidpath & Allotey 2003). In the UK mortality rates are comparatively low.
Table 21 shows the maternal socio-demographic risk factors for still birth and neonatal death (Centre for Maternal and Child Enquires 2010).
Table 21: Maternal socio-demographic risk factors for stillbirth and neonatal deatho maternal ageo maternal smoking statuso maternal BMIo maternal ethnicityo maternal social deprivationSource: CMACE 2010
Author: Siobhan Jones, Specialty Registrar in Public Health, Andrew Jones, DPH, BCU HB
Date: 06/07/11 Status: Final
Version: 1 Page: 44 of 87 Intended Audience:
Public Health Wales
Table 22 contains a number of definitions, it is important to understand the different mortality rate definitions as there are different causal factors involved for each group (All Wales Perinatal Survey 2008).
Table 22: Definitions of neonatal and infant mortality
Registrable Births stillbirths and livebirths
Spontaneous miscarriage Spontaneous late fetal deaths before 24 weeks of gestation
rates per thousand live and stillbirths
Therapeutic abortion Therapeutic late fetal deaths Before 24 weeks of gestation
Stillbirths Late fetal deaths from 24 weeks of gestation
rates per thousand live and stillbirths
Perinatal deaths Stillbirths and deaths in the first week of life
Early neonatal deaths Deaths in first 6 days of life
Late neonatal deaths Deaths at ages 7-27 Completed days of life
rates per thousand livebirthsNeonatal deaths Deaths in the first 27 Completed days of life
Post neonatal deaths Deaths at ages 28 days And over but under one year
Infant deaths Deaths at ages under one year
Source: All Wales Perinatal Survey
Author: Siobhan Jones, Specialty Registrar in Public Health, Andrew Jones, DPH, BCU HB
Date: 06/07/11 Status: Final
Version: 1 Page: 45 of 87 Intended Audience:

Public Health Wales
Table 23 shows the three year cumulative mortality rates across Wales and North Wales (All Wales Perinatal Survey 2008).
The rate of stillbirth in North Wales (4.5 per 1,000 registrable births) is not significantly lower than the all Wales rate (5.0 per 1,000 registrable births).
The perinatal mortality rate in North Wales (6.8 per 1,000 registrable births) is not significantly lower than the all Wales rate (7.1 per 1,000 registrable births).
The neonatal mortality rate in North Wales (3.3 per 1,000 live births) is not significantly higher than the all Wales rate (3.0 per 1,000 live births).
The infant mortality rate in North Wales is the same as the all Wales rate (4.4 per 1,000 live births).
Table 23: Mortality rates per 1000 births, with 95% confidence intervals, North Wales, 2006-2008
North Wales WalesRegistrable births 22,327 104,429Stillbirth rate 4.5 (3.7, 5.5) 5.0 (4.6, 5.4)Perinatal mortality rate 6.8 (5.8, 7.9) 7.1 (6.6, 7.6)Total live births 22,226 103,909Neonatal mortality rate 3.3 (2.7, 4.2) 3.0 (2.7, 3.4)Infant mortality rate 4.4 (3.6, 5.3) 4.4 (4.1, 4.9)Source: NCCHD & AWPSData on late foetal losses, stillbirths and neonatal deaths relate to the date of birth, while data on post neonatal deaths relate to the date of death in 2008
5.1.8 Stillbirth
The All Wales Perinatal Survey found (All Wales Perinatal Survey 2008): In North Wales the stillbirth rate for 2006 to 2008 was 4.5 per 1,000
registrable births (4.8 per 1,000 registrable births if the years 2004 to 2006 are included).
The two main identifiable causes of stillbirth in North Wales between 2004 and 2008 were ante partum haemorrhage (13.8%) and congenital anomaly (14.9%); see Table 24.
Between 2004 and 2008, 50.6% of stillbirths in North Wales were classified as ‘unknown cause’.
Table 24: Stillbirth rate per 1,000 births, North Wales, 2004-2008Rate per 95% CI
Author: Siobhan Jones, Specialty Registrar in Public Health, Andrew Jones, DPH, BCU HB
Date: 06/07/11 Status: Final
Version: 1 Page: 46 of 87 Intended Audience:

Public Health Wales
1,000 birthsWales 5.2 (4.9 5.6)North Wales 4.8 (4.1 5.5)Isle of Anglesey 4.6 (2.9 7.5)Gwynedd 4.8 (3.4 6.8)Conwy 4.3 (2.8 6.4)Denbighshire 4.8 (3.2 7.1)Flintshire 4.0 (2.9 5.6)Wrexham 6.0 (4.5 7.9)Source: NCCHD & AWPS
In North Wales the highest stillbirth rate during the period 2004 to 2008 was in Wrexham UA, 6.0 per 1,000 registrable births; this is not statistically significantly higher than other UAs in North Wales. Caution is required when interpretation of small numbers is undertaken as absolute numbers are small and differences in rates can be greatly influenced by small fluctuations. In addition areas containing regional and sub regional hospitals may have higher mortality rates due to the complex cases referred to their care (All Wales Perinatal Service 2008). Across Wales there are no significant differences in stillbirth rates (All Wales Perinatal Service 2008).
Table 25 shows stillbirth (including late terminations) by Aberdeen (also known as ‘Obstetric’) classification. This classifies these deaths according to the clinical factors that preceded death (All Wales Perinatal Survey 2008.
Table 25: Classification of deaths – stillbirths*, North Wales, 2004-2008
North Wales WalesNumber % Number %
Ante partum haemorrhage
24 13.8 102 11.6
Congenital anomaly 26 14.9 128 14.5Maternal disorder 10 5.7 61 6.9Mechanical 7 4.0 36 4.1Miscellaneous 7 4.0 23 2.6Pre-eclampsia 12 6.9 35 4.0Unclassifiable 0 0.0 5 0.6Unexplained 88 50.6 493 55.8Total 174 883Source: NCCHD & AWPS*including late terminations
5.1.9 Perinatal mortality rate
The All Wales Perinatal Survey found (All Wales Perinatal Survey 2008):
Author: Siobhan Jones, Specialty Registrar in Public Health, Andrew Jones, DPH, BCU HB
Date: 06/07/11 Status: Final
Version: 1 Page: 47 of 87 Intended Audience:

Public Health Wales
The Wales perinatal mortality rate in 2008 was 6.8 per 1,000 registrable births and is similar to the cumulative rate for the three years 2006 to 2008.
The North Wales perinatal mortality rate for 2008 was 6.1 per 1,000 registrable births.
In North Wales the perinatal mortality rate for 2004-2008 was highest in Wrexham UA (8.5 per 1,000 registrable births); again caution must be taken in interpretation of these figures as numbers are small. There is no significant difference in the perinatal mortality rates between UAs in North Wales and in comparison to all Wales rates.
Table 26: Perinatal mortality rate per 1,000 births, North Wales, 2004-2008
Rate per 1,000 births
95% CI
Wales 7.4 (7.0 7.8)North Wales 7.2 (6.4 8.1)Isle of Anglesey 6.7 (4.4 10.0)Gwynedd 7.0 (5.2 9.4)Conwy 7.4 (5.4 10.1)Denbighshire 6.8 (4.9 9.5)Flintshire 6.3 (4.9 8.2)Wrexham 8.5 (6.7 10.8)Source: NCCHD & AWPS
5.1.10 Neonatal mortality rate
The All Wales Perinatal Survey found (All Wales Perinatal Survey 2008): The Wales neonatal mortality rate in 2008 was 3.0 per 1,000 live
births; this is similar to the cumulative rate highlighted in Table 27. The North Wales neonatal mortality rate for 2008 was 3.3 per 1,000
live births.
Table 27 shows neonatal mortality rates for 2004-2008 in North Wales. Conwy has the highest neonatal mortality rate, 3.9 per 1,000 live births; this is not statistically significantly higher than other UA areas across North Wales or in comparison to all Wales rate (All Wales Perinatal Survey 2008).
Table 27: Neonatal mortality rate per 1,000 births, North Wales, 2004-2008
Rate per 1,000 births
95% CI
Wales 3.1 (2.8 3.3)Author: Siobhan Jones, Specialty Registrar in Public Health, Andrew Jones, DPH, BCU HB
Date: 06/07/11 Status: Final
Version: 1 Page: 48 of 87 Intended Audience:

Public Health Wales
North Wales 3.3 (2.8 3.9)Isle of Anglesey 3.2 (1.8 5.7)Gwynedd 3.1 (2.0 4.8)Conwy 3.9 (2.6 6.0)Denbighshire 2.8 (1.7 4.7)Flintshire 3.5 (2.5 5.0)Wrexham 3.2 (2.2 4.7)Source: NCCHD & AWPS
Table 28 shows the percentage distribution of causes of neonatal deaths. Immaturity due to premature birth can be seen to be the most common cause of neonatal death (Centre for Maternal and Child Enquiries 2009).
Table 28: Percentage distribution of causes of neonatal deaths, England, Wales and Northern Ireland, 2007
PercentageImmaturity 44.3Congenital malformation 24.7Death from intrapartum causes 10.7Infection 9.8Other specific causes 7.3Sudden infant death 1.8Unclassifiable 1.4Accident or non-intrapartum causes 0.09Source: CMACE 2009
5.1.11 Infant Mortality RateTable 29 shows infant mortality rates for 2004-2008 in North Wales. Conwy UA has the highest infant mortality rate, 5.4 per 1,000 live births; this is not statistically significantly higher than other UA areas across North Wales or in comparison to the all Wales rate (All Wales Perinatal Survey 2008).
Table 29: Infant mortality rate per 1,000 births, North Wales, 2004-2008
Rate per 1,000 births
95% CI
Wales 4.5 (4.2 4.8)North Wales 4.5 (3.9 5.3)Isle of Anglesey 4.9 (3.1 7.9)Author: Siobhan Jones, Specialty Registrar in Public Health, Andrew Jones, DPH, BCU HB
Date: 06/07/11 Status: Final
Version: 1 Page: 49 of 87 Intended Audience:

Public Health Wales
Gwynedd 4.5 (3.1 6.5)Conwy 5.4 (3.8 7.7)Denbighshire 4.4 (2.9 6.7)Flintshire 4.5 (3.3 6.1)Wrexham 3.8 (2.7 5.5)Source: NCCHD & AWPS
Table 30 shows the classification of deaths up to one year of age for North Wales. It shows that 40.5% of all infant deaths up to age one year were classified as conditions subsequent upon preterm birth (All Wales Perinatal Survey 2008).
Table 30: Clinico-Pathological Classification of deaths (after live birth) – deaths to one year of age, North Wales, 2004-2008
North Wales WalesNumbe
r% Number %
Congenital anomaly 36 22.1 145 19.6Intrapartum events 16 9.8 75 10.2Conditions consequent upon preterm birth 66 40.5 267 36.2Infection 14 8.6 74 10.0Specific conditions 11 6.7 54 7.3Accidental death 5 3.1 9 1.2Sudden unexplained death in infancy
11 6.7 91 12.3
Unclassifiable 4 2.5 23 3.1Total 163 738Source: NCCHD & AWPSData on neonatal deaths relate to the date of birth, while data on post neonatal deaths relate to the date of death in 2008
5.1.12 Low birth weight Low birth weight is often multi-factorial. Preterm birth and restriction of intrauterine fetal growth (Intrauterine Growth Retardation, IUGR) are important reasons why babies are born with a low birth weight (LBW) (Institute of Health Economics 2008).
Birth Weight has been described as,
“The single most important factor affecting neonatal mortality, in addition to being a significant determinant of post neonatal infant mortality and infant and childhood morbidity.” (McCormick 1985). In addition low birth weight may influence health in adulthood by increasing the risk of hypertension, ischaemic heart disease, stroke, metabolic syndrome, diabetes, malignancy, osteoarthritis and dementia (Institute of Health Economics 2008). Author: Siobhan Jones, Specialty Registrar in Public Health, Andrew Jones, DPH, BCU HB
Date: 06/07/11 Status: Final
Version: 1 Page: 50 of 87 Intended Audience:

Public Health Wales
In developed nations, the single most important factor that affects IUGR is cigarette smoking, followed by gestational nutrition and low pre pregnancy weight (Kramer 1987). There is good evidence that smoking cessation programmes can reduce the number of preterm births and low birth weight babies and produce an increase in mean birth weight (National Public Health Service 2007).
Figure 18 shows that the percentage of low birth weight births is smaller in North Wales (5.5%), compared to Wales as a whole (5.8%) but within North Wales, there are areas where the percentage of low birth weight babies is substantially higher. The highest percentage of low birth weight babies is seen in Conwy and Denbighshire, 6% and the lowest is in Gwynedd, 5% (Public Health Wales Observatory 2010).
There is considerable variation in the percentage of low birth weight babies across MSOAs within North Wales (Public Health Wales Observatory 2010).
Figure 18: Low birth weight in Betsi Cadwaladr University Health Board area, percentage of singleton live births, 1998-2007Produced by Public Health Wales Observatory, using data from ONS (ADBE, MYE)
Author: Siobhan Jones, Specialty Registrar in Public Health, Andrew Jones, DPH, BCU HB
Date: 06/07/11 Status: Final
Version: 1 Page: 51 of 87 Intended Audience:

Public Health Wales
Figure 19: Low birth weight, 1998-2007, all singleton live births, MSOAs North Wales
Author: Siobhan Jones, Specialty Registrar in Public Health, Andrew Jones, DPH, BCU HB
Date: 06/07/11 Status: Final
Version: 1 Page: 52 of 87 Intended Audience:
4.44.85.05.25.65.76.0
6.8
4.3009004007002008006001005003
MSO
A
Isle of Anglesey
I sle of Anglesey %LBW = 5.4
% low birth weight
4.64.74.95.05.15.3
6.06.8
7.5
3.63.53.4
3.64.24.24.44.5
016004013015002014017012005010007011009001008003006
MSO
A
Gwynedd
Gwynedd %LBW = 5.0
% low birth weight
5.05.25.35.56.06.36.56.77.07.17.27.3
4.74.4
2.9003008012011014015006004009002001005013007010
MSO
A
Conwy
Conwy %LBW = 6.0
% low birth weight
5.45.65.85.85.96.26.36.66.7
7.48.2
5.34.74.6
4.24.1013
012014002015007010016001008009011005003004006
MSO
A
Denbighshire
Denbighshire %LBW = 6.0
% low birth weight
4.74.74.84.95.15.25.45.45.65.75.85.8
7.48.1
4.64.3
4.24.13.83.7019
010018012011008002013003014006005016020001004017015009007
MSO
A
Flintshire
Flintshire %LBW = 5.3
% low birth weight
4.95.25.45.45.55.55.65.85.86.1
7.07.5
4.14.34.4
4.84.9
4.7
3.0018016001019008009007013006015003002017014011004012005010
MSO
A
Wrexham
Wrexham %LBW = 5.4
% low birth weight
494523530539549554564575576581585626656675
736941
Denbighshire EA SR = 611003008015001014016012013007009002010005011
006004
Denbighshire MSOA % with 95% confidence interval
4.34.44.85.05.25.65.76.0748
0.0 2.0 4.0 6.0 8.0 10.0 12.0
009004007002008006001005003
0.0 2.0 4.0 6.0 8.0 10.0 12.0
MSOALocal AuthorityWales (5.8%)Health Board (5.5%)
Isle of Anglesey

Public Health Wales
5.2 Women’s health and impacts on gynaecology services
Author: Siobhan Jones, Specialty Registrar in Public Health, Andrew Jones, DPH, BCU HB
Date: 06/07/11 Status: Final
Version: 1 Page: 53 of 87 Intended Audience:
MSOAs significantly higher than overall % for Waleslabel MSOA name annual avg % low birth weight
6 Denbighshire 006 7 8.25 Flintshire 007 6 8.14 Wrexham 010 9 7.53 Gwynedd 006 8 7.52 Flintshire 009 9 7.41 Denbighshire 004 9 7.4

Public Health Wales
There are many factors that impact on the use of gynaecology services. Preventable causes of ill health such as smoking and obesity are important known risk factors for some gynaecological cancers, and the latter for conditions such as prolapse (Gudrun and Fiander 2006, Hendrix et al 2002). Untreated sexually transmitted infections such as Chlamydia and Human Papillomavirus can have a direct influence on demand for gynaecology services (Joint Committee for Vaccines & Immunisations 2008, Welsh assembly Government 2008b).
5.2.1 Sexually Transmitted Infection (STI)Chlamydia is the most commonly diagnosed bacterial STI in the UK. Highest rates are seen in young people, especially men and women aged under 24 years (Public Health Wales 2010a).
Table 31 shows that following an increase in the number of uncomplicated Chlamydia infections in North Wales since 2002 (which may partly reflect the increased awareness and improved diagnostic techniques), numbers have been in decline since 2005 (Public Health Wales 2010a).
Table 31: Episodes of uncomplicated Chlamydia infection, North Wales, 2002-2008
2002 2003 2004 2005 2006 2007 2008North Wales 611 649 739 1,348 1,148 1,104 963Source: KC60 data
The consequences of Chlamydia infection on reproductive health is considerable as between 10% and 30% of untreated women (often asymptomatic) go on to develop pelvic inflammatory disease, an important cause of infertility (Welsh assembly Government 2008b).
5.2.2 Cervical screeningIn Wales the Cervical Screening Programme is a national programme managed by Public Health Wales. The most recent results relate to workload and performance for the financial year April 2007 to March 2008 (Public Health Wales 2010a).
The Cervical Screening Programme operates the call and recall system which covers the target population of women between the ages of 20 and 64 years. Screening is offered once every three years in Wales (Public Health Wales 2010a).
The target coverage in Wales is 80%. Cervical Screening Wales report that uptake of cervical screening is low and falling in the 20 to 24 age group. Coverage rates for North Wales UAs are shown in Table 32. The highest coverage in the last five years was recorded in Flintshire (77.5%) and the
Author: Siobhan Jones, Specialty Registrar in Public Health, Andrew Jones, DPH, BCU HB
Date: 06/07/11 Status: Final
Version: 1 Page: 54 of 87 Intended Audience:

Public Health Wales
lowest coverage recorded in Gwynedd (74.0%) (Public Health Wales 2010a).
Table 32: Cervical screening coverage of target age group (20 to 64 years), 2007-08
Percentage tested within theLast 3 years Last 5 years
Anglesey 64.7 75.8Conwy 66.0 75.7Denbighshire 65.3 75.9Flintshire 67.8 77.5Gwynedd 64.2 74.0Wrexham 66.4 76.4Wales* 65.5 75.5Source: Cervical Screening Wales*a small percentage of women could not be allocated to a UA area but are shown in the total for Wales
5.2.3 Cervical CancerCervical cancer is the second most common cancer affecting women worldwide. The lifetime risk of developing cervical cancer in the UK is estimated at 1 in 116 (Joint Committee for Vaccines & Immunisations 2008).
There are two peaks of incidence within the UK population, one in women aged 30 to 40 years and a second in women aged 60-80 years (It is thought the second peak occurs in women who are less likely to have participated in cervical screening) (Joint Committee for Vaccines & Immunisations 2008).
There is evidence that persistent ‘high risk’ Human Papillomavirus infection (HPV) has been identified in the majority of cases of cervical cancer (Joint Committee for Vaccines & Immunisations 2008). High parity, number of sexual partners, smoking and long term use of the oral contraceptive pill have also been identified as risk co factors with persistent, high risk, HPV infection in the development of cervical cancer (Bosch & Sanjose 2003).
The cervical cancer incidence of residents of North Wales is higher than the incidence for all Wales as shown in Figure 20.
Figure 20: Cervical cancer incidence, EASR per 100,000 population, North Wales 1998-2008
Source: WCISU
Author: Siobhan Jones, Specialty Registrar in Public Health, Andrew Jones, DPH, BCU HB
Date: 06/07/11 Status: Final
Version: 1 Page: 55 of 87 Intended Audience:

Public Health Wales
5.2.4 Human Papillomavirus (HPV)The prevalence of HPV infection is highest in women aged under 25 years and the risk of acquiring a HPV infection increases as the number of sexual partners increases (Baseman & Koutsky 2005). The majority of HPV infections are transient but some are persistent, for example, high risk HPV types 16 and 18; evidence suggests that these are important causal factors for the development of cervical cancer (Joint Committee for Vaccines & Immunisations 2008).
5.2.5 Human Papillomavirus (HPV) Vaccine UptakeAll girls and young women in Wales are currently offered a vaccination against two HPV virus types at ages 12 and 13 (school year eight). The results of the immunisation programme are shown in Table 33.
Within North Wales, Flintshire has the highest uptake of three doses of the HPV vaccination, 91.2% and Gwynedd has the lowest uptake, 83.7% (Public Health Wales 2010b).
Table 33: HPV Vaccine uptake in girls reaching their 14th birthday between 01/09/2009 and 31/08/2010 and resident on 01/08/2010
1 dose (%)
2 doses(%)
3 doses(%)
North Wales 89.6 89.0 87.2Anglesey 89.2 88.7 86.8Conwy 88.0 87.8 85.3Author: Siobhan Jones, Specialty Registrar in Public Health, Andrew Jones, DPH, BCU HB
Date: 06/07/11 Status: Final
Version: 1 Page: 56 of 87 Intended Audience:
0
2
4
6
8
10
12
14
16
1998 1999 2000 2001 2002 2003 2004 2005 2006 2007 2008
EASR
per
100
,000
North Wales Wales

Public Health Wales
Denbighshire 90.0 89.2 86.9Flintshire 93.0 92.8 91.2Gwynedd 86.1 85.3 83.7Wrexham 89.8 88.7 87.6Source: Public Health Wales
Cervical screening and the HPV vaccine are important preventative interventions, the uptake of which will have a direct influence on the demand for Gynaecology services.
Author: Siobhan Jones, Specialty Registrar in Public Health, Andrew Jones, DPH, BCU HB
Date: 06/07/11 Status: Final
Version: 1 Page: 57 of 87 Intended Audience:

Public Health Wales
5.3 Child health factors
5.3.1 Child MortalityThe Centre for Maternal and Child Enquiries (CMACE) review of child deaths in Northern Ireland, Wales and selected areas of England included children who died between the age of 28 days and 17 years and 364 days. The review found that 77% of all children who died had a pre existing medical condition, developmental delay, impairment or disability. The mortality rate varied by ethnicity, those children born to Pakistani or Black African origin families had a significantly higher mortality rate compared to those from a white family. This enquiry found that childhood mortality was more common among those in deprived circumstances. Figure 21 below highlights that more children die between the age of 5 and 14 years, but it is important to note that a substantial number of deaths occur in those aged less than 27 days which are not included in this enquiry (Centre for Maternal and Child Enquiries 2008).
Figure 21: Age distribution of all child deaths in the core dataset; United Kingdom selected regions: 2006
Source: Centre for Maternal and Child Enquiries 2008
Among school age children and adolescents there is a higher number of deaths in boys compared to girls (Centre for Maternal and Child Enquiries 2008). Table 34 shows the estimated death rate per 10,000 live children by region; children aged 28 days to 17 years and 364 days. There is no significant difference in child mortality rates between Wales and the other UK regions (Centre for Maternal and Child Enquiries 2008).
Author: Siobhan Jones, Specialty Registrar in Public Health, Andrew Jones, DPH, BCU HB
Date: 06/07/11 Status: Final
Version: 1 Page: 58 of 87 Intended Audience:
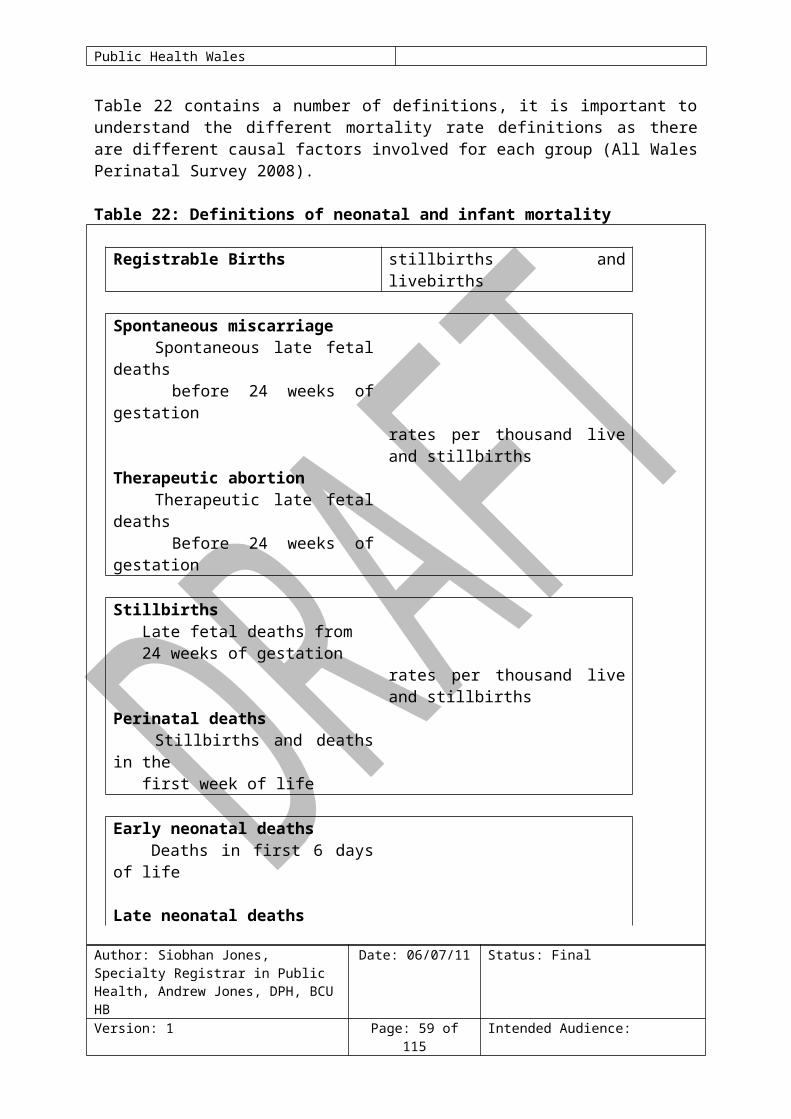
Public Health Wales
Table 34: Estimated mortality rates per 10,000 live children, UK region, 2006
Pearson 2008 from Centre for Maternal and Child Enquiries 2008
The most common cause of a non-natural death in children was found to be Road Traffic Accidents (RTA) including pedestrians and driver / car occupants. Boys outnumbered girls in RTA deaths, especially in the older age groups (Centre for Maternal and Child Enquiries 2008). Table 35 shows causes of non-natural deaths in children aged 28 days to 17 years
Table 35: Causes of non-natural deaths: Children aged 28 days – 17 years: United Kingdom selected regions: 2006Cause Number of
deathsPercentage
Road traffic accident 108 47Suicide 26 11Other 25 11Drowning 22 10Falls 16 7Fire 12 5Homicide 12 5Substance abuse 8 3Poisoning 0 0Total 229Source: Centre for Maternal and Child Enquiries 2008
Sudden Unexpected Deaths in Infancy (SUDI)The CMACE child death review found that 10% of all deaths in this review were classified as Sudden Unexpected Deaths in Infancy (SUDI), giving a rate of 0.5 per 1,000 live births. SUDI deaths were analysed separately to deaths classified as due to ‘natural causes’ (Centre for Maternal and Child Enquiries 2008).
In cases classified as SUDI (Centre for Maternal and Child Enquiries 2008): more cases were males than females;
Author: Siobhan Jones, Specialty Registrar in Public Health, Andrew Jones, DPH, BCU HB
Date: 06/07/11 Status: Final
Version: 1 Page: 59 of 87 Intended Audience:
Region Number of deaths
Estimated mid year population aged 28 days- 17
years and 364 days*Rate per 10,000 children
(95% confidence interval)North East England 154 536,150 2.87 (2.45, 3.36)South West England 228 1,057,538 2.16 (1.89, 2.45)West Midlands 301 1,205,119 2.50 (2.23, 2.80)Wales 163 640,235 2.55 (2.18, 2.97)Northern Ireland 111 432,806 2.56 (2.13, 3.09)Total 957 3,871,848 2.47 (2.32, 2.63)Source: Pearson 2008*Data provided by the ONS

Public Health Wales
the highest number of SUDI deaths were seen in those aged between four and eight weeks of age;
A quarter of deaths were in babies born less than 37 weeks gestation or weighing less than 2500g;
75% of cases of SUDI (where data was complete) reported that there was a smoker within the household.
5.3.2 Teenage Conceptions Table 36 shows data on conceptions and outcome data for 15 to 17 year olds in North Wales. This highlights that Wales has a higher rate of conceptions in females aged 15 to 17 years compared to England. In Wales there is a lower abortion rate within this population therefore the rate of maternities is further increased in comparison to England.
Table 36: Conceptions and outcomes, numbers and rates per 1,000 females aged 15 to 17 years, North Wales, 2008
Number
Rates per 1,000 women aged 15-17Total Maternities Abortions
England 38,783 40.5 20.4 20.1Wales 2,578 44.3 24.8 19.5Isle of Anglesey 58 41.5 16.4 25.0Gwynedd 82 38.1 20.0 18.1Conwy 93 43.4 21.9 21.5Denbighshire 95 48.6 26.6 22.0Flintshire 106 35.8 17.6 18.3Wrexham 116 46.9 27.1 19.8Source: ONS
Table 37 shows trends in conception rates for 15 to17 year olds in North Wales between 2001 and 2008.
Table 37: Conception rate per 1,000 females aged 15 to 17 years, 2001-2008 2001 2002 2003 2004 2005 2006 2007 2008Isle of Anglesey 36.0 34.8 34.0 32.5 31.1 40.9 36.8 41.5Gwynedd 44.1 47.0 34.6 38.0 40.5 43.3 49.3 38.1Conwy 38.3 41.5 53.4 49.3 49.4 52.6 40.2 43.4Denbighshire 37.3 40.8 42.8 50.5 44.7 42.6 49.8 48.6Flintshire 38.7 40.4 35.5 37.5 40.5 34.2 41.2 35.8Wrexham 40.6 44.9 55.8 62.2 62.5 58.8 43.9 46.9Wales 45.5 46.0 45.7 45.0 43.6 45.0 44.9 44.3
Source: ONS
There are around 100 conceptions to females aged 13 to 15 years each year in North Wales. This equates to a conception rate of 7.6 per 1,000 females aged 13 to 15 years. The rate for Wrexham is just above the average for Wales, 8.6 compared to 8.3 per 1,000 females aged 13 to 15 Author: Siobhan Jones, Specialty Registrar in Public Health, Andrew Jones, DPH, BCU HB
Date: 06/07/11 Status: Final
Version: 1 Page: 60 of 87 Intended Audience:

Public Health Wales
years. Conwy has the second highest rate in North Wales, 8.2 per 1,000; the Isle of Anglesey has the lowest rate, 4.8 per 1,000 females aged 13 to 15 years.
Table 38: Conception rate per 1,000 females aged 13 to 15 years, 2008
Number
Rates per 1,000 women aged 13-15Total Maternities Abortions
England 7,131 7.8 3.0 4.8Wales 455 8.3 3.5 4.7Isle of Anglesey 6 4.8 * *Gwynedd 15 6.8 * *Conwy 16 8.2 * *Denbighshire 12 6.5 * *Flintshire 16 5.7 * *Wrexham 20 8.6 3.0 5.6Source: ONS
It is important to note that for many teenagers, pregnancy is a positive life choice; however, for many it is unplanned and can be associated with negative health outcomes for both mother and baby (Welsh Assembly Government 2008b).
Table 39 shows some of the associated risks to maternal and child health from teenage pregnancy (Department of Health 2010, Welsh Assembly Government 2008b). It has been reported that teenage mothers and their children are at greater risk of suffering poor social, economic and health outcomes but there is limited evidence on the impact of teenage maternities on these outcomes over and above other prevailing factors associated with socioeconomic circumstance (Welsh Assembly Government 2008b).
Table 39: Teenage pregnancy and the associated risks to maternal and child health outcomes
Factors for the mother Factors for the childo 60% higher Infant Mortality Rate
compared to older mothers;o increased risk of babies having a
o Increased hospital admissions in childhood;
o generally poorer health;Author: Siobhan Jones, Specialty Registrar in Public Health, Andrew Jones, DPH, BCU HB
Date: 06/07/11 Status: Final
Version: 1 Page: 61 of 87 Intended Audience:

Public Health Wales
low birth weight;o increased risk of post natal
depression and other mental health issues;
o less likely to complete their education;
o increased risk of unemployment or being in low paid employment;
o poor housing conditions.
o poor housing conditions;o lower educational attainment;o lower rates of economic activity
in adult life;o twice as likely to be teenage
parents themselves.
Source: Department of Health 2010 & Welsh Assembly Government 2008b
5.3.3 Immunisation Immunisation is one of the most important ways of protecting individuals and the community from serious illness. It is the responsibility of BCU HB, in collaboration with its partners, to ensure adequate provision of immunisation cover to the local population. Children who miss immunisation for any reason remain without protection against serious childhood diseases (Public Health Wales 2010a).
The term “herd immunity” is used to describe a level of vaccination high enough to protect those who have not been vaccinated. As long as sufficient numbers of children are immunised against a specific disease, the protection can extend to everyone; it is normally set at 95% and above. Uptake of immunisations is affected by a number of factors including socio-economic factors, lay-beliefs about the procedure, media, religious and moral beliefs and advice received from health professionals (Public Health Wales 2010a).
The following groups have been identified as potentially increased risk of not being fully immunised (National Institute for Clinical Excellence 2009): those who have previously missed a vaccination (for whatever reason); looked after children; those with physical or learning disabilities; children of teenage parents; children of lone parents; those not registered with a GP; younger children from large families; children who are hospitalised or have a chronic illness; those from some minority ethnic groups; those from non English speaking families; vulnerable children (children of families that are: travelling families,
asylum seekers or are homeless).
Uptake figures for 2009/10 (financial year) for selected childhood immunisations are shown in Table 40.
Author: Siobhan Jones, Specialty Registrar in Public Health, Andrew Jones, DPH, BCU HB
Date: 06/07/11 Status: Final
Version: 1 Page: 62 of 87 Intended Audience:

Public Health Wales
Table 40: Uptake of selected immunisations in resident children reaching their 1st, 2nd and 5th birthday between 01/04/09 and 31/03/10
5 in 1(%)
MenC(%)
MMR1(%)
MMR2(%)
4 in 1 (%)
Wales 96.0 95.5 92.0 85.8 89.7North Wales 95.8 95.4 92.5 88.5 91.2Isle of Anglesey 97.6 97.4 94.0 90.6 93.3Gwynedd 96.2 95.1 93.1 88.4 93.4Conwy 93.8 93.9 89.6 86.5 87.8Denbighshire 95.3 95.0 91.8 84.8 88.0Flintshire 96.4 95.8 92.5 88.8 91.5Wrexham 95.9 95.4 93.8 90.8 92.4Source: COVER data
Figure 22 shows a map of the uptake of the 5 in 1 primary vaccination across Wales. Conwy is the only UA area in North Wales that is not achieving the 95% and over coverage rate.
Figure 22:
Author: Siobhan Jones, Specialty Registrar in Public Health, Andrew Jones, DPH, BCU HB
Date: 06/07/11 Status: Final
Version: 1 Page: 63 of 87 Intended Audience:

Public Health Wales
Figure 23 shows that Conwy is the only UA area in Wales that is not achieving an uptake rate of over 90%; for one dose of the MMR vaccine in children reaching two years of age.
Figure 23:
Author: Siobhan Jones, Specialty Registrar in Public Health, Andrew Jones, DPH, BCU HB
Date: 06/07/11 Status: Final
Version: 1 Page: 64 of 87 Intended Audience:

Public Health Wales
Immunisation is a cost effective intervention (Richardson 2009). Immunisation uptake rates of less than 95% can leave communities vulnerable to outbreaks of serious infectious diseases. Outbreaks of vaccine preventable disease put individuals at risk and require a large amount of health care resource to control and manage. Due to low uptake of the MMR vaccine, two outbreaks of measles have occurred recently in North Wales; data from the North Wales Health Protection Team show that,
In September / October 2008, in a well defined community in North East Wales with a history of poor immunisation uptake:
23 clinical diagnoses of measles were made, 17 were confirmed; 15 of the 17 confirmed cases had not received any MMR vaccine.
In February to May 2009, an outbreak occurred in Conwy: 51 cases were notified, 27 were tested and confirmed; The vast majority of notified cases (43) had not received any MMR
doses.5.3.4 InjuriesInjuries are a key cause of mortality and morbidity for children and young people. They account for a large proportion of health service attendances and admissions, are strongly linked to deprivation and are largely preventable (World Health Organisation 2008).
Author: Siobhan Jones, Specialty Registrar in Public Health, Andrew Jones, DPH, BCU HB
Date: 06/07/11 Status: Final
Version: 1 Page: 65 of 87 Intended Audience:
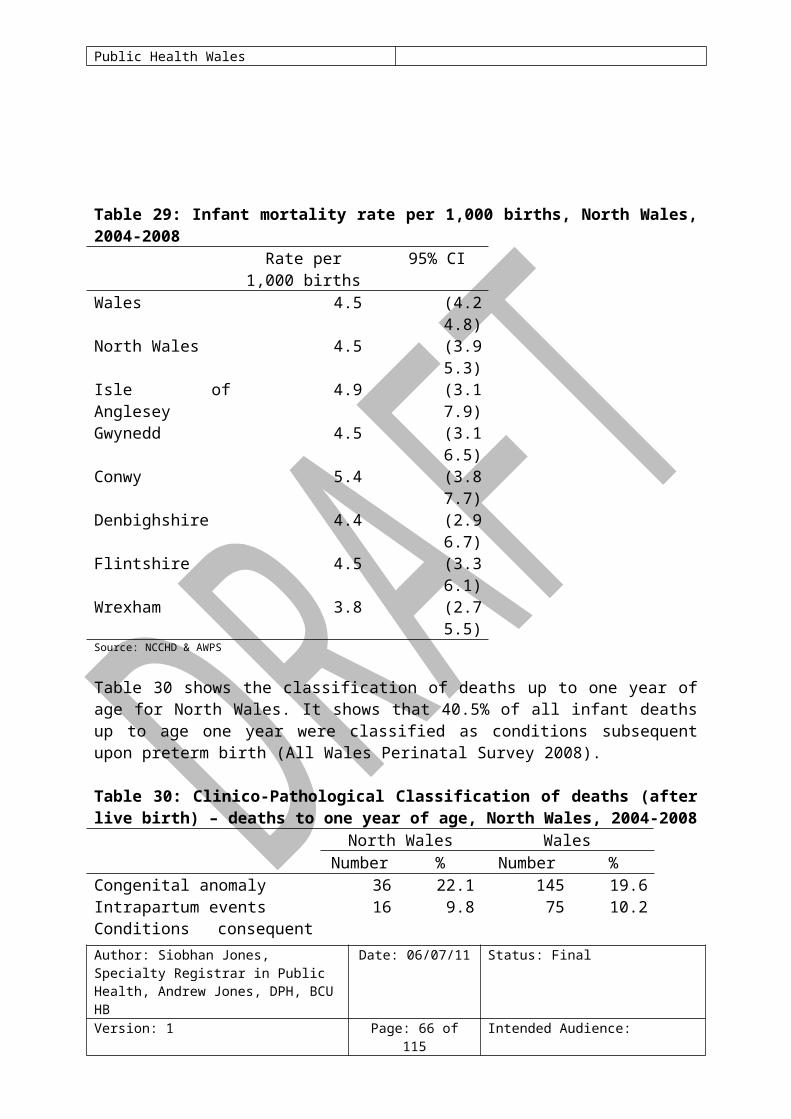
Public Health Wales
Figure 24 and Table 41 show the emergency admission rate for injury and poisoning among children and young people aged 0 to 18 years in Wales. Rates for Anglesey and Gwynedd are significantly higher than the average for Wales. The rate for Wrexham is significantly lower than the average for Wales.
Figure 24:
Author: Siobhan Jones, Specialty Registrar in Public Health, Andrew Jones, DPH, BCU HB
Date: 06/07/11 Status: Final
Version: 1 Page: 66 of 87 Intended Audience:
Wales EASR = 1550
0
500
1000
1500
2000
2500
3000
Pow
ys B
ridge
nd V
ale o
f Glam
orga
n C
arm
arth
ensh
ire C
ered
igion
Wre
xham
Mon
mou
thsh
ire C
ardi
ff F
lints
hire
Con
wy T
orfa
en C
aerp
hilly
New
port
Pem
brok
eshi
re B
laena
u Gw
ent
Nea
th P
ort T
albot
Den
bigh
shire
Gwy
nedd
Rho
ndda
Cyn
on T
aff Is
le of
Ang
lesey
Swa
nsea
Mer
thyr
Tyd
fil
Rate
per
100
,000
EASR Crude rate
Emergency admissions for injury & poisoning, European age-standardised rate (EASR) per 100,000, Local Authorities, all persons aged 0-18, 2008Produced by Public Health Wales Observatory using MYE (ONS), PEDW (HSW)
95% confidence interval for EASR

Public Health Wales
Table 41:
The most common type of injury resulting in accident and emergency attendances for the 0 to five year age group include poisoning/overdose, lacerations/wounds and scalds (National Public Health Service 2006b). Data relating to the location of injuries shows that:
most people are injured in the home; 0 to five age group are the highest risk of injury in the home; rates for road traffic injuries peak in the 15 to 24 age group; while rates for people injured in public places peak in the early teenage
years (National Public Health Service 2006b).
Author: Siobhan Jones, Specialty Registrar in Public Health, Andrew Jones, DPH, BCU HB
Date: 06/07/11 Status: Final
Version: 1 Page: 67 of 87 Intended Audience:
All rates shown are per 100,000 population
Health Board / Local Authority Count Crude
rate EASREASR 95% LCL
EASR 95% UCL
Compared to Wales
Isle of Anglesey 279 1850 1870 1660 2110 Sig. highGwynedd 449 1750 1780 1610 1950 Sig. highConwy 343 1450 1450 1300 1620 No sig. dif.Denbighshire 360 1680 1700 1520 1880 No sig. dif.Flintshire 499 1450 1440 1310 1570 No sig. dif.Wrexham 405 1350 1330 1200 1470 Sig. lowPowys 354 1230 1250 1120 1390 Sig. lowCeredigion 191 1290 1330 1140 1530 Sig. lowPembrokeshire 437 1610 1620 1470 1780 No sig. dif.Carmarthenshire 524 1310 1310 1200 1430 Sig. lowSwansea 954 1960 1970 1840 2100 Sig. highNeath Port Talbot 514 1680 1690 1540 1840 No sig. dif.Bridgend 387 1260 1250 1130 1380 Sig. lowThe Vale of Glamorgan 364 1220 1250 1130 1390 Sig. lowCardiff 1025 1410 1420 1340 1510 Sig. lowRhondda Cynon Taff 966 1780 1790 1680 1910 Sig. highMerthyr Tydfil 316 2390 2390 2140 2680 Sig. highCaerphilly 620 1500 1510 1400 1640 No sig. dif.Blaenau Gwent 269 1680 1660 1470 1880 No sig. dif.Torfaen 320 1500 1490 1330 1660 No sig. dif.Monmouthshire 282 1410 1390 1230 1560 No sig. dif.Newport 548 1580 1570 1440 1700 No sig. dif.Wales 10406 1540 1550 1520 1580
Produced by Public Health Wales Observatory using MYE (ONS), PEDW (HSW)
No sig. dif. = no significant difference
Emergency admissions for injury & poisoning, European age-standardised rate (EASR) per 100,000, Local Authorities, all persons aged 0-18, 2008

Public Health Wales
Figure 25 uses data from the All Wales Injury Surveillance System (AWISS) to show the main location were injuries are sustained, by age group (National Public Health Service 2006b).
Figure 25:
Since April 2009 a mandatory duty was placed on all hospitals in Wales with an Emergency department to collect and submit data to the Emergency Department Data Set (EDDS), this builds upon the All Wales Injury Surveillance System (AWISS). The EDDS collects an extensive data set not only as a means of injury surveillance and prevention, but also as a mechanism to aid the planning and evaluation of Emergency Department services (Lyons 2009).
The AWISS demonstrated a strong effect of access or distance to hospital on attendance rates, suggesting child attendance rates for those living within a mile of hospital are double those 10 miles away. This holds for all injuries with the exception of fractures. The reason for this is that many minor injuries can be ignored; self treated, or treated by other health professionals such as general practitioners and physiotherapists (Lyons 2006).
Figure 26 shows that during 2009, there were 1,738 road traffic casualties across North Wales of all severities, of which 20 were fatal; 301 serious; and 1,417 slight. The provisional child casualty figures for 0 to 15 year olds in North Wales in 2009 were less than five fatal; 39 serious; and 215 slight.Figure 26: All road traffic collisions in North Wales, 2009
Author: Siobhan Jones, Specialty Registrar in Public Health, Andrew Jones, DPH, BCU HB
Date: 06/07/11 Status: Final
Version: 1 Page: 68 of 87 Intended Audience:
Location of injuries, all persons, Wales: 2004Source: AWISS
0
20
40
60
80
100
120
0-4
5-9
10-1
4
15-1
9
20-2
4
25-2
9
30-3
4
35-3
9
40-4
4
45-4
9
50-5
4
55-5
9
60-6
4
65-6
9
70-7
4
75-7
9
80-8
4
85+
Rate
per
1,0
00 p
opul
atio
n
Home Road traffic incidents Public

Public Health Wales
Source: STATS 19 ‘Go Safe’ Road Casualty Partnership, North Wales, North Wales Police
Table 42 shows data for the number of road traffic collisions. In 2004, Flintshire had the highest road traffic collision rate in North Wales. Rates in Flintshire, Denbighshire, Conwy and Wrexham are above the rate for Wales (National Public Health Service 2006b).
Table 42: Road traffic collisions, numbers and rates per 100,000, all ages, North Wales, 2004
Number of collisions
Rate per 100,00
Wales 9,535 323.0 Isle of Anglesey 148 215.3 Gwynedd 377 319.3 Conwy 371 331.9 Denbighshire 311 325.2 Flintshire 567 377.8 Wrexham 422 324.1 Source: STATS 19 data
Caution should be exercised when interpreting STATS 19 data. STATS 19 data is not entirely complete or accurate. Comparing hospital data with the STATS 19 data shows that more people are injured in road traffic collisions attend hospital than are recorded by the Police. The STATS 19 classification of injuries between killed, serious and slight is problematic. The statistics on killed are very accurate, but the division between serious and slight is problematic (Lyons 2006).
Author: Siobhan Jones, Specialty Registrar in Public Health, Andrew Jones, DPH, BCU HB
Date: 06/07/11 Status: Final
Version: 1 Page: 69 of 87 Intended Audience:

Public Health Wales
5.3.5 BreastfeedingThere is evidence that breastfeeding can have a positive impact on the health of women and children both in the short and long term. The promotion of breastfeeding and an increase in breastfeeding rates can potentially reduce demand on health care services; interventions supporting women to breast feed have been shown to be a cost effective (National Institute for Clinical Excellence 2008). Research has shown that breastfeeding can (National Institute for Clinical Excellence 2008):
reduce risk of breast and ovarian cancer in mothers who breastfeed; aid weight reduction in breastfeeding mothers post partum; reduce gastrointestinal infections in infants; reduce respiratory infections in infants; reduce risk of child developing atopic dermatitis; potentially reduce the risk of children becoming obese.
Table 43 shows data on breastfeeding status at birth for North Wales. Conwy has the highest rate of breastfeeding at birth (60.1%); Flintshire has the lowest rate (46.3%). It should be noted that The Isle of Anglesey, Gwynedd, Wrexham and Flintshire have high numbers of cases where breastfeeding status has not been documented so accurate interpretation of the data is difficult.
Table 43: Breastfeeding status at birth, 2008Live
birthsBreastfeeding Not
breastfeedingBreastfeeding not
statedNumber % Number % Number %
North Wales 7,632 3,863 50.6 2,573 33.7 1,196 15.7Isle of Anglesey 720 394 54.7 229 31.8 97 13.5Gwynedd 1,251 603 48.2 301 24.1 347 27.7Conwy 1,118 672 60.1 377 33.7 69 6.2Denbighshire 1,065 579 54.4 423 39.7 63 5.9Flintshire 1,720 796 46.3 633 36.8 291 16.9Wrexham 1,758 819 46.6 610 34.7 329 18.7Source: STATS Wales
Data from the National Community Child Health Database (NCCHD) show that (Welsh Assembly Government 2006):
Geographic variation exists in breastfeeding rates, for example, rates recorded by NCCHD, are highest in Ceredigion and lowest in Blaenau Gwent.
Breastfeeding rates for low birth weight babies, babies of low gestational age at birth and multiple births are lower than average.
5.3.6 Childhood Physical & Learning Disabilities Author: Siobhan Jones, Specialty Registrar in Public Health, Andrew Jones, DPH, BCU HB
Date: 06/07/11 Status: Final
Version: 1 Page: 70 of 87 Intended Audience:

Public Health Wales
A study carried out during the 1980’s estimated that within Great Britain approximately 3% of children under the age of 15 experienced some form of significant disability, there is also evidence that a higher proportion of boys than girls are classified as having a disability (Public Health Wales 2010c).
Disability can be a consequence of many conditions, some associated with pregnancy and birth (congenital) and some from the post natal and childhood period (acquired). Premature births and low birth rate are both associated with conditions resulting in long term disability (Public Health Wales 2010c).
Tables 44 and 45 shows data compiled by Unitary Authority disability registers of children with physical / sensory disability and learning disability; the registration is voluntary with wide variation in reporting arrangements. It is therefore difficult to estimate the prevalence of disability for Children and Young people in North Wales and an accurate picture of childhood disability is difficult to ascertain (Public Health Wales 2010c).
Table 44: UA register of physically/sensory disabled persons aged 0 to 17 years, March 2010
Total severely
sight impaired
Total sight impaired
Total without visual
disability*
Without visual
disability-physical disability
only
All people with a
physical disability included
in the other
categories
North Wales 35 34 250 227 109Source: STATSWales*Total without visual disability includes physical disability only
Table 45: Register of children aged under 16 years with Learning Disabilities, total Placements 2009-2010
Total placements
North Wales 674
Source: STATSWales
Author: Siobhan Jones, Specialty Registrar in Public Health, Andrew Jones, DPH, BCU HB
Date: 06/07/11 Status: Final
Version: 1 Page: 71 of 87 Intended Audience:

Public Health Wales
Source: Welsh Assembly Government
5.3.7 Congenital AnomaliesCongenital anomalies are a major cause of child death and disability. The Welsh Congenital Anomaly Register (CARIS) has confirmed cases of congenital anomaly in about 4% of established pregnancies. Many children with congenital anomalies may experience mild or no disability, whilst others will be significantly affected. It is not possible to use CARIS data to estimate the prevalence of disability as it does not include measures of disability associated with congenital anomalies (Public Health Wales 2010c). Figure 27 shows the main anomaly groups for all cases reported to CARIS between 1998 and 2002.
Figure 27: Main anomaly groups for all cases reported to CARIS, 1998 to 2002
Author: Siobhan Jones, Specialty Registrar in Public Health, Andrew Jones, DPH, BCU HB
Date: 06/07/11 Status: Final
Version: 1 Page: 72 of 87 Intended Audience:

Public Health Wales
Source: Public Health Wales 2010c
5.3.8 Child protectionHealth professionals, in partnership with other agencies take on a vital role in supporting families in need. Early identification and prevention is a key part of child protection work.
Table 46 shows the number of children on child protection registers in North Wales. Wrexham has the highest rate of children on the register and Anglesey has the lowest.
The purpose of the register is (Local Government Data Unit 2010): to provide a record of all children in the area with unresolved child
protection issues and who are currently the subject of an inter-agency protection plan;
to ensure that the plans are reviewed every six months.
Registers do not reflect the full extent of child abuse because (Local Government Data Unit 2010):Author: Siobhan Jones, Specialty Registrar in Public Health, Andrew Jones, DPH, BCU HB
Date: 06/07/11 Status: Final
Version: 1 Page: 73 of 87 Intended Audience:
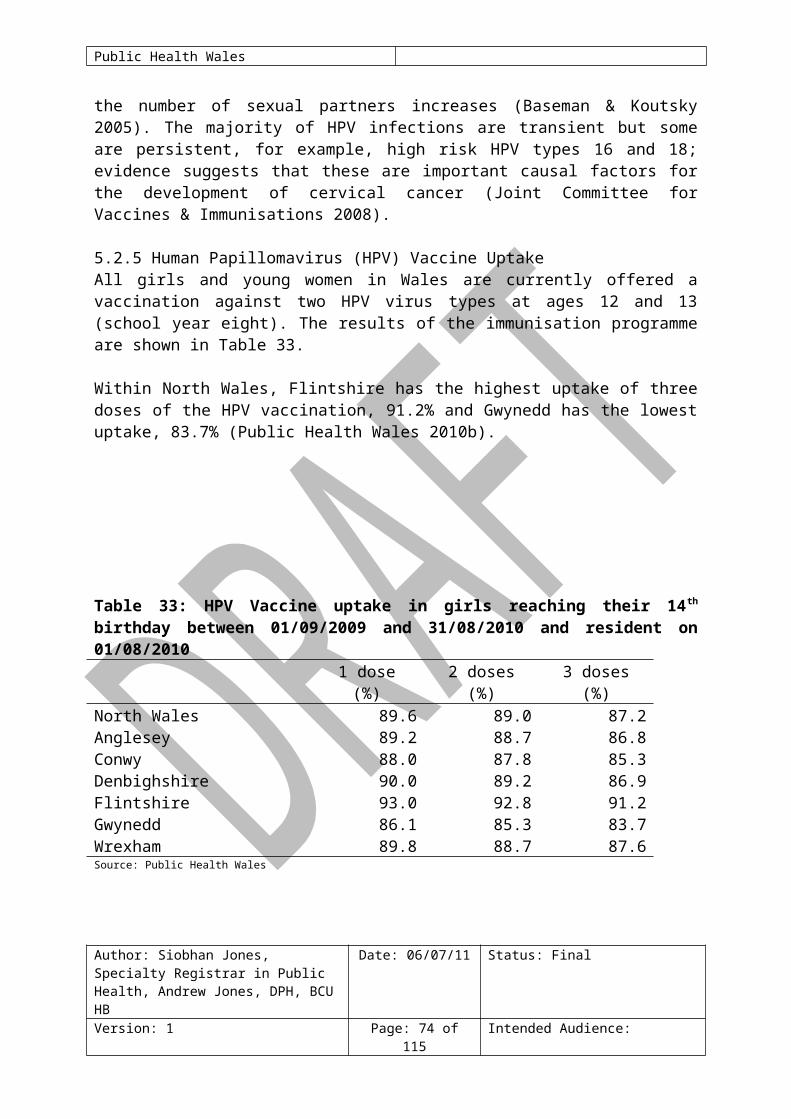
Public Health Wales
not every case of child abuse is reported; many child abuse referrals to Social Services Departments are
resolved without the need to enter the child on the register, for example, where the abuse is unsubstantiated, if the child is removed from home, or if the abuser leaves the household.
Table 46: Children on child protection registers, at 31st March 2009
Number of children on register (a)
Rate per 10,000 population aged under 18 years
Wales 2,510 40Isle of Anglesey 25 19Gwynedd 50 20Conwy 55 25Denbighshire 60 30Flintshire 75 24Wrexham 125 45Source: LGDU(a) Data rounded to the nearest five for disclosure reasons(b) ONS midyear estimates, 2008
AcknowledgmentsThe authors would like to acknowledge the invaluable contribution from staff in the Public Health Wales Observatory in the development of this report
6 ReferencesAcheson D. Sir 1998. Independent inquiry into inequalities in health report. Department of Health: London. Available at http://www.archive.official-documents.co.uk/document/doh/ih/ih.htm [accessed 13.7.10]
All Wales Perinatal Survey (AWPS) 2008. All Wales perinatal Survey: Annual report 2008. Department of Child Health: Cardiff University. Cardiff available at www.cf.ac.uk/medic/awps [accessed 28.07.10]
Baseman JG. Koutsky LA. 2005. The epidemiology of Human Papillomavirus infections. Journal of Clinical Virology 32S pp.S16-S24
Bosch FX. & de Sanjose S. 2003. Chapter 1: Human Papillomavirus and cervical cancer – burden and assessment of causality. Journal of the National Cancer Institute Monographs. No. 31 Oxford University press. Available at www.oxfordjournals.org [accessed 12.08.10]
Centre for Maternal and Child Enquiries (CMACE) 2007. Confidential Author: Siobhan Jones, Specialty Registrar in Public Health, Andrew Jones, DPH, BCU HB
Date: 06/07/11 Status: Final
Version: 1 Page: 74 of 87 Intended Audience:

Public Health Wales
enquiry into maternal and child health: Saving mothers lives reviewing maternal deaths to make motherhood safer 2003-2005. The seventh report of confidential enquires into maternal deaths in the United Kingdom. CMACE: London. Available at www.cmace.org.uk [accessed 27.07.10]
Centre for Maternal and Child Enquiries (CMACE) 2008. Why Children Die: A pilot study 2006; England (South West, North East, West Midlands, Wales and Northern Ireland. London: CEMACH. Available at http://www.cemach.org.uk/getattachment/9f63db7f-9ebd-4969-baa3-d04acf71201f/Why-Children-Die--A-pilot-study-(2006)-(May-2008).aspx
Centre for Maternal and Child Enquiries (CMACE) 2009. Perinatal Mortality report 2007. CMACE: London. Available at http://www.cmace.org.uk/getattachment/1d2c0ebc-d2aa-4131-98ed-56bf8269e529/Perinatal-Mortality-2007.aspx [accessed 27.07.10]
Centre for Maternal and Child Enquiries (CMACE) 2010. Perinatal Mortality report 2008. CMACE: London. Available at http://www.cmace.org.uk/getattachment/4a8ae5ec-3e24-469c-8aba-260c3db4a729/Perinatal-Mortality-2008.aspx [accessed 27.07.10]
Centre for Maternal and Child Enquires / Royal College of Obstetrics and Gynaecology (CMACE/RCOG) 2010. CMACE/RCOG joint guideline: Management of women with Obesity in pregnancy. CMACE: London. Available at http://www.cmace.org.uk/getdoc/1812417f-de48-4291-a58c-e85b87bc95fc/CMACE--RCOG-Joint-Guideline_Management-of-Women-wi.aspx [accessed 29.07.10]
Dahlgren G. & Whitehead M. Policies and Strategies to Promote Social Equality in Health. Stockholm, Institute of Further Studies.
Department for Transport 2010. Road accident casualties: a comparison of STATS 19 data with Hospital Episode Statistics. Available at http://www.dft.gov.uk/pgr/roadsafety/research/rsrr/theme5/roadaccidentscasualtiescomp.pdf [accessed 06.09.10]
Department of Health 2005. Health Survey for England. Available at http://www.dh.gov.uk/en/Publicationsandstatistics/PublishedSurvey/HealthSurveyForEngland/DH_632 [accessed 06.09.10]
Department of Health 2007. Implementation plan for reducing health inequality in infant mortality: A good practice guide. Review of the health inequality infant mortality PSA target. Department of Health, Department of Children, Schools and Families: London. Available at www.dh.gov.uk [accessed 27.07.10]
Department of Health 2010. Teenage pregnancy strategy: Beyond 2010. Department of Health: London. Available at http://publications.education.gov.uk/eOrderingDownload/00224-2010DOM-EN.pdf [accessed 08.07.10]
Author: Siobhan Jones, Specialty Registrar in Public Health, Andrew Jones, DPH, BCU HB
Date: 06/07/11 Status: Final
Version: 1 Page: 75 of 87 Intended Audience:

Public Health Wales
Department of Health, Social Service and Public Safety 2001. Accident and Emergency Survey Summary report. Price Waterhouse Coopers.
Department of Health. Department of children, schools and families 2009. Healthy children programme: Pregnancy and the first years of life. London: Department of Health and Department of children, schools and families. Available at www.dh.gov.uk/prod_consum_dh/groups/dh_digitalassets/documents/digitalasset/dh_108328.pdf [accessed 05.08.10]
Department of Trade and Industry Government 1999. Consumer safety research: Burns and scalds accidents in the home. DTI: London.
Dolman R. Gibbon R. Roberts C. 2007. Smoking in Wales: current facts. Cardiff: Wales Centre for Health. Available at http://www.wales.nhs.uk/sites3/Documents/568/WCH%20smoking%20ban%20report%20E%20final.pdf [accessed 06.09.10]
Galtier-Dereure F. Boegner C. Bring J 2000. Obesity and pregnancy: complication and cost. American Journal of Clinical Nutrition Vol 71, No 5, 12425-1248 May 2000.
Gartner A, Cosh H, Gibbon R, Lester N. 2009. A profile of alcohol and health in Wales. Cardiff: Wales Centre for Health. Available at http://www.wales.nhs.uk/sites3/Documents/568/Alcohol%20and%20Health%20in%20Wales%5FWebFinal%5FE.pdf[accessed 15.07.10]
Gudrun R. and Fiander A. 2006. ‘The effects of lifestyle factors on gynaecological cancer’. Best Practice and Research Clinical Obstetrics and Gynaecology. Vol.2 No. 2 pp. 227-251Guildea ZES. Fone DL. Dunstan FD. Sibert JR. Cartlidge PHT. 2001. Social deprivation and the causes of stillbirth and infant mortality. Archives of Disease in Childhood Vol.84 No.4 PP.307-10.
Hendrix S, L. Clark A. Nygaard I. Aragaki A. Barnabei V. McTiernan A. 2002. ‘Pelvic organ prolapse in the women’s health initiative: gravity and gravidity’. American Journal of Obstetrics and Gynaecology. Vol. 186 pp. 1160-1166.
Institute of Health Economics 2008. IHE Report Determinants and Prevention of Low Birth Weight: A synopsis of the evidence. Institute of Health Economics: Alberta, Canada. Available at http://www.ihe.ca/documents/IHE%20Report%20LowBirthWeight%20final.pdf [accessed 06.09.10]
Joint Committee for Vaccines and Immunisations (JCVI) 2008. Statement on Human Papillomavirus vaccines to protect against cervical cancer. Department of Health: London. Available at www.dh.gov.uk/ab/JCVI/DH_094744 [accessed 03.08.10]
Kramer M, S. 1987. Determinants of low birth weight: Methodological
Author: Siobhan Jones, Specialty Registrar in Public Health, Andrew Jones, DPH, BCU HB
Date: 06/07/11 Status: Final
Version: 1 Page: 76 of 87 Intended Audience:

Public Health Wales
assessment and meta analysis. Bulletin of World Health Organisation Vol. 65 No. 5 pp. 663-737. Available at http://www.ncbi.nlm.nih.gov/pmc/articles/PMC2491072/pdf/bullwho00076-0086.pdf [accessed 10.08.10]
Local Government Data Unit 2010.Local Authority Child Protection Registers Wales 2009. Available at: http://www.dataunitwales.gov.uk/Documents/Publications/bulletins/lgd01117_cpr_bulletin_2009_v1_eng.pdf [accessed 11.01.11]
Lyons R. 2006. Guide to the interpretation of injury data in Wales Version 2. University of Swansea. Available at http://www.capic.org.uk/documents/060830Guide_to_the_interpretation_of_injury_data(V2_1).pdf [accessed 06.09.10] Lyons R 2009 Emergency Department Data – All Wales Injury Surveillance Systems (AWISS) – 2009 update.
Manning D. Brewster B. Bundred P. 2005. Social deprivation and admission for neonatal care. Arch Dis Child Foetal Neonatal Ed vol.90 pp.F337-F338
McCormick MC. 1985. as cited in Kramer M, S. 1987. Determinants of low birth weight: Methodological assessment and meta analysis. Bulletin of World Health Organisation Vol. 65 No. 5 pp. 663-737. Available at http://www.ncbi.nlm.nih.gov/pmc/articles/PMC2491072/pdf/bullwho00076-0086.pdf [accessed 10.08.10]
McDonald S, D. Han Z. Mulla S. Beyene J. 2010. Overweight and obesity in mothers and risk of preterm birth and low birth weight infants: systematic review and meta-analyses. BMJ 2010;341:c3428. Available at http://www.bmj.com/content/341/bmj.c3428.full.pdf?sid=3c317729-e07d-47dc-90bd-fb89b290b224 [accessed 12/01/11]
National Institute for Clinical Excellence (NICE) 2008. Improving the nutrition of pregnant and breastfeeding mothers and children in low income households. NICE: London. Available at http://www.nice.org.uk/nicemedia/live/11943/40097/40097.pdf [accessed 05.08.10]
National Institute of Clinical Excellence (NICE) 2009. Reducing differences in the uptake of immunisations (including targeted vaccines) among children and young people aged under 19 years. NICE: London. Available at www.nice.org.uk [accessed 05.08.10]
National Public Health Service for Wales 2004. The health and social circumstances of children in Wales: a series of report to support the Children’s National Service Framework for Wales. Disabled children and young people. Available at http://www.wales.nhs.uk/sites3/page.cfm?orgId=719&pid=23566 [accessed 06.09.10]
National Public Health Service 2006a. Deprivation and Health. LHB Summary Reports. Available at Author: Siobhan Jones, Specialty Registrar in Public Health, Andrew Jones, DPH, BCU HB
Date: 06/07/11 Status: Final
Version: 1 Page: 77 of 87 Intended Audience:

Public Health Wales
http://howis.wales.nhs.uk/sitesplus/922/page/36988 [accessed 06.09.10]
National Public Health Service 2006b. Health Needs Assessment 2006: Injuries. Health Information Analysis Team. Available at http://howis.wales.nhs.uk/sitesplus/922/page/37238 [accessed 06.09.10]
National Public Health Service 2006c. Health Needs Assessment 2006: Children and Young People. Health Information Analysis Team. Available at http://howis.wales.nhs.uk/sitesplus/922/page/36977 [accessed 06.09.10]
National Public Health Service 2006d. Health Needs Assessment 2006: Substance Misuse. Health Information Analysis Team. Available at http://howis.wales.nhs.uk/sitesplus/922/page/37248 [accessed 10.01.11]
National Public Health Service & Wales Centre for Health 2009. Betsi Cadwaladr University Health Board: Demography Profile. Available at http://www.wales.nhs.uk/sitesplus/888/page/46690 [accessed 13.07.10]
Office of National Statistics (ONS) 2007. Health Statistics Quarterly 33: Teenage conceptions by small area deprivation in England and Wales, 2001-2002. Available www.ons.gov.uk [accessed 05.08.10]
Paranjothy S. Adappa R. Watkins JW. Lester N. Fone D. Dunstan F. Kotecha S. Socioeconomic deprivation, preterm birth and mortality. All Wales Perinatal Survey. Annual Report 2008. Available at: http://medicine.cf.ac.uk/media/filer_public/2010/02/11/awps_annual_report_2008.pdf [accessed 29.07.10]
Public Health Wales 2010a. Profile of North Wales. Public Health Wales.
Public Health Wales 2010b. Cover 95: Vaccine uptake in children in Wales April to June 2010. Available at http://howis.wales.nhs.uk/sites3/Documents/474/Cov10q2%20%28report95%29.pdf [accessed 20/10/10]
Public Health Wales 2010c. Disability in North Wales: a scoping project to inform the development of a Single Equality & Human Rights Scheme for Betsi Cadwaladr University Health Board. Public Health Wales.
Public Health Wales 2010d. Guide to middle super output areas(MSOAs). Public Health Wales. Available at http://howis.wales.nhs.uk/sitesplus/888/page/33798 [accessed 13/01/11]
Public Health Wales Observatory 2009. Lifestyle and Health: Wales and its health boards. Available at http://www2.nphs.wales.nhs.uk:8080/PubHObservatoryProjDocs.nsf/61c1e930f9121fd080256f2a004937ed/a1e8a36c3d05ab5c802576f5005054eb/$FILE/Lifestyle_Wales_Final_E.pdf [accessed 06.09.10]
Author: Siobhan Jones, Specialty Registrar in Public Health, Andrew Jones, DPH, BCU HB
Date: 06/07/11 Status: Final
Version: 1 Page: 78 of 87 Intended Audience:

Public Health Wales
Public Health Wales Observatory 2010. Health needs assessment support 2010: Key small area indicators. Betsi Cadwaladr University Health Board. Cardiff. Available at http://nww2.nphs.wales.nhs.uk:8080/PubHObservatoryProjDocs.nsf/85c50756737f79ac80256f2700534ea3/8e806a96c260082b8025775f00355647/$FILE/20100712_BetsiCadwaladr_HNA2010mapsChartsMSOA_HC_v2a.doc [accessed 14.10.10]
Reidpath DD. Allotey P. 2003. Infant mortality rate as an indicator of population health. J Epidemiol Community Health Vol.57 pp.344-346.
Richardson A. 2009. Investing in Public Health: A briefing paper for the Canterbury District Health Board. Available at http://www.cph.co.nz/Files/InvestingInPublicHealth.pdf [accessed 06.09.10]
Royal College of Obstetrics and Gynaecology (RCOG) 2006. Alcohol consumption and the outcomes of pregnancy. RCOG statement no. 5. RCOG: London 2006. Available at http://www.rcog.org.uk/files/rcog-corp/uploaded-files/RCOGStatement5AlcoholPregnancy2006.pdf [accessed 29.07.10]
Royal college of Physicians (RCP) 2010. Passive smoking and children: A report by the tobacco advisory group of the royal college of physicians. RCP: London. Available at www.rcplondon.ac.uk [accessed 22.07.10]
Shankaran S. Lester B, M. Das A. Bauer C, R. Bada H, S. Lagasse L. Higgins R. 2007. Impact of maternal substance use during pregnancy on childhood outcome. Seminars in Foetal and Neonatal Medicine. Vol. 12 PP. 143-150.
UNICEF 2001. A league table of child deaths by injury in rich nations. Available at http://www.unicef-irc.org/publications/pdf/repcard2e.pdf [accessed 13.01.11]
Welsh Assembly Government 2006, Breastfeeding Statistics, Wales 2004. Available at http://wales.gov.uk/docs/statistics/2006/060112sb1en.pdf [accessed 13.01.11]
Welsh Assembly Government 2008a. Local Authority Population Projections for Wales (2006-based) Local Authority Report. Welsh Assembly Government: Cardiff. Available at: http://wales.gov.uk/docs/statistics/2009/090925populationen.pdf [accessed 19.07.10]
Welsh Assembly Government 2008b. Children and young people’s well-being monitor for Wales. Welsh Assembly Government: Cardiff. Available at www.wales.gov.uk [accessed 27.07.10]
Welsh Assembly Government 2008c. Welsh Health Survey. Welsh Author: Siobhan Jones, Specialty Registrar in Public Health, Andrew Jones, DPH, BCU HB
Date: 06/07/11 Status: Final
Version: 1 Page: 79 of 87 Intended Audience:

Public Health Wales
Assembly Government: Cardiff. Available at http://wales.gov.uk/topics/statistics/headlines/health2009/hdw200905211/?lang=en [accessed 15.07.10]
Welsh Assembly Government 2010. Welsh Health Survey 2009. Available at: http://wales.gov.uk/docs/statistics/2010/100915healthsurvey09en.pdf [accessed 11.01.11]
World Health Organisation 2006. Young people’s health in Great Britain and Ireland: Health Behaviour in School Aged Children Survey 2005/06. Available at http://www.hbsc.org/downloads/YoungPeoplesHealth_GB&Ireland.pdf [accessed 06.09.10]
World Health Organisation 2008. European Report on Child Injury Prevention. WHO Regional Office for Europe. Available at http://www.who.int/violence_injury_prevention/child/injury/world_report/European_report.pdf [accessed 06.09.10]
World Health Organisation 2009. The European Health Report 2009 Health and Health systems. World Health Organisation: Denmark. Available at www.euro.who.int.org.uk [accessed 27.07.10]
Appendix One: Super Output AreaMiddle super output areas (MSOAs) were released by the Office for National Statistics (ONS) in 2004. In contrast with administrative boundaries such as electoral divisions (wards), super output areas were created for the purpose of showing statistical data.
MSOAs have a mean population of 7,500 and a minimum of 5,000. There are 413 MSOAs in Wales and 96 in the BCU area.
Lower super output areas (LSOAs) have a mean population of 1,500 and a minimum of 1,000. There are 1896 LSOAs in Wales.
Upper super output areas (USOAs) have a minimum population of 25,000
The ONS have stated that super output area geographies will be fixed for at least 10 years. The advantage of using these statistical geographies is stability and homogeneity. However, the main drawback is that they do not conform to known administrative boundaries such as electoral divisions (wards) (Public Health Wales 2010d).
Author: Siobhan Jones, Specialty Registrar in Public Health, Andrew Jones, DPH, BCU HB
Date: 06/07/11 Status: Final
Version: 1 Page: 80 of 87 Intended Audience:
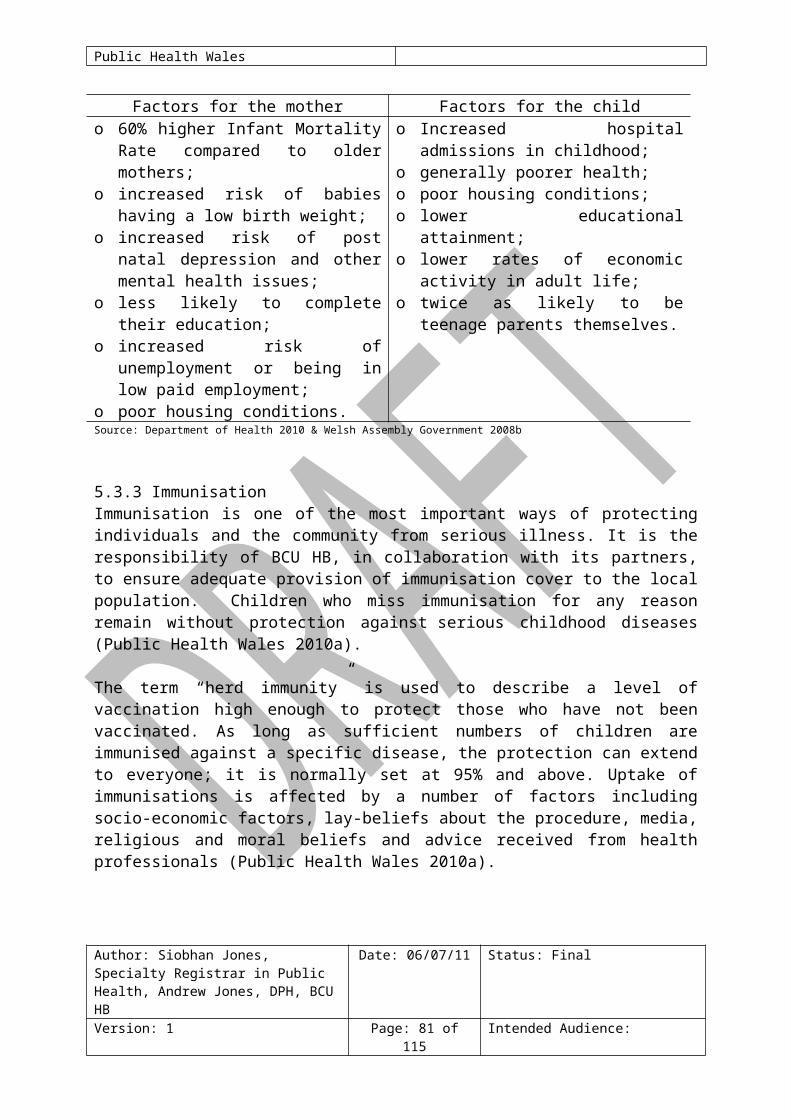
Public Health Wales
Appendix Two: North Wales Middle Super Output Areas (MSOA)/Electoral Divisions
Author: Siobhan Jones, Specialty Registrar in Public Health, Andrew Jones, DPH, BCU HB
Date: 06/07/11 Status: Final
Version: 1 Page: 81 of 87 Intended Audience:

Public Health Wales
Author: Siobhan Jones, Specialty Registrar in Public Health, Andrew Jones, DPH, BCU HB
Date: 06/07/11 Status: Final
Version: 1 Page: 82 of 87 Intended Audience:
Isle of AngelseyMSOA Electoral DivisionIsle of Anglesey 001 Amlwch Port
Amlwch RuralLlanbadrigLlannerch- y- meddMechell
Isle of Anglesey 002 BryntegLlanddyfnanLlaneilianMoelfre
Isle of Anglesey 003 Holyhead TownKingslandLondon RoadMaeshyfrydMorawelonPorthyfelin
Isle of Anglesey 004 LlanfaethluParc a'r MynyddTrearddurValley
Isle of Anglesey 005 BeaumarisCwm CadnantLlanbedrgochLlangoedPentraeth
Isle of Anglesey 006 BodfforddCefniCyngarTudur
Isle of Anglesey 007 AberffrawBryngwranLlanfair- yn- Neubwll
Isle of Anglesey 008 BraintCadnantGwyngyllTysilio
Isle of Anglesey 009 BodorganLlanfihangel YsceifiogLlanidanRhosyr

Public Health Wales
Author: Siobhan Jones, Specialty Registrar in Public Health, Andrew Jones, DPH, BCU HB
Date: 06/07/11 Status: Final
Version: 1 Page: 83 of 87 Intended Audience:
GwyneddMSOA Electoral DivisionGwynedd 001 Deiniol
HiraelMarchogMenai (Bangor)
Gwynedd 002 DewiGlyderHendreMarchogPentir*
Gwynedd 003 ArllechweddGerlanOgwenTregarth & Mynydd Llandygai
Gwynedd 004 BethelLlanrugY Felinheli
Gwynedd 005 DeiniolenLlanberisPenisarwaunPentir*
Gwynedd 006 CadnantMenai (Caernarfon)Peblig (Caernarfon)Seiont
Gwynedd 007 BontnewyddLlanwndaSeiontWaunfawr
Gwynedd 008 GroeslonLlanllyfniPenygroesTalysarn
Gwynedd 009 Bowydd & RhiwDifflwys & MaenofferenTeiglTrawsfynydd
Gwynedd 010 DolbenmaenPenrhyndeudraeth*Porthmadog EastPorthmadog WestPorthmadog Tremadog
Gwynedd 011 AbererchCricciethLlanaelhaearnLlanystumdwy
Gwynedd 012 Efail- newydd/BuanMorfa NefynNefynPwllheli NorthPwllheli South
Gwynedd 013 Dyffryn ArdudwyHarlechLlanbedrPenrhyndeudraeth*
Gwynedd 014 AberdaronBotwnnogLlanbedrogLlanengan
Gwynedd 015 BalaCorris/MawddwyLlandderfel
Gwynedd 016 AbermawBrithdir & Llanfachreth/Ganllwyd/LlanelltydDolgellau NorthDolgellau South
Gwynedd 017 AberdoveyBryn- crug/LlanfihangelLlangelyninTywyn
* split between more than one MSOA

Public Health Wales
Author: Siobhan Jones, Specialty Registrar in Public Health, Andrew Jones, DPH, BCU HB
Date: 06/07/11 Status: Final
Version: 1 Page: 84 of 87 Intended Audience:
ConwyMSOA Electoral DivisionConwy 001 Craig- y- Don*
GogarthMostyn*Tudno*
Conwy 002 Craig- y- Don*Mostyn*Tudno*
Conwy 003 Llandrillo yn Rhos*Penrhyn
Conwy 004 Llandrillo yn Rhos*Conwy 005 Kinmel Bay
TowynConwy 006 Deganwy
MarlConwy 007 Eirias*
Glyn*Rhiw*
Conwy 008 Eirias*Glyn*Rhiw*
Conwy 009 ColwynLlanddulasLlysfaen
Conwy 010 Abergele PensarnGelePentre Mawr
Conwy 011 LlansanffraidMochdrePensarn
Conwy 012 CaerhunConwy
Conwy 013 BrynCapeluloPandyPant- yr- afon/Penmaenan
Conwy 014 Betws yn RhosLlangernywLlansannanUwchled
Conwy 015 Betws- y- CoedCrwstEglwysbachGowerTrefriwUwch Conwy
* split between more than one MSOA

Public Health Wales
Author: Siobhan Jones, Specialty Registrar in Public Health, Andrew Jones, DPH, BCU HB
Date: 06/07/11 Status: Final
Version: 1 Page: 85 of 87 Intended Audience:
DenbighshireMSOA Electoral DivisionDenbighshire 001 Prestatyn NorthDenbighshire 002 Prestatyn Central*
Prestatyn EastDenbighshire 003 Prestatyn Central*
Prestatyn South WestDenbighshire 004 Rhyl East
Rhyl WestDenbighshire 005 Rhyl South East*Denbighshire 006 Rhyl South WestDenbighshire 007 Rhyl South
Rhyl South East*Denbighshire 008 Dyserth
Prestatyn MelidenTremeirchion
Denbighshire 009 BodelwyddanRhuddlan
Denbighshire 010 St Asaph EastSt Asaph WestTrefnant
Denbighshire 011 Denbigh CentralDenbigh Upper/Henllan
Denbighshire 012 Denbigh Lower Llanrhaeadr- yng- Nghinmeirch
Denbighshire 013 Llanarmon- yn- Ial/LlandeglaLlanbedr Dyffryn Clwyd/LlangynhafalLlandyrnog
Denbighshire 014 RuthinDenbighshire 015 Corwen
EfenechtydLlanfair Dyffryn Clwyd/Gwyddelwern
Denbighshire 016 Corwen LlandrilloLlangollen
* split between more than one MSOA
Public Health Wales
Author: Siobhan Jones, Specialty Registrar in Public Health, Andrew Jones, DPH, BCU HB
Date: 06/07/11 Status: Final
Version: 1 Page: 86 of 87 Intended Audience:
FlintshireMSOA Electoral DivisionFlintshire 001 Ffynnongroyw
GronantTrelawnyd & Gwaenysgor
Flintshire 002 Holywell WestMostynWhitford
Flintshire 003 Bagillt EastBagillt WestGreenfieldHolywell CentralHolywell East
Flintshire 004 Flint CastleFlint Coleshill*Flint Oakenholt
Flintshire 005 Flint Coleshill*Flint Trelawny
Flintshire 006 BrynfordCaerwysCilcainHalkyn
Flintshire 007 Connah's Quay CentralConnah's Quay Golftyn*
Flintshire 008 Connah's Quay Golftyn*Connah's Quay SouthConnah's Quay Wepre
Flintshire 009 SealandShotton EastShotton HigherShotton West
Flintshire 010 AstonConnah's Quay SouthNorthop Hall
Flintshire 011 MancotQueensferry
Flintshire 012 Buckley MountainNorthop
Flintshire 013 AstonBuckley Pentrobin*EwloeHawarden
Flintshire 014 ArgoedBuckley Bistre West*New Brighton
Flintshire 015 Broughton North EastBroughton SouthSaltney Mold J unctionSaltney Stonebridge
Flintshire 016 Mold BroncoedMold EastMold SouthMold West
Flintshire 017 Buckley Bistre EastBuckley Bistre West*Buckley Pentrobin*
Flintshire 018 Higher KinnertonPenyffordd
Flintshire 019 GwernaffieldGwernymynyddLeeswoodTreuddyn
Flintshire 020 CaergwrleHopeLlanfynydd
*split between more than one MSOA

Public Health Wales
Author: Siobhan Jones, Specialty Registrar in Public Health, Andrew Jones, DPH, BCU HB
Date: 06/07/11 Status: Final
Version: 1 Page: 87 of 87 Intended Audience:
WrexhamMSOA Electoral DivisionWrexham 001 Holt
Llay*Rossett
Wrexham 002 Gresford East & WestMarford & Hoseley
Wrexham 003 Gwersyllt East & SouthLlay*
Wrexham 004 Gwersyllt NorthGwersyllt West
Wrexham 005 Bryn CefnGwenfroNew Broughton
Wrexham 006 BrymboCoedpoeth
Wrexham 007 Borras ParkRhosnesni
Wrexham 008 Garden VillageGrosvenorLittle ActonStansty
Wrexham 009 ActonMaesydre
Wrexham 010 CartrefleQueenswayWynnstay
Wrexham 011 BrynyffynnonErddigOffa
Wrexham 012 HermitageSmithfieldWhitegate
Wrexham 013 MineraPenycaePenycae & Ruabon South*
Wrexham 014 EsclushamJ ohnstown*Ponciau*
Wrexham 015 J ohnstown*PantPonciau*
Wrexham 016 MarchwielPenycae & Ruabon South*Ruabon
Wrexham 017 CefnLlangollen RuralPlas Madoc
Wrexham 018 BroningtonOverton
Wrexham 019 Dyffryn Ceiriog/Ceiriog ValleyChirk NorthChirk South
* split between more than one MSOA