nhsn evaluating entered data - centers for disease control ...new alert - began in july 2014...
TRANSCRIPT

Lindsey Weiner , MPH
Evaluating Entered Data for Completeness, Consistency and Accuracy
National Center for Emerging and Zoonotic Infectious Diseases
Division of Healthcare Quality Promotion
NHSN Training Course
February 19, 2015

Outline
Discuss the importance of data quality
Demonstrate the use of NHSN Analysis Options to
review quality of reported data
Review NHSN Alerts and how they impact your data
Discuss reasons data may be excluded from SIRs
Helpful troubleshooting steps for SIRs
Tips for investigating HAI data posted on Hospital
Compare

The Importance of Data Quality
Data entered into NHSN are used for national,
aggregate analyses published in CDC annual reports
*May also be used by your state health department or your
hospital’s corporation
In order for risk adjustment to be applied correctly,
data must be reported accurately and collected
according to NHSN protocols. Includes:
Annual surveys
Denominator/Summary data
Events
Important to regularly check and confirm data accuracy
Inaccurately reported data will result in incorrect SIRs
posted to Hospital Compare!
*using the NHSN Group function. Contingent on accepting rights template.

Annual Surveys
Completed at the beginning of every year, due March 1st
Variables from the hospital survey are used for risk
adjustment:
Total bed size
Medical School Affiliation/Teaching status
Ensure accuracy!! Review and edit your survey if needed
If survey data are incorrect, your SIRs will not be properly
adjusted
May also impact the rate benchmark for certain locations
Annual Survey Instructions:
Hospital -http://www.cdc.gov/nhsn/forms/instr/57_103-TOI.pdf
Long term Acute Care-http://www.cdc.gov/nhsn/forms/instr/TOI-57.150-LTAC.pdf
Rehab-http://www.cdc.gov/nhsn/forms/instr/TOI-57.151-IRF.pdf

Data Comparison, C.difficile SIR 240 beds vs. 270 beds
Number of beds = 270
Number expected = 36.004
SIR = 0.805
Number of beds = 240
Number expected = 26.410
SIR = 1.098

Where to Find Survey Data in NHSN Analysis
Survey line list options are available in Advanced >
Facility-level Data > CDC Defined Output
Separate line list options for each facility type and
time period
Groups (e.g., QIOs, State Health Depts.)

ALERTS

General Alerts Guidance
Alerts were created to ensure accurate and complete data
entry in accordance with NHSN protocols
An alert indicates incomplete or missing data Rates and SIRs only calculated for “complete” months of data
with no outstanding alerts
Appear on the Home Page for each user
Alerts are generated for in-plan data only
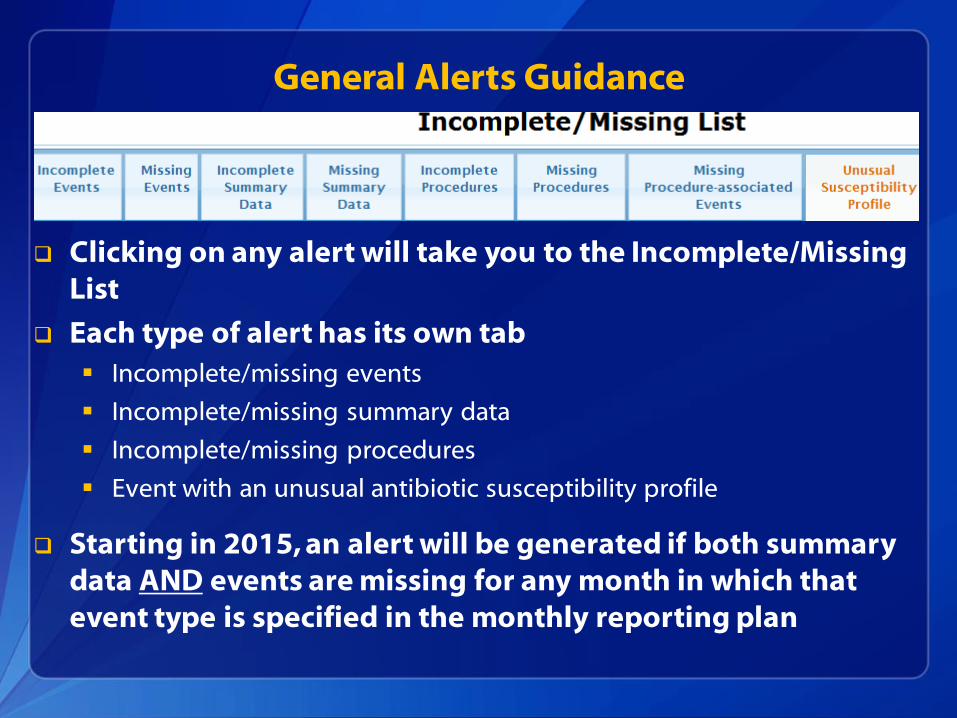
General Alerts Guidance
Clicking on any alert will take you to the Incomplete/Missing
List
Each type of alert has its own tab
Incomplete/missing events
Incomplete/missing summary data
Incomplete/missing procedures
Event with an unusual antibiotic susceptibility profile
Starting in 2015, an alert will be generated if both summary
data AND events are missing for any month in which that
event type is specified in the monthly reporting plan

Missing Events
You will see this alert for:
Months in which surveillance of the device-associated or MDRO/CDI
modules were indicated in the monthly reporting plan, but no events
have been entered
Months in which CLIP is listed on the monthly reporting plan, but no
CLIP events have been reported
Until the alert is cleared, data for this
month/location/event will be excluded from rate and SIR
calculations
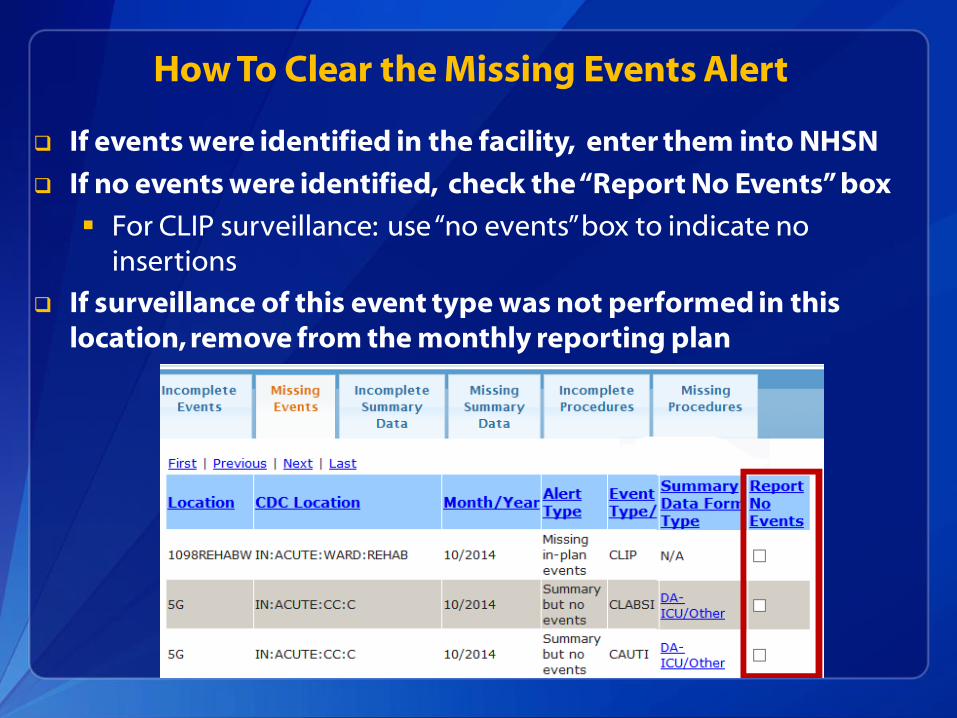
How To Clear the Missing Events Alert
If events were identified in the facility, enter them into NHSN
If no events were identified, check the “Report No Events” box
For CLIP surveillance: use “no events” box to indicate no
insertions
If surveillance of this event type was not performed in this
location, remove from the monthly reporting plan

Groups Can View a Facility’s Completion of Alerts Using the Summary Data Line List
Can be used to review denominator data for each
facility/month/location
This is the only analysis report that includes “No Event”
variables for device-associated and LabID monthly data
Available in Advanced Summary-level Data CDC Defined Output
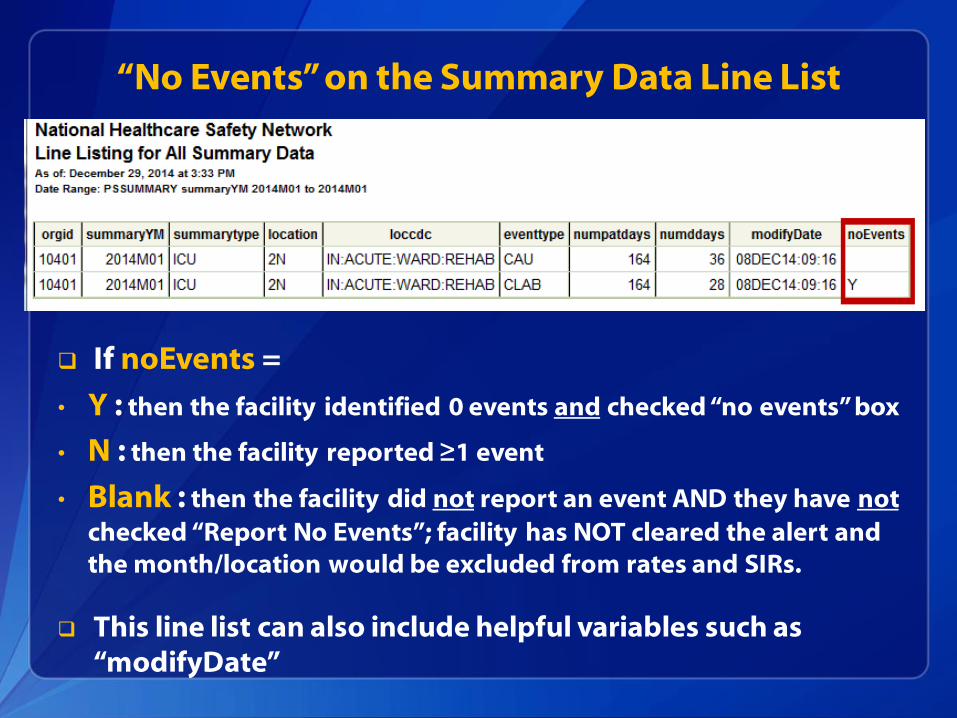
“No Events” on the Summary Data Line List
If noEvents =
• Y : then the facility identified 0 events and checked “no events” box
• N : then the facility reported ≥1 event
• Blank : then the facility did not report an event AND they have not
checked “Report No Events”; facility has NOT cleared the alert and
the month/location would be excluded from rates and SIRs.
This line list can also include helpful variables such as
“modifyDate”

Alert for an Unusual Susceptibility Profile
New alert - began in July 2014
Highlights reporting of an epidemiological significant
pathogen, prompts infection control interventions and
assists with data cleaning
User will be notified when unusual susceptibility
profiles are entered into NHSN for in-plan events
Will be notified immediately after saving the event

Unusual Susceptibility Profiles
Carbapenem resistant Enterobacteriaceae
Carbapenem intermediate or resistant Acinetobacter baumannii ,
Pseudomonas aeruginosa
Highly Drug Resistant * Enterobacteriaceae , Pseudomonas aeruginosa,
Acinetobacter baumannii
Colistin/Polymyxin B resistant Acinetobacter baumannii, Pseudomonas
aeruginosa
Daptomycin non-susceptible and Linezolid resistant Enterococcus spp.
Vancomycin resistant Staphylococcus aureus (VRSA)
Daptomycin non-susceptible and Linezolid resistant and Vancomycin
intermediate Staphylococcus aureus
Vancomycin resistant Staphylococcus, coagulase negative (VRSE)
*all defined drug classes have at least one drug within the class reported as either Intermediate (I)
or Resistant (R)

Unusual Susceptibility Profile Alert
Upon saving an event, a
pop-up window will identify
the profile
Click details to view the
more information about this
specific alert
The user can confirm the
data entry and
susceptibility reporting are
accurate (confirm) or update
data entry (cancel)
Click OK to acknowledge
the alert and save the record
without immediately
confirming the result

Unusual Susceptibility Profile Alert
Clicking OK will generate an alert on the Home Screen
Alert will appear until the profile is confirmed or
amended such that the definition is no longer met

Analysis of Unusual Susceptibility Profiles
Analysis options are available that track all unusual
susceptibility alerts in a facility that have been confirmed
or are pending confirmation
Applies to 2014 data and forward
Groups can also run these reports

More Guidance on Unusual Susceptibility Alerts
http://www.cdc.gov/nhsn/PDFs/USP-Alert-current.pdf

SURGICAL SITE INFECTION SIR

Evaluating your SSI SIR
Surgical Site Infections
Ensure procedure and infection counts are accurate
Certain procedures are excluded from the SIR calculations
(missing variables or outlier values)
SSI is excluded from the SIR if the corresponding procedure
is excluded

Excluded Procedures
If you notice a discrepancy in procedure count, scroll to
the bottom of the SSI SIR output
Table included in the output shows number of excluded
procedures and any associated SSIs
Note: This table will only include procedures that were excluded
due to the exclusion criteria listed in 2010 NHSN Newsletter*
Related to potential data quality issues
*http://www.cdc.gov/nhsn/PDFs/Newsletters/NHSN_NL_OCT_2010SE_final.pdf

Why Were Procedures Excluded from the SIR?
Possible data quality reasons for exclusion include:
Patient age > 109
Procedure duration < 5 minutes or > IQR5 (i.e. extremely long
duration defined as greater than 5 times the IQR above the 75th
percentile)
Missing one or more of the required risk factors
Additional criteria that apply to procedures prior to 2014
Should be rare, therefore list of excluded procedures
should be short
Complete list of exclusion criteria, including cut-offs
for extremely long procedure duration, can be found
here (see Appendix C): http://www.cdc.gov/nhsn/PDFs/Newsletters/NHSN_NL_OCT_2010
SE_final.pdf

Run a Line List of Excluded Procedures
NHSN provides a line
listing of all
procedures that have
been excluded from
the SIRs for the
reasons listed on the
previous slide
Limit the line list to
the procedure code(s)
and time period of
interest
Add important
variables based on
the procedure
category

Example of Line List of Excluded Procedures
In our example, 1 HPRO procedure was excluded from the 2014 SIR
Line list shows procedure duration was extreme outlier
HPRO cut-off procedure duration = 380 minutes
If this is a data entry error:
Edit the procedure record and click Save
Generate datasets prior to running any analysis reports
If not a data entry error, procedure will still be excluded from the
SIR
Note: procedures that are excluded from the SIR should still be reported to
NHSN

Additional Procedure Exclusions
Starting in 2014, procedures that were reported with a
closure technique of “other than primary” will be
excluded from all SSI SIRs
Run a procedure line list (Advanced > Procedure-level
Data) to review procedure-specific details

Other Excluded Procedures from the SSI SIR
Which SSI SIR output are you using?
Different models will include different procedures and SSIs
SSI Model SSIs and Procedures Included
All SSI SIR Model
Superficial, Deep & Organ/Space SSIs
Superficial & Deep incisional SSIs limited to primary only
SSIs identified on admission, readmission & via post-discharge surveillance
Complex A/R SSI Model
Only Deep incisional primary & Organ/Space SSIs
Only SSIs identified on Admission/Readmission to facility where procedure
was performed
Only inpatient procedures
Complex 30-day SSI model (used for CMS IPPS)
Only Deep incisional primary & Organ/Space SSIs that occurred within 30
days of the procedure
Only in-plan, inpatient COLO & HYST procedures in adult patients (i.e., ≥ 18
years of age)
Uses age and ASA to determine risk

Excluded Events from the SIR
All SSI SIRs will exclude superficial incisional secondary
(SIS) and deep incisional secondary (DIS) SSIs
If SSI event count is less than you’re expecting, keep in
mind which model you are using
Example: Complex A/R and Complex 30-day models will NOT include
superficial incisional primary infections (i.e., specific Event = “SIP”)
Run an SSI event line list to determine reason for any
excluded events
If a procedure is excluded from the SIR, any associated
SSI will also be excluded

Other Ways to Troubleshoot SSI SIR
Make sure you have generated datasets after any data
entry or import
If applicable, review monthly reporting plans
Ensure procedure categories are listed
Resolve all outstanding “Alerts” on your home screen
Example: If you had no SSI events for procedures performed during a
month, you must check the No Events box for that procedure and
month
Review footnotes beneath the SIR output

CLABSI and CAUTI SIRs

CLABSI SIR for Acute Care Hospitals
Look at all variables in the SIR output carefully
If central line days or infection count is lower than you
expect, look at the location-specific SIR table
SIR may not include all of your locations!

Excluded Locations from the CLABSI/CAUTI SIR
Current SIRs for acute care hospitals can only be
generated for locations that had enough data to be
included in the CLABSI and CAUTI baseline analyses*
CLABSI: 2006-2008
CAUTI: 2009
Certain locations will always be excluded from the SIRs,
under current baselines, including:
Telemetry wards, mixed acuity locations, acute stroke ward, burn
ward, certain oncology wards, etc.
Review Rate Tables for these locations to track HAI incidence
We expect to include more locations when we re-
baseline the SIRs (using 2015 data)
*Baseline data can be found here: http://www.cdc.gov/nhsn/dataStat.html

Separate tables in the CLABSI and CAUTI SIR output will
show the data from excluded locations, as well as any
months with 0 or missing device days
Months with missing denominator data are excluded from the SIR

MRSA Bacteremia and CDI LabID Event SIR

LabID Event SIR
Look at all variables in the SIR output
3 months of data for each quarter
Review number of events and number of patient days for accuracy
Review footnotes beneath the SIR table

LabID Event SIR may not be Calculated
Outlier Prevalence Rate
Number of predicted infections and the SIR (and
statistics) cannot be calculated if community-onset
prevalence rate* is above pre-determined threshold
MRSA Bacteremia: 0.88
C.difficile: 1.78
If all other reporting requirements are met per CMS
guidelines, these data are still considered “complete”
and will be sent to CMS
* Community–onset prevalence rate = (# community-onset LabID events / number admissions ) * 100

Outlier Prevalence Rate
Check accuracy of # admissions and # community-
onset events

C. difficile SIR may not be Calculated
Missing CDI Test Type
Last month of each quarter, enter C.difficile laboratory
test type on summary data entry screen
March, June, September, December
Until test type is entered, the CDI SIR cannot be
calculated for that quarter

Example of Missing CDI Test Type: 2014 Q4
Facility has entered summary data for October and
November 2014 and has not yet completed data entry
for December
CDI test type is asked on the 3rd month of each quarter
(e.g., December)
No data will appear in the CDI SIR table for Q4
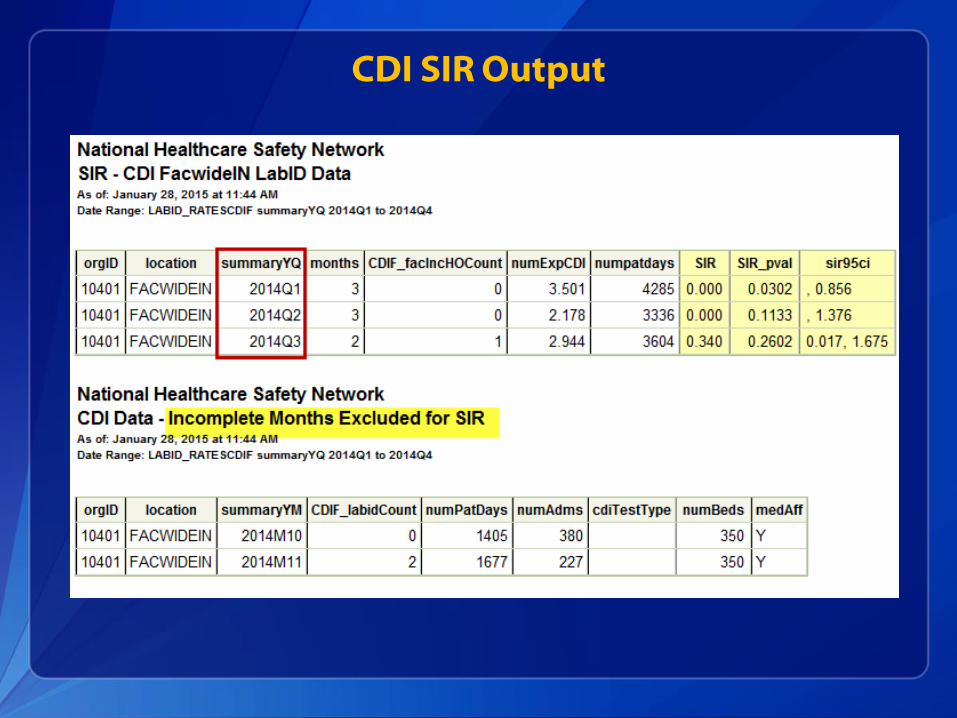
CDI SIR Output

Example of Missing CDI Test Type: 2014 Q4
October and November are listed in the “Incomplete
Months” data table
Once December summary data are entered, and the CDI
test type has been selected for this quarter, an SIR will
be calculated for Q4

Reminder: Which Events are Counted in the FacWideIN LabID SIR Numerator (i.e., # observed)
MRSA Bacteremia: Only hospital-onset (HO) events from
blood specimens are included in the numerator of the SIR
C.difficile : Only hospital-onset (HO) incident events are
included in the numerator of the SIR
If a patient has a second LabID event from the same
organism within 14 days of the first, the second event is not
counted in the SIR
Starting in 2015, LabID event SIRs will exclude data from
IRFs and IPFs with separate CCNs
Run a line list to determine which events are counted in the
SIRs

LabID Event Line List: New “Indicator Variables”
Starting in January 2015, new variables are included in
the MRSA and CDI line lists that identify cases counted
in the SIR
MRSA Bacteremia: C. difficile :
FWMRSA_bldIncCount FWCDIF_facIncHOCount
Variable will display as 1 or 0 for each event
1: event is counted in the SIR
0: event is NOT counted in the SIR
These new variables included in the line list output by
default

Example: C.difficile Line List
Important: modify the line list to only include inpatients

Indicator Variables
By default, you will see 2 indicator variables
Facility-wide incidence (SIR)
Admission prevalence rate (used in risk adjustment)

TIPS FOR INVESTIGATING HOSPITAL COMPARE DATA

Reasons for Discrepancies between NHSN and Hospital Compare
Any changes made to your data in NHSN after a
quarterly deadline will not be reflected on Hospital
Compare (or preview reports)
Preview reports will reflect the data that were entered
by the deadline
NHSN analysis options will always reflect the data that
are currently entered (including the CMS Reports
within NHSN analysis options)

Reasons for Discrepancies BetweenNHSN and Hospital Compare
1. Changes, additions, modifications made to the following:
Monthly reporting plans
Denominator data
Events (changes made to variables such as event date, patient age,
location, etc. could result in changes to your CMS-related data)
Alerts
2. Survey changes for risk adjustment variables
Bed size, teaching status
CDI test type (2013 data and prior)
Bottom line: keep a record of changes made to data after
each quarter’s deadline and keep a hard copy of NHSN
output from deadline

How to Investigate Discrepancies
How can I tell when my data were last modified?
1. Run a line list for reporting plans, events, summary
data, and/or procedures for the data of interest
2. Add “modifyDate” variable to these line lists

Line List Variables
Remove unnecessary variables
Make sure “modifyDate” is a selected variable

Example of 2014 Reporting Plan Line List
Hospital has 2014 monthly reporting plans for
FacWideIN surveillance in January, February, and March
Plans were initially completed on January 21st but later
modified on August 16th
Line lists cannot tell you what specifically was modified

Helpful Hints for CMS Quality Reporting
Run CMS Reports in NHSN Analysis before each
quarterly deadline to view data that will be sent to CMS
Save/print these reports for future reference!!!
Give yourself enough time to enter and review data
before quarterly deadlines
When performing data quality checks, be sure to
review your annual survey for accuracy
Keep track of changes made to your data

Use NHSN Resources to Prepare for CMS Deadlines
Resources available for all facility types include:
Operational Guidance
Helpful Tips (checklists)
How to read and interpret CMS analysis reports in NHSN
How to set up your facility, report no events, etc.
http://www.cdc.gov/nhsn/cms/index.html


More Help with Analysis
Analysis Resource Page:
http://www.cdc.gov/nhsn/PS-Analysis-resources/index.html
Quick Reference Guides on each analysis output:
http://www.cdc.gov/nhsn/PS-Analysis-resources/reference-
guides.html
SIR Troubleshooting Guides
Provides guidance on common problems you may experience
with your DA, SSI, and LabID Event SIRs
• Missing numerator counts
• Missing denominator counts
• Missing locations
• SIR not calculated

For more information please contact Centers for Disease Control and Prevention
1600 Clifton Road NE, Atlanta, GA 30333
Telephone, 1-800-CDC-INFO (232-4636)/TTY: 1-888-232-6348
E-mail: [email protected] Web: www.cdc.gov
The findings and conclusions in this report are those of the authors and do not necessarily represent the official
position of the Centers for Disease Control and Prevention.
Thank you!
National Center for Emerging and Zoonotic Infectious Diseases
Division of Healthcare Quality Promotion