nhtsa.govnhtsa.gov/sites/nhtsa.dot.gov/files/812280_fieldstudyheavy-vehiclecas.pdf · disclaimer ....
TRANSCRIPT

DOT HS 812 280 June 2016
Field Study of Heavy-Vehicle Crash Avoidance Systems Final Report

DISCLAIMER
This publication is distributed by the U.S. Department of Transportation, National Highway Traffic Safety Administration, in the interest of information exchange. The opinions, findings, and conclusions expressed in this publication are those of the authors and not necessarily those of the Department of Transportation or the National Highway Traffic Safety Administration. The United States Government assumes no liability for its contents or use thereof. If trade names, manufacturers’ names, or specific products are mentioned, it is because they are considered essential to the object of the publication and should not be construed as an endorsement. The United States Government does not endorse products or manufacturers.
Suggested APA Format Citation: Grove, K., Atwood, J., Hill, P., Fitch, G., Blanco, M., Guo, F., … & Richards, T. (2016, June).
Field study of heavy-vehicle crash avoidance systems. (Final report. Report No. DOT HS 812 280). Washington, DC: National Highway Traffic Safety Administration.

i
REPORT DOCUMENTATION PAGE Form Approved OMB No. 0704-0188
1. AGENCY USE ONLY (Leave blank)
2. REPORT DATE June 2016
3. REPORT TYPE AND DATES COVERED Final Report Sept. 2012 – Jan. 2016
4. TITLE AND SUBTITLE Field Study of Heavy-Vehicle Crash Avoidance Systems
5. FUNDING NUMBERS
6. AUTHORS Kevin Grove, Jon Atwood, Pete Hill, Greg Fitch, Myra Blanco, Feng Guo, Sheldon Russell, Matthew Marchese, Paul Bartholomew, & Trevor Richards 7. PERFORMING ORGANIZATION NAME(S) AND ADDRESS(ES) Virginia Tech Transportation Institute Center for Automated Vehicle Systems 3500 Transportation Research Plaza (0536) Blacksburg, VA 24061
8. PERFORMING ORGANIZATION REPORT NUMBER
9. SPONSORING/MONITORING AGENCY NAME(S) AND ADDRESS(ES) National Highway Traffic Safety Administration 1200 New Jersey Avenue SE. Washington, DC 20590
10. SPONSORING/MONITORING AGENCY REPORT NUMBER DOT HS 812 280
11. SUPPLEMENTARY NOTES The Contracting Officer's Technical Representative was Alrik Svenson. 12a. DISTRIBUTION/AVAILABILITY STATEMENT This document is available to the public through the National Technical Information Service, www.ntis.gov.
12b. DISTRIBUTION CODE
13. ABSTRACT (Maximum 200 words) In 2013 there were 3,964 people killed and an estimated 95,000 people injured in crashes involving large trucks. In order to reduce crashes many trucks are currently equipped with crash avoidance systems (CASs), which alert drivers to impending conflicts with objects and initiate automatic emergency braking (AEB). A total of 169 drivers operating 150 CAS-equipped trucks from seven trucking companies across the country participated in a 1-year field operational test, which included video and vehicle data to study CASs in a naturalistic environment. In over 3 million miles of data, no rear-end crashes of the type CASs are designed to prevent were identified. A total of 6,000 CAS activations were sampled and analyzed to evaluate their reliability. A high-priority activation was most likely to occur when the driver needed to take action. Lower priority activations were generally advisory and did not require immediate driver response. Fleet safety managers reported that they would recommend CAS technology. While the CAS user experience can be improved, and some activation types were found to be less reliable than others, the results from this study suggest that the overall systems work as intended. 14. SUBJECT TERMS Active safety systems, collision mitigation braking, commercial motor vehicle, crash avoidance, Intelligent Transportation Systems, tractor trailer
15. NUMBER OF PAGES
147
16. PRICE CODE
17. SECURITY CLASSIFICATION OF REPORT Unclassified
18. SECURITY CLASSIFICATION OF THIS PAGE Unclassified
19. SECURITY CLASSIFICATION OF ABSTRACT
20. LIMITATION OF ABSTRACT

ii
EXECUTIVE SUMMARY
In 2013 there were 3,964 people killed and an estimated 95,000 people injured in crashes involving large trucks (NHTSA, 2015). Collision avoidance systems (CASs) have been developed to both warn drivers of impending crashes and to mitigate crash impact. This study investigated the performance of CASs currently in use in the trucking industry. A total of 169 drivers operating 150 Class 8 tractor-trailers from seven trucking companies across the United States were recruited for a 1-year field operational test. The trucks drove revenue-producing routes and were equipped with either the Meritor WABCO OnGuard or the Bendix Wingman Advanced CAS system. A new miniature data acquisition system (MiniDAS) was developed by the Virginia Tech Transportation Institute to collect continuous video of the forward roadway, video of the driver’s face, CAS activations, and vehicle network data whenever the trucks were in motion. About 85,000 hours of driving and 885,000 CAS activations were collected across all activation types.
From this data 6,000 CAS activations were sampled, including all automatic emergency braking (AEB) events and all impact alerts (IAs). In order to estimate system reliability these samples were analyzed to determine whether a valid object triggered the activation and required a crash avoidance maneuver, whether a valid object triggered the activation but did not require a crash avoidance maneuver, and whether an invalid object triggered the activation. These categories were named “Activation Prior to Safety-Critical Event (SCE),” “Advisory Activation,” and “False Activation,”1 respectively. The two brands of CAS technology included in the study were generally kept separate in the analyses. They are referred to as Company A and Company B when reporting any results, with the labels A and B consistently assigned to the same company throughout. The data was used to address five research objectives related to CAS technology, discussed below.
Objective 1: Evaluate the Reliability of Collision Avoidance System Technology
It was determined that AEB, the highest priority CAS activation, had the highest percentage of activations prior to an SCE (31% for Company A, 60% for Company B). There were also advisory AEB activations (68% for Company A, 13% for Company B), as well as false AEB activations (0.4% for Company A, 27% for Company B) observed in the data. It should be noted that the false AEB activations were, on average, shorter (0.1 seconds for Company A, 0.29 seconds for Company B) and less forceful (no deceleration for Company A, 0.15g deceleration for Company B) than AEB activations that occurred prior to an SCE. Nevertheless, the false AEB activations suggest that potential improvements could be made in how CASs detect threats.
IAs had the second highest percentage of occurrences prior to an SCE across all the activation types (9% for Company A and 15% for Company B). However, IAs were most likely to be advisory in nature (87% for Company A and 70% for Company B). False IAs were also observed (4% for Company A, 15% for Company B).
1 The NHTSA Office of Defects Investigation (ODI) was made aware of the cases of CAS false activations occurring during the course of the field study Instrumented and video data from the study were made available for further investigation as needed by ODI.

iii
Following distance alerts (FDAs), the lowest priority CAS activation, were almost entirely advisory in nature (97% for Company A, 99% for Company B). Very few false FDAs were observed. While these activations may not indicate imminent crashes, they may be useful to safety managers as an indicator of a driver’s usual following distance.
Stationary object alerts (SOAs) were mostly false (98% for Company A, 97% for Company B). These were often caused by overhead objects or objects in a curve. This finding suggests that these scenarios could be included in CAS test procedures to help determine whether new CAS technologies can differentiate impending threats from the roadway infrastructure.
Lane departure warning (LDW) activations were mostly advisory (76% for Company A, 65% for Company B) and were generated during intentional lane departures without turn signal use. LDW activations could have a dual benefit of alerting drivers to unintentional lane departures and notifying safety managers of compliance issues with turn signal usage.
Overall, the results suggest that the highest priority activations tend to go off in the most urgent situations, which may help the driver respond appropriately. Lower priority activations tend to be advisory, and may be useful for drivers in adjusting their general behavior, rather than in reacting to specific situations. False activations were observed across all types of activations, which could be addressed in future generations of the technology.
Objective 2: Assess Driving Performance over Time
The rates at which drivers received activations were analyzed to assess rates of frequency and whether drivers adapted their driving performance with the CASs over time. The rates of CAS activations drivers experienced were not found to change meaningfully over time. Drivers received AEB activations and IAs, on average, less than once per 11 hours. Drivers received SOAs, on average, less than 2.5 times per 11 hours. The most frequent activations drivers received were FDAs (7.2 per hour for Company A and 4.29 per hour for Company B) and LDWs (2.44 per hour for Company A and 14.48 per hour for Company B). The activation rates were not found to change meaningfully over time. One potential unintended consequence of these activations rates is that frequent activations may disrupt team driving operations.
Objective 3: Assess Overall Driving Behavior
The naturalistic data were analyzed to investigate whether drivers’ average speed, headway, brake reaction times (BRT) to AEB activations and IAs, and maximum decelerations in response to AEB activations and IAs changed over time. Analyses were performed for driving that took place above 55 mph to assess highway driving performance. Overall, drivers averaged a 2.8-second headway at highway speeds, and a 2.4-second headway at highway speeds with ACC excluded. In both cases, average headway decreased by 0.2 seconds over the first 20 weeks of participation, and returned to the original value over the next 20 weeks of participation. Drivers were not found to adapt their average highway speeds (63.4 mph for Company A, 62.2 mph for Company B), average BRTs (0.52 s in response to AEB activations, 0.85 s in response to IAs), or average maximum decelerations (0.28g in response to AEBs, 0.15g in response to IAs) over time. These latter results include manual driving and ACC use together.

iv
Objective 4: Provide Data on Real-World Conflicts
CAS activations prior to SCEs were most likely to occur in medium traffic density conditions (Level of Service B – Level of Service E). LDWs were most likely to occur in low-traffic density conditions (Level of Service A – Level of Service B). Drivers were likely to be looking at the forward roadway when activations were generated prior to an SCE (97% of AEB activations, 95% of IAs, and 100% of FDAs generated prior to an SCE). AEB activations prior to an SCE were likely to have at least one prior CAS activation of equal or lower priority (99%), while advisory activations generally had fewer prior CAS activations of equal or lower priority. CAS activations generated prior to an SCE were most likely a result of lead vehicle (LV) actions, such as braking, turning, switching lanes, or merging. This finding is corroborated by research that found 78 percent of light-vehicle and heavy-vehicle conflicts are instigated by light vehicles around the heavy vehicle (Hanowski, Hickman, Wierwille, & Keisler, 2007). In contrast, advisory forward CAS activations were most likely to be a result of subject vehicle (SV) actions, such as passing, changing lanes, or following too closely.
Objective 5: Generate Inputs for a Safety-Benefits Simulation Model
Distributions of drivers’ speeds and headways at the onset of AEB activations and IAs were reported. These data can be used in safety benefit models to estimate the percentage of crashes that could be avoided had trucks been equipped with the CAS technology. It was found that drivers were already braking at the onset of many non-false AEB and IA activations. As such, safety benefit models may need to consider faster response times when modeling driver performance with AEB. Furthermore, drivers did not respond to every non-false AEB and IA activation. As such, BRT and deceleration distributions were only computed for the cases in which drivers did respond to the AEB or IA activations. The decelerations of drivers who pressed the brake pedal prior to the AEB or IA activation were also reported in order that this behavior could be accounted for in the models.

v
ACRONYMS
ABS anti-lock braking system ACC adaptive cruise control AEB automatic emergency braking ATC automatic traction control BRT brake reaction time CAS collision avoidance system CDL commercial driver’s license CMV commercial motor vehicle CRC crash-relevant conflict ESC electronic stability control FDA following distance alert FCW forward collision warning FMCSA Federal Motor Carrier Safety Administration GPS global positioning system IA impact alert IRB institutional review board LDW lane departure warning LLDW left lane departure warning LTL less-than-truckload LV lead vehicle MiniDAS Miniature Data Acquisition System NC near-crash NHTSA National Highway Traffic Safety Administration PE precipitating event PGN parameter group number RLDW right lane departure warning RSC roll stability control SCE safety-critical event SD secure digital (card) S.E. standard error SOA stationary object alert SPN suspect parameter number SV subject vehicle TL truckload VTTI Virginia Tech Transportation Institute

vi
DEFINITIONS
Advisory Activation An activation that is a non-conflict. A crash-avoidance maneuver is not required prior to these activations.
Automatic Emergency Braking (AEB) Activation
The highest priority CAS activation. The system applies up to two thirds the braking power of the vehicle without driver intervention. This is accompanied by an audiovisual alert to the driver.
Alert Prior to Safety-Critical Event (SCE)
A forward CAS activation that is followed by a crash, near-crash, or crash-relevant conflict. For example, an activation when an LV performs a rapid, hard deceleration.
Alert in Response to Unintentional Lane
Departure
An LDW activation generated after the driver appears to unintentionally depart the lane. For example, an activation generated after drifting over a lane marking when looking away from the road.
Collision Avoidance System (CAS)
Activations
The set of all possible activations or interventions based on the forward radar. This includes AEB activations and FCW activations (IA, FDA, and SOA). LDWs are not included in this set.
False CAS Activation A non-conflict CAS activation in which the sensors do not appear to be tracking valid objects, or appear to be tracking objects outside the lane of the vehicle.
False LDW A non-conflict LDW alert in which the sensors do not appear to be tracking a valid lane marking.
Following Distance Alert (FDA)
The lowest priority CAS activation. The driver is presented with an audiovisual cue that headway to a lead vehicle is closing. These alerts can be programmed to different settings. OnGuard has one level of FDA, while Wingman Advanced has three separate levels with progressive audiovisual cues for each level.
Forward Collision Warning (FCW)
A set of forward radar activations, which include IAs, FDAs, and SOAs. AEB activations and LDWs are not included in this set.
Impact Alert (IA) The second highest priority CAS activation. The system presents a more urgent audiovisual alert to the driver compared to FDAs. OnGuard has an IA plus haptic warning in addition to the audiovisual IA.
Lane Departure Warning (LDW)
Left and right side audio alerts based on a windshield camera separate from the forward radar. They are evaluated separately from other CAS activations (AEB activations and FCW alerts).
Non-conflict An event that is not prior to a crash, a near-crash, or a crash-relevant conflict, or preceded by an unintentional lane departure.
Safety-Critical Event (SCE)
An event in which a crash, near-crash, crash-relevant conflict, or unintentional lane departure is observed.
Stationary Object Alert (SOA)
A CAS activation that specifically alerts drivers to stationary objects. The driver is presented with an audiovisual cue similar to an impact alert, with a different image used for the visual display.

vii
TABLE OF CONTENTS
EXECUTIVE SUMMARY ......................................................................................................................................... ii
LIST OF TABLES ...................................................................................................................................................... ix
LIST OF FIGURES .................................................................................................................................................... xi
INTRODUCTION .................................................................................................................................................... xiv BACKGROUND ............................................................................................................................................. xiv
COLLISION AVOIDANCE SYSTEMS ......................................................................................................... xiv
RESEARCH OBJECTIVES ............................................................................................................................ xvi
CHAPTER 1. METHODS .......................................................................................................................................... 1
PILOT TESTING ............................................................................................................................................... 1 Data Acquisition System........................................................................................................................... 1
RECRUITMENT ................................................................................................................................................ 3
DATA COLLECTION ....................................................................................................................................... 5 Key Variables ........................................................................................................................................... 5
DATA ANALYSIS ............................................................................................................................................ 7 Data Sampling .......................................................................................................................................... 8 Driver Verification ................................................................................................................................... 9 CAS Activation Analysis ........................................................................................................................... 9
CHAPTER 2. COLLISION AVOIDANCE SYSTEM RELIABILITY ................................................................ 12 ACTIVATION VALIDITY .............................................................................................................................. 12
Safety Critical Event Classifications ...................................................................................................... 18 Description of False Automatic Emergency Braking Activations .......................................................... 19 Driving Context of False Activations ..................................................................................................... 22 Frustration toward False Activations .................................................................................................... 23 Prior False Activations .......................................................................................................................... 24
SAFETY MANAGER SURVEYS ................................................................................................................... 25 Initial Safety Manager Surveys .............................................................................................................. 26 End of Study Surveys .............................................................................................................................. 26
CHAPTER 3. DRIVER PERFORMANCE WITH CAS OVER TIME ............................................................... 27
RATES OF COLLISION AVOIDANCE SYSTEM ACTIVATIONS ............................................................. 27
RATES OF COLLISION AVOIDANCE SYSTEM ACTIVATIONS OVER TIME ...................................... 29 Rates of Automatic Emergency Braking Activations over Time ............................................................. 29 Rates of Impact Alerts over Time ........................................................................................................... 30 Rates of Following Distance Alerts over Time ....................................................................................... 30 Rates of Lane Departure Warnings Alerts over Time ............................................................................ 31 Rates of Stationary Object Alerts over Time .......................................................................................... 31

viii
CHAPTER 4. DRIVING BEHAVIOR WITH COLLISION AVOIDANCE SYSTEM TECHNOLOGY ........ 32 HEADWAY ...................................................................................................................................................... 32
All Headway ........................................................................................................................................... 32 Manual Headway ................................................................................................................................... 33
SPEED .............................................................................................................................................................. 34
BRAKE REACTION TIME ............................................................................................................................. 35
DECELERATION ............................................................................................................................................ 35
CHAPTER 5. PROVIDE DATA ON REAL-WORLD CONFLICTS .................................................................. 36
WEATHER CONDITION ................................................................................................................................ 36
LIGHTING CONDITION ................................................................................................................................ 37
TRAFFIC DENSITY ........................................................................................................................................ 39
HANDS ON WHEEL ....................................................................................................................................... 41
DRIVING CONTEXT ...................................................................................................................................... 42
DRIVER FOCUS .............................................................................................................................................. 44
DRIVER FRUSTRATION ............................................................................................................................... 46
PRIOR ACTIVATIONS ................................................................................................................................... 48
CHAPTER 6. GENERATE INPUTS FOR A SAFETY-BENEFITS SIMULATION MODEL ......................... 50
BRAKE REACTION TIME ............................................................................................................................. 50
BRAKING DECELERATIONS ....................................................................................................................... 52
SPEED AND HEADWAY ............................................................................................................................... 54
CHAPTER 7. DISCUSSION .................................................................................................................................... 56 COLLISION AVOIDANCE SYSTEM RELIABILITY .................................................................................. 56
ASSESSING DRIVER PERFORMANCE OVER TIME ................................................................................ 59
ASSESSING OVERALL DRIVING BEHAVIOR .......................................................................................... 60
PROVIDE DATA ON REAL-WORLD CONFLICTS .................................................................................... 60
GENERATE INPUTS FOR A SAFETY BENEFITS MODEL ....................................................................... 62
CHAPTER 8. CONCLUSION .................................................................................................................................. 63
CHAPTER 9. LIMITATIONS ................................................................................................................................. 64
APPENDICES ........................................................................................................................................................... 66
ACKNOWLEDGEMENTS .................................................................................................................................... 125
REFERENCES ........................................................................................................................................................ 126

ix
LIST OF TABLES
Table 1. Companies That Participated in the Study .................................................................. 4
Table 2. Summary of the Makes, Models, and Years of Participating Vehicles ..................... 5
Table 3. Summary of the Datasets and Variables Used to Answer Each Research Objective ........................................................................................................................................ 6
Table 4. Final Sampling for Each Type of CAS Activation ...................................................... 9
Table 5. Definitions for the Classification Categories of AEB Activations and FCW Alerts ............................................................................................................................................ 10
Table 6. Definitions for the Analysis of LDW Alerts ............................................................... 11
Table 7. Percentage of False Activations With Confidence Intervals for Each Activation Type .............................................................................................................................................. 17
Table 8. Average Hourly Rate of CAS Activations .................................................................. 27
Table 9. Average Number of ACC Activations per Hour by CAS Manufacturer ................ 29
Table 10. Average BRT After AEB Activation for Each Activation Classification .............. 52
Table 11. Average BRT After IA for Each Activation Classification .................................... 52
Table 12. Average Maximum Decelerations Within 5 s of AEB Onset, When BRT < 200 ms or Brake Depressed At Onset ............................................................................................... 53
Table 13. Average Maximum Decelerations Within 5 s of AEB Onset, When BRT > 200 ms .................................................................................................................................................. 53
Table 14. Average Maximum Decelerations in g Within 5 s of IA Onset, When BRT < 200 ms or Brake Depressed at Onset......................................................................................... 53
Table 15. Average Maximum Decelerations Within 5 s of IA Onset, When BRT > 200 ms 54
Table 16. Mean Speeds at Onset of AEB for Each Activation Classification ........................ 54
Table 17. Mean Speeds at Onset of IAs for Each Activation Classification .......................... 54
Table 18. Mean Headways at Onset of AEB for Each Activation Classification .................. 55
Table 19. Mean Headways at Onset of IAs for Each Activation Classification .................... 55
Table 20. Company A AEB Model Results ............................................................................. 119
Table 21. Company A AEB Model Results Without Influential Driver .............................. 119
Table 22. Company B AEB Model Results ............................................................................. 120
Table 23. Company A IA Model Results ................................................................................ 120
Table 24. Company B IA Model Results ................................................................................. 120
Table 25. Company A FDA Model Results ............................................................................. 120
Table 26. Company B FDA Model Results ............................................................................. 121
Table 27. Company B FDA Model Results First 2 Months ................................................... 121

x
Table 28. Company A LDW Model Results ........................................................................... 121
Table 29. Company B LDW Model Results............................................................................ 121
Table 30. Company A SOA Model Results ............................................................................. 122
Table 31. Company B SOA Model Results ............................................................................. 122

xi
LIST OF FIGURES
Figure 1. MiniDAS Used for Data Collection ............................................................................. 1
Figure 2. MiniDAS Placement in Center of Windshield ........................................................... 2
Figure 3. (A) Sample Image of the Forward-Facing Video Collected by the MiniDAS (B) Sample Image of the Driver-Facing Video Collected by the MiniDAS .................................... 2
Figure 4. (A) Crash Shell With Telescoping Boom (B) Triggering Activations With Truck Following Crash Shell ....................................................................................................... 3
Figure 5. Total Number of Activations of Each Type Within Data Set ................................... 7
Figure 6. Hierarchy of Activations for Bendix and Meritor WABCO .................................... 8
Figure 7. Percentages of CAS Activations Within Each Category, Separated by CAS Manufacturer .............................................................................................................................. 12
Figure 8. Percentages of CAS Activations That Were Prior to SCE, Advisory Activations, and False Activations for Company A ................................................................. 13
Figure 9. Percentages of CAS Activations That Were Prior to SCE, Advisory Activations, and False Activations for Company B ................................................................. 14
Figure 10. Percentages of LDW Alerts That Were in Response to Unintentional Lane Departures, Advisory Activations, and False Activations, Separated by CAS Manufacturer .............................................................................................................................. 15
Figure 11. Percentages of LLDWs and RLDWs That Were in Response to Unintentional Lane Departures, Advisory Activations, and False Activations for Company A. ................ 16
Figure 12. Percentages of LLDWs and RLDWs That Were in Response to Unintentional Lane Departures, Advisory Activations, and False Activations for Company B.................. 16
Figure 13. Percentage of False Activations for Each CAS Manufacturer and Each Type of Activation ................................................................................................................................ 18
Figure 14. Event Severity of CAS Activations Prior to SCE, Separated by Company ........ 19
Figure 15. Durations of all AEB Activations Separated by Company and Category ........... 20
Figure 16. Maximum Decelerations Associated With All AEB Activations, Separated by Company and Category .............................................................................................................. 21
Figure 17. Changes in Speed Associated With All AEB Activations Separated by Company and Category .............................................................................................................. 22
Figure 18. Contexts of False CAS Activations .......................................................................... 23
Figure 19. Contexts of False LDW Alerts ................................................................................. 23
Figure 20. Percentages of False CAS Activations Where Drivers Expressed Frustration .. 24
Figure 21. Percentages of False CAS Activations With Prior Activations of Equal or Lesser Priority ............................................................................................................................. 25
Figure 22. Average Overall Driving Headway in Seconds by Week in Study ....................... 33

xii
Figure 23. Average Manual Driving Headway in Seconds by Week in Study ...................... 34
Figure 24. Percentages of CAS Activations Prior to SCEs in Various Weather Conditions .................................................................................................................................... 36
Figure 25. Percentages of LDW Alerts in Response to Unintentional Lane Departures in Various Weather Conditions ..................................................................................................... 37
Figure 26. Percentages of CAS Activations Prior to SCE in Various Lighting Conditions . 38
Figure 27. Percentages of LDW Alerts in Response to Unintentional Lane Departures in Various Lighting Conditions ...................................................................................................... 39
Figure 28. Percentages of CAS Activations Prior to SCE Within Various Traffic Densities ....................................................................................................................................... 40
Figure 29. Percentages of LDW Alerts in Response to Unintentional Lane Departures Within Various Traffic Densities ............................................................................................... 40
Figure 30. Percentages of CAS Activations Prior to SCEs Within each Category of Hands on Wheel .......................................................................................................................... 41
Figure 31. Percentages of LDW Alerts in Response to Unintentional Lane Departures Within each Category of Hands on Wheel ............................................................................... 42
Figure 32. Contexts of CAS Activations Prior to SCE ............................................................ 43
Figure 33. Contexts of Advisory CAS Activations ................................................................... 43
Figure 34. Driver Focus at the Onset of CAS Activations Prior to SCEs .............................. 44
Figure 35. Driver Focus at the Onset of Advisory CAS Activations ...................................... 45
Figure 36. Driver Focus at the Onset of LDW Alerts in Response to Unintentional Lane Departures ................................................................................................................................... 45
Figure 37. Driver Focus at the Onset of Advisory LDW ......................................................... 46
Figure 38. Observations of Frustration in CAS Activations Prior to SCEs .......................... 47
Figure 39. Observations of Frustration in Advisory CAS Activations .................................. 47
Figure 40. Percentages of CAS Activations Prior to SCEs With 0, 1, 2, or 3 Prior Activations ................................................................................................................................... 48
Figure 41. Percentages of Advisory CAS Activations With 0, 1, 2, or 3 Prior Activations .. 49
Figure 42. Percentages of Driver Responses to AEB Activations ........................................... 51
Figure 43. Percentages of Driver Responses to IAs ................................................................. 51
Figure 44. Safety Manager Responses to General Statements About CAS Technology at the Start of the Study .................................................................................................................. 99
Figure 45. Safety Manager Responses to Statements About FDAs at the Start of the Study............................................................................................................................................. 99
Figure 46. Safety Manager Responses to Statements About SOAs at the Start of the Study........................................................................................................................................... 100

xiii
Figure 47. Safety Manager Responses to Statements About IAs at the Start of the Study 100
Figure 48. Safety Manager Responses to Statements About AEB at the Start of the Study........................................................................................................................................... 101
Figure 49. Safety Manager Responses to Statements About ACC at the Start of the Study........................................................................................................................................... 101
Figure 50. Safety Manager Responses to Questions About LDWs at the Start of the Study........................................................................................................................................... 102
Figure 51. Safety Manager Responses to General Statements About CAS Technology at the End of the Study ................................................................................................................. 103
Figure 52. Safety Manager Responses to Statements About FDAs at the End of the Study........................................................................................................................................... 103
Figure 53. Safety Manager Responses to Statements About SOAs at the End of the Study........................................................................................................................................... 104
Figure 54. Safety Manager Responses to Statements About IAs at the End of the Study . 104
Figure 55. Safety Manager Responses to Statements About AEB at the End of the Study 105
Figure 56. Safety Manager Responses to Statements About ACC at the End of the Study105
Figure 57. Safety Manager Responses to Statements About LDWs at the End of the Study........................................................................................................................................... 106
Figure 58. Rate of AEB Activations for Individual Drivers Using Company A’s CAS ..... 107
Figure 59. Rate of AEB Activations for Individual Drivers Using Company B’s CAS ...... 108
Figure 60. Rate of IAs for Individual Drivers Using Company A’s CAS ............................ 109
Figure 61. Rate of IAs for Individual Drivers Using Company B’s CAS ............................ 110
Figure 62. Rate of FDA for Individual Drivers Using Company A’s CAS .......................... 111
Figure 63. Rate of FDAs for Individual Drivers Using Company B’s CAS ........................ 112
Figure 64. Rate of SOAs for Individual Drivers Using Company A’s CAS ........................ 113
Figure 65. Rate of SOAs for Individual Drivers Using Company B’s CAS ........................ 114
Figure 66. Rate of LDWs for Individual Drivers Using Company A’s CAS ....................... 115
Figure 67. Rate of LDWs for Individual Drivers Using Company B’s CAS ....................... 116
Figure 68. Rate of ACC Activations for Individual Drivers Using Company A’s CAS ..... 117
Figure 69. Rate of ACC Activations for Individual Drivers Using Company B’s CAS ..... 118

xiv
INTRODUCTION
BACKGROUND
In 2013 there were 3,964 people killed and an estimated 95,000 people injured in crashes involving large trucks (NHTSA, 2015). Of particular concern is the fact that 80 percent of fatal crashes involving large trucks also involved multiple vehicles, compared to only 58 percent of fatal crashes involving passenger vehicles. These fatality and injury statistics can be reduced, and underscore why large truck crash prevention is in the interest of everyone who shares the road.
The truck’s front is typically the impact point in a fatal truck crash (NCSA, 2015). Collision avoidance systems have been developed to both warn drivers of an impending rear-end crash and to mitigate the impact. CASs use forward-looking radar or cameras to detect potential conflicts, and generate visual and auditory alerts to notify drivers of closing targets. If the driver fails to respond, the automatic emergency braking automatically decelerates the vehicle to reduce the impact speed or avert the crash altogether. As such, this technology stands to reduce the number of truck-striking rear-end crashes. However, both fleets and policy makers require data to better understand the effectiveness of CASs equipped with AEB so that an informed decision regarding the purchase of this technology can be made. Data is also needed to inform CAS regulation in the United States. Regulations have already been written in Europe; the European Commission mandated that all new commercial vehicles be equipped with AEB technology, and the United Nations Economic Commission for Europe has stated that these systems are required for new heavy vehicles (European Commission, 2009). These technologies are currently recommended by NHTSA (NHTSA, 2015), and a number of car manufacturers have pledged to include AEB technology on new light vehicles within the United States (IIHS, 2015). Data on how well these technologies perform in the United States can help the industry develop a better understanding of the potential safety benefits and possible future regulations.
COLLISION AVOIDANCE SYSTEMS
The newest generation of CAS technologies uses a combination of features that attempt to improve driver awareness, assist the driver in maintaining safe distances, and intervene if the driver does not respond to a potential conflict. These features include AEB, forward collision warning (FCW) alerts, lane departure warnings (LDWs), and adaptive cruise control (ACC). FCW is further comprised of impact alerts (IAs), Following distance alerts (FDAs), and stationary object alerts (SOA), which provide context about the urgency of the potential conflict. Appropriate and timely activations could reduce distraction, modify driver behavior, teach drivers how to identify conflicts before they unfold, and enable improved vehicle control. This study investigates the real-world performance of two commercially available CAS products: the Bendix Wingman Advanced and the Meritor WABCO OnGuard systems. These systems entered the market in 2013 and represent the latest generation of the technology at the time of data collection.
IAs, FDAs, and SOAs provide audiovisual warnings to drivers about potential crashes in front of the vehicle. Using forward-looking radar mounted to the front bumper, the CAS tracks the speed and distance of vehicles ahead of the truck. There are some notable differences in how Wingman

xv
and OnGuard present FDA and IA activations to the driver. Wingman includes a single level of IA and three levels of FDAs, with additional lights and faster audible alerts conveying higher priority warnings. The Wingman systems included in this study were integrated into the instrument panel of the vehicles, with an LCD screen behind the steering wheel and a ring of lights encircling the speedometer. Urgency is conveyed via the activation of lights in a clockwise fashion along with changes in the LCD display and audio alert frequency. Conversely, OnGuard includes one level of FDA and two levels of IAs. The first level of IA is an audiovisual alert, and the second is an audiovisual alert with haptic feedback in the form of a light pulsing of the brakes. OnGuard systems included in this study were mounted in the center stack of the vehicle with a color LCD screen. The color and images on the screen change along with the audio alert frequency to convey urgency. In both OnGuard and Wingman, SOAs are presented when a potential conflict with an object is detected and the speed of the object is zero. SOAs include a distinct image in addition to audiovisual alerts.
AEB technology is important in that it provides a final, physical intervention in an attempt to prevent or mitigate a potential crash. AEB uses the same radar as FDAs and IAs, and is designed to either buy a driver additional time to react to a conflict or mitigate the consequences if the driver does not react. Wingman can apply up to two-thirds the braking power of the vehicle, including drive, steer, and trailer axle brakes to provide an even braking distribution. OnGuard can apply engine retarder and foundation brakes up to half the braking power of the vehicle. In both systems, an AEB activation is accompanied by a distinct audiovisual alert from the LCD display.
ACC is a form of cruise control in which the vehicle is able to regulate both speed and distance to a lead vehicle. ACC uses radar mounted on the front bumper to detect the speed and distance of any lead vehicle that might be present. If there is no lead vehicle, or a lead vehicle is driving faster than cruise control speed, ACC will maintain the speed set by the driver. If a lead vehicle is present and driving slower than the cruise control speed, ACC will slow the truck in order to maintain a safe headway.
LDW alerts are an optional feature on both Wingman and OnGuard systems. Vehicles participating in the study were not required to be equipped with LDW systems. For both Wingman and OnGuard systems, a separate camera is mounted on top of the windshield pointing at the forward roadway. This camera tracks lines on the road and provides the driver with audible feedback if the vehicle appears to be touching a lane marking and a lane departure may be imminent. The systems are deactivated when a turn signal is in use. Both systems use a set of stereo speakers mounted in the upper left and upper right corners of the cab. If a left lane marking generates an alert, audible feedback is generated from the left speaker. If a right lane marking generates an alert, audible feedback is generated from the right speaker. It is also possible to include a button in the center stack that deactivates LDW alerts for 15 minutes, though the availability of this button on vehicles participating in the study varied.
Despite the range of CAS features described above, there are still potential issues that warrant investigation. First, CAS technologies are generally installed only on new vehicles. Owner-operators or small companies purchasing used vehicles may not have access to the latest generation of technology. Companies buying new vehicles must make a decision as to whether safety benefits justify the cost of the technology. Further, this decision must be made in an
xvi
extremely competitive industry where costs have a large impact. Between 2007 and 2009, during the most recent economic downturn, companies cut over 200,000 jobs (Bureau of Labor Statistics, 2010). The downturn also had an impact on bankruptcies, with 19 percent more trucking companies going out of business in 2008 than in 2007 (Deutsche Welle, 2009). Because trucking is vulnerable to changes in economic conditions, CAS technologies must have clear benefits in order to justify their upfront cost.
Another potential issue is that the systems that alert the driver each rely on a single sensor. AEB, FCWs, and ACC currently all rely on a single, forward-facing radar, which tracks objects in front of the truck. The radar only reads the speed and distance of objects and cannot read environmental context, such as other vehicles’ turn signals, road conditions, or visibility. It is also possible that calibration, debris from the roadway, or environmental conditions could interfere with the radar’s operation. By understanding the reliability of the system and what factors may contribute to operational issues, companies can be better informed about the capabilities and limitations of the technology.
Finally, a lack of driver acceptance of CAS technologies could inhibit any potential safety benefits that the systems provide. If drivers do not believe the warnings are appropriate and, as a result, do not respond, then the system may not provide the expected safety benefits. The appropriateness of activations could be real or perceived on the driver’s part, but both are potential barriers to acceptance. False activations generated by the system could lead to a “cry wolf” effect, where the drivers no longer trust the system even when a valid activation is generated. In addition, if drivers are alerted to respond to potential conflicts too early or too often, they may become desensitized to the activations and no longer respond to them. By understanding how drivers interact with CAS technologies in the real world, companies will know how to address acceptance issues and maximize the safety benefits that the systems may provide.
RESEARCH OBJECTIVES
In order to investigate the safety benefits of current-generation CASs and the potential issues associated with them, the following research objectives were developed.
• Evaluate System Reliability
Evaluate the overall practicality (i.e., activations in appropriate situations), reliability (i.e., false activations), and readiness (i.e., activations in appropriate quantities) of CAS technology for widespread deployment.
• Assess Driver Performance over Time
Assess changes in driver performance that would indicate safer driving (e.g., from the performance feedback of the CAS) or degraded driving (e.g., from over-reliance on the CAS).

xvii
• Assess Overall Driving Behavior
Assess if and how speed and headway changes over time as drivers use the CAS.
• Provide Data on Real-World Conflicts
Provide data on real-world conflicts and/or crashes, which will be used to enhance the representativeness of test procedures developed by NHTSA and to help define system performance requirements.
• Generate Inputs to a Safety Benefits Simulation Model
Refine inputs to a safety benefits simulation model for heavy vehicle CASs being studied under a separate project. The data will improve understanding of driver responses to CAS activations, including basic reaction times, braking, and steering input levels under various pre-crash conditions.

1
CHAPTER 1. METHODS
The goal of the study was to collect naturalistic data on 150 CAS-equipped trucks in order to address the research objectives regarding CAS performance. Prior to collecting and analyzing these data, a number of steps were taken in preparation. These included pilot testing with a newly designed data acquisition system and test vehicles, recruiting companies and drivers using appropriate CAS technology to participate, and planning how the available data would be analyzed to address the research objectives. All methods, recruitment instruments, survey instruments, and data collection instruments were approved by the Virginia Tech institutional review board.
PILOT TESTING
Data Acquisition System
For the study, the Virginia Tech Transportation Institute designed a new miniature data acquisition system that was mounted on the windshield of participating vehicles (Figure 1). The MiniDAS enabled quick, low-profile installations while still collecting naturalistic data on the vehicle, driver, and environment. It was mounted to the center of participating vehicles’ windshields just above the dashboard, as shown in Figure 2. This location provided a clear view of the driver and of the forward roadway from the center of the vehicle. A waiver was obtained from the Federal Motor Carrier Safety Administration in order to place the MiniDAS in this location.
Figure 1. MiniDAS Used for Data Collection

2
Figure 2. MiniDAS Placement in Center of Windshield
The MiniDAS connected to the J1939 port of the vehicle and captured vehicle network data as well as CAS activations. The MiniDAS was equipped with two video cameras, which recorded the driver and forward roadway at a resolution of 640x480 pixels (Figure 3). The MiniDAS also collected parametric data and GPS data. Data was recorded onto SD cards housed in the unit. All data was encrypted to protect participant privacy. VTTI technicians scheduled periodic meetings with all participants in order to harvest data. Once SD cards were returned to VTTI, data were copied to VTTI’s secure servers for later analysis.
A.) B.)
Figure 3. (A) Sample Image of the Forward-Facing Video Collected by the MiniDAS (B) Sample Image of the Driver-Facing Video Collected by the MiniDAS
MiniDAS installation took approximately 45 minutes per truck and was performed on-location by the researchers or trained technicians. After installation, participants were instructed to drive as they normally would and were informed that the MiniDAS would not interfere with their truck or work in any way. Past experiences with naturalistic studies have indicated that participants begin to act naturally after an adjustment period of a few hours (Lee, Dingus, Klauer, Neale, & Sudweeks, 2005). No data was omitted from the analysis based on this adjustment period.

3
Private and Public Road Testing
The objective of the pilot testing was to ensure that all outputs from the CASs were being properly recorded by the MiniDAS. This was done to minimize any potential for gaps or missing variables once data collection commenced. The testing also ensured that the MiniDAS did not interfere with any of the vehicles’ systems or the drivers’ ability to perform their jobs. In addition, it was an opportunity for VTTI researchers to get hands-on experience with the CAS technology and decide how to address each research objective appropriately.
VTTI acquired two test vehicles, one equipped with Bendix Wingman Advanced and one equipped with Meritor WABCO OnGuard. These test vehicles were leased for 2 months each and used for testing on both public roadways and the Virginia Smart Road, a closed test track in southwest Virginia. In both phases of testing, all drivers were trained VTTI employees. The Virginia Smart Road was used for initial testing with a retractable crash shell to trigger each type of CAS activation in a controlled environment (Figure 4). Once CAS activations had been triggered in a controlled environment, testing proceeded to public roadways around southwest Virginia. This was done to observe CAS activations in a realistic environment and ensure the MiniDAS did not interfere with driving. Due to safety concerns, AEB and SOAs were not triggered on public roads. In controlled testing and public road testing, the MiniDAS was able to capture CAS activations for both Wingman and OnGuard products. The MiniDAS did not interfere with either driving or the vehicle systems during testing.
A.) B.)
Figure 4. (A) Crash Shell With Telescoping Boom (B) Triggering Activations With Truck Following Crash Shell
RECRUITMENT
Recruitment for the study was conducted in two phases: first, at the company level to find eligible vehicles, and second, at the driver level to find willing subjects within participating companies. Meritor WABCO and Bendix assisted with recruitment by identifying companies that had recently purchased the current generation of OnGuard and Wingman products for their vehicles. Once a company was identified, they were contacted to explain the research and offered $2,000 rebates for each truck that was chosen to participate in the study. Cold calling was also conducted in key regions to find companies that were using the technology. If a company was

4
willing to allow access to their drivers, researchers traveled to the company’s terminals to recruit drivers in person. There were no restrictions on recruiting, except that the driver needed to be exclusively using a 2013 or newer vehicle equipped with current OnGuard or Bendix technology and be able to meet with a technician periodically for maintenance and data harvesting.
Driver recruitment typically involved calling drivers or meeting them in person to explain the study. If drivers expressed interest, researchers met with them in person to explain the consent form and answer any questions. The Virginia Tech IRB approved all study protocols. Participating drivers signed an informed consent form and received $100 after joining the study. Participating drivers also received $100 per month as long as they remained in the study and a $100 bonus if they stayed in the study for a full year or until the end of data collection, whichever came first.
In total, 169 drivers and 150 vehicles were recruited into the study across seven companies. The companies included truckload (TL), less-than-truckload (LTL), flatbed, and dry-haul tank carriers. TL operations generally handle larger quantities of freight for single customers, while LTL operations handle smaller quantities of freight that could be combined with other customers’ freight within individual trucks. The companies that participated, the locations of their participating terminals, and the brand of CAS technology they used are shown in Table 1. A summary of the makes, models, and years of the vehicles that participated in the study is provided in Table 2.
Table 1. Companies That Participated in the Study
Company Locations in Study Brands of CAS Technology Crosby Trucking Mt. Sydney, VA Meritor WABCO OnGuard Rush Trucking Wayne, MI Meritor WABCO OnGuard
Stagecoach Cartage El Paso, TX Bendix Wingman Advanced Kuperus Trucking Grand Rapids, MI Meritor WABCO OnGuard J&M Tank Lines Birmingham, AL Bendix Wingman Advanced J&M Tank Lines Atlanta, GA Bendix Wingman Advanced J&M Tank Lines Hondo, TX Bendix Wingman Advanced
P&S Transportation Birmingham, AL Meritor WABCO OnGuard P&S Transportation Nashville, TN Bendix Wingman Advanced
Modular Transportation Grand Rapids, MI Meritor WABCO OnGuard Modular Transportation Lansing, MI Bendix Wingman Advanced

5
Table 2. Summary of the Makes, Models, and Years of Participating Vehicles
Make Model Year Number of Vehicles
Freightliner Cascadia 2013 - 2015 96
Kenworth T660 / T680 2014 - 2015 50
Volvo VNL780 2013 - 2014 3
Peterbilt 579 2014 1
Total: 150
While drivers could participate for up to one year, most participants were not in the study for its full duration. This was because they left their jobs, changed routes, missed scheduled meetings with technicians, or joined the study late as replacement participants. Replacement drivers and vehicles were actively recruited throughout the allotted time for data collection to compensate for driver attrition. Overall, the mean amount of time that drivers collected usable data in the study was about 16 weeks. The driver accumulating the most amount of time with usable data had 45 such weeks.
DATA COLLECTION
Key Variables
Table 3 presents the data and key variables used in the analysis of each research objective.

6
Table 3. Summary of the Datasets and Variables Used to Answer Each Research Objective
Research Objective Data Set Key Variables Source
Evaluate System Reliability
Sampled activations (6,000)
• Safety-critical event analysis
• Activation reliability classification
Video analysis
Assess Driver Performance Over Time
Vehicle network data, grouped by participant and week in study
• Weekly activation rates • Brake reaction time • Deceleration
Calculated from vehicle network
Assess Overall Driving Behavior
Vehicle network data, grouped by participant and week in study
• Speed • Headway Read from vehicle network
Provide Data on Real-World Conflicts
Sampled activations (6,000)
• Safety-critical event analysis
• Environmental characteristics
Video analysis
Generate Inputs to a Safety Benefits
Simulation Model
Sampled activations (6,000)
Vehicle network
data
• Safety-critical event analysis
• Activation reliability classification
• Speed • Headway • Brake Reaction Time • Deceleration
• Video analysis • Read from vehicle network • Calculated from the vehicle network

7
Variables read from the vehicle network can be found in Appendix A. Many variables read from the vehicle network or collected by the MiniDAS were not used to address the research objectives in this study. (These variables may be useful in future analyses.) It should be further noted that while the MiniDAS is capable of recording audio, due to privacy concerns, this feature was disabled unless the participant pressed a button to initiate 30 seconds of audio recording. The button was used infrequently and was often pressed by mistake. Because of this, no audio data were analyzed in this study.
Surveys of the seven safety managers at the participating trucking companies were conducted to obtain subjective data on CAS technology. The data set was small, and the data from these surveys were primarily used to identify any high-level agreements or disagreements among the safety managers’ responses.
DATA ANALYSIS
In total, 188 terabytes of objective data were collected. This data included approximately 110,000 hours of driving, 3,245,000 miles traveled, 885,000 observed CAS activations, and 547,000 individual instances of ACC controlling both speed and headway during usage. Note that there could be multiple instances of ACC controlling speed and headway in a given period of cruise control being active. ACC was engaged for a total of 25,922 hours, representing about a quarter of all driving time in the data. Figure 5 shows the counts of each type of activation within the data set.
264 1,965 8,604
410,590463,818
547,095
0
100,000
200,000
300,000
400,000
500,000
600,000
AEBActivations
IA SOA LDW Alerts FDA ACCActivations
Coun
t
CAS Activations and Alerts
Figure 5. Total Number of Activations of Each Type Within Data Set

8
In order to address the research objectives, these data underwent a thorough sampling, verification, and analysis process.
Data Sampling
In order to evaluate the reliability of system activations, a sampling method was devised in which 6,000 activations would be visually inspected and analyzed. Due to their higher priority, the method sampled all IAs and AEB activations from both makes of CAS, plus an approximately equal sampling of FDAs, SOAs, and LDWs from both makes of CASs. Note that the Bendix Wingman Advanced system has three types of FDAs, while the Meritor WABCO OnGuard system has a single type of FDA. A hierarchy was created based on the priority of CAS activations in order to ensure that multiple activations connected to a single event would not be sampled. When CAS activations occurred within 5 s of each other, only the highest priority activation was eligible for sampling. Figure 6 shows the hierarchy for each company’s CAS. Finally, in order to make the sampling align as well as possible between the two companies, all three levels of Bendix FDAs were combined into a single FDA, and both levels of Meritor WABCO IAs were combined into a single IA for analysis.
Bendix Trigger Hierarchy
Meritor WABCO Trigger Hierarchy
Lane Departure Warning
Following Distance Alert
(Level 1)
Following Distance Alert
(Level 2)
Following Distance Alert
(Level 3)
Stationary Object Alert
Impact Alert
Automatic Emergency
Braking
Lane Departure Warning
Following Distance Alert
Stationary Object Alert
Impact Alert
Impact Alert with Haptic
Warning
Automatic Emergency
Braking
Least Urgent Most Urgent
Least Urgent Most Urgent
Figure 6. Hierarchy of Activations for Bendix and Meritor WABCO
After completing the data collection, the sampling of LDW, FDA, and SOA events were increased slightly to account for the lower than expected number of AEB and IA activations. It should also be noted that the quantities of data collected were not equal between Company A and Company B, accounting for differences in the number of IA and AEB activations observed. The rates of observed activations are discussed below in Chapter 4 (“Driver Performance With CAS Over Time”). Table 4 shows the final sampling numbers, with the data de-identified by

9
company. The final sampling included all IA and AEB activations across both brands of CAS, and approximately equal sampling of LDWs, FDAs, and SOAs from each brand of CAS.
Table 4. Final Sampling for Each Type of CAS Activation
LLDW RLDW FDA SOA IA AEB Total Company A 380 380 903 227 1,424 234 3,548 Company B 376 376 905 227 538 30 2,452
Total 756 756 1,808 454 1,962 264 6,000
Driver Verification
A data reductionist reviewed each file recorded by the MiniDAS to verify that a consented participant was indeed operating the vehicle. Data files were recorded as long as the vehicle was in motion and were broken down into 2-hour blocks in the case of long trips. A sample of the driver from the beginning, middle, and end of each file was extracted to verify the driver’s identity. Any files in which a consented participant was not driving or in which the driver’s face was not visible were excluded from further analysis. In cases where multiple drivers used a vehicle, such as in slip seat operations, this process was used to differentiate the participants and code exactly when each participant used the vehicle.
Additionally, a trip summary file was prepared for each “trip” in the study. A trip was defined as the time between the vehicle being keyed on and the vehicle being keyed off. These trip summary files listed each file recorded by the MiniDAS, start and end times, the date the file was recorded, the data-collection location where the file was recorded, and the de-identified driver number. This allowed trips that included multiple files (e.g., a 6-hour trip consisting of three 2-hour files) to be reconstructed as a single continuous driving session.
CAS Activation Analysis
The 6,000 CAS activations were analyzed to determine whether a safety-critical event (SCE) took place at or near the time of the activation. The analysis process did not evaluate SCEs that occurred independently of a CAS activation. (Examples of this include any conflicts while the vehicle was in reverse, conflicts with objects the radar could not detect, or conflicts with objects to the side of the truck.) Trained data reductionists visually analyzed the video data from all sampled events and placed them into five categories: crash, near-crash, crash-relevant conflicts, unintentional lane deviation, and non-conflict. The operational definitions for crashes, NCs, and CRCs were the same as those used in previous naturalistic driving studies (Dingus et al., 2006; Hanowski et al., 2005; Simons-Morton et al., 2011). Events that were not determined to be an SCE were categorized as non-conflict. These categories and their operational definitions are detailed in Appendix B. For each sampled activation, data reductionists identified the precipitating event and created 30-second epochs (20 s prior to the PE, 10 s after the PE) for all valid SCEs. For events categorized as non-conflict, a 21-second epoch (20 s prior to the PE, 1 s after the PE) was created. Unlike PEs for SCEs, PEs for non-conflicts were defined as the onset of the triggered activation. Both SCE and non-conflict epochs were used for further analysis,

10
including traffic density, driver behaviors, weather conditions, and time of day. A full list of variables used in the analysis process is provided in Appendix C.
Three categories were created in order to describe the general context of the activation. Because AEBs, IAs, FDAs, and SOAs use a radar-based sensor and are intended to track different targets than LDWs using a camera, slightly different definitions were used for each. The definitions for categories of AEB activations and FCW alerts can be found in Table 5, while the definitions for categories of LDW alerts can be found in Table 6.
For AEB activations and FCW alerts, Activation Prior to SCE includes all samples that were classified as a crash, NC, CRC, or unintentional lane departure. These represent the situations in which a crash-avoidance maneuver is required from the driver at the time of the AEB activation or FCW alert. Advisory Activation includes all samples coded as a non-conflict, with further analysis determining that the radar appeared to be tracking a valid object or vehicle. False Activation includes all samples coded as a non-conflict, with further analysis determining that the radar appeared to be tracking an invalid object or an object in another lane of travel. For LDW alerts, Activation in Response to Unintentional Lane Departure includes all samples in which the driver appears to unintentionally depart a valid lane marking. Advisory Activation includes all samples in which the driver appears to intentionally depart a valid lane marking. False Activation includes all samples in which the driver does not appear to depart a valid lane marking. This report includes 95 percent confidence intervals for the proportion of false activations for each activation type. The confidence interval used is referred to as the Agresti and Coull method; this method has a superior coverage probability to the standard Wald confidence interval, particularly when the estimated proportions are close to 0 or 1 (Brown, Cai, & DasGupta, 2001).
Table 5. Definitions for the Classification Categories of AEB Activations and FCW Alerts
AEB, IA, FDA, and SOA
Categories Definition
Activation Prior to SCE
A radar-based CAS activation that is followed by a crash, NC, CRC, or preceded by an unintentional lane departure
Advisory Activation
A radar-based CAS activation that is a non-conflict in which the radar appears to be tracking a valid object
False Activation A radar-based CAS activation that is a non-conflict in which the radar appears to be tracking an invalid object or an object in a different lane of travel

11
Table 6. Definitions for the Analysis of LDW Alerts
LDW Alert Categories Definition
Activation in Response to Unintentional Lane
Departure
A camera-based LDW alert in which the driver appears to unintentionally depart the lane prior to the alert
Advisory Activation A camera-based LDW alert in which the driver appears to intentionally depart the lane prior to the alert
False Activation A camera-based LDW alert in which the driver does not appear to depart a valid lane marking

12
CHAPTER 2. COLLISION AVOIDANCE SYSTEM RELIABILITY
The analysis of the 6,000 sampled activations was used to evaluate CAS reliability. A total of 4,488 activations were AEB, IA, FDA, or SOA activations, while 1,512 of the activations were LDW alerts. LDW alerts are analyzed separately because they use a different sensor. The results include breakdowns of reliability by brand of CAS (referred to as Company A and Company B to maintain anonymity) and by type of CAS activation. False activations were further investigated for additional context. The NHTSA Office of Defects Investigation was made aware of the cases of CAS false activations occurring during the course of this field study. Instrumented and video data from the study were made available for further investigation as needed by ODI.
ACTIVATION VALIDITY
In all, 4,488 radar-based CAS activations were sampled. This included all AEB and IA activations for Company A and Company B, as well as an approximately equal number of FDAs and SOAs from Company A and Company B.
Company A was observed to have 7 percent activations prior to SCEs, 82 percent advisory activations, and 11 percent false activations. Company B was observed to have 6 percent activations prior to SCEs, 76 percent advisory activations, and 18 percent false activations. These results are summarized in Figure 7.
7
82
116
76
18
0
10
20
30
40
50
60
70
80
90
100
Activation Prior to SCE Advisory Activation False Activation
Perc
enta
ge
Sampled CAS Activations N = 4,488
Company A Company B
Figure 7. Percentages of CAS Activations Within Each Category, Separated by CAS
Manufacturer
These results can be further broken down by the types of forward CAS activations. Figure 8 shows the percentages of CAS activations (AEB, IA, FDA, and SOA) that fell into each category for Company A, and Figure 9 shows the percentages of CAS activations (AEB, IA, FDA, and

13
SOA) that fell into each category for Company B. Note that there were no observed SOAs prior to an SCE for Company A or Company B.
31
90.6 0
68
87
97
20.4 4 3
98
0
10
20
30
40
50
60
70
80
90
100
AEB (N = 234) IA (N = 1,424) FDA (N = 903) SOA (N = 227)
Perc
enta
ge
Type of Activation
Activation Prior to SCE Advisory Activation False Activation
Figure 8. Percentages of CAS Activations That Were Prior to SCE, Advisory Activations,
and False Activations for Company A

14
60
15
0.1 0
13
70
99
3
27
15
0.7
97
0
10
20
30
40
50
60
70
80
90
100
AEB (N = 30) IA (N = 538) FDA (N = 905) SOA (N = 227)
Perc
enta
ge
Type of Activation
Activation Prior to SCE Advisory Activation False Activation
Figure 9. Percentages of CAS Activations That Were Prior to SCE, Advisory Activations,
and False Activations for Company B
In all, 1,512 sampled CAS activations were LDW alerts. These were sampled equally from Company A and Company B, and equally from left-side and right-side alerts within each company. It should be noted that LDW was an optional feature on vehicles participating in the study. Seventy-five participating trucks were equipped with LDW, 11 from Company A and 64 from Company B.
Figure 10 shows the percentages of LDW alerts that were in response to unintentional lane departures, advisory activations, and false activations for Company A and Company B. For Company A, 22 percent of LDWs were in response to unintentional lane departures, 76 percent were advisory, and 2 percent were false. For Company B, 34 percent of LDWs were in response to unintentional lane departures, 65 percent were advisory, and 1 percent were false. It should be noted that these assessments were based on forward video from the MiniDAS. Side video of the vehicles was not available to make precise determinations.

15
22
76
2
34
65
10
102030405060708090
100
Activation in Response toUnintentional Lane Departure
Advisory Activation False Activation
Perc
enta
ge
LDW Reliability Classification
Company A (N = 760) Company B (N = 752)
Figure 10. Percentages of LDW Alerts That Were in Response to Unintentional Lane
Departures, Advisory Activations, and False Activations, Separated by CAS Manufacturer
The results for LDW can be further broken down by left and right side LDW (LLDW and RLDW, respectively). Figure 11 shows the percentages of LLDWs and RLDWs that were in response to unintentional lane departures, advisory activations, and false activations for Company A. Figure 12 shows the percentage of LLDWs and RLDWs that were in response to unintentional lane departures, advisory activations, and false activations for Company B.

16
1827
7972
2 20
102030405060708090
100
LLDW (N = 380) RLDW (N = 380)
Perc
enta
ge
LDW Activations
Activation in Response to an Unintentional Lane Departure Advisory Activation False Activation
Figure 11. Percentages of LLDWs and RLDWs That Were in Response to Unintentional
Lane Departures, Advisory Activations, and False Activations for Company A.
33 34
65 65
2 10
102030405060708090
100
LLDW (N = 376) RLDW (N = 376)
Perc
enta
ge
LDW Activations
Activation in Response to an Unintentional Lane Departure Advisory Activation False Activation
Figure 12. Percentages of LLDWs and RLDWs That Were in Response to Unintentional
Lane Departures, Advisory Activations, and False Activations for Company B.
Table 7 provides, for each activation type and company, the estimated probabilities that an activation was false (i.e., prior to neither an SCE nor an advisory), along with standard errors (S.E.) and 95 percent confidence intervals for those estimates. The endpoints of the 95 percent

17
confidence intervals are calculated via the Agresti and Coull method (Brown, Cai, & DasGupta, 2001), using the binconf function in R.
Table 7. Percentage of False Activations With Confidence Intervals for Each Activation Type
Activation Type Company
Percentage of False
Activations S.E. False
Activations Total
Activations
Lower Confidence
Limit
Upper Confidence
Limit AEB A 0.43 0.43 1 234 0.02 2.38 AEB B 26.67 8.07 8 30 14.18 44.45 IA A 3.72 0.5 53 1,424 2.86 4.84 IA B 14.87 1.53 80 538 12.11 18.13
FDA A 2.66 0.54 24 903 1.79 3.92 FDA B 0.66 0.27 6 905 0.3 1.44
LLDW A 2.37 0.78 9 380 1.25 4.44 LLDW B 1.6 0.65 6 376 0.73 3.44 RLDW A 1.84 0.69 7 380 0.9 3.75 RLDW B 1.06 0.53 4 376 0.41 2.7 SOA A 97.8 0.97 222 227 94.95 99.06 SOA B 96.92 1.15 220 227 93.77 98.5
A plot of the percentage of false activations with 95 percent confidence intervals, by activation type and company, is displayed in Figure 13.

18
0
10
20
30
40
50
60
70
80
90
100
AEB IA FDA LLDW RLDW SOA
Perc
enta
ge o
f Fal
se A
ctiv
atio
ns
CAS Activations
Company A Company B
Figure 13. Percentage of False Activations for Each CAS Manufacturer and Each Type of
Activation
Safety Critical Event Classifications
Of the 4,488 radar-based CAS activations sampled, SCEs contributed to the onset of 302 (5%). Each SCE was further classified as a crash, NC, or CRC. Crashes involve the truck physically touching another vehicle or environmental object. NCs require a rapid evasive maneuver in order to prevent a crash. CRCs require a crash-avoidance maneuver to prevent a crash, but the driver has more time to respond than in the case of an NC. Full definitions of these categories can be found in Appendix B. For Company A, no SCEs resulted in crashes, 38 percent resulted in NCs, 62 percent resulted in CRCs, and 0.5 percent resulted in unintentional lane departures. For Company B, 1 SCE (0.19%) was a crash, which occurred around the onset of an IA. The crash was classified as a low-risk tire strike against a curb, in which the driver braked and steered left in the presence of a braking lead vehicle. For Company B, another 44 percent were NCs, 55 percent were CRCs, and none were unintentional lane departures. Note that these only represent SCEs that occurred around the onset of sampled CAS activations. Also note that an unintentional lane departure could lead to a radar-based CAS activation due to an object outside the lane now being in the path of the vehicle. The speed and magnitude of any response required by the driver could result in these situations being classified as a near-crash or CRC event, both of which are considered more severe. These results are summarized in Figure 14, separated by CAS manufacturer.

19
0
38
62
0.51
44
55
00
10
20
30
40
50
60
70
80
90
100
Crash Near-Crash Crash-Relevant Conflict Unintentional LaneDeparture
Perc
enta
ge
Safety Critical Event Severity
Company A (N = 204) Company B (N = 98)
Figure 14. Event Severity of CAS Activations Prior to SCE, Separated by Company
Description of False Automatic Emergency Braking Activations
False AEB activations were investigated to see if they were different from AEB activations prior to SCEs or advisory AEB activations in terms of duration, deceleration force, or speed change. Figure 15 shows the durations of each category of AEB, separated by company. False AEB activations were much shorter on average (0.1 s for Company A, 0.29 s for Company B) compared to the other categories (between 0.79 s and 1.87 s, on average, depending on company and category). Figure 16 shows the maximum deceleration forces observed during AEB activations. False AEB activations, on average, involved less braking (no deceleration for Company A, 0.15g deceleration for Company B) compared to other categories (between 0.2g and 0.4g, on average, depending on company and category). Within false AEB activations, four out of nine also had a manual braking component in addition to the AEB, which contributed to the deceleration and speed changes that were observed. Figure 17 shows the changes in speed associated with AEB activations. False AEB activations were, on average, associated with smaller changes in speed (-0.01 mph for Company A, -2.88 mph for Company B) compared to other categories (between -6.05 mph and -11.12 mph, depending on company and category). Together, these analyses show that while false AEB activations are a concern, their duration tends to be shorter and deceleration tends to be smaller than AEB activations prior to SCEs and advisory AEB activations.

20
Figure 15. Durations of all AEB Activations Separated by Company and Category

21
Figure 16. Maximum Decelerations Associated With All AEB Activations, Separated by
Company and Category

22
Figure 17. Changes in Speed Associated With All AEB Activations Separated by Company
and Category
Driving Context of False Activations
All sampled CAS activations were analyzed to determine the driving context at the onset. For activations that are prior to an SCE or advisory, see Section 6.5 in Chapter 6. For CAS activations categorized as false, the categories included No Lanes Crossed (LDW alerts only, meaning the camera seemed to be tracking a valid lane marking but the vehicle did not appear to cross the marking based on video review), Car in Adjacent Lane, Physical Object (Sign, Overpass, Tree), and an Other category for situations that did not fit into any of these categories. For radar-based activations, the Other category generally contained events in which the exact object being tracked could not be determined. For camera-based LDW alerts, the other category generally contained events in which non-lane markings were being tracked (i.e., refletive tar, snow, old lane markings, or other road surface markings).The percentages of false CAS activations within each of these categories can be seen in Figure 18. The percentages of false LDW alerts within each of these categories can be seen in Figure 19.

23
Figure 18. Contexts of False CAS Activations
Figure 19. Contexts of False LDW Alerts
Frustration toward False Activations
All sampled CAS activations were analyzed to determine whether the driver expressed frustration after the activation’s onset and whether the frustration was directed toward the CAS.

24
Frustration at the CAS activation was determined by whether the driver looked at or gestured toward the CAS display while expressing the frustration. For activations that were prior to an SCE or advisory, see Section 6.7 in Chapter 6. For false CAS activations, the percentage in which frustration was displayed can be seen in Figure 20. For false LDW activations, drivers expressed no clear visual indications of frustration afterwards.
Figure 20. Percentages of False CAS Activations Where Drivers Expressed Frustration
Prior False Activations
For all sampled CAS activations, reductionists coded how many prior activations of equal or lower priority occurred within 5 s. Recall that activations were sampled based on a hierarchy of their priorities (See Figure 16). For activations that were prior to an SCE or advisory, see the section titled Prior activations in Chapter 6. For false CAS activations, the percentage in which there were prior activations of equal or lesser priority can be seen in Figure 21. False LDWs were generally not observed to have prior activations.

25
Figure 21. Percentages of False CAS Activations With Prior Activations of Equal or Lesser
Priority
Summary of CAS Reliability
CAS activations were generally reliable across both Company A and Company B. Most activations were either prior to an SCE or advisory, which means a valid object or lane marking was being tracked. The progression of radar-based CAS activations was found to be reliable as well, as higher priority activations were more likely to be prior to an SCE. Some false activations were observed within each type of activation. Company A was observed to have a relatively high percentage of false AEB and IA activations, and SOA activations were mostly false across both companies. It was observed that false AEB activations were generally shorter and less forceful than AEBs prior to SCEs and advisory AEBs, which may mitigate the unintended consequences of false AEB activations.
SAFETY MANAGER SURVEYS
Safety managers at each of the seven participating companies were surveyed at the start and finish of their participation. Some had previous experience with CAS technologies, while others were installing the technology for the first time. The safety managers also had different degrees of monitoring activations from CAS systems and different levels of coaching/feedback in which they spoke with the drivers about the CAS activations. The survey given to safety managers can be seen in Appendix D. The survey given after completion added one additional option to a question asking participants to rank CAS technologies, but all Likert-type scale questions were identical in both questionnaires. The change was made in order to separate AEB activations from FCW activations when safety managers ranked the usefulness of the technologies.

26
Initial Safety Manager Surveys
The complete results from the initial safety manager surveys can be found in Appendix E. No safety managers disagreed with the statements that, “Collision mitigation technology makes drivers safer,” or, “I would recommend my company install collision mitigation technology on all commercial vehicles as standard equipment.” This result may indicate that safety managers see long-term benefits in the technology and that their companies will continue to install CASs on their vehicles. In follow-up interviews, all but one safety manager indicated that their companies plan to install the technology on new vehicles they purchase. The remaining company was in the process of reviewing their experiences with the technology to determine if they would continue purchasing it. Another result was that, to some degree, all safety managers agreed with the statement, “False alerts negatively affect drivers.” In follow-up interviews, the safety managers were concerned that false activations led to drivers’ mistrust of the system and confusion about how the system worked.
Safety manager responses to questions about SOA technology were mostly neutral or in slight agreement to both positive and negative statements about the technology. In follow-up interviews, most safety managers said that drivers did not talk to them about SOAs, and that they did not have much information about their prevalence, effectiveness, or drivers’ opinions of them.
One other result from the initial surveys showed mixed opinions of the AEB technology. All statements in this section to which safety managers were asked to respond were positive in nature, and the safety managers were divided in their responses. Three safety managers were neutral or disagreed with all of the statements, three safety managers were neutral or agreed with all of the statements, and one safety manager was a mix of agreement and disagreement. In follow-up interviews, safety managers who disagreed cited concerns that AEB may not be appropriate in winter conditions and that false activations could cause problems, particularly during winter.
End of Study Surveys
After all trucks at a company completed their participation, researchers conducted a follow-up survey with the company’s safety manager. The complete results from the final safety manager surveys can be found in Appendix F. Several safety managers had changed positions of employment by the end of the study or were otherwise not able to complete the second survey. No major differences were found between the initial and final survey results.

27
CHAPTER 3. DRIVER PERFORMANCE WITH CAS OVER TIME
One potential outcome of CAS usage is that drivers may adapt to the activations over time. This adaptation could come in several forms. Drivers may adapt by gradually adjusting their driving behaviors in order to receive fewer activations. Drivers may also become accustomed to and ignore the activations, maintaining or increasing the number of activations they receive over time. There may also be short-term adaptations, such as drivers testing the system when they first begin using it. In order to determine if drivers were adapting to the system, an hourly activation rate was calculated for each week that a driver participated in the study. This rate was calculated for each type of activation. Additionally, overall activation rates were calculated for each activation type in order to determine how frequently activations occurred across all participants.
RATES OF COLLISION AVOIDANCE SYSTEM ACTIVATIONS
Before looking at changes over time, the overall average hourly activation rates were calculated for each activation type. The overall average was calculated by first taking the mean rate for each driver, then taking the average of the driver means. It should be noted that each driver’s individual rate of activations is being weighed equally in this method, despite the fact that they participated for different lengths of time. A summary of the hourly activation rates is shown in Table 8 and figures charting hourly rates for individual drivers can be found in Appendix G.
Table 8. Average Hourly Rate of CAS Activations
Activation Type Company
Mean Hourly Rate of
Activations S.E. N Min Max
AEB A 0.01 0.001 69 0 0.05 AEB B 0.01 0.005 49 0 0.23 IA A 0.03 0.005 69 0 0.21 IA B 0.02 0.003 49 0 0.08
FDA A 7.2 0.57 69 0.87 22.6 FDA B 4.29 0.41 81 0 14.84 SOA A 0.23 0.1 69 0 4.57 SOA B 0.07 0.005 49 0 0.15 LDW A 2.44 0.4 19 0.48 5.69 LDW B 14.48 1.68 64 1.86 87.64

28
The results show that higher priority activations, such as AEB and IAs, are experienced less frequently by drivers than lower priority activations such as FDAs and LDWs. AEB activations were experienced about once per 100 hours of driving for both companies. IA activations were experienced about three times per 100 hours of driving for Company A and two times per 100 hours of driving for Company B. This means the participating drivers would not likely receive an AEB or IA activation in a typical 11-hour driving shift. However, as Appendix F shows, there were differences between the participants in the hourly activation rates.
Lower priority activations, such as FDAs and LDWs, had much higher hourly rates of activation. Drivers averaged 7.2 FDAs per hour for Company A and 4.29 FDAs per hour for Company B. Drivers averaged 2.44 LDWs per hour for Company A and 14.48 LDWs per hour for Company B. As with the higher priority activations, Appendix F shows that there were large differences between participants’ individual rates. The difference between the rate of LDWs for Company A and Company B is not well understood, and could be a result of a number of factors. The LDW data for Company A was comprised of a smaller number of drivers, driver experience could not be accounted for, and a number of environmental factors (geographic location, weather, traffic density, types of roads, etc.) could have influenced these results. It should be noted that while FDAs and LDWs had a low percentage of false activations across both Company A and Company B, the higher rate of activations means many participating drivers could be expected to receive a false FDA or LDW activation every 1-2 days (assuming 11-hour driving shifts). Using Company A’s LDWs (2% false activations) as an example, these drivers would experience, on average:
A similar situation can been seen with SOAs due to their high percentage of false activations. The rate of SOA activations was 0.23 per hour for Company A and 0.07 per hour for Company B. This means that participating drivers, on average, experienced 2.53 SOAs per 11 hours of driving for Company A and 0.77 SOAs per 11 hours of driving for Company B. It should be noted that 5 out of 69 individual drivers using Company A had significantly higher rates of SOA than their peers, as can be seen in Appendix F. Using Company B’s SOAs (97% false activations) as an example, these drivers would experience, on average:
Though there were differences among individual drivers, as the calculations above illustrate, a false activation of some type could be typical for many participants in an 11-hour shift. Because survey data for individual drivers were not available, it is unclear how the drivers perceive this rate of false activations or how it may impact their responses to other activations.
In addition to CAS activations, the hourly rates of ACC “activations” (i.e., the average number of times drivers pressed the button to engage ACC per hour) were calculated and are shown in Table 9. These values represent the number of instances per hour in which the driver allowed ACC to control both speed and distance. Drivers using Company A had 4.07 ACC activations per hour, while drivers using Company B had 10.72 activations of ACC per hour. This does not

29
account for the duration of these instances, and a number of factors—such as type of roadway and traffic density—could impact these figures. This also does not account for company policies, which could impact how drivers use ACC technology. However, based on these results, many participants used ACC frequently and allowed ACC to control both speed and headway. Figures showing individual rates of allowing ACC to control both speed and headway can be found in Appendix F.
Table 9. Average Number of ACC Activations per Hour by CAS Manufacturer
Company Mean Hourly
Rate S.E. N Min Max A 4.07 0.48 70 0 13.05 B 10.72 1.05 78 0 38.58
RATES OF COLLISION AVOIDANCE SYSTEM ACTIVATIONS OVER TIME
The data were analyzed for any significant changes in the rates of AEB activations, IAs, FDAs and LDW alerts over time. Mixed negative binomial regression models were used to analyze the change in rate of activations over time, with the total count of activations as the response variable and the log of the total hours driven in a particular week for a particular driver used as an offset term (meaning that the slope for the log of total hours was forced to be 1). Linear and quadratic terms were used to model the change in hourly rate of activations as a function of the week in the study, with quadratic terms to test for curvature, or whether any increase or decrease in rates leveled off at some point. Random effects for different drivers were used to account for correlations of observations within drivers. One random effect was an intercept term that represented the participant’s baseline rate. Another random effect represented the participant’s linear change over time. Note that when higher order random effects were put into the model, the model failed to converge. A full summary of the modeling results can be found in Appendix H.
Rates of Automatic Emergency Braking Activations over Time
Company A drivers experienced a total of 234 AEB activations in 38,605.26 hours of driving. Thirty-three drivers (48%) did not experience any AEB activations. One driver experienced 64 AEB activations in 1,302.47 hours of driving, while no other driver experienced more than 9.
An initial analysis yielded a significant increase in the rate of AEB activations for Company A over time, t = 3.26, p = .0012. However, this result did not hold when removing the individual with the highest overall rate of AEB activations, t = 1.61, p > .05. With 64 AEB activations (27% of the total in the sample of drivers) in 1,302.47 hours, this individual had a rate of 0.54 AEB activations per 11-hour shift, almost 5 times as high as the company mean.
Company B drivers experienced a total of 30 AEB activations in 11,758.45 hours of driving. Thirty-three drivers (67.3%) did not experience any AEB activations. One driver in the study experienced 8 events in 1,240.68 hours of driving.
The rate of AEB activations per hour for trucks equipped with Company B’s CAS did not significantly change over time, t = .70, p > .05.

30
Rates of Impact Alerts over Time
Company A drivers experienced a total of 1,424 IAs in 38,605.26 hours of driving. Twelve drivers (17.4%) did not experience any IAs. The highest number of IAs for one driver was 273; this driver had 1,302.47 hours of driving.
The rate of IAs for trucks equipped with Company A’s CAS did not significantly change over time, t = 1.61, p > .05.
Company B drivers experienced a total of 538 IAs in 23,682.05 hours of driving. Eight drivers (17.0%) did not experience any IAs. The highest number of IAs for one driver was 61; this driver had 920.86 hours of driving.
The hourly rate of IAs per hour for trucks equipped with Company B’s CAS also did not significantly change over time, t = 1.90, p > .05.
Rates of Following Distance Alerts over Time
The mean FDA rate for Company A was found to significantly change over time. Significant negative curvature was found, t = -4.03, p <.0001, indicating evidence of a change in direction of the rate from increasing to decreasing as drivers progressed in the study. The estimated terms in the model can be turned into a conditional average of rate change over time given by the following model:
where .02 is the estimated linear term (95% confidence interval .013 to .033) and -.0005 (95% confidence interval -.0008 to -.0003) is the estimated quadratic trend. The negative quadratic term provides evidence of a slight trend in which the rate increases slightly, but temporarily, within the first few weeks of using the system.
However, the model above should not be used as a predictive model for individual drivers, who were found to vary significantly in their individual trends over time. The high variability between drivers and the inability to account for factors such as age, experience, driving conditions, location, etc., means that the results may not be applicable to any given driver in the general population.
For drivers using the Company B CAS, there were a total of 99,218 FDAs in 20,602.77 active FDA hours of driving.
For Company B, the initial analysis revealed a significant change of the rate of FDAs over time for drivers using the CAS, t = 3.08, p = .0028. Because a subsequent review of the data indicated that the mean rate per driver increased from 3.52 activations per hour in the first week in the study to 6.16 activations per hour in the eighth week, a subsequent analysis was conducted to determine if there was a significant change after the first 8 weeks. No significant change was found after the eighth week in the study, t = -1.01, p > .05. Subsequently, only the weeks in the

31
first two months of the study were compared. This analysis revealed an increasing linear trend in the log of the rate over the first month in the study, t = 3.88, p = .0008. The estimated linear trend for this model is .0503 (95% confidence interval .022 to .079). The mean relative increase in rates, conditional on drivers’ individual effects, is given as
= 1.05
This implies a predicted rate of FDA increase for an individual driver of five percent for each week within the first eight weeks of the study.
Rates of Lane Departure Warnings Alerts over Time
Neither Company A (t = .73, p > .05) nor Company B (t = -.92, p > .05) experienced a statistically significant change in the hourly rate of total LDW alerts over time
Rates of Stationary Object Alerts over Time
Neither Company A (t = .34, p > .05) nor Company B (t = -.18, p > .05) experienced a significant change in the hourly rate of SOAs over time.
Summary
AEB and IA activations were relatively infrequent, and participating drivers, on average, did not receive either in a typical 11-hour shift. FDAs and LDWs were relatively frequent activations, with drivers, on average, receiving multiple activations per hour. SOAs, because of their high false activation rate, were producing relatively frequent false activations, on average. FDA activations showed a statistically significant trend over time, but there was significant variability between individual drivers; thus, this may not be a meaningful generalization. Other activation types did not show a significant trend over time.

32
CHAPTER 4. DRIVING BEHAVIOR WITH COLLISION AVOIDANCE SYSTEM TECHNOLOGY
In addition to changes in rates of activations, drivers may adapt their overall driving behavior while using CAS technology. The average headway, speed, and brake reaction time (BRT) to activations was calculated for each week a participant was in the study. Speed and headway were sampled every 15 minutes within the driving data for this analysis. Only headway samples in which a lead vehicle was present, the headway was less than 10 s, and the ACC was not activated were used.
Longitudinal mixed models were used to model the mean speed and headway per driver within each week in the study, and the results provide insight as to whether speed or headway increases or decreases over time. Slope terms were used to assess any increasing or decreasing trend. If slope terms were significant, then quadratic terms were used to assess whether any increasing/decreasing trend leveled off later in the study.
HEADWAY
To determine if there was a significant change in headway over time, the mean headway per week for a given driver was calculated, and this mean headway was used as the dependent variable. These means are based on instantaneous sampling of headway data that occurred every 15 minutes of driving. Excluded were instances in which the headway was greater than 10 s. With this data, two analyses were performed: one with all instances of headway included, and one including only instances of manual headway. Note that there were some driver weeks in which there were no instances of manual headway, either because the driver used ACC or because there were no vehicles close enough for headway data.
All Headway
Overall, drivers using the CAS from Company B did not experience a statistically significant increase or decrease in mean headway over time in the study, p > .05.
Drivers using the CAS from Company A experienced a statistically significant quadratic change over time. Specifically, there was a linear decrease in headway; however, on average, this decrease leveled off. Significance results did not change when removing weeks beyond week 40 to account for the possible influence of a few drivers with manual headway data that far into the study.
The predicted population mean of headway for Company A drivers is estimated as a function of week in study:
Note that this function should only be interpreted within the range of the data. The negative slope term of -.01 s per week (95% confidence interval -.018 to -.001) indicates a decreasing trend in manual headway from the beginning of the study. However, the positive quadratic term of .0002

33
(95% confidence interval .00001 to .00045) indicates that the decrease slows down and stops later into the study. The average headway by week in study can be seen in Figure 22.
Figure 22. Average Overall Driving Headway in Seconds by Week in Study
Although the change in headway reaches statistical significance, the practical significance may be limited. Overall, there may be a slight decrease in mean headway for Company A that levels off within one year of system use.
Manual Headway
Overall, drivers using the CAS from Company B did not experience a statistically significant increase or decrease in mean manual headway over time in the study, p > .05.
Drivers using the CAS from Company A experienced a statistically significant quadratic change over time. Specifically, there was a linear decrease in manual headway, but this decrease leveled off, on average. Significance results did not change when removing weeks beyond week 40 to account for the possible influence of a few drivers with manual headway data that far into the study.
The predicted population mean of manual headway for Company A drivers is estimated as a function of week in study:

34
Note that this function should only be interpreted within the range of the data. The negative slope term of -0.016 s per week (95% confidence interval -0.024 to -0.008) indicates a decreasing trend in manual headway from the beginning of the study, but the positive quadratic term of 0.0003 (95% confidence interval 0.00015 to 0.00057) indicates that the decrease slows down and stops later into the study. The average headway by week in study can be seen in Figure 23.
Figure 23. Average Manual Driving Headway in Seconds by Week in Study
Although the change in manual headway reaches statistical significance, the practical significance may be limited. Overall, there may be a slight decrease in mean manual headway for Company A that levels off within one year of system use.
SPEED
To determine if there was a significant change in speed over time, the mean speed per week for a given driver was calculated, and this mean speed was used as the dependent variable. These means are based on instantaneous sampling of speed data that occurred every 15 minutes. Only instances of highway driving were examined, and instances in which the speed was less than 55 mph were excluded. Drivers equipped with Company A’s CAS had an average speed of 63.41 mph, while drivers equipped with Company B’s CAS had an average speed of 62.21 mph. No significant change was found in this variable over time.

35
BRAKE REACTION TIME
BRT was defined as the amount of time (estimated to the nearest millisecond [ms]) from the onset of the AEB or IA activation to the first instance after the activation in which the brake was depressed. Drivers were considered to have provided a brake response to the activation if they depressed the brake between 200 ms and 5 s after the activation onset. If the first instance of brake depression was prior to 200 ms, drivers were considered to have responded to the precipitating event before recognizing the activation. If the first instance of brake depression was greater than 5 s, drivers were considered not to have provided a brake response to the activation.
Of interest is the probability of a driver responding either to the activation or to the event that precipitated the activation. No significant change was found in this variable over time.
Summary statistics are available in Chapter 7.
DECELERATION
Deceleration was calculated for AEB activations and IAs as the maximum deceleration within 5 s of the activation. There was no significant change of this variable over time.
Summary statistics are available in Chapter 7.
SUMMARY
Headway was found to have a small, statistically significant trend over time. This trend shows a small decrease in headway over the early weeks of participation and a small increase in headway over the later weeks of participation. The magnitude of this change (about 0.25 s) may not be meaningful, as important factors such as driver age, driver experience, traffic conditions, roadway conditions, and weather were not analyzed. Speed, BRT, and deceleration did not exhibit significant trends over time.

36
CHAPTER 5. PROVIDE DATA ON REAL-WORLD CONFLICTS
As part of this research effort, a sample of CAS activations were analyzed in order to determine whether an SCE occurred. The CAS activations that were generated in relation to SCEs can provide valuable information about how real-world conflicts unfold. Accordingly, a series of variables describing driver behavior or the environmental conditions at the onset of activations, based on analysis of video data collected by the miniDAS, were analyzed to assess their possible effects on CAS activations and SCEs.
WEATHER CONDITION
For each CAS activation and LDW alert, the weather condition was analyzed. The weather was coded as Clear/Partly Cloudy, Overcast, Mist/Light Rain, Raining, Fog, Snowing, Snow/Sleet and Fog, or Unknown. Figure 24 shows the percentage of CAS activations prior to an SCE that fell into each weather category. Note that there were no SOAs prior to SCEs, and that there were no AEB, IA, or FDA activations prior to SCEs that took place in fog, snow, or sleet.
Figure 24. Percentages of CAS Activations Prior to SCEs in Various Weather Conditions
LDW alerts were also analyzed in relation to the weather conditions at the onset of each activation. Figure 25 shows the percentage of LDW alerts in response to unintentional lane departures that fell into each weather category. Note that not all vehicles in the study were equipped with LDW cameras.

37
Figure 25. Percentages of LDW Alerts in Response to Unintentional Lane Departures in Various Weather Conditions
LIGHTING CONDITION
For each CAS activation prior to an SCE, the lighting condition was analyzed. The lighting was coded as Daylight, Darkness/Lighted, Darkness/Not Lighted, Dawn, or Dusk. Figure 26 shows the percentages of each type of CAS activation prior to SCEs that fell into each lighting category.

38
Figure 26. Percentages of CAS Activations Prior to SCE in Various Lighting Conditions
LDW alerts were also analyzed to determine the lighting conditions at the onset of each activation. Figure 27 shows the percentage of left and right LDW alerts in response to unintentional lane departures that fell into each lighting category. Note that not all vehicles in the study were equipped with LDW cameras.

39
Figure 27. Percentages of LDW Alerts in Response to Unintentional Lane Departures in Various Lighting Conditions
TRAFFIC DENSITY
For each CAS activation prior to an SCE and LDW in response to unintentional lane departures, the traffic density was analyzed. The density was coded as a level of service A1, A2, B, C, D, E, or F. Level A1 represents free-flow traffic with no lead vehicles. The subsequent levels are progressively more restrictive until reaching Level F, which represents a full breakdown of flow and the formation of queues. Full definitions of these levels of service are in Appendix I. A summary of the percentages of CAS activations prior to SCEs within each level of service can be seen in Figure 28. For LDW alerts in response to unintentional lane departures, the percentages within each level of service can be seen in Figure 29.

40
Figure 28. Percentages of CAS Activations Prior to SCE Within Various Traffic Densities
Figure 29. Percentages of LDW Alerts in Response to Unintentional Lane Departures Within Various Traffic Densities

41
HANDS ON WHEEL
For each CAS activation prior to SCEs and LDW alerts in response to unintentional lane departures, video was used to determine whether the driver’s hands were on the wheel. Because the entire wheel was not always visible on camera, different categories were created to convey the certainty of the assessment. The categories are both hands on wheel, left or right hand only (when other hand is visible off wheel), left or right hand at least (when only visible hand is on wheel), left or right hand off at least (when only visible hand is off wheel), none, none – knees (knees are being used to steady or manipulate the wheel), and unknown. A summary hand location relative to the steering wheel for CAS activations prior to SCE in each activation category can be seen in Figure 30. A summary of how many LDW alerts in response to unintentional lane departures fell into each category can be seen in Figure 31.
Figure 30. Percentages of CAS Activations Prior to SCEs Within each Category of Hands on Wheel

42
Figure 31. Percentages of LDW Alerts in Response to Unintentional Lane Departures Within each Category of Hands on Wheel
DRIVING CONTEXT
Each CAS activation and LDW alert was analyzed to determine the type of action taking place at the onset of the SCE. Several potential situations were identified for each classification before the analysis began. For CAS activations prior to an SCE, LDW alerts in reponse to an unintentional lane departure, and advisory activations, the categories were grouped into five main types: intentional/unintentional lane departures (LDW alerts only), Lead Vehicle Actions, Subject Vehicle Approaching LV, SV Passing LV, and an Other category for situations that did not fit these categories. The category of LV Actions includes the sub-categories of LV braking, LV changing lanes into the truck’s path, and LV changing lanes out of the truck’s path. The category of SV Actions includes the sub-categories of SV passing a decelerating LV, SV passing a constant speed or accelerating LV, SV passing a turning LV, SV approaching a slower LV, and SV approaching a stopped LV. The contexts of CAS activations prior to an SCE are summarized in Figure 32, while the context of advisory CAS activations are summarized in Figure 33. These are provided in order to compare activations in conflict versus non-conflict situations. LDW alerts prior to SCEs were—by definition—unintentional lane departures, and advisory LDWs were intentional lane departures—by definition—in terms of driving context.

43
Figure 32. Contexts of CAS Activations Prior to SCE
Figure 33. Contexts of Advisory CAS Activations

44
DRIVER FOCUS
Reductionists coded the focus of the drivers’ gaze at the onset of sampled CAS activations. This included focus on the forward roadway, internal objects, mirrors, the CAS display, and transitions between locations. Drivers’ focus at the onset of CAS activations prior to SCEs can be seen in Figure 34. Note that there were no SOAs prior to SCEs. While not necessarily conflicts, the focus of drivers at the onset of advisory CAS activations can be seen in Figure 35 for comparison purposes. The focus of drivers at the onset of LDW alerts in response to unintentional lane departures can be seen in Figure 36. While not necessarily conflicts, the focus of drivers at the onset of advisory LDW alerts can be seen in Figure 37 for comparison purposes.
Figure 34. Driver Focus at the Onset of CAS Activations Prior to SCEs

45
Figure 35. Driver Focus at the Onset of Advisory CAS Activations
Figure 36. Driver Focus at the Onset of LDW Alerts in Response to Unintentional Lane Departures

46
Figure 37. Driver Focus at the Onset of Advisory LDW
DRIVER FRUSTRATION
Reductionists also coded whether drivers expressed frustration after the onset of CAS activations, and whether the frustration was directed at the activation. Frustration at the CAS activation was determined to have occurred if drivers looked at or gestured towards the CAS display while expressing annoyance or anger. Figure 38 shows the percentage of CAS activations prior to SCEs where drivers showed frustration. Note that no SOAs were provided prior to SCEs. While not necessarily conflicts, for the purpose of comparison, Figure 39 shows the percentage of advisory CAS activations where drivers showed frustration. For LDW alerts, drivers showed frustration towards the CAS for 3 percent of LLDWs prior to SCEs and 1 percent of RLDWs prior to SCEs. Frustration that was not necessarily directed at the CAS was also observed in 2 percent of LLDWs and 1 percent of RLDWs. Advisory LDWs from either side generally were not associated with frustration in the sampled activations.

47
Figure 38. Observations of Frustration in CAS Activations Prior to SCEs
Figure 39. Observations of Frustration in Advisory CAS Activations

48
PRIOR ACTIVATIONS
Finally, all sampled CAS activations were analyzed to determine how many prior activations of equal or lower priority occurred within 5 s. Recall that activations were sampled based on a hierarchy of priority (See Figure 6). This analysis will show if there were prior activations to which a driver did not respond. Figure 40 shows the percentages of CAS activations prior to SCEs that have 0, 1, 2, or 3 prior activations. Note that there were no SOAs prior to SCEs. While not necessarily conflicts, Figure 41 shows the percentages of advisory CAS activations that had 0, 1, 2, or 3 prior activations for comparison. LDW activations prior to SCEs and advisory LDWs generally were not associated with prior activations.
Figure 40. Percentages of CAS Activations Prior to SCEs With 0, 1, 2, or 3 Prior Activations

49
Figure 41. Percentages of Advisory CAS Activations With 0, 1, 2, or 3 Prior Activations
Summary
Context for the sampled CAS activations prior to SCEs as well as advisory activations were provided in this chapter. Percentages of sampled activations that fell within different weather patterns and lighting conditions were presented. These are heavily influenced by driver exposure to various weather and day/night conditions, which were not tracked in this study. CAS activations prior to an SCE are generally precipitated by an LV action, while advisory CAS activations are generally precipitated by an SV action. In other words, CAS activations due to an LV braking, slowing, turning, etc., are more likely to require an immediate response than CAS activations due to the SV accelerating or passing. Radar-based CAS activations (AEB, IA, FDA) prior to an SCE generally occurred in medium traffic densities, while LDWs prior to SCEs generally occurred in low traffic densities. This may indicate that participants devoted more effort to lane-keeping while in heavier traffic conditions. In a number of CAS activations prior to an SCE, participants were observed to have a single hand on the wheel, particularly in the case of LDW activations. This could be an indication of secondary tasks, which were not always visible in the driver-camera view, or of fatigue, which was not analyzed. Participants were generally looking forward at the time of CAS activations, and generally did not display frustration. Prior activations of equal or lower priority were analyzed. CAS activations prior to SCEs were more likely to have prior activations, and more likely to have a higher number of prior activations.

50
CHAPTER 6. GENERATE INPUTS FOR A SAFETY-BENEFITS SIMULATION MODEL
The naturalistic driving data collected in this study can provide inputs for modeling the safety benefits of CASs based on observation of how actual drivers using the technology react to activations and adapt their behavior accordingly. Data on BRT, decelerations, speeds, and headways will be provided below for AEB activations and IAs, which are the highest priority CAS activations.
BRAKE REACTION TIME
One challenge in modeling the benefits of CASs is determining how quickly drivers react in different situations. Previous studies have been able to describe drivers’ BRT based on naturalistic data (Woodrooffe et al., 2012). However, CASs present drivers with visual and auditory cues, which may affect driver responses. Accurately modeling the benefits of a CAS requires understanding how quickly drivers respond to these cues, and whether drivers respond differently to different kinds of cues.
First, the sampled AEB activations and IAs were broken down into three possible groupings:
1. Events where a BRT did not exist within 5 s of the activation onset;
2. Events where the brake was already being applied at activation onset, or the BRT was less than 200 ms; and
3. Events where the BRT was greater than 200 ms.
The percentages of AEB activations that fell into these groups are shown in Figure 42, while the percentages of IAs that fell into these groups are shown in Figure 43. The upper limit of 5 s was chosen to represent the duration after which the driver was no longer considered to be responding to the event at hand. The cutoff of 200 ms is used to determine whether a driver was responding to the activation, or whether the driver was already in the process of responding when the activation went off. The 200 ms time restriction represents a minimum reaction time for most humans in brake response tasks. Note that due to the sampling hierarchy a driver responding in less than 200 ms could be responding to a prior CAS activation of equal or lower priority. Therefore, reactions that occur in less than 200 ms may still be influenced by the CAS.

51
Figure 42. Percentages of Driver Responses to AEB Activations
Figure 43. Percentages of Driver Responses to IAs

52
For AEB activations, 17 percent of drivers did not have a BRT within the 5-second window. In a majority of AEB activations (72%), drivers were already reacting with the brake at activation onset or had a BRT of less than 200 ms. Finally, only 11 percent had a BRT that fell within the 200 ms to 5 s window. A table of the BRTs between 200 ms and 5 s is presented in Table 10, broken down by whether the activations were prior to SCEs, advisory activations, or false activations.
Table 10. Average BRT After AEB Activation for Each Activation Classification
Event Severity Mean S.D. N Min Lower Quartile Median Upper
Quartile Max
Overall 0.52 0.37 27 0.29 0.34 0.4 0.58 2.22 SCE 0.48 0.18 12 0.31 0.33 0.41 0.64 0.83
Advisory 0.61 0.59 10 0.29 0.34 0.4 0.58 2.22 False 0.45 0.17 5 0.3 0.37 0.41 0.46 0.73
For IA events, 46 percent of drivers did not have a BRT within the 5-second window. Another 37 percent were already reacting with the brake at activation onset. Finally, 17 percent had a BRT that fell within the 200 ms to 5 s window. A table of the BRTs between 200 ms and 5 s is presented in Table 11, broken down by whether the activations were prior to SCEs, advisory activations, or false activations.
Table 11. Average BRT After IA for Each Activation Classification
Event Severity Mean S.D. N Min Lower
Quartile Median Upper Quartile Max
Overall 0.85 0.91 326 0.21 0.34 0.49 0.85 4.96 SCE 0.56 0.4 79 0.21 0.33 0.42 0.65 2.75
Advisory 0.87 0.93 231 0.22 0.34 0.49 0.91 4.96 False 2.03 1.4 16 0.34 0.87 1.58 3.48 4.11
BRAKING DECELERATIONS
In addition to BRTs, models estimating the benefits of CASs must also include how forcefully brakes are applied. Past research has used a constant value of braking for simplicity (Woodrooffe et al., 2012), but drivers may apply the brakes harder or more lightly based on the urgency of the situation. The data in this study may be able to improve the modeling of drivers’ brake application in conflicts in order to estimate the benefits of collision mitigation technology.
As mentioned, AEB activations and IAs were broken down into the following three categories:
1. Events where a BRT did not exist within 5 s of the activation onset;
2. Events where the brake was already being applied at activation onset, or the BRT was less than 200 ms;
3. Events where the BRT was greater than 200 ms.

53
For AEB activations, 17 percent of drivers did not have a BRT within the 5-second window. AEB activations in which drivers were already reacting at activation onset accounted for 72 percent. The average max decelerations for these events is presented in Table 12, broken down by whether the activations were prior to SCEs, advisory activations, or false activations.
Table 12. Average Maximum Decelerations Within 5 s of AEB Onset, When BRT < 200 ms or Brake Depressed At Onset
Event Severity Mean S.D. N Min Lower
Quartile Median Upper Quartile Max
Overall 0.34 0.15 185 0.05 0.24 0.33 0.43 0.85 SCE 0.41 0.14 76 0.1 0.32 0.4 0.47 0.85
Advisory 0.3 0.13 107 0.05 0.21 0.27 0.37 0.6 False 0.28 0.04 2 0.26 NA 0.28 NA 0.31
The remaining 11 percent of AEB activations had a BRT between 200 ms and 5 s. The average max decelerations for these events are presented in Table 13, broken down by whether the activations were prior to SCEs, advisory activations, or false activations.
Table 13. Average Maximum Decelerations Within 5 s of AEB Onset, When BRT > 200 ms
Event Severity Mean S.D. N Min Lower
Quartile Median Upper Quartile Max
Overall 0.28 0.17 27 0.04 0.14 0.24 0.38 0.69 SCE 0.35 0.21 12 0.04 0.16 0.36 0.51 0.69
Advisory 0.21 0.11 10 0.06 0.12 0.21 0.24 0.39 False 0.25 0.1 5 0.14 0.15 0.29 0.32 0.35
For IA events, 46 percent of drivers did not have a BRT within the 5-second window. IA events in which drivers were already reacting at activation onset accounted for 37 percent. The average max decelerations for these events are presented in Table 14, broken down by whether the activations were prior to SCEs, advisory activations, or false activations.
Table 14. Average Maximum Decelerations in g Within 5 s of IA Onset, When BRT < 200 ms or Brake Depressed at Onset
Event Severity Mean S.D. N Min Lower
Quartile Median Upper Quartile Max
Overall 0.24 0.11 680 0.02 0.17 0.23 0.3 0.79 SCE 0.32 0.14 111 0.07 0.23 0.31 0.41 0.79
Advisory 0.23 0.1 554 0.02 0.16 0.22 0.28 0.68 False 0.17 0.09 15 0.02 0.13 0.18 0.23 0.36
The remaining 17 percent of IA events had a BRT between 200 ms and 5 s. The average max decelerations for these events are presented in Table 15, broken down by whether the activations were prior to SCEs, advisory activations, or false activations.

54
Table 15. Average Maximum Decelerations Within 5 s of IA Onset, When BRT > 200 ms
Event Severity Mean S.D. N Min Lower
Quartile Median Upper Quartile Max
Overall 0.22 0.12 326 0.03 0.13 0.2 0.28 0.77 SCE 0.3 0.14 79 0.08 0.21 0.28 0.37 0.77
Advisory 0.2 0.1 231 0.03 0.12 0.19 0.26 0.75 False 0.13 0.08 16 0.06 0.07 0.09 0.2 0.31
SPEED AND HEADWAY
Another important measure that can be validated with the naturalistic data in this study is the speed of commercial motor vehicles. Describing how fast vehicles are driving and the headways that they maintain are key for estimating the safety benefits of CASs. While the speed and headway of drivers have been explored in previous research (Fitch et al., 2014), the CAS may have associated behavioral changes that affect these variables. For example, drivers may rely on the automatic braking capabilities and drive more aggressively when equipped with the CAS technology.
Drivers’ speed at the onset of each AEB activation and IA was analyzed. Table 16 and Table 17 present the mean speeds at the onset of AEB activations and IAs, broken down by whether the activations were prior to SCEs, advisory activations, or false activations.
Table 16. Mean Speeds at Onset of AEB for Each Activation Classification
Event Severity Mean S.D. N Min Lower
Quartile Median Upper Quartile Max
Overall 34.48 19.93 264 7.1 15.34 31.16 54.53 66.98 SCE 30.49 17.31 91 7.1 15.52 25.99 44.24 64.6
Advisory 36.64 20.69 164 7.42 15.3 38.75 57.92 65.62 False 35.51 26.27 9 8.2 14.18 17.67 66.73 66.98
Table 17. Mean Speeds at Onset of IAs for Each Activation Classification
Event Severity Mean S.D. N Min Lower
Quartile Median Upper Quartile Max
Overall 39.85 20.12 1961 0 18.42 45.1 59.36 72.6 SCE 33.08 17.61 205 9.29 17.89 27.1 48.58 70.23
Advisory 40.34 20.33 1624 8.68 17.92 46.13 59.89 72.6 False 44.36 18.93 132 0 29.6 49.61 59.92 71.91
The speed at the onset of each AEB activation and IA event was analyzed. Table 18 and Table 19 present the mean speeds at the onset of AEB activation and IA events, broken down by whether the activations were prior to SCEs, advisory activations, or false activations.

55
Table 18. Mean Headways at Onset of AEB for Each Activation Classification
Event Severity Mean S.D. N Min Lower
Quartile Median Upper Quartile Max
Overall 1.04 0.62 247 0.03 0.5 1.04 1.51 2.69 SCE 1 0.51 84 0.14 0.56 0.95 1.32 2.69
Advisory 1.04 0.66 157 0.03 0.35 1.13 1.57 2.69 False 1.54 0.66 6 0.38 1.1 1.84 1.99 2.08
Table 19. Mean Headways at Onset of IAs for Each Activation Classification
Event Severity Mean S.D. N Min Lower
Quartile Median Upper Quartile Max
Overall 1.41 0.99 1892 0.13 0.6 1.26 1.98 9.95 SCE 1.15 0.65 199 0.18 0.59 1.08 1.51 4.04
Advisory 1.32 0.87 1580 0.13 0.57 1.22 1.92 9.95 False 3.13 1.48 113 0.14 2.2 2.79 3.78 7.55

56
CHAPTER 7. DISCUSSION
The objective of the study was to perform a field test of commercial vehicle collision avoidance systems (CASs) in order to evaluate the viability of the CAS for widespread deployment. This was accomplished via a large-scale naturalistic driving study of commercial vehicle drivers operating CAS-equipped vehicles. The naturalistic data were analyzed in order to investigate the reliability of the CAS activations, investigate driver performance over time, investigate changes in overall driving behavior, collect data on real-world conflicts, and provide potential inputs to safety benefits models of CAS usage. Each of these research objectives is discussed individually.
COLLISION AVOIDANCE SYSTEM RELIABILITY
This study investigated the reliability of commercial vehicle CASs. Overall, companies did not report, for any participating vehicles during their data collection windows, any rear-end crashes of the types CASs are designed to prevent. In all, 6,000 CAS activations were sampled to evaluate CAS reliability. This sample included all AEB activations and IAs from both Company A and Company B. It also included approximately equal sampling of FDAs, SOAs, LDWs from Company A and Company B. There were also no crashes associated with AEB activations or IAs, for which all activation data were analyzed. This may be an indicator that the systems as a whole help prevent crashes, regardless of the reliability of individual activation types. This is also reflected in the surveys of safety managers. While safety managers had mixed responses to most questions about CAS technology on their initial surveys, there was no disagreement with statements that they would recommend the technology for all CMVs in their fleets and would recommend the technology to colleagues in other companies. This was also true in the end-of-study surveys, where all five respondents agreed with the above statements regarding CMV recommendations.
In order to address the reliability of individual activations, 6,000 CAS activations were sampled across all types of activations. AEB is the first type of activation to discuss, as the ability of trucks to automatically brake at any time is a major feature in the current generation of systems. A total of 264 AEB activations were observed in the data, and all of these were selected for further analysis. There was a difference in AEB reliability between the two companies, with Company A having a relatively low percentage of false AEB activations and Company B having a relatively higher percentage of false AEB activations. However, these false AEB activations were, on average, about 0.25 s long, braked with a maximum force of 0.13g, and led to an average 2.25 mph decrease in speed. In general, false AEB activations were not harsh interventions. However, longer AEB activations and more forceful AEB activations were also observed and led to more significant vehicle speed reductions, for which drivers may not be prepared.
A significant portion of AEB activations (68% for Company A and 13% for Company B) were coded as advisory. Advisory activations were in response to a valid vehicle or object in the path of the truck, but at the time of the activation a crash-avoidance maneuver was not deemed necessary. This could be due to drivers already braking at the onset of the activation, an activation that was too early, drivers deliberately getting closer to a lead vehicle before passing, or a number of other reasons. Advisory activations differ from false activations, in which the activation was not triggered by a valid vehicle or object in the path of the truck. Advisory AEB
57
activations may be preventive, but it may not be appropriate to have a physical braking intervention unless absolutely necessary. While AEB activations were infrequent compared to other CAS activations, they are the highest priority intervention and may have a disproportionate impact on drivers’ opinions of the system. Drivers appeared to show frustration toward the CAS more frequently during false AEB activations than during other types of false activations. Additionally, a false AEB activation in wet or icy road conditions could cause additional hazards for drivers. While false AEB activations generally were not harsh, the results of this study show that improvements could be made to improve detection and reduce their prevalence. Additionally, it may be beneficial to improve the timing of AEB so that it goes off only when absolutely necessary. This could be done with improvements to the radar or algorithms, or by adding additional sensors.
The second highest priority activation, IAs, showed similar levels of reliability across both companies. A lower percentage of IAs occurred prior to an SCE and a higher percentage were advisory, which matches the intent of the activation to be lower priority than AEB. However, there were also similar levels of false activations (4% for Company A, 15% for Company B). One important point is that drivers, on average, did not brake as quickly or as hard when responding to IAs than they did when responding to AEB activations prior to SCEs. Allowing drivers more time to respond and with less braking is important, and it is possible that advisory AEB activations should not have “progressed” beyond an IA. Note that 26 percent of advisory AEB activations did not have a prior activation, such as an IA. In these cases, an IA may have been more appropriate, at least until a crash became more likely. If advisory AEB activations were presented as IAs there would be no automatic braking, and the driver would have more control over how to respond to the situation. Video observation of driver frustration towards IAs was lower than towards AEB activations for valid, nuisance, and false activations, again suggesting that the physical intervention of braking should occur only when absolutely necessary.
The lowest priority activations, FDAs, were mostly advisory in the sample. This is in line with the intent of the activation to serve as an initial warning or series of initial warnings for the driver. While FDAs had a relatively low percentage of false activations (3% for Company A, 0.7% for Company B), drivers experienced FDAs more frequently than other radar-based activations, receiving over seven FDAs per hour and four FDAs per hour for Company A and Company B respectively. Combining the rate of FDAs with the false activation percentage indicates that drivers may be experiencing a higher quantity of false FDAs than false IAs or false AEB activations. This may still affect drivers’ perceptions of the system and how they respond to FDA activations. Additionally, there is a question of how many FDA activations are too many. When drivers receive an advisory FDA, the system is tracking valid objects, but it is not clear whether the activation is providing useful information to the driver. If drivers receive too many advisory FDA activations and are already aware of the situation, they may ignore or become desensitized to the activations. One company in the study operated teams of drivers, and excessive FDAs may present a fatigue issue for off-duty drivers trying to sleep in the cab in these team situations.
The final type of CAS activation, SOAs, was mostly false activations across both companies (98% for Company A, 97% for Company B). In the analysis process, it was determined that the major causes for these false activations were overpasses, overhead signs, and curves in the road.

58
In the surveys, safety managers did not seem aware of this issue, and many stated that drivers did not mention issues with the SOA. The color and tone of the SOA’s notification are similar to that of the IA and the AEB activations, and it is possible that drivers did not realize they were receiving a different alert. In most cases, drivers would need to take their eyes off the road and look at the visual display during the SOA in order to tell the difference. The CASs in this study do not brake on SOAs. However, it has been announced that the next generation of AEB systems by Bendix and Meritor WABCO will brake on SOAs. A benefit of this study is that the results can inform the development of newer SOA algorithms. If the issues with false activations in general, and false SOAs in particular, are not addressed, there may be an effect on driver acceptance and the ability of companies to use CAS data to monitor driver performance.
LDW alerts, which do not use the forward radar, but rather a windshield-mounted camera, were also sampled to evaluate reliability. The frequency of LDWs was different between the two companies, with Company A’s CAS averaging 2.45 LDWs per hour and Company B’s CAS averaging about 14.4 LDWs per hour. Several factors that could affect LDWs, such as individual driver performance, exposure to construction zones, the amount of time driving in low-density traffic (where LDWs are more prevalent), and exposure to snow (which can obscure lane markings or cause false LDWs) could explain this difference. A majority of LDWs were advisory, but many of these were due to drivers failing to use their turn signals. Considering the low rate of false LDWs, it may be valuable for safety managers to track LDWs to look for unintentional lane departures and violations of company policies regarding turn signal use. LDWs may also be a potential issue for team operations. They occur relatively frequently and are meant to mimic the sound of rumble strips, which may be disruptive to an off-duty driver sleeping in the cab.
When separating left and right LDWs, Company A showed a small difference between the two. More RLDWs than LLDWs occurred in response to unintentional lane departures. This could again be related to construction zones, traffic conditions, weather, or other factors. LLDWs and RLDWs were similar in terms of reliability for Company B’s CAS.
False activations were observed across all activation types and both brands of CAS in the study. Both CAS manufacturers were made aware of the false activations and were consulted to determine the potential causes. Two potential causes internal to the CAS were identified: an older algorithm that required a software update and misaligned radar that required calibration. This highlights the importance of maintaining CAS systems. The vibration, weather, and wear that CAS systems are exposed to on heavy vehicles are significant, and drivers may go many miles between maintenance activities on their trucks. The CASs are generally installed at the factory new, and companies may not have the tools or expertise to maintain the systems on their own. Some companies in the study leased their trucks, and maintenance on the CASs was performed at the lessor’s locations. Trucks may not visit the lessor’s shops frequently, and companies may need to decide if maintenance on the CAS justifies pulling a vehicle out of service. Finally, all trucking companies in the study had purchased their participating vehicles new from the factory or were leasing new vehicles. Maintenance on these systems was generally performed in-house or by the lessor via contract. If an individual or small company purchases a used CAS-equipped truck, CAS maintenance may be performed differently compared to how it was handled by the companies in the study. The life cycle of CASs beyond the first user is not yet well defined, and maintenance may be an important issue for secondary users.

59
Additional false activations resulted from the radar tracking an object that was not in the path of the vehicle. These objects were generally above the vehicle on a straight road (e.g., an overpass), or outside the path of the vehicle on a curved road (e.g., a road sign). These scenarios could be included in testing procedures in order to reduce their prevalence in future CAS designs. The rate of false activations suggests that the technology of threat detection in CASs could be improved. Improvements could come in the form of better sensors, additional sensors, or better algorithms. All of these areas are under development by the CAS manufacturers. The next generation of CASs will feature improved radars that operate within new frequencies (Meritor WABCO, 2015), multiple sensors that must agree on threat detection (Bendix Commercial Vehicle Systems, 2015), and improvements from previous software updates. Further research is necessary to determine if these solutions will address the issues described above, but CAS manufacturers are taking innovative approaches to improve reliability.
ASSESSING DRIVER PERFORMANCE OVER TIME
The rates at which drivers receive activations were analyzed to assess driver performance over time. The analysis showed that the most common activations received by drivers were FDAs (7.2 per hour for Company A, 4.29 per hour for Company B) and LDW alerts (2.44 per hour for Company A, 14.48 per hour for Company B). As the analysis of sampled activations shows, only a small percentage of FDA and LDW alerts occur prior to an SCE. This means that drivers are receiving many advisory activations per hour that may not require an immediate response. FDAs from Company A were 97 percent advisory and drivers, on average, experienced 6.98 (0.97 x 7.2) advisory FDAs per hour. FDAs from Company B were 99 percent advisory and drivers, on average, experienced 4.25 (0.99 x 4.29) advisory FDAs per hour. Similarly, LDWs for Company A were 79 percent advisory and drivers, on average, experienced 1.85 (0.75 x 2.44) advisory LDWs per hour. LDWs for company B were 65 percent advisory and drivers, on average, experienced 9.41 (0.62 x 14.48) advisory LDWs per hour. This is not necessarily a bad thing, as advisory LDWs can be the result of drivers not using their turn signals when they should be. Based on the reduction of video data, 34% of advisory LDWs were caused by “Driver changes lanes without signaling”. Conflicts can also arise quickly on the road if a driver is not paying attention, and advisory FDAs can remind drivers about their following distance to give them sufficient time to respond. However, drivers may also become annoyed by frequent advisory activations, and choose to ignore activations if they do not feel they are useful. In addition, frequent advisory activations could be disruptive for team operations that rely on the sleeper berth while driving. CAS manufacturers may want to carefully factor in drivers’ user experience in the presentation of advisory activations.
After investigating the overall rates of activations, the data were analyzed for any changes in the rates of activations individual drivers received over time. There do not appear to be any trends in the activation rates over time that would be applicable to the general population. The changes in FDAs over time included high variability between drivers, and there are a number of confounding factors that cannot be accounted for in the data, including gender, age, driving experience, CAS experience, type of route, and training levels of drivers. It is possible that trends exist within subgroups related to these factors, but analyses of this nature were not conducted as part of this research effort.

60
ASSESSING OVERALL DRIVING BEHAVIOR
An analysis was performed on participating drivers’ average speeds, headways, brake reaction times, and decelerations to determine if their driving behavior changed over time. Headway analysis was restricted to periods with an LV present and a headway of less than 10 s. The analysis was performed first with any ACC usage included and second with ACC usage excluded. Headway including ACC usage showed a statistically significant change, decreasing, on average, by about 0.2 s over the first 20 weeks, then increasing, on average, by about the same amount over weeks 21-40, returning to its original value. While this change was statistically significant, it may not be meaningful and does not account for traffic conditions, weather, location, driver experience, or other potential headway-affecting factors. A similar trend with slightly lower headways across the duration of the study was found when ACC usage was excluded.
Analyses of speed, BRT, and deceleration showed no statistically significant changes over time. Speed analysis was restricted to periods of highway driving of over 55 mph. On average, drivers using Company A’s CAS traveled 63.4 mph and drivers using Company B’s CAS traveled 62.2 mph; these values did not change over time. BRT analysis included only reaction times between 200 ms and 5 s, as anything less than 200 ms is faster than human reaction time, and anything over 5 s is likely not a reaction to the activation. On average, drivers had a BRT of 0.52 s to AEB activations and 0.85 s to IAs; this value did not change over time. Finally, drivers exhibited an average maximum deceleration (when reacting after 200 ms) of 0.28g in response to AEB activations and an average 0.2g in response to IAs. Again, these values did not change over time.
PROVIDE DATA ON REAL-WORLD CONFLICTS
Reductionists coded a number of SCE-related variables, which can shed light on the circumstances that lead to conflicts. In particular, the data show how CAS activations may be associated with the onset of conflicts, and with driver behavior after conflicts. While a number of variables were analyzed, only the following were presented in the results: lighting, weather, traffic density, LV activity, SV activity, driver focus, driver frustration, prior CAS activations, and hands on wheel.
The results for lighting and weather showed that most conflicts took place in daylight and clear weather. Darkness without lighting and overcast were the second most likely conditions for a conflict occurrence, and could represent an increased risk of conflict. However, without information about the time spent driving at night or in bad weather, it is not possible to conclude this with any certainty.
When looking at conflicts based on traffic density, there appears to be a difference in when CAS activations occur and when LDW alerts occur. CAS activations prior to SCEs are more likely to take place in medium traffic densities, where traffic is not free-flow but there is limited space for vehicles to maneuver. LDW alerts in response to unintentional lane departures are more likely to take place in low traffic densities, where traffic is free-flow and cars are less likely to be in adjacent lanes. These results show that drivers are behaving differently based on their surrounding traffic conditions. SV or LV maneuvers are more likely to cause a conflict in medium traffic densities as compared to low traffic densities, while drivers may be regulating

61
their behavior in high-density conditions and avoiding these maneuvers. Similarly, drivers may be more attentive to their lane-keeping in medium- and high-density conditions, while focusing less on this task in low-density conditions.
There are two interesting issues raised by the traffic density analysis. First, the ability to manually or automatically adjust the CAS’s parameters to meet traffic conditions may enhance the driver experience. Second, a mismatch between a driver’s perception of traffic conditions and the actual traffic conditions could be a cause of conflicts. If a CAS can help inform drivers of changes in traffic conditions through activations, it may be valuable in modifying driver behavior in situations with high risks of conflict.
Sampled CAS activations were also categorized based on the general cause of the activation, such as an LV braking, an SV passing a slower vehicle, or an SV following too closely. The results showed that activations prior to SCEs were more often the result of LV actions (60% to 83%, depending on type of activation). This result aligns with previous research into the causes of conflicts between CMVs and light vehicles, which found that 78 percent of conflicts were the result of light vehicles’ actions (Hanowski, Hickman, Wierwille, & Keisler, 2007). Conversely, advisory activations were more often the result of SV actions (67% to 85%, depending on type of activation). For example, a situation where the SV is traveling at a constant speed and the LV brakes is more likely to require a crash-avoidance response than if the LV is traveling at a constant speed and the SV is accelerating. The overall results indicate that the context of the SV’s and LV’s driving conditions as discussed above may be useful in determining the priority of the activation presented to the driver.
The focus of drivers’ gaze at the onset of sampled forward-radar activations was also analyzed. When an activation occurred prior to an SCE, drivers were nearly always looking forward. Drivers may not have been responding properly at the activation’s onset, but did appear to be aware of what was unfolding in front of the vehicle. When an activation was advisory or false, drivers were still generally looking forward, but there was a greater chance that they were looking at one of the mirrors, transitioning between locations, looking at an internal object, or looking at the CAS display. The advisory and false distributions are most likely the result of drivers’ normal scanning patterns, but the percentage of mirror focus occurrences may also be related to drivers preparing to pass an LV.
Data analysis included driver frustration assessment for each sampled CAS activation. This was a subjective assessment. Reductionists coded whether or not drivers appeared to show frustration and whether they were looking at the CAS or gesturing towards the CAS while doing so. For activations prior to an SCE, drivers did appear to show frustration a portion of the time. For AEB activations, IAs, and FDAs prior to an SCE, most instances of observed frustration did not appear to be directed at the CAS. Advisory CAS activations resulted in lower percentages of general frustration. False forward-radar activations resulted in the highest chances of CAS-related frustration. Specifically, false AEB activations resulted in frustration towards the CAS 11 percent of the time. This highlights the importance of minimizing false activations, as drivers expressing frustration toward the CAS may not trust its issued warnings.
As described earlier, a hierarchy was used to determine the highest priority activation on which to base sampling. While the highest priority activation was used to generate a sampled event, the
62
numbers of prior activations of equal or lesser priority were also recorded for analysis. Nearly all AEB activations prior to SCEs had at least one prior activation, which means drivers generally experienced a progression of activations before an AEB event. About half of IAs and FDAs prior to SCEs were preceded by at least one activation. Note that this does not indicate the duration of prior activations or whether there were any gaps between the prior activations and the sampled activation. Advisory AEB activations were still likely to get a progression of activations, while most advisory IAs, FDAs, and SOAs did not have prior activations. False activations showed a similar pattern, with false AEB activations still likely having a progression of false activations and a majority of false IAs, FDAs, and SOAs having no prior activations.
GENERATE INPUTS FOR A SAFETY BENEFITS MODEL
The naturalistic driving data were analyzed in order to provide insight that could refine safety benefits models of CAS technology. First, speed and headway were characterized at the onset of AEB activations and IAs. Second, BRT and maximum decelerations were characterized immediately after AEB activations and IAs.
While the results did not show that speed or headway change over time, the naturalistic data collected in this study can still be used to model the speeds and headways at the point that drivers receive activations. In any given conflict where there is an activation, the speed and headway set the initial conditions, after which the driver’s response may change. The distributions provided represent the speeds and headways in actual situations where an activation was generated and a crash-avoidance response was required. Note, however, that prior activations may have influenced the driver’s behavior and that the driver could already be responding to the activation in some way that is insufficient or inappropriate (i.e., only taking their foot off the gas or not braking hard enough).
The results for BRT showed that in a majority of non-false AEB activations and many non-false IAs, drivers were already applying the brake at the onset of activations. This matches previous results showing that drivers’ eyes were usually on the road at the onset of activations, and may indicate that drivers are usually aware of unfolding events, even if they are not responding appropriately. Examining only times when drivers responded to activations, the BRT was found to be faster for activations prior to SCEs as compared to advisory activations, and faster for AEB activations as compared to IAs. Similarly, the decelerations were greater for activations prior to SCEs as compared to advisories, and greater for AEB activations compared to IAs. This shows that drivers were responding faster, and with harder braking, to more urgent activations. Accordingly, models could include drivers’ ability to change their responses to severity when using BRT and deceleration as inputs.

63
CHAPTER 8. CONCLUSION
This study sampled 6,000 CAS activations from over 3 million miles and 110,000 hours of naturalistic data in order to evaluate the reliability of those activations. No sampled activations were associated with collisions, and companies did not report any rear-end collisions involving the vehicles in the study. However, this study did not identify SCEs outside of the sampled 6,000 activations. AEB activations and IAs occurred more frequently when a driver response was required, while FDAs generally alerted drivers to the potential of a conflict. Though the systems as a whole appeared to have a safety benefit, false activations were also observed. False AEB activations were much shorter, on average, as compared to other AEB activations, but could still frustrate or annoy drivers. SOAs were mostly false activations, which could be addressed with new testing procedures that include overhead objects and curved roads.
Drivers experienced multiple FDA and LDW alerts per hour, on average, which may be disruptive to team operations and may annoy drivers. However, these activations are generally advisory in nature and are still potentially useful. This balance between informing and annoying drivers must be considered when designing the sensitivity of CAS technology. Drivers were not observed to change their driving behavior in meaningful ways over the course of the study. This includes changes to the rates of various activations and measures of driving behavior such as speed, headway, BRT, or deceleration. Further investigation into specific populations of commercial vehicle drivers may yield more information about the behavioral effects of CAS technologies.
The CAS activations data collected in this study can be used to refine CAS benefits models with naturalistic driving data. The contexts of the sampled activations may also provide data on when CAS activations are most useful to drivers. In addition, information gathered for this study may be useful for demonstrating the most common activation-generating scenarios during CAS driver training. The data may be useful for modeling new strategies for activations in order to improve the user experience as well.
Overall, CAS technologies show potential for significant safety benefits for commercial vehicle drivers. However, refinements to the technology could be implemented to address potential issues with false activations. Testing procedures for curved roads and overhead objects could help reduce false activations and improve the reliability of individual components of the CAS technology.

64
CHAPTER 9. LIMITATIONS
While the naturalistic data collected in this study provide many important insights into CAS technology, there are several limitations to this research effort that must be addressed. First, companies in the study were of different sizes, were located in different regions of the United States, hauled different materials, and were a mix of day trip, long haul, and slip seat operations. Efforts were made to include owner-operators in the study, as they represent a major segment of the trucking industry; however, no owner-operators agreed to join the study. The companies had different past experiences with CAS technology, used the data from CAS technology in different ways, and provided different CAS technology training. These factors could greatly affect the safety managers’ opinions towards the technology, activation rates observed, and drivers’ overall performance.
Second, the study investigated performance by sampling activations of each type and evaluating their reliability. The study did not search for SCEs outside of this sample, and did not evaluate the potential for missed opportunities within the CAS technology.
Third, the study was limited to investigating performance data and did not survey participating drivers. Drivers were not directly questioned about their driving history, experience with CAS technology, or understanding of the CAS’s operation. Instead, this information was inferred by surveying their fleet safety managers. Thus, the opinion data reflect a tempered perspective of the technologies’ effectiveness across a fleet.
Fourth, the two brands of CAS that were included in this study have small but important differences in their operation. Some of these differences were simplified for analysis, such as combining multiple levels of Bendix Wingman Advanced FDAs into a single type of activation. Each brand has multiple calibration settings, which can affect how the system operates. In interviews with safety managers, companies were not always aware of the different system settings or even which settings were on their trucks. There were differences in the interfaces through which each brand presented activations (integrated in the dash versus after-market center console). There was also a software update to the Meritor WABCO OnGuard system, which most OnGuard -equipped vehicles in the study did not receive.
Fifth, drivers did not participate in the study for equal lengths of time. Many drivers left the study early due to changes in routes or employment. Replacement participants, either in the same vehicle or an equivalent vehicle, were not always available. Additionally, participants were not always able to meet for scheduled maintenance or to fix technical issues, leading to gaps in some individuals’ data. This issue limited the scope of analyses that could examine driver performance over an extended period of time.
Sixth, the study evaluated two products that were available on the market starting in 2013. Several new products, including products from the companies participating in this study, are in development or came to market after data were collected in this study. These products include new components, algorithms, or features that were not part of the systems in this study. However, the insights generated by this research may still be useful in understanding the benefits of the next generation of CAS technologies.

65
Finally, the study did not involve a control group with which to compare results. The participants in the study did not drive a vehicle without CAS technology during data collection, nor were any data collected from vehicles without CAS technology.

66
APPENDIX A. CAS ACTIVATIONS
Triggers used to identify activations in Meritor WABCO-equipped trucks
Variable Criteria
ABS Activation SPN 563 - ABS Active - signal is 1, “ABS Active”
ABS Operational SPN 1243 - ABS Fully Operational - signal is 0, “Not fully operational”
ACC Activation
SPN 1590 - Adaptive Cruise Control Mode - signal is 2, “Distance Control Active”, 4, “Hold Mode”, or 5, “Finish Mode”.
ACC Operational
SPN 1590 - Adaptive Cruise Control Mode – signal is 6, “Disabled or error condition”
ATC Activation SPN 562 - ASR Brake Control Active - signal is 1, “ASR brake control active”
ATC Activation
SPN 561 - ASR Engine Control Active - signal is 1, “ASR engine control active”
ATC Operational
SPN 562 - ASR Brake Control Active signal is 3, “Not Available”, or SPN 561 - ASR Engine Control Active signal is 3, “Not Available”
FDA SPN 1796 - ACC Distance Alert Signal - signal is 1, “ACC DAS Active” and SPN 1590 – Adaptive Cruise Control Mode signal is 0, “Standby”
SOA SPN 5676 - Advanced Emergency Braking System State - signal is 5, “Collision
Warning Active” and SPN 1798 – ACC Target Detected – signal is 0, “No Targets Detected”
IA (R) SPN 5676 - Advanced Emergency Braking System State - signal is 5,
“Collision Warning Active” and SPN 1798 – ACC Target Detected – signal is 1, “Target Detected”
IA with Haptic
Warning
(R) SPN 5676 - Advanced Emergency Braking System State - signal is 6, “Collision Warning with Braking”
CMB Active
(R) SPN 5676 - Advanced Emergency Braking System State - signal is 7, “Emergency Braking Active”
CMB Operational
(R) SPN 5676 - Advanced Emergency Braking System State - signal is 14, “error”

67
ESC Active SPN 1819 - YC Brake Control Active - signal is 1, “YC brake control active”
ESC Active SPN 1817 - YC Engine Control Active - signal is 1, “YC engine control active”
ESC Operational
SPN 1819 - YC Brake Control Active signal is 3, “Not Available” or SPN 1817 - YC Engine Control Active signal is 3, “Not Available”
LLDW SPN 1700 – “Lane Departure Imminent, Left Side” is 1, “Imminent”
RLDW SPN 1701 – “Lane Departure Imminent, Right Side” is 1, “Imminent”
RSC Active SPN 1818 - ROP Brake Control Active - signal is 1, “ROP brake control active”
RSC Active
SPN 1816 - ROP Engine Control Active - signal is 1, “ROP Engine Control Active”
RSC Operational
SPN 1818 - ROP Brake Control Active signal is 3, “Not Available” or SPN 1816 - ROP Engine Control Active signal is 3, “Not Available”
Triggers used to identify activations in Bendix-equipped trucks
Trigger What We Look For
ABS Activation SPN 563 - ABS Active - signal is 1, “ABS Active”
ABS Operational SPN 1243 - ABS Fully Operational - signal is 0, “Not fully operational”
ACC Activation SPN 1590 - Adaptive Cruise Control Mode - signal is 2, “Distance Control Active”
ACC Operational SPN 1590 - Adaptive Cruise Control Mode – signal is 6, “Disabled or error condition”
ATC Activation
SPN 562 - ASR Brake Control Active - signal is 1, “ASR brake control active”
SPN 561 - ASR Engine Control Active - signal is 1, “ASR engine control active”
ATC Operational SPN 562 - ASR Brake Control Active signal
or SPN 561 - ASR Engine Control Active signal is 3, “Not Available”
Collision Level One Proprietary Bendix Variable reports a FDA level 1
Collision Level Two Proprietary Bendix Variable reports as FDA level 2

68
Collision Level Three Proprietary Bendix Variable reports as FDA level 3
Collision Mitigation Braking Active Proprietary Bendix Variable reports as CMB active
Collision Mitigation Braking Operational (R) SPN 5676 - Advanced Emergency Braking System State - signal is 14, “error”
Impact Alert Proprietary Bendix Variable reports as IA Stationary Object Alert Proprietary Bendix Variable reports as SOA
ESC Active SPN 1819 - YC Brake Control Active - signal is 1, “YC brake control active”
ESC Active SPN 1817 - YC Engine Control Active - signal is 1, “YC engine control active”
ESC Operational SPN 1819 - YC Brake Control Active signal
or SPN 1817 - YC Engine Control Active signal is 3, “Not Available”
Left Lane Departure SPN 3565 - Lane Departure Left - signal is 1, “Middle of the vehicle departs the lane to the
left side”
Right Lane Departure SPN 3566 - Lane Departure Right - signal is 1, “Middle of the vehicle departs the lane to
the right side”
RSC Active SPN 1818 - ROP Brake Control Active - signal is 1, “ROP brake control active”
RSC Active SPN 1816 - ROP Engine Control Active - signal is 1, “ROP Engine Control Active”
RSC Operational SPN 1818 - ROP Brake Control Active signal
or SPN 1816 - ROP Engine Control Active signal is 3, “Not Available”

69
APPENDIX B. ACTIVATION CATEGORIES Severities of Safety-Critical Events and their operational definitions
Severity Operational Definition
Crash Any contact with an object, either moving or fixed, at any speed in which kinetic energy is measurably transferred or dissipated, and includes other vehicles, roadside barriers, objects on or off of the roadway, pedestrians, pedal cyclists, or animals. All severe and minor crashes are included in this category.
Near-Crash
Any circumstance requiring a rapid, evasive maneuver by the SV, or any other vehicle, pedestrian, pedal cyclist, or animal to avoid a crash. A rapid, evasive maneuver is defined as a steering, braking, accelerating, or any combination of control inputs that approaches the limits of the vehicle capabilities. As a guide: SV braking >0.5 g or steering input that results in a lateral acceleration >0.4 g to avoid a crash constitutes a rapid maneuver.
Crash-Relevant
Any circumstance requiring a crash avoidance response on the part of the SV, any other vehicle, pedestrian, pedal cyclist, or animal that is less severe than a rapid evasive maneuver, but greater in severity than a “normal maneuver” to avoid a crash. The crash avoidance response can include braking, steering, accelerating, or any combination of control inputs. A crash avoidance response for the SV is defined as a control input that falls outside of the 99 percent confidence limit for control input as measured for the same subject.
Unintentional Lane Deviation
Any single-vehicle situation where the subject vehicle unintentionally drifts or crosses over a lane line (e.g., into the shoulder or adjacent lane) where there is NOT a hazard present (e.g., guardrail, steep ditch, vehicle, etc.) or the hazard is never closer than 1 lane width to the subject. If the hazard is closer than 1 lane width away, the event should be classified as a Crash Relevant, Near Crash, or Crash as appropriate.

70
APPENDIX C. DATA DICTIONARY FOR ANALYSIS OF SAMPLED CAS ACTIVATIONS
Variable Name Variable Definition
Subject Number All consented drivers (primary and secondary) are assigned a unique numeric ID number, which can be used for cross-referencing demographic information, etc.
Conflict Begin
The point in the video when the sequence of events defining the occurrence of the incident, near-crash, or crash begins. Defined as the point at which the Precipitating Event begins (see Precipitating Event [V7]). Value is a timestamp, in milliseconds after the start of the file. NOTE 1: For road departures with no other associated event types, the conflict begins when the vehicle first starts to move (or drift) towards the edge of the road in "going straight" scenarios OR begins the maneuver that ultimately leads to the road departure (e.g., left or right turn, entering parking space). This maneuver is also the Precipitating Event even though it did not begin until the Conflict Begin time. NOTE 2: For cases in which the origin of the Precipitating Event is not visible in the video (e.g., "Other vehicle ahead - stopped on roadway more than 2 seconds" or "Pedestrian in roadway"), the start point for the Precipitating Event would be when the event is first visible in the forward view of the subject vehicle. NOTE 3: For Baseline events, the Conflict Begin is defined as 1 second (1,000 timestamps) prior to the end of the baseline epoch.
Subject Reaction Start
The timestamp, in milliseconds after the start of the file, when the driver is first seen to recognize and begin to react to the safety critical incidents occurring. Defined as the first change in facial expression to one of alarm or surprise or the first movement of a body part in a way that indicates awareness and/or the start of an evasive maneuver, whichever occurs first. In most cases, this occurs before Impact or Proximity Time, but Subject Reaction Start can be coded after the time of impact in low-risk tire strikes if the driver is acting to prevent a worse collision and for certain rear-end, struck (or similar) collisions if the driver is acting to prevent a second (e.g., rear-end, striking) incident.
Conflict End
The timestamp in the video, milliseconds from the start of the file, when the sequence of events defining the occurrence of the incident, near-crash, or crash ends. Defined as the point at which final evasive maneuvers have been completed and all vehicles, objects, pedestrians, animals, etc., involved have either stopped or returned to normal patterns of road use, whichever occurs first.

71
Variable Name Variable Definition
Pre-Incident Maneuver
This represents the last type of action or driving maneuver that the subject vehicle driver engaged in or was engaged in just prior to or at the time of the Precipitating Event, beginning anywhere up to 5 seconds before the Precipitating Event (V7). This variable is independent of the driver's engagement in secondary tasks and the Precipitating Event, but should be determined after the precipitating event is defined. It is a vehicle kinematic measure--based on what the vehicle does (movement and position of the vehicle), not on what the driver is doing inside the vehicle. For Baselines, this is the action or driving maneuver that the subject is engaged in immediately before (or up to 5 seconds before) the baseline anchor point (Conflict Begin, V2), which occurs 1 second before the end of the baseline event. NOTE: For road departures, Pre-Incident Maneuver is coded somewhat differently. In these cases, Pre-incident Maneuver is instead coded as that maneuver that ultimately led to the road departure, even though that maneuver begins at Conflict Begin instead of being in progress before it. This allows the Precipitating Event to be coded as "road departure" while still providing the context of the maneuver.
Maneuver Judgment
Judgment of the safety and legality of the Pre-Incident Maneuver (V6). This is a vehicle kinematic measure-based on what the vehicle does, independent of the driver's engagement in secondary tasks and the Precipitating Event (V8). (E.g., Driving while texting on a cell phone may not be safe or legal, but it is not a consideration in this variable.) Although the determination of whether the maneuver is safe or unsafe is situation-dependent, the position of the vehicle itself is the main determinant of this factor, and a maneuver may or may not be safe, depending on the vehicle position.

72
Variable Name Variable Definition
Precipitating Event
The state of environment or action that began the event sequence under analysis. What environmental state or what action by the subject vehicle, another vehicle, person, animal, or non-fixed object was critical to this vehicle becoming involved in the crash or near-crash? This is a vehicle kinematic measure (based on what the vehicle does--an action, not a driver behavior). It does not include factors such as driver distraction, fatigue, or disciplining a child. This is the critical event which made the crash or near-crash possible. It may help to use the "but for" test; "but for this action, would the crash or near-crash have occurred?" This is independent of fault. For example, Vehicle A is speeding when Vehicle B crosses Vehicle A's path causing a crash, the Precipitating Event would be Vehicle B crossing Vehicle A's path. If two possible Precipitating Events occur simultaneously, choose the event that imparted the greatest effect on the crash or near-crash. If more than one sequential event contributed to the crash or near-crash, determination of which is the Precipitating Event depends upon whether the driver had enough time or vehicular control to avoid the latter event. If the driver avoids one event and immediately encounters another potentially harmful event (with no time or ability to avoid the latter), then the Precipitating Event is the first obstacle or event that was successfully avoided (this is where the critical envelope begins, and is the reference point for the other variables). If the driver had ample time or vehicular control to avoid the latter event, then that latter event would be coded as the Precipitating Event (the critical envelope would begin here, and all other variables would be coded based on this event). Note that a parking lot is considered a roadway--thus a barrier or light pole in the parking lot would be considered an object in the roadway.
Vehicle 1 (Subject),2,3 Configuration
A numerical designation of the role and configuration of the vehicle or other non-motorists or objects at the time of their first involvement in the sequence of events. Configurations are depicted in Figure 1 at the beginning of this dictionary and in the Accident Types chart in GES (2014). Vehicle 1 is the subject vehicle, Vehicle 2 is the first other vehicle involved in the study, and vehicle 3 is the last vehicle to become involved. If more than 3 vehicles are involved, code the three vehicles at greatest risk.

73
Variable Name Variable Definition
Event Nature 1,2
Identifies the other objects of conflict (e.g., lead vehicle, following vehicle) for the crash or near-crash, or safety-related incident that occurred. If multiple Event Natures apply list them in sequential order by time. If more than 2 apply, select the two most severe (most harmful or potentially most harmful). Determination of the nature of the event and the envelope surrounding it will lead to the determination of other variables such as pre-incident maneuver (V5) and precipitating event (V7). (Example 1: Subject vehicle that rear-ends a lead vehicle may then be rear-ended by a following vehicle. 1 = Conflict with lead vehicle; 2 = Conflict with following vehicle. Example 2: Subject vehicle avoids rear-ending a lead vehicle (near crash) by steering off the road into a ditch (a crash). 1 = Conflict with lead vehicle; 2 = Single vehicle conflict. Figures 1 and 2 in the Research Dictionary for Video Reduction Data should be referenced when coding this variable.
Incident Type 1,2
Identifies the type of conflicts that the subject vehicle has with other objects of conflict for the most severe type of crash, near-crash, or safety-related incident that occurred. If multiple Incident Types apply, list them in sequential order by time, correlating with the Event Natures listed in Variables 11 and 18. If more than 2 apply, select the two most severe (most harmful or potentially most harmful). For categories not involving pedestrians, pedal cyclists, or animals, the orientation of the vehicles is also indicated. However, unless the subject vehicle is specified, "vehicle" may refer to any vehicle involved in the event. (Example 1: A subject vehicle that rear-ends a lead vehicle may then be rear-ended by a following vehicle. 1 = Rear-end, striking; 2 = Rear-end, struck. Example 2: Subject vehicle avoids rear-ending a lead vehicle (near crash) by steering off the road into a ditch (a crash). 1 = Rear-end, striking (the near crash); 2 = Run-off-road (the crash). Figures 1 and 2 in the Research Dictionary for Video Reduction Data should be referenced when coding this variable.
Event Severity 1,2 General term describing the outcome of the event/incident types listed. Denotes the outcome of each event/incident type as a Crash, Near Crash, Crash Relevant, Non-Conflict, or Non-Subject Conflict. For Baselines, only one variable is listed, and it is coded Baseline.

74
Variable Name Variable Definition
A ranking of crash severity for the referenced event/incident types based on the magnitude of vehicle
Crash Severity 1,2 dynamics, the presumed amount of property damage, knowledge of human injuries (often unknown in this dataset) and the level of risk posed to the drivers and other road users. This variable is coded only for events that include a Crash.
Impact or Proximity Time 1,2
The timestamp, in milliseconds after the start of the file, when the subject vehicle and other object of conflict first make impact for the portion of the event (1 or 2) in question. In the case of a near crash, this is the timestamp when the subject vehicle and other object of conflict are at their closest distance to each other. If only one Event Type occurs, Impact or Proximity Time 2 is left blank. Impact or Proximity Times are always after Conflict Begin but prior to Conflict End. When Event Severity = Unintentional Lane Deviation, this value is the timestamp of the most severe point in the Lane Deviation.
V1 Evasive Maneuver 1,2
The subject driver's reaction or avoidance maneuver (if any) in response to the event/incidents coded in Variables 12-15 and 18-21. This is independent of maneuvers associated with or caused by the resulting crash or near-crash. This is a vehicle kinematic measure--based on what the vehicle does.
Ability of subject vehicle driver to maintain control of the vehicle during evasive maneuvers, if any. V1 Post-Maneuver Consider the time between the start of the evasive maneuver and either Conflict End or start of the
Control 1,2 evasive maneuver for the second Incident Type (if any), whichever is first. Subject's level of vehicle control prior to the evasive maneuver or after impact should not be considered.
Airbag Deployment An indication of whether the driver side airbag or any other airbag in the vehicle was deployed during the crash. If Yes, the event is also classified as a Level 1 Crash in Crash Severity.
Vehicle Rollover An indication of whether the subject vehicle rolled over during the crash. If Yes, the event is classified as a Level 1 Crash in Crash Severity.
also

75
Variable Name Variable Definition
Driver Behavior 1,2,3,4
Driver behaviors (those that either occurred within seconds prior to the Precipitating Event or those resulting from the context of the driving environment) that include what the driver did to cause or contribute to the crash or near-crash. Behaviors may be apparent at times other than the time of the Precipitating Event, such as aggressive driving at an earlier moment which led to retaliatory behavior later. If there are more than 4 behaviors present, select the most critical or those that most directly impact the event as defined by event outcome or proximity in time to the event occurrence. Populate this variable in numerical order. (If there is only one behavior, name it Behavior 1; if there are two, name them Behaviors 1 and 2.) NOTE: that the Driver Behavior category "Distracted" is only used for Critical Event analysis in cases where a secondary task (V34, V38, V42, V46) is believed to have contributed to the event. The Distracted category is omitted from Baseline analysis.
Driver Impairments Possible reasons for the may be assigned.
observed driver behaviors, judgment, or driving ability. More than one category
Front Seat Passengers
The number of human occupants present in the front seat of the subject vehicle at the time of the event, including the driver. Zero passengers means the vehicle has no human occupants in the front seats. Number of passengers is observed from the cabin snapshot taken closest in time to the event, if available, and from subjective analysis of the video and driver behaviors if suitable snapshots are not available.

76
Variable Name Variable Definition
Rear Seat Passengers
The number of human occupants present in the rear seats of the subject vehicle at the time of the event. Zero passengers, means the vehicle has no human occupants in the rear seats. Number of passengers is observed from the cabin snapshot taken closest in time to the event, if available, and from subjective analysis of the video and driver behaviors if suitable snapshots are not available.
Secondary Task 1,2,3,4
Observable driver engagement in any of the listed secondary tasks, beginning at any point during the 5 seconds prior to the Precipitating Event time (Conflict Begin, Variable 2) through the end of the conflict (Conflict End). For Baselines, secondary tasks are coded for the last 6 seconds of the baseline epoch, which corresponds to 5 seconds prior to "Conflict Begin" through one second after "Conflict Begin" (to the end of the baseline). Distractions include non-driving related glances away from the direction of vehicle movement. Does not include tasks that are critical to the driving task, such as speedometer checks, mirror/blind spot checks, activating wipers/headlights, or shifting gears. (These are instead coded in the Driving Tasks variable.) Other non-critical tasks are included, including radio adjustments, seatbelt adjustments, window adjustments, and visor and mirror adjustments. Note that there is no lower limit for task duration. If there are more than 4 secondary tasks present, select the most critical or those that most directly impact the event, as defined by event outcome or proximity in time to the event occurrence. Populate this variable in numerical order. (If there is only one distraction, name it Secondary Task 1; if there are two, name them Secondary Task 1 and 2. Enter "No Additional Secondary Tasks" for remaining Secondary Task variables.)
Secondary Task 1,2,3,4 Start Time
The time at which the driver began to engage in the secondary task. This is a specific integer value for the video timestamp in milliseconds from the start of the file. Only secondary tasks that occur during or overlap the period of time starting 5 seconds prior to the Precipitating Event through Conflict End are included. If the secondary task began more than 5 seconds before the Precipitating Event), then enter the Conflict Begin (Variable 2) timestamp minus 5 seconds (5,000 timestamps).
Secondary Task 1,2,3,4 End Time
The time at which the driver disengaged from the secondary task or the driver's attention returned to the driving task or another activity. This is a specific integer value for the video timestamp in milliseconds from the start of the file. Only distractions that occur during or overlap the period of time starting 5 seconds prior to the Precipitating Event through Conflict End are included. If the secondary task continued after the Conflict End, then enter the Conflict End (Variable 4) timestamp.

77
Variable Name Variable Definition
Secondary Task 1,2,3,4 Determination of whether the Secondary Task contributed to the event sequence and severity. (Not Outcome whether the factor actually caused the event, but contributed to it.)
An indication of whether the subject vehicle driver engaged in any driving-related tasks, beginning at any point during the 5 seconds prior to the Precipitating Event time (Conflict Begin, Variable 2)
Driving Tasks through the end of the conflict (Conflict End). For Baselines, secondary tasks are coded for the last 6 seconds of the baseline epoch, which corresponds to 5 seconds prior to "Conflict Begin" through one second after "Conflict Begin" (to the end of the baseline). Multiple options can be selected.
Hands on the Wheel A description of how many and/or which hands the driver had on the steering wheel Precipitating Event (some part of the hand or arm must be touching the wheel).
at the start of the
Driver Seatbelt Use
Driver's use of seatbelt at the time of the start of the Precipitating Event. If video is available, information from the times surrounding the time of the precipitating event may clarify whether seatbelt is in use. If driver is in the process of putting a seatbelt on at the time of the Precipitating Event, this is considered NOT wearing a seatbelt.
Rider Helmet Use (MC Motorcycle Only: Riders use of a helmet at the time of the Precipitating Event. If rider is in the process only) of putting a helmet on at the time of the Precipitating Event, this is considered NOT wearing a helmet.
Driver Eye Protection (Rider for MC)
Driver's/Rider's use of eye protection at the time of the Precipitating Event. If driver/rider is in the process of putting on eye protection at the time of the Precipitating Event, this is considering NOT wearing eye protection.
Factors related to the mechanical functioning or flaws in subject vehicle that may have contributed to Vehicle Contributing the Precipitating Event or to the ability of the subject driver to respond effectively to the Precipitating
Factors Event. Only include if factor can be seen as clearly contributing to the severity or presence of an event or is known to have been reported by the driver.

78
Variable Name Variable Definition
Judgment providing a possible environmental reason or contributing factor to the occurrence and Infrastructure severity of the event, wherein some aspect of the roadway design impacted the driver's ability to safely
Contributing Factors navigate the roadway, recognize potential safety risks, or respond effectively to the Precipitating Event. These categories are not in order of importance or level of effect.
Visual Obstructions
Visual factors relating to sight distance or blind spots in the roadway infrastructure that may have contributed to the occurrence and severity of the event or impacted the ability of the subject to recognize potential safety risks or respond effectively to the Precipitating Event. Visual obstructions must be clearly present from the video, or known to have been reported by the driver.
Lighting Lighting condition at the time of the start of the Precipitating Event. If inside a tunnel or parking facility, code the conditions inside the facility, regardless of the lighting conditions outside.
Weather Weather condition at the time of the start of the Precipitating Event. If inside a tunnel or parking facility, code the conditions inside the facility, regardless of the weather conditions outside.
Surface Type The type of road surface applicable to the subject vehicle at pavement, gravel, etc.
the time of the Precipitating Event. Includes
Surface Condition
The type of roadway surface condition that would affect the vehicle's coefficient of friction at the start of the Precipitating Event. Includes weather-related surface conditions as well as non-paved surface descriptions. If inside a tunnel or parking facility, code the conditions inside the facility, regardless of the surface conditions outside.
Roadway Alignment Description of the roadway curvature in the subject vehicle's direction of condition at the time of the start of the Precipitating Event.
travel that best suits the
Roadway Grade Description of the roadway profile (e.g., uphill, downhill) in the subject vehicle's direction of travel that best suits the condition at the time of the start of the Precipitating Event. Roadway design, including the presence or lack of a median, present at the start of the Precipitating
Traffic Flow Event. If the event occurs at an intersection, the traffic flow conditions just prior to the intersection are recorded.

79
Variable Name Variable Definition
Contiguous Travel Lanes
The total number of contiguous travel lanes at the time of the Precipitating Event. Includes all lanes that the subject vehicle could easily maneuver into, including any turn lanes, acceleration/deceleration lanes, oncoming lanes, etc., not taking into account any occupants of these lanes. High Occupancy Vehicle (HOV) lanes are included in this count, as are lanes of a drive-through station if the subject is in a drive-through lane. All lanes that are separated only by pavement and paint should be counted. For divided traffic ways, this is the number of lanes in the subject vehicle's direction of travel; for undivided traffic ways, this is the number of lanes in all directions (total). If the event occurs at an intersection, the traffic lanes just prior to the intersection should be recorded. Number of lanes does not include those rendered unusable by restriction of the right-of-way (e.g., closed due to construction, being used for parking).
Through Travel Lanes
The number of travel through lanes present in the subject vehicle's direction of travel at the time of the Precipitating Event. This will be a subset of the Contiguous Travel Lanes, and includes only through lanes in the subject's direction of travel, and does NOT include non-through lanes just as dedicated turn lanes, or dedicated acceleration/deceleration lanes. This number will never be greater than the number of contiguous lanes. High Occupancy Vehicle (HOV) lanes are included in this count unless they are also a dedicated deceleration/exit lane. Lanes of a drive-through station are also included if the subject is in a drive-through lane. If the event occurs at an intersection, the traffic lanes just prior to the intersection should be recorded (not including dedicated turn lanes). If the event occurs in an interchange area, only through lanes are included; deceleration and acceleration lanes are NOT included. Number of lanes does not include those rendered unusable by restriction of the right-of-way (e.g., closed due to construction, being used for parking).
V1 Lane Occupied
A number indicating which lane the subject vehicle is in at the time of the Precipitating Event. Lanes are numbered by starting with the left-most through lane closest to the median or double yellow line (direction of travel only) and starting with "1", counting out towards the right shoulder of the road, and stopping with the right-most through lane. Turn lanes and acceleration/deceleration lanes are noted as such, and are not included in the lane numbering. High Occupancy Vehicle (HOV) lanes are included in this count unless they are also a dedicated deceleration/exit lane. Lanes of a drive-through station are also included if the subject is in a drive-through lane. This number will never be greater than the number of through lanes.

80
Variable Name Variable Definition
Traffic Density
The level of traffic density at the time of the start of the Precipitating Event. Based entirely on number of vehicles present in the subject's travel lane and other lanes in the subject's direction of travel, and the ability of the subject vehicle driver to maneuver between lanes and select the driving speed. In Variable Speed zones, consider a reduced speed limit to be an indicator of traffic density (e.g., a variable speed limit of 30mph on an Interstate should be interpreted as a 50% reduction in travel speeds). Note that this variable is "Not Applicable" in Parking Lot (except for parking lot entrance/exit areas that are still influenced by through traffic) and other non-road situations.
Parking Lot Demand
A measure of the demand placed on a driver traveling through a parking lot based on a subjective combination of the estimated percent of parking spaces occupied and the level of activity present from other motorists and non-motorists (e.g., into/out of parking spaces, up and down aisles, across aisles) at the time of the Precipitating Event and in the vicinity of the Subject vehicle. Note that this variable is "Not Applicable" outside of Parking Lot situations. Parking lot entrance/exit areas that are influenced by through traffic should be coded using the Traffic Density variable.
Traffic Control
Type of traffic control applicable to the subject vehicle's direction of travel at the time of the start of the Precipitating Event. Applicability of categories is determined by the proximity in space of the subject vehicle to the traffic control. Generally defined by the vehicle in question being no further than 3 vehicle-lengths away from the specified traffic control or close enough to be directly impacted by the traffic control (distance can vary with the situation). If more than one of the categories applies, code the one that is most relevant to the event.
Relation to Junction
The spatial (rather than causal) relation of the subject vehicle to a junction at the time of the start of the Precipitating Event. A junction is defined as a point in space where two or more roads or traffic ways with different travel speeds or direction of travel meet. If the incident occurs off of the roadway, the relation to junction is determined by the point of departure. Note that this is different than GES in that this database records Relation to Junction at the beginning of the Precipitating Event whereas the GES manual will code this variable at the beginning of the First Harmful Event.

81
Variable Name Variable Definition
Intersection Influence
A judgment call as to whether the subject vehicle's safe movement, travel path, and travel speed, are under the influence of an intersection at the time of the event (at any time between Conflict Begin through Conflict End). This can include the subject or other involved vehicles accelerating or decelerating in relation to an intersection or intersecting traffic way, accelerating or decelerating prior to a turn onto a new roadway or into a parking lot or driveway, waiting in a queue of traffic, moving between through lanes and turn lanes or through lanes and acceleration/deceleration lanes, yielding to oncoming or cross traffic, etc. Note that a "Yes" option can be coded here even if Relation to Junction is Non-junction if the vehicles are too far from the intersection to code Relation to Junction categories but are still being influenced in a manner described here by an intersection (e.g., a longer queue of traffic at a signal, or a long process of deceleration prior to a turn).
Roadway Feature Description of the any special roadway feature that may be influencing the vehicle's direction of travel at time of the Precipitating Event. Includes features that are not captured by other variables, such as traffic circles, toll booths, bridges, tunnels, etc.
Locality
Best description of the surroundings that influence or may influence the flow of traffic at the time of the start of the precipitating event. If there are ANY commercial buildings, indicate as business/industrial or urban area as appropriate (these categories take precedence over others except for church, school, and playground). Indicate school, church, or playground if the driver passes one of these areas (or is imminently approaching one) at the same time as the beginning of the Precipitating Event (these categories take precedence over any other categories except urban, and divided highway).
Construction Zone An indication of whether the Precipitating Event occurs in or in relation to a Construction Zone.

82
Variable Name Variable Definition
Number of Other Motorists/
Non-Motorists
This is the number of motorists or non-motorists (any vehicle involving a human occupant, including pedestrians), other than the subject vehicle, involved in the crash or near-crash, or that restrict the subject vehicle's ability to maneuver at the time of the start of the precipitating event (Vehicle 1 is subject vehicle). This number includes not only those vehicles directly involved in the crash (those with physical contact), but also other vehicles that may have been involved in precipitating the event or affected by the evasive maneuvers of the event. It therefore, may include vehicles that were both part of the "crash" and part of any "near crash(es)" that may have occurred at the same time. Parked vehicles with occupants would be included in this category, whereas parked vehicles with no occupants would be included in the category "Number of objects/animals". Note: animals and objects are not included in this category.
Number of Objects/ Animals
Number of objects or animals involved in the crash or near-crash, or that restrict the subject vehicle's ability to maneuver at the time of the start of the Precipitating Event. Includes curbs, medians, barriers, as well as other fixed and non-fixed objects. Also includes animals, both dead and alive. Note: motorists and non-motorists are not included in this category.
Fault
Indicates which driver or non-motorist (if any) committed an error that led to the event. If another motorist or non-motorist (other than the subject) committed the error leading to the event, label that other vehicle or non-motorist as Driver 2 or 3, in accordance with the Vehicle Configurations (V8, V9, V10). Only code a fault if there is observable evidence. Note: Objects and animals cannot be assigned fault. Such events are always coded as either Driver Fault or No Fault.
Motorist/ Non-Motorist 2, 3 Type
Specification of other vehicle, pedestrian, cyclist, or other person or person-operated vehicle that is involved in the event or that restricts the subject vehicle's ability to maneuver at the time of the start of the Precipitating Event.
Object/Animal 2,3 Type Specification of other animal or object that is involved in the event or that restricts the subject vehicle's ability to maneuver at the time of the start of the Precipitating Event.

83
Variable Name Variable Definition
Motorist/Non-Motorist/Object/Animal
2, 3 Location
Position of other vehicle, pedestrian, animal, or object that is involved in the event or that restricts the subject vehicle's ability to maneuver at the time of the start of the Precipitating Event. (Vehicle 1 is subject vehicle and is coded in earlier questions.) Exception: medians, barriers, and curbs are not considered to be objects in this category. Refer to Figure 5 in the beginning of this dictionary for location definitions.
Motorist/Non-Motorist 2, 3 Pre-Incident
Maneuver
Ongoing actions of the other motorists or non-motorists immediately prior to the start of the Precipitating Event. Only vehicles in clear view of a subject vehicle camera are included. If the other vehicles initiated the Precipitating Event (ex. by encroaching into the subject vehicle's lane during lane change), the Vehicle 2 maneuver would be the maneuver that initiated that action (ex. changing lanes). Note: If coding for pedestrian, use one of the four options for pedestrians; if coding for animal or object, use the option "Not applicable".
Motorist/ Non-Motorist 2, 3 Evasive Maneuver
The other motorists or non-motorist's reaction or avoidance maneuver (if any) in response to the Precipitating Event. Only reactions that are clearly evident in the video are included. If the Vehicle 2/3 initiated the Precipitating Event, this category would be the immediate reaction to the results of the Precipitating Event. This is a vehicle kinematic measure-based on what the vehicle does. Note: If coding for pedestrian, use one of the two options for pedestrians; if the coding for animal or object, use the option "Not applicable".
Motorist/Non-Motorist 2, 3 Behavior 1,2,3
Driver behaviors (those that either occurred within seconds prior to the Precipitating Event or those resulting from the context of the driving environment) that include what the Motorist or Non-Motorist 2 or 3 did to cause or contribute to the crash or near-crash. Behaviors may be apparent at times other than the time of the Precipitating Event, such as aggressive driving at an earlier moment which led to retaliatory behavior later. If there are more than 3 behaviors present, select the most critical or those that most directly impact the event as defined by event outcome or proximity in time to the event occurrence. Populate this variable in numerical order. (If there is only one behavior, name it Behavior 1; if there are two, name them Behaviors 1 and 2.) NOTE: that the several of the Driver Behavior categories coded for the Subject vehicle are not included in this category due to lack of context in the video to make such determinations. Categories not included here are "Distracted", "Drowsy, sleepy, asleep, fatigued", "Did not see other vehicle", and "Use of cruise control".

84
Variable Name Variable Definition
Final Narrative/ Additional Notes
For critical event reduction, this is a "Final Narrative", or a short, open-ended description of the event. This variable provides context and descriptions in sufficient detail so as to fill any gaps in reconstructing the event if video were not available. It should always be clear in the written narrative which vehicle is the subject vehicle (SV, Vehicle 1, V1, or "subject vehicle") and which are the other vehicles (POV or Vehicle 2/3). The narrative includes the following: 1. A description of the most relevant aspects of the environment and traffic dynamics prior to the crash, 2. A description of the sequence of events, focusing in particular on discrepancies between the subject vehicle driver's activity/state (e.g., driver expectations, eyes off road, impairment) and the environmental context (e.g., the driver looks away while the lead vehicle brakes), and 3. Any other relevant aspects that are not covered by other variables. For Baselines, this variable is "Additional Notes", only completed when additional information is needed that was not captured in the previous variables.

85
APPENDIX D. SAFETY MANAGER SURVEYS
SAFETY MANAGER QUESTIONNAIRE
Implied Consent
Thank you for sharing your thoughts on collision mitigation technology with Virginia Tech. By completing this survey you consent to be a part of the study. This includes a short follow-up interview based on your responses in the survey. Your responses in the survey and follow-up interview will be kept confidential and will not be shared with your company or your drivers in any way.
Questionnaire
Collision Mitigation Technologies are safety systems that alert drivers to unfolding conflicts and/or automatically take action (e.g., forward collision warning and lane departure warning systems). Please answer the following questions based on what you think the collision mitigation technology will be like for your drivers. To answer, check only one box for each statement that best expresses your answer (unless indicated otherwise). The questionnaire will take about 15 minutes to complete.

86
General Use of the Collision Mitigation Technology
1. Based on what you’ve heard from drivers, please indicate how much you agree with the following statements
Strongly Agree Agree Slightly
Agree Neutral Slightly Disagree Disagree Strongly
Disagree
a) Collision mitigation technology makes my drivers safer
b) My drivers feel safer using collision mitigation technology
c) My drivers are less distracted and make fewer errors while using collision mitigation technology
d) My drivers rely on collision mitigation technology to alert them to potential accidents
e) False alerts negatively affect my drivers’ performance
f) My drivers find the technology easy to understand
g) Collision mitigation technology is more useful in adverse driving conditions
h) Collision mitigation technology works properly in adverse driving conditions
i) It would be useful to install collision mitigation technology as standard equipment in commercial vehicles
j) I would recommend my company install collision mitigation technology on all commercial vehicles as standard equipment
k) I would recommend collision mitigation technology to colleagues at other companies

87
Following Distance Alert
The collision mitigation technology has a following distance alert that beeps when the distance between the truck and the vehicle ahead is closing. The alert beeps faster as the distance closes. The following questions ask about this alert.
2. Based on what you’ve heard from drivers, the following distance alert…
Strongly
Agree Agree Slightly Agree Neutral Slightly
Disagree Disagree Strongly Disagree
a) …is easy to hear in all situations
b) …is good at getting a drivers’ attention back to driving
c) …helps drivers avoid a crash
d) …distracts or annoys drivers
e) …works properly all the time
f) …encourages drivers to pass slow lead vehicles
g) …works well on curved roads
h) …causes drivers to pay less attention to the road

88
3. What percentage of the alerts do you think will be false alerts (that is, alerts that activate in response to objects that are not valid threats, such as bridges and trees)? ________%
4. What percentage of the alerts do you think will be nuisance alerts (that is, alerts that activate to valid objects that you are aware of, but do not require an alert. An example would be an alert activating to a lead vehicle slowing down to turn right)? ________%
5. What are the top three things your drivers will like about the following distance alert?
1. ____________________ 2. ____________________ 3. ____________________
6. What are the top three things your drivers will dislike about the following distance alert?
1. ____________________ 2. ____________________ 3. ____________________
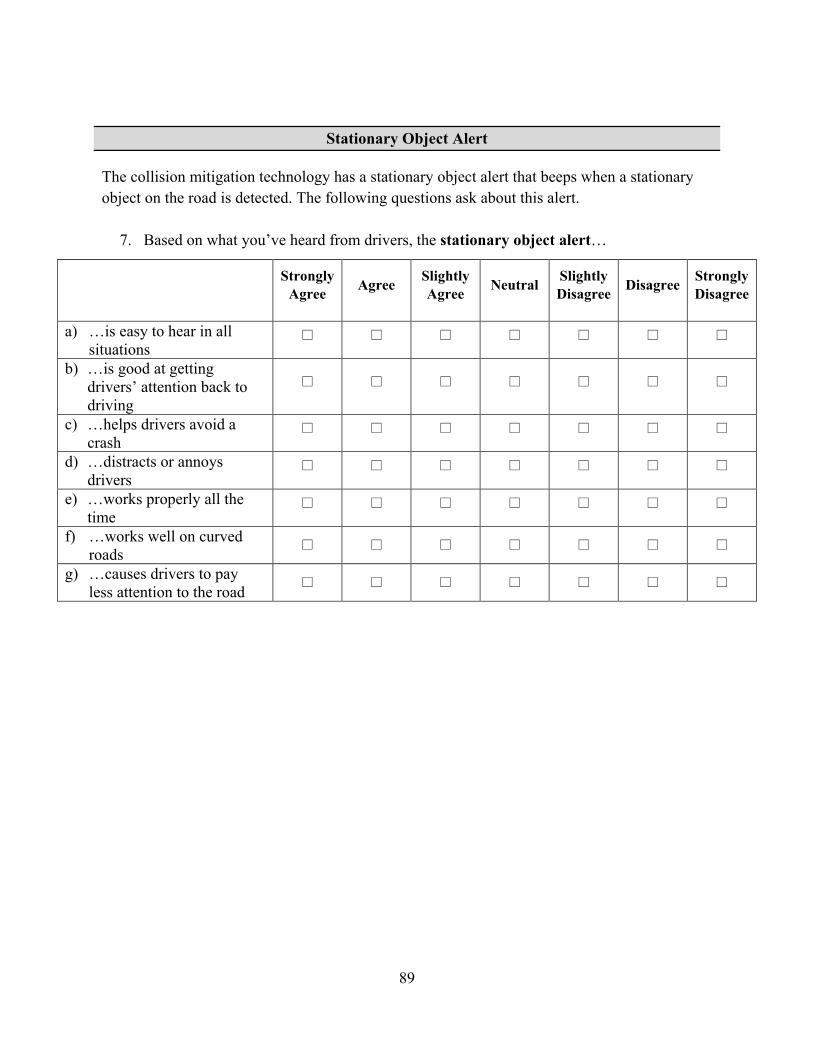
89
Stationary Object Alert
The collision mitigation technology has a stationary object alert that beeps when a stationary object on the road is detected. The following questions ask about this alert.
7. Based on what you’ve heard from drivers, the stationary object alert…
Strongly
Agree Agree Slightly Agree Neutral Slightly
Disagree Disagree Strongly Disagree
a) …is easy to hear in all situations
b) …is good at getting drivers’ attention back to driving
c) …helps drivers avoid a crash
d) …distracts or annoys drivers
e) …works properly all the time
f) …works well on curved roads
g) …causes drivers to pay less attention to the road

90
8. What percentage of the alerts do you think will be false alerts (that is, alerts that activate
in response to objects that are not valid threats, such as bridges and trees)? ________%
9. What percentage of the alerts do you think will be nuisance alerts (that is, alerts that activate to valid objects that you are aware of, but do not require an alert. An example would be an alert that activates to a lead vehicle stopped at a red light)? ________%
10. What are the top three things your drivers will like about the stationary object alert?
1. ____________________ 2. ____________________ 3. ____________________
11. What are the top three things your drivers will dislike about the stationary object alert?
1. ____________________ 2. ____________________ 3. ____________________

91
Impact Alert
The collision mitigation technology has an impact alert that presents lights on the dash, rapidly beeps, and can apply the truck’s brakes to help you avoid the collision. The following questions ask about this alert.
12. Based on what you’ve heard from drivers, the impact alert …
Strongly
Agree Agree Slightly Agree Neutral Slightly
Disagree Disagree Strongly Disagree
a) …is easy to hear in all situations
b) …is good at getting drivers’ attention back to driving
c) …helps drivers avoid a crash
d) …distracts or annoys drivers
e) …works all the time h) …works well on curved
roads

92
13. Based on what you’ve heard from drivers, the automatic braking applied at the last moment…
Strongly
Agree Agree Slightly Agree Neutral Slightly
Disagree Disagree Strongly Disagree
a) …is beneficial b) …is the most appropriate
action for the vehicle to take
c) …is appropriate in all weather conditions
d) …is appropriate in all lighting conditions
14. What percentage of the alerts do you think will be false alerts (that is, alerts that activate
in response to objects that are not valid threats, such as bridges and trees)? ________%
15. What percentage of the alerts do you think will be nuisance alerts (that is, alerts that activate to valid objects that you are aware of, but do not require an alert. An example would be an alert that activates to a lead vehicle stopped at a red light)? ________%
16. What are the top three things your drivers will like about the impact alert?
1. ____________________ 2. ____________________ 3. ____________________
17. What are the top three things your drivers will dislike about the impact alert?
1. ____________________ 2. ____________________ 3. ____________________

93
Adaptive Cruise Control (ACC) With Braking Feature
When engaged, the adaptive cruise control maintains a constant headway to a slowing lead vehicle by reducing throttle, applying the engine retarder, and applying the truck’s brakes when needed. The following questions ask about this feature.
18. Based on what you’ve heard from drivers, please rate the statements about adaptive cruise control below.
Strongly
Agree Agree Slightly Agree Neutral Slightly
Disagree Disagree Strongly Disagree
a) It is easy to determine when the ACC has detected a lead vehicle
b) The ACC’s de-throttling of the truck is helpful in keeping a safe distance
c) The ACC’s engagement of the engine retarder is helpful in keeping a safe distance
d) The ACC’s application of the brakes is helpful in keeping a safe distance
e) The automatic slowing of the truck when lead traffic slows down is annoying to drivers
f) The ACC works properly all the time
g) The ACC applies a sufficient amount of braking
h) The ACC works on curved roads
i) Drivers know when they need to start braking because ACC isn’t sufficient
j) Drivers pay less attention to the road when using ACC

94
19. What percentage of the ACC applying the brakes do you think will be false alerts (for example, automatic braking that activates in response to objects that are not valid threats, such as bridges and trees)? ________%
20. What percentage of the ACC braking activations do you think will be nuisance alerts (for
example, automatic braking that activates to lead vehicles that only slightly slow down)? ________%
21. What are the top three things your drivers will like about the ACC feature?
1. ____________________ 2. ____________________ 3. ____________________
22. What are the top three things your drivers will dislike about the ACC feature?
1. ____________________ 2. ____________________ 3. ____________________

95
Lane Departure Alert
The collision mitigation technology has a lane departure alert that beeps when the truck crosses a lane marking when the turn signal is not activated. The following questions ask about this alert.
23. Based on what you’ve heard from drivers, the lane departure alert…
Strongly
Agree Agree Slightly Agree Neutral Slightly
Disagree Disagree Strongly Disagree
a) …is easy to hear in all situations
b) …is good at getting drivers’ attention back to driving
c) …helps drivers avoid a crash
d) …distracts or annoys drivers
e) …works properly all the time
i) …works well on curved roads
j) …causes drivers to pay less attention to the road

96
24. What percentage of the alerts do you think will be false alerts (for example, alerts that activate in response to faded lane markings in construction zones)? ________%
25. What percentage of the alerts do you think will be nuisance alerts (for example, alerts that
activate when purposefully crossing a lane to avoid an object on the road)? ________%
26. What are the top three things your drivers will like about the lane departure warning?
1. ____________________ 2. ____________________ 3. ____________________
27. What are the top three things your drivers will dislike about the lane departure warning?
1. ____________________ 2. ____________________ 3. ____________________

97
28. Please rank how useful your drivers feel each of the following collision mitigation technologies are from 1 (Best) to 5 (Worst). ____ Following Distance Alert ____ Stationary Vehicle Alert ____ Impact Alert ____ Adaptive Cruise Control ____ Lane Departure Warning
29. Please provide any additional thoughts you might have regarding you or your driver’s opinions of collision avoidance systems. ____________________________________________________________________________________________________________________________________________________________________________________________________________________________________________________________________________________________________________________________________________________________________

98
A Little About You
30. How many years have you been with the company? ____________ years ___________
months
31. How long have you been a safety supervisor with this company? ________ years
_______ months
32. How many drivers did you supervise in the past month? _________ drivers
33. How many years have you had a CDL license? ______________ years
34. How long has your company been using collision avoidance systems? ________ years
________ months
35. Has your company used older generations of collision mitigation technology (e.g.
VORAD)? ___ yes ___ no
a. If yes, which devices has your company used?
________________________________________
36. Does your company train drivers on the collision mitigation technology in their vehicles?
___ yes ___ no
a. If yes, please describe how you train drivers:
__________________________________________________________________
__________________________________________________________________
__________________________________________________________________
________________________________________________
Thank you for participating in this questionnaire. You'll be hearing from
us soon to conduct a short follow-up interview about your responses.

99
APPENDIX E. INITIAL SAFETY MANAGER SURVEY RESULTS
Crosby J&M Rush Kuperus P&S Stagecoach Modular
Strongly DisagreeDisagreeSlightly DisagreeNeutralSlightly AgreeAgreeStrongly Agree
Technology is more useful in adverse conditions
Would recommend for my company on all CMV
It would be useful to install in all CMV
Drivers find technology easy to understand
Drivers less distracted and make fewer errors
Drivers feel safer
Makes drivers safer
Drivers rely on technology to alert them
False alerts negatively affect drivers
Works properly in adverse conditions
Would recommend to colleagues
Figure 44. Safety Manager Responses to General Statements About CAS Technology at the Start of the Study
Crosby J&M Rush Kuperus P&S Stagecoach Modular
Strongly DisagreeDisagreeSlightly DisagreeNeutralSlightly AgreeAgreeStrongly Agree
Easy to hear
Gets driver's attention back to driving
Helps drivers avoid a crash
Distracts or annoys drivers
Works properly all the time
Encourages drivers to pass slow lead vehicles
Works well on curved roads
Causes drivers to pay less attention to the road
Figure 45. Safety Manager Responses to Statements About FDAs at the Start of the Study

100
Crosby J&M Rush Kuperus P&S Stagecoach Modular
Strongly DisagreeDisagreeSlightly DisagreeNeutralSlightly AgreeAgreeStrongly Agree
Easy to hear
Gets driver's attention back to driving
Helps drivers avoid a crash
Distracts or annoys drivers
Works properly all the time
Works well on curved roads
Causes drivers to pay less attention to the road
Figure 46. Safety Manager Responses to Statements About SOAs at the Start of the Study
Crosby J&M Rush Kuperus P&S Stagecoach Modular
Strongly DisagreeDisagreeSlightly DisagreeNeutralSlightly AgreeAgreeStrongly Agree
Easy to hear
Gets driver's attention back to driving
Helps drivers avoid a crash
Distracts or annoys drivers
Works properly all the time
Works well on curved roads
Figure 47. Safety Manager Responses to Statements About IAs at the Start of the Study

101
Crosby J&M Rush Kuperus P&S Stagecoach Modular
Strongly DisagreeDisagreeSlightly DisagreeNeutralSlightly AgreeAgreeStrongly Agree
Automatic braking is beneficial
Is most appropriate action for vehicle to take
Is appropriate in all weather conditions
Is appropriate in all lighting conditions
Figure 48. Safety Manager Responses to Statements About AEB at the Start of the Study
Crosby J&M Rush Kuperus P&S Stagecoach Modular
Strongly DisagreeDisagreeSlightly DisagreeNeutralSlightly AgreeAgreeStrongly Agree
It's clear when ACC detects a vehicle
ACC de-throttling truck is helps keep safe distance
Automatic slowing when lead traffic slows is annoying
ACC works properly all the time
ACC works on curved roads
Drivers know when ACC isn't sufficient and need to start braking
ACC engaging engine retarder is helps keep safe distance
ACC application of brakes is helps keep safe distance
Drivers pay less attention to the road when using ACC
Figure 49. Safety Manager Responses to Statements About ACC at the Start of the Study

102
Crosby J&M Rush Kuperus P&S Stagecoach Modular
Strongly DisagreeDisagreeSlightly DisagreeNeutralSlightly AgreeAgreeStrongly Agree
Easy to hear
Gets driver's attention back to driving
Works properly all the time
Works well on curved roads
Causes drivers to pay less attention to the road
Helps drivers avoid a crash
Distracts or annoys drivers
Figure 50. Safety Manager Responses to Questions About LDWs at the Start of the Study

103
APPENDIX F. FINAL SAFETY MANAGER SURVEY RESULTS
Crosby J&M Rush Kuperus P&S Stagecoach Modular
Strongly DisagreeDisagreeSlightly DisagreeNeutralSlightly AgreeAgreeStrongly Agree
Technology is more useful in adverse conditions
Would recommend for my company on all CMV
It would be useful to install in all CMV
Drivers find technology easy to understand
Drivers less distracted and make fewer errors
Drivers feel safer
Makes drivers safer
Drivers rely on technology to alert them
False alerts negatively affect drivers
Works properly in adverse conditions
Would recommend to colleagues
Figure 51. Safety Manager Responses to General Statements About CAS Technology at the End of the Study
Crosby J&M Rush Kuperus P&S Stagecoach Modular
Strongly DisagreeDisagreeSlightly DisagreeNeutralSlightly AgreeAgreeStrongly Agree
Easy to hear
Gets driver's attention back to driving
Helps drivers avoid a crash
Distracts or annoys drivers
Works properly all the time
Encourages drivers to pass slow lead vehicles
Works well on curved roads
Causes drivers to pay less attention to the road
Figure 52. Safety Manager Responses to Statements About FDAs at the End of the Study

104
Crosby J&M Rush Kuperus P&S Stagecoach Modular
Strongly DisagreeDisagreeSlightly DisagreeNeutralSlightly AgreeAgreeStrongly Agree
Easy to hear
Gets driver's attention back to driving
Helps drivers avoid a crash
Distracts or annoys drivers
Works properly all the time
Works well on curved roads
Causes drivers to pay less attention to the road
Figure 53. Safety Manager Responses to Statements About SOAs at the End of the Study
Crosby J&M Rush Kuperus P&S Stagecoach Modular
Strongly DisagreeDisagreeSlightly DisagreeNeutralSlightly AgreeAgreeStrongly Agree
Easy to hear
Gets driver's attention back to driving
Helps drivers avoid a crash
Distracts or annoys drivers
Works properly all the time
Works well on curved roads
Figure 54. Safety Manager Responses to Statements About IAs at the End of the Study

105
Meritor J&M Rush Kuperus P&S Stagecoach Modular
Strongly DisagreeDisagreeSlightly DisagreeNeutralSlightly AgreeAgreeStrongly Agree
Automatic braking is beneficial
Is most appropriate action for vehicle to take
Is appropriate in all weather conditions
Is appropriate in all lighting conditions
Figure 55. Safety Manager Responses to Statements About AEB at the End of the Study
Crosby J&M Rush Kuperus P&S Stagecoach Modular
Strongly DisagreeDisagreeSlightly DisagreeNeutralSlightly AgreeAgreeStrongly Agree
It's clear when ACC detects a vehicle
ACC de-throttling truck is helps keep safe distance
Automatic slowing when lead traffic slows is annoying
ACC works properly all the time
ACC works on curved roads
Drivers know when ACC isn't sufficient and need to start braking
ACC engaging engine retarder is helps keep safe distance
ACC application of brakes is helps keep safe distance
Drivers pay less attention to the road when using ACC
Figure 56. Safety Manager Responses to Statements About ACC at the End of the Study

106
Crosby J&M Rush Kuperus P&S Stagecoach Modular
Strongly DisagreeDisagreeSlightly DisagreeNeutralSlightly AgreeAgreeStrongly Agree
Easy to hear
Gets driver's attention back to driving
Works properly all the time
Works well on curved roads
Causes drivers to pay less attention to the road
Helps drivers avoid a crash
Distracts or annoys drivers
Figure 57. Safety Manager Responses to Statements About LDWs at the End of the Study
APPENDIX G. AVERAGE HOURLY RATES OF CAS ACTIVATIONS FOR INDIVIDUAL
PARTICIPANTS

107
Figure 58. Rate of AEB Activations for Individual Drivers Using Company A’s CAS

108
Figure 59. Rate of AEB Activations for Individual Drivers Using Company B’s CAS

109
Figure 60. Rate of IAs for Individual Drivers Using Company A’s CAS

110
Figure 61. Rate of IAs for Individual Drivers Using Company B’s CAS

111
Figure 62. Rate of FDA for Individual Drivers Using Company A’s CAS

112
Figure 63. Rate of FDAs for Individual Drivers Using Company B’s CAS

113
Figure 64. Rate of SOAs for Individual Drivers Using Company A’s CAS

114
Figure 65. Rate of SOAs for Individual Drivers Using Company B’s CAS

115
Figure 66. Rate of LDWs for Individual Drivers Using Company A’s CAS

116
Figure 67. Rate of LDWs for Individual Drivers Using Company B’s CAS

117
Figure 68. Rate of ACC Activations for Individual Drivers Using Company A’s CAS

118
Figure 69. Rate of ACC Activations for Individual Drivers Using Company B’s CAS

119
APPENDIX H. MODELS OF CHANGES TO RATES OF CAS ACTIVATIONS PER HOUR OF DRIVING
A mixed negative binomial regression model was used to measure any changes over time to the rate of alerts per hour of driving. Specifically, week in study was used as a continuous covariate. Additionally, the first numeric week of the year (from 0 to 52) was used as a covariate to adjust for the starting time of the year in the study for a given driver. The random effects included a random intercept term (providing participant-specific information on baseline rate) and a random term for week (providing participant-specific information on change in rate over time). In some cases, the model with random intercepts and slopes failed to converge, in which case only random intercept terms were included. The models of AEB activations per hour for Company A drivers can be found in Table 20. A second model of AEB activations per hour for Company A drivers, which eliminates an influential participant, can be found in Table 21. The model of AEB activations per hour for Company B drivers can be found in Table 22. Models of IA per hour for Company A and Company B drivers can be found in Table 23 and Table 24, respectively. Models for FDA per hour for Company A and Company B drivers can be found in Table 25 and Table 26, respectively. A second model of FDA per hour for Company B drivers, which only accounts for the first two months, can be found in Table 27. Models for LDW alerts per hour for Company A and Company B drivers can be found in Table 28 and Table 29, respectively. Models for SOA per hour for Company A and Company B drivers per hour can be found in Table 30 and Table 31, respectively.
Table 20. Company A AEB Model Results
Effect Estimate Standard Error DF T-
Value P-
Value
Lower Confidence
Limit
Upper Confidence
Limit Intercept -6.6249 0.5275 68 -12.56 <.0001 -7.6775 -5.5724
Week in Study 0.02169 0.006664 1160 3.26 0.0012 0.00862 0.03477 First Week in Study -0.00147 0.02171 1160 -0.07 0.9459 -0.04407 0.04112
Table 21. Company A AEB Model Results Without Influential Driver
Effect Estimate Standard Error DF T-
Value P-
Value
Lower Confidence
Limit
Upper Confidence
Limit Intercept -6.5618 0.5123 67 -12.81 <.0001 -7.5844 -5.5392
Week in Study 0.01184 0.007367 1124 1.61 0.1083 -0.00262 0.02629 First Week in Study 0.001522 0.02079 1124 0.07 0.9416 -0.03926 0.0423

120
Table 22. Company B AEB Model Results
Effect Estimate Standard Error DF T-
Value P-
Value
Lower Confidence
Limit
Upper Confidence
Limit Intercept -7.5713 0.6316 48 -11.99 <.0001 -8.8412 -6.3015
Week in Study 0.009344 0.01312 731 0.71 0.4766 -0.01642 0.0351 First Week in Study -0.00037 0.02236 731 -0.02 0.9866 -0.04428 0.04353
Table 23. Company A IA Model Results
Effect Estimate Standard Error DF T-
Value P-
Value
Lower Confidence
Limit
Upper Confidence
Limit Intercept -4.8191 0.371 68 -12.99 <.0001 -5.5595 -4.0788
Week in Study 0.01274 0.006692 67 1.9 0.0611 -0.00061 0.0261 First Week in Study 0.02506 0.01393 1093 1.8 0.0723 -0.00227 0.05239
Table 24. Company B IA Model Results
Effect Estimate Standard Error DF T-
Value P-
Value
Lower Confidence
Limit
Upper Confidence
Limit Intercept -3.2839 0.229 47 -14.34 <.0001 -3.7447 -2.8232
Week in Study 0.01009 0.005169 46 1.95 0.0569 -0.00031 0.0205 First Week in Study -0.00641 0.009495 647 -0.67 0.5001 -0.02505 0.01224
Table 25. Company A FDA Model Results
Effect Estimate Standard Error DF T-
Value P-
Value
Lower Confidence
Limit
Upper Confidence
Limit Intercept 2.2677 0.2164 63 10.48 <.0001 1.8352 2.7002
Week in Study -0.00679 0.007371 63 -0.92 0.3606 -0.02152 0.007941 First Week in Study 0.003279 0.006842 844 0.48 0.6319 -0.01015 0.01671

121
Table 26. Company B FDA Model Results
Effect Estimate Standard Error DF T-
Value P-
Value
Lower Confidence
Limit
Upper Confidence
Limit Intercept 0.3652 0.3802 80 0.96 0.3397 -0.3915 1.1218
Week in Study 0.01483 0.004814 79 3.08 0.0028 0.005253 0.02442 Week in Study^2 -0.00029 0.00009 1035 -3.18 0.0015 -0.00046 -0.00011
First Week in Study 0.01469 0.01134 1035 1.3 0.1952 -0.00755 0.03694
Table 27. Company B FDA Model Results First 2 Months
Effect Estimate Standard Error DF T-
Value P-
Value
Lower Confidence
Limit
Upper Confidence
Limit Intercept 0.3907 0.3944 80 0.99 0.3248 -0.3941 1.1755
Week in Study 0.05045 0.01445 77 3.49 0.0008 0.02168 0.07922 First Week in Study 0.0104 0.01193 318 0.87 0.384 -0.01307 0.03388
Table 28. Company A LDW Model Results
Effect Estimate Standard Error DF T-
Value P-
Value
Lower Confidence
Limit
Upper Confidence
Limit Intercept 0.008113 0.2544 17 0.03 0.9749 -0.5287 0.5449
Week in Study 0.002323 0.005769 14 0.4 0.6932 -0.01005 0.0147 First Week in Study 0.02405 0.008583 182 2.8 0.0056 0.007118 0.04099
Table 29. Company B LDW Model Results
Effect Estimate Standard Error DF T-
Value P-
Value
Lower Confidence
Limit
Upper Confidence
Limit Intercept 2.2677 0.2164 63 10.48 <.0001 1.8352 2.7002
Week in Study -0.00679 0.007371 63 -0.92 0.3606 -0.02152 0.007941 First Week in Study 0.003279 0.006842 844 0.48 0.6319 -0.01015 0.01671

122
Table 30. Company A SOA Model Results
Effect Estimate Standard Error DF T-
Value P-
Value
Lower Confidence
Limit
Upper Confidence
Limit Intercept -4.2986 0.4376 68 -9.82 <.0001 -5.1718 -3.4255
Week in Study 0.001506 0.004505 67 0.33 0.7392 -0.00749 0.0105 First Week in Study 0.005822 0.01675 1093 0.35 0.7283 -0.02705 0.03869
Table 31. Company B SOA Model Results
Effect Estimate Standard Error DF T-
Value P-
Value
Lower Confidence
Limit
Upper Confidence
Limit Intercept -2.4686 0.09884 48 -24.98 <.0001 -2.6674 -2.2699
Week in Study -0.00041 0.002268 47 -0.18 0.8583 -0.00497 0.004155 First Week in Study -0.00635 0.003824 684 -1.66 0.097 -0.01386 0.001154

123
APPENDIX I. DEFINITIONS OF TRAFFIC DENSITY CATEGORIES Level of Service (LOS)
Description Definition
A1 Free flow, no lead traffic
LOS A1 represents a free flow traffic situation when the subject vehicle has no leading traffic in any lane (following traffic may or may not be present). Individual users are unaffected by the traffic stream. Freedom to select desired speeds and to maneuver within the traffic stream is at the highest level possible.
A2 Free flow, leading traffic present
LOS A2 represents a free flow traffic with a leading vehicle present in at least one lane. However, individual drivers are still virtually unaffected by the presence of others in the traffic stream. Freedom to select desired speeds and to maneuver within the traffic stream is extremely high. The general level of comfort and convenience provided to the motorist, passenger, or pedestrian is excellent.
B Flow with some restrictions
LOS B is still in the range of stable flow, but the presence of other users in the traffic stream begins to be noticeable. Freedom to select desired speeds is relatively unaffected, but there is a slight decline in the freedom to maneuver within the traffic stream from LOS A. The level of comfort and convenience provided is somewhat less than at LOS A, because the presence of others in the traffic stream begins to affect individual behavior.
C
Stable flow, maneuverability
and speed are more restricted
LOS C is still in the range of stable flow, but marks the beginning of the range of flow in which the operation of individual users becomes significantly affected by interactions with others in the traffic stream. The selection of speed is now affected by the presence of others, and maneuvering within the traffic stream requires substantial vigilance on the part of the driver. The general level of comfort and convenience declines noticeably at this level.
D
Unstable flow - temporary restrictions
substantially flow driver
LOS D represents a high‐density, but stable flow. Speed and freedom to maneuver are severely restricted, and the driver or pedestrian experiences a generally poor level of comfort and convenience. Small increases in traffic flow will generally cause operational problems at this level.
E
Flow is unstable, vehicles are unable to pass, temporary
stoppages, etc.
LOS E represents operating conditions at or near the capacity level. All speeds are reduced to a low, but relatively uniform value. Freedom to maneuver within the traffic stream is extremely difficult, and it is generally accomplished by forcing a vehicle or pedestrian to "give way" to accommodate such maneuvers. Comfort and convenience levels are extremely poor, and driver or pedestrian frustration is generally high. Operations at this level are usually unstable, because small increases in flow or minor perturbations within the traffic stream will cause breakdowns.

124
F
Forced traffic flow condition with low speeds and traffic volumes that are below capacity
LOS F represents forced or breakdown flow. This condition exists wherever the amount of traffic approaching a point exceeds the amount which can traverse the point. Queues form behind such locations. Operations within the queue are characterized by stop‐and‐go waves, and they are extremely unstable. Vehicles may progress at reasonable speeds for several hundred feet or more, then be required to stop in a cyclic fashion. LOS F is used to describe the operating conditions within the queue, as well as the point of the breakdown. It should be noted, however, that in many cases operating conditions of vehicles or pedestrians discharged from the queue may be quite good. Nevertheless, it is the point at which arrival flow exceeds discharge flow, which causes the queue to form, and level‐of‐service F is an appropriate designation for such points.

125
ACKNOWLEDGEMENTS
The authors would also like to acknowledge the assistance of Bendix and Meritor WABCO throughout the study. Both companies provided invaluable technical expertise and the research would not have been possible without their support. The authors would like to thank the following companies for allowing their vehicles to be equipped with the MiniDAS and their drivers to participate in the study.
• Crosby Trucking Service, Mt. Sydney, VA • J&M Tank Lines, Birmingham, AL • P&S Transportation, Birmingham, AL • Stagecoach Cartage and Distribution, El Paso, TX • Kuperus Trucking, Jenison, MI • Modular Transportation, Grand Rapids, MI • Rush Trucking Corporation, Detroit, MI
The authors of this report would acknowledge the Center for Technology Development for its development of the MiniDAS. The authors would like to acknowledge the Center for Data Reduction and Analysis Support for its efforts in data analysis.

126
REFERENCES
Bendix Commercial Vehicle Systems. (2015). Bendix System Comparison (in webpage Bendix Wingman Fusion: The integration of camera, radar, and brakes delivers a new level of performance in North America). Elyria, OH: Author. Available at www.bendix.com/media/documents/products_1/wingman_fusion/Fusion_Comparison_Chart.pdf Brown, L. D., Cai, T. T., & DasGupta, A. (2001). Interval estimation for a binomial proportion. Statistical Science, 16(2), 101-117. Bureau of Labor Statistics. (2010). Recent leads to lackluster employment in the trucking industry. Issues in Labor Statistics, Summary 10-01. (Web page). Washington, DC: Author. Available at www.bls.gov/opub/ils/trucking.htm Deutsche Welle (2009). Economic downturn slams brakes on global trucking sector. (Web page press release). Bonn, Germany: Author. Available at www.dw.com/en/economic-downturn-slams-brakes-on-global-trucking-sector/a-4529678 Dingus, T. A., Klauer, S. G., Neale, V. L., Petersen, A., Lee, S. E., Sudweeks, J., … & Knipling, R. R. (2006, April). The 100-car naturalistic driving study: Phase II – Results of the 100-car field experiment (Report No. DOT HS 810 593). Washington, DC: National Highway Traffic Safety Administration. Available at http://www.distraction.gov/downloads/pdfs/the-100-car-naturalistic-driving-study.pdf European Commission. (2009). Regulation (EC) No 661/2009 concerning type-approval requirements for the general safety of motor vehicles. Retrieved from http://eur-lex.europa.eu/legal-content/EN/TXT/PDF/?uri=CELEX:32009R0661&from=EN Fitch, G. M., Grove, K., Hanowski, R., & Perez, M. (2014). Investigating light vehicle and commercial motor vehicle driver compensatory behavior when conversing on a cell phone using naturalistic driving data. Transportation Research Record: Journal of the Transportation Research Board, 2434, 1-8. Hanowski, R. J., Perez, M. A., & Dingus, T. A. (2005). Driver distraction in long-haul truck drivers. Transportation Research Part F: Traffic Psychology and Behaviour, 8(6), 441-458. Hanowski, R. J., Hickman, J. S., Wierwille, W. W., & Keisler, A. (2007). A descriptive analysis of light vehicle–heavy vehicle interactions using in situ driving data. Accident Analysis & Prevention, 39(1), 169-179. Insurance Institute for Highway Safety. (2015). U.S. DOT and IIHS announce historic commitment from 10 automakers to include automatic emergency braking on all new vehicles. (Web page press release). Arlington, VA: Author. Retrieved from www.iihs.org/iihs/news/desktopnews/u-s-dot-and-iihs-announce-historic-commitment-from-10-automakers-to-include-automatic-emergency-braking-on-all-new-vehicles Meritor WABCO (2015). WABCO Introduces OnGuardACTIVE Collision Mitigation System to North America. (Web page press release). Auderghem, Belgium: Author. Available at www.wabco-

127
auto.com/media/media-center/press-releases/press-releases-single-view/news-article/wabco-introduces-onguardactive-collision-mitigation-system-to-north-america/ National Center for Statistics and Analysis. (2015, Revised June). Large trucks: 2013 data. (Traffic Safety Facts. DOT HS 812 150). Washington, DC: National Highway Traffic Safety Administration.Available at www-nrd.nhtsa.dot.gov/Pubs/812150.pdf NHTSA. (2015). U.S. DOT to add automatic emergency braking to list of recommended advanced safety technologies in 5-Star Rating. (Web page press release). Washington, DC: National Highway Traffic Safety Administration. Available at www.nhtsa.gov/About+NHTSA/Press+Releases/2015/nhtsa-recommends-aeb-11022015 Simons-Morton, B. G., Ouimet, M. C., Zhang, Z., Klauer, S. E., Lee, S. E., Wang, J., ... & Dingus, T. A. (2011). The effect of passengers and risk-taking friends on risky driving and crashes/near crashes among novice teenagers. Journal of Adolescent Health, 49(6), 587-593. Woodrooffe, J., Blower, D., Bao, S., Bogard, S., Flannagan, C., Green, P., & LeBlanc, D. (2012). Performance Characterization and Safety Effectiveness Estimates of Forward Collision Avoidance and Mitigation Systems for Medium/Heavy Commercial Vehicles: Final Report. (Report No. UMTRI-2011-36). Washington, DC: National Highway Traffic Safety Administration. Available at www.regulations.gov/contentStreamer?documentId=NHTSA-2013-0067-0001&attachmentNumber=1&disposition=attachment&contentType=pdf

DOT HS 812 280 June 2016
12359-052316-v2a