ni/ce-mcm-41 mesostructured catalysts for simultaneous ... · pdf fileni/ce-mcm-41...
TRANSCRIPT
i n t e r n a t i o n a l j o u r n a l o f h y d r o g e n e n e r g y 3 5 ( 2 0 1 0 ) 3 5 0 9 – 3 5 2 1
Avai lab le a t www.sc iencedi rec t .com
j ourna l homepage : www.e lsev ier . com/ loca te /he
Ni/Ce-MCM-41 mesostructured catalysts for simultaneousproduction of hydrogen and nanocarbon viamethane decomposition
J.C. Guevara a, J.A. Wang a,*, L.F. Chen a, M.A. Valenzuela a, P. Salas b, A. Garcıa-Ruiz c,J.A. Toledo d, M.A. Cortes-Jacome d, C. Angeles-Chavez d, O. Novaro e
a ESIQIE, Instituto Politecnico Nacional, Col. Zacatenco, Av. Politecnico s/n, 07738 Mexico D. F., Mexicob Centro de Fısica Aplicada y Tecnologıa Avanzada, Universidad Nacional Autonoma de Mexico, Apartado Postal 1-1010, Queretaro 76000,
Mexicoc UPIICSA, Instituto Politecnico Nacional, Te 950 Col. Granjas-Mexico, 08400 Mexico D.F., Mexicod Programa de Molecular Ingenierıa, Instituto Mexicano del Petroleo, Eje Lazaro Cardenas 152, 07730 Mexico D. F., Mexicoe Instituto de Fisica, Universidad Nacional Autonoma de Mexico, A. P. 20-364, 01000 Mexico D.F., Mexico
a r t i c l e i n f o
Article history:
Received 13 October 2009
Received in revised form
13 January 2010
Accepted 16 January 2010
Available online 19 February 2010
Keywords:
Hydrogen production
Methane catalytic decomposition
Carbon nanotube
Ce-MCM-41
Ni-based catalysts
* Corresponding author. Tel.: þ52 55 5729600E-mail address: [email protected] (J.A
0360-3199/$ – see front matter ª 2010 Profesdoi:10.1016/j.ijhydene.2010.01.068
a b s t r a c t
For the first time, simultaneous production of hydrogen and nanocarbon via catalytic
decomposition of methane over Ni-loaded mesoporous Ce-MCM-41 catalysts was investi-
gated. The catalytic performance of the Ni/Ce-MCM-41 catalysts is very stable and the
reaction activity remained almost unchanged during 1400 min steam on time at temper-
atures 540, 560 and 580 �C, respectively. The methane conversion level over these catalysts
reached 60–75% with a 100% selectivity towards hydrogen. TEM observations revealed that
most of the Ni particles located on the tip of the carbon nanofibers/nanotubes in the used
catalysts, keeping their exposed surface clean during the test and thus remaining active for
continuous reaction without obvious deactivation. Two kinds of carbon materials,
graphitic carbon (Cg) as major and amorphous carbon (CA) as minor were produced in the
reaction, as confirmed by XRD analysis and TEM observations. Carbon nanofibers/nano-
tubes had an average diameter of approximately 30–50 nm and tens micrometers in length,
depending on the reaction temperature, reaction time and Ni particle diameter. Four types
of carbon nanofibers/nanotubes were detected and their formations greatly depend on the
reaction temperature, time on steam and degree of the interaction between the metallic Ni
and support. The respective mechanisms of the formation of nanocarbons were postulated
and discussed.
ª 2010 Professor T. Nejat Veziroglu. Published by Elsevier Ltd. All rights reserved.
1. Introduction regulations require the utilization of clean energy in a variety of
Nowadays, the world is facing two significantly related chal-
lenges: an increasing demand for new energy and a stringently
environmental concern. The increasingly environmental
0x55261.. Wang).sor T. Nejat Veziroglu. Pu
areas. Hydrogen is such a clean fuel that has received a great
attention because of its importance in fuel cell technology,
petroleum refining, food, electronics and metallurgical pro-
cessing industries and many other fields [1–4]. Approximately
blished by Elsevier Ltd. All rights reserved.
i n t e r n a t i o n a l j o u r n a l o f h y d r o g e n e n e r g y 3 5 ( 2 0 1 0 ) 3 5 0 9 – 3 5 2 13510
95% of the hydrogen is produced from carbonaceous raw
materials, primarily fossil in origin and the rest from alterna-
tive resources as biomass and water [5]. There are a number of
emerging and attractive approaches or processes for the
production of hydrogen, as the natural gas catalytic decom-
position, steam reforming, photocatalytic decomposition of
water and biomass gasification, etc. [5–12]. Hydrogen produced
by photocatalytic decomposition of water is very clean and it is
an economical approach. Unfortunately, it still remains at
laboratory stage because of some technical difficulties for
scale-up. Steam reforming of methane is highly endothermic
and produces a large amount of COx (CO2 and CO). Therefore,
additional steps are required to remove these COx by-products
in order to meet the requirements in the fuel cell applications,
which increases the operation cost. Economic analysis has
shown that if the carbon produced in the reaction procedure
can be utilized, it will be financially attractive. It is noted that
both hydrogen and carbon nanotube materials can be simul-
taneously produced through a single technical approach of
methane catalytic decomposition (MCD) that is regarded as
a fully green chemical process. By methane catalytic decom-
position, COx (CO and CO2)-free hydrogen can be obtained with
a moderately endothermic process [13–19]. For hydrogen
production, the MCD process is believed to be superior to steam
reforming from economical points of view, and it is also
superior to the photocatalytic decomposition of water from the
technical point of view [2,20]. Moreover, MCD is easy for
scaling-up for the production of carbon nanotubes, and it is
used to obtain multiwalled nanotubes with high mechanical
strength, differing from the route of arc-discharge evaporation
of graphite where single wall carbon nanotubes could be
produced [20].
The catalysts used for methane catalytic decomposition
usually consist of transition metals and a support. SiO2
[17,21–23], MgO [22], Al2O3 [20,24,25], SiO2–Al2O3 [26], SiO2–
CeO2 [27], ZnAl2O4 [28] and MgAl2O4 [29], zeolite [5], carbon
[30–32] and hydrotalcite-like materials [33] are the most
common support. The active phases are usually group VIII
transition metals Fe, Co and Ni, others like Cu and Pd are
used as promoters [5,16,25,33–37]. Among these, the
intensely studied catalysts are Ni supported alumina and Ni
supported silica.
The main influence factors on MCD are the reaction
temperature, nature of the support, type and quantity of
active metals. The activity and the lifetime of the Ni supported
catalysts depend significantly on the size of the metal particle
and are sensitive to the textural properties and pore geometry
of the support [29]. It is known that the surfactant-assistant
technique in the materials synthesis may provide materials
with appropriate pore diameter, high surface areas and
a better access to the active sites [38,39]. The application of
mesoporous materials as catalysts support for hydrogen
production has not been reported yet. In addition, in
a preliminary investigation, we found that ceria doped silica
as catalyst support shows a rather stable catalytic activity in
the methane decomposition reaction [27]. In the present work,
we report some new results of the synthesis, structural
characterization and catalytic properties of a series of Ni/Ce-
MCM-41 mesoporous catalysts synthesized by a surfactant-
assisted technique for simultaneous production of hydrogen
and nanocarbons (nanotubes and nanofibers). These catalysts
exhibit high catalytic stability in comparison with the tradi-
tional Ni/SiO2 catalysts. Several kinds of nanocarbons are
formed and their formation mechanisms are discussed and
postulated.
2. Experimental section
2.1. Synthesis of Ce-MCM-41 mesoporous materials
The cerium promoted mesoporous materials (noted as
Ce-MCM-41) were prepared by the use CeCl3$7H2O as cerium
precursor, tetraethyl ortosilicate (TEOS) as silicon precursor
and cetyltrimethylammonium bromide (CTABr) bromide as
synthetic templating agent. A typical preparation of the
sample with a molar relationship of Si/Ce ¼ 20 was described
as follows. Two solutions were prepared, the first solution
was prepared by 1.86 g of CeCl3$7H2O and 22.8 ml of TEOS
diluted in 50 ml of water with agitation; the second solution
was made by addition of 11.4 g of CTABr in 200 ml hot water
(near 50 �C) with stirring, followed by the addition of 145 ml of
NH3$H2O (28 wt.%). Then the first solution was added, drop by
drop, into the second solution to obtain a mixture. During the
addition, the mixture was vigorously agitated for near 2 h
until the gel was formed. The resulting gel was heated at
100 �C by 24 h. The solid was washed with deionized water
and dried for 24 h. Finally the sample was annealed at 600 �C
by 5 h in air with a flow rate of 60 ml/min. The heating rate
was set at 1 �C/min. The other two samples with Si/Ce molar
ratio 10 and 5 were synthesized with the similar method as
described above.
2.2. Preparation of Ni/Ce-MCM-41 catalysts
The nickel supported catalysts were prepared by incipient
impregnation of the calcined supports with Ni(NO3)2 solu-
tion. The Ni loading of the catalysts was 30 wt.% and 50 wt.%,
respectively. After impregnation, the Ni supported materials
were dried at 80 �C for 10 h and then calcined at 400 �C for 4 h.
Before the catalytic evaluation, the oxidized catalysts were
reduced using 99.9% H2 at 500 �C for 2 h to obtain metallic Ni
particles on the catalyst surface. These catalysts are noted as
Ni/Ce-MCM-41-x, where x is Si/Ce molar ratio, x ¼ 5, 10
and 20.
2.3. N2-adsorption–desorption isotherms measurement
The specific surface area, pore volume and pore size distri-
bution of the Ce-MCM-41 samples were measured in a Dig-
isorb 2600 equipment by using low temperature N2
physisorption isotherms. Before the N2 adsorption, the
samples calcined at 600 �C were thermally treated at 400 �C for
2 h. The surface area was determined according to the stan-
dard Brunaur–Emmett–Teller (BET) method in a relative
pressure range of 0.04–0.2 and the total volume was evaluated
from the amount of adsorbed N2 at a relative pressure (P/P0) of
about 0.99. The pore diameter distributions were calculated
based on the desorption isotherms by the Barrett–Joyner–
Halenda (BJH) method.
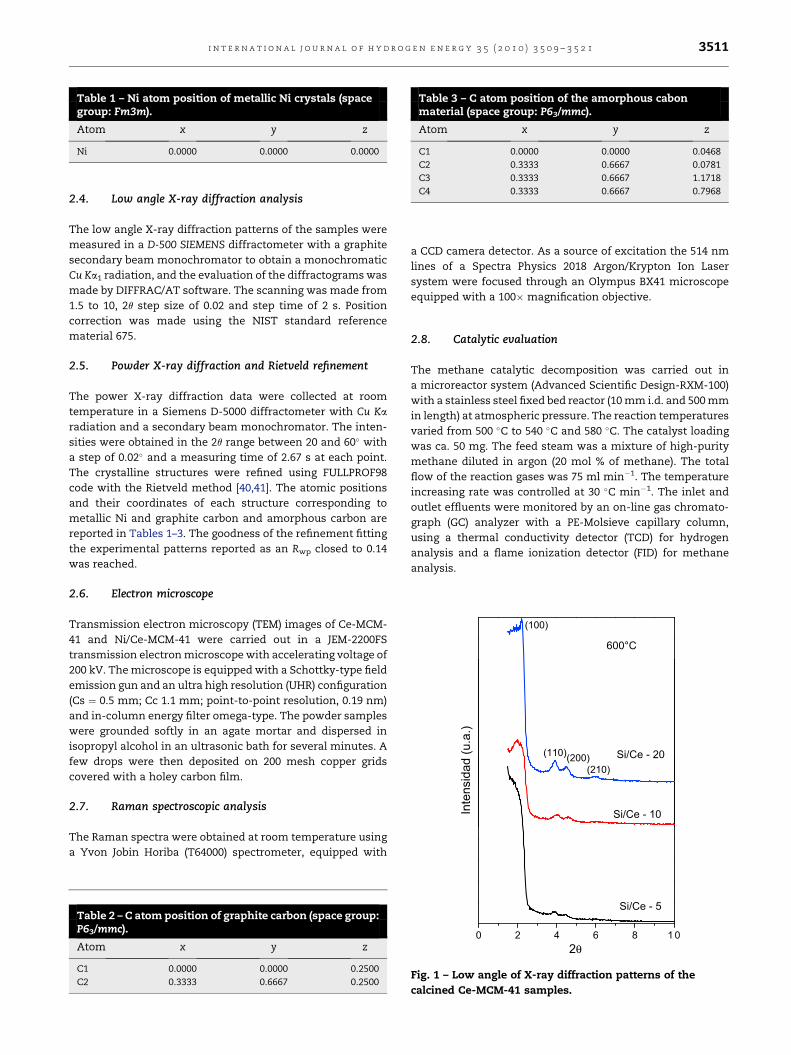
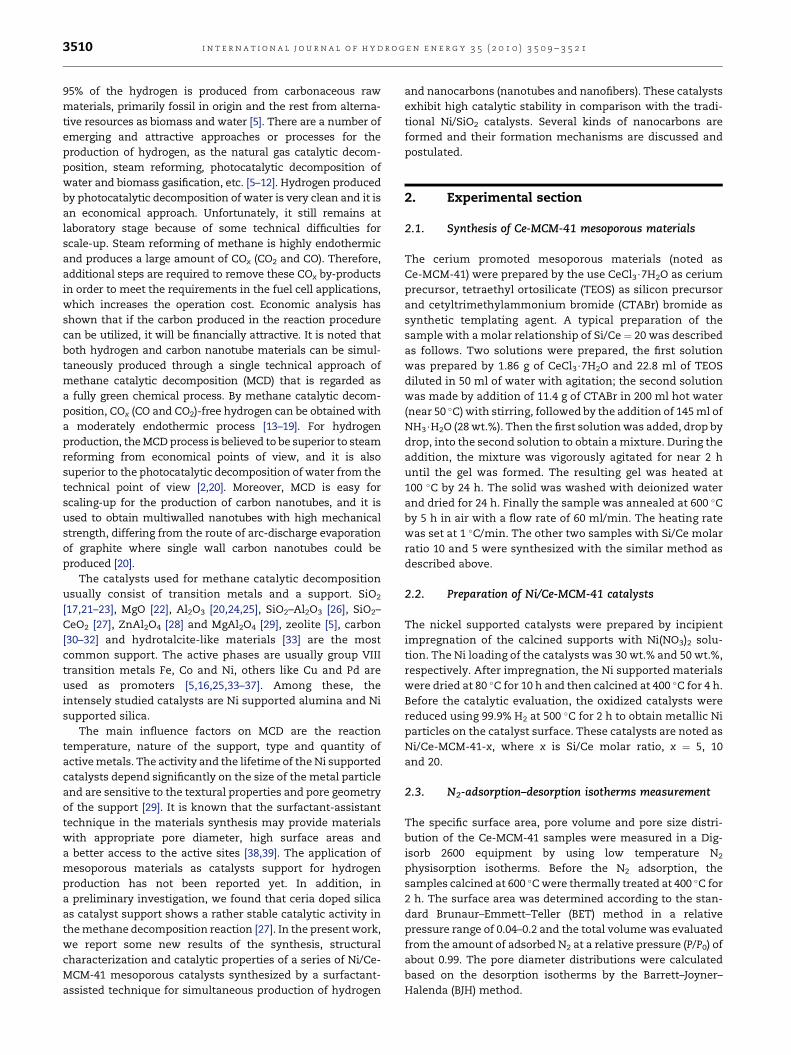
Table 1 – Ni atom position of metallic Ni crystals (spacegroup: Fm3m).
Atom x y z
Ni 0.0000 0.0000 0.0000
Table 3 – C atom position of the amorphous cabonmaterial (space group: P63/mmc).
Atom x y z
C1 0.0000 0.0000 0.0468
C2 0.3333 0.6667 0.0781
C3 0.3333 0.6667 1.1718
C4 0.3333 0.6667 0.7968
Inte
nsid
ad (u
.a.)
(210)(200)(110) Si/Ce - 20
600°C
(100)
Si/Ce - 10
i n t e r n a t i o n a l j o u r n a l o f h y d r o g e n e n e r g y 3 5 ( 2 0 1 0 ) 3 5 0 9 – 3 5 2 1 3511
2.4. Low angle X-ray diffraction analysis
The low angle X-ray diffraction patterns of the samples were
measured in a D-500 SIEMENS diffractometer with a graphite
secondary beam monochromator to obtain a monochromatic
Cu Ka1 radiation, and the evaluation of the diffractograms was
made by DIFFRAC/AT software. The scanning was made from
1.5 to 10, 2q step size of 0.02 and step time of 2 s. Position
correction was made using the NIST standard reference
material 675.
2.5. Powder X-ray diffraction and Rietveld refinement
The power X-ray diffraction data were collected at room
temperature in a Siemens D-5000 diffractometer with Cu Ka
radiation and a secondary beam monochromator. The inten-
sities were obtained in the 2q range between 20 and 60� with
a step of 0.02� and a measuring time of 2.67 s at each point.
The crystalline structures were refined using FULLPROF98
code with the Rietveld method [40,41]. The atomic positions
and their coordinates of each structure corresponding to
metallic Ni and graphite carbon and amorphous carbon are
reported in Tables 1–3. The goodness of the refinement fitting
the experimental patterns reported as an Rwp closed to 0.14
was reached.
2.6. Electron microscope
Transmission electron microscopy (TEM) images of Ce-MCM-
41 and Ni/Ce-MCM-41 were carried out in a JEM-2200FS
transmission electron microscope with accelerating voltage of
200 kV. The microscope is equipped with a Schottky-type field
emission gun and an ultra high resolution (UHR) configuration
(Cs ¼ 0.5 mm; Cc 1.1 mm; point-to-point resolution, 0.19 nm)
and in-column energy filter omega-type. The powder samples
were grounded softly in an agate mortar and dispersed in
isopropyl alcohol in an ultrasonic bath for several minutes. A
few drops were then deposited on 200 mesh copper grids
covered with a holey carbon film.
2.7. Raman spectroscopic analysis
The Raman spectra were obtained at room temperature using
a Yvon Jobin Horiba (T64000) spectrometer, equipped with
Table 2 – C atom position of graphite carbon (space group:P63/mmc).
Atom x y z
C1 0.0000 0.0000 0.2500
C2 0.3333 0.6667 0.2500
a CCD camera detector. As a source of excitation the 514 nm
lines of a Spectra Physics 2018 Argon/Krypton Ion Laser
system were focused through an Olympus BX41 microscope
equipped with a 100� magnification objective.
2.8. Catalytic evaluation
The methane catalytic decomposition was carried out in
a microreactor system (Advanced Scientific Design-RXM-100)
with a stainless steel fixed bed reactor (10 mm i.d. and 500 mm
in length) at atmospheric pressure. The reaction temperatures
varied from 500 �C to 540 �C and 580 �C. The catalyst loading
was ca. 50 mg. The feed steam was a mixture of high-purity
methane diluted in argon (20 mol % of methane). The total
flow of the reaction gases was 75 ml min�1. The temperature
increasing rate was controlled at 30 �C min�1. The inlet and
outlet effluents were monitored by an on-line gas chromato-
graph (GC) analyzer with a PE-Molsieve capillary column,
using a thermal conductivity detector (TCD) for hydrogen
analysis and a flame ionization detector (FID) for methane
analysis.
0 2 4 6 8 1 02θ
Si/Ce - 5
Fig. 1 – Low angle of X-ray diffraction patterns of the
calcined Ce-MCM-41 samples.
0,00 0,25 0,50 0,75 1,000
200
400
600
800
1000
0
200
400
600
800
1000
0
200
400
600
800
1000
Vol A
dsor
bed
(cc/
g)
RELATIVE PRESSURE (P/Po)
Si/Ce - 5
Vol A
dsor
bed
(cc/
g)
Si/Ce - 20
Vol A
dsor
bed
(cc/
g)
Si/Ce - 10
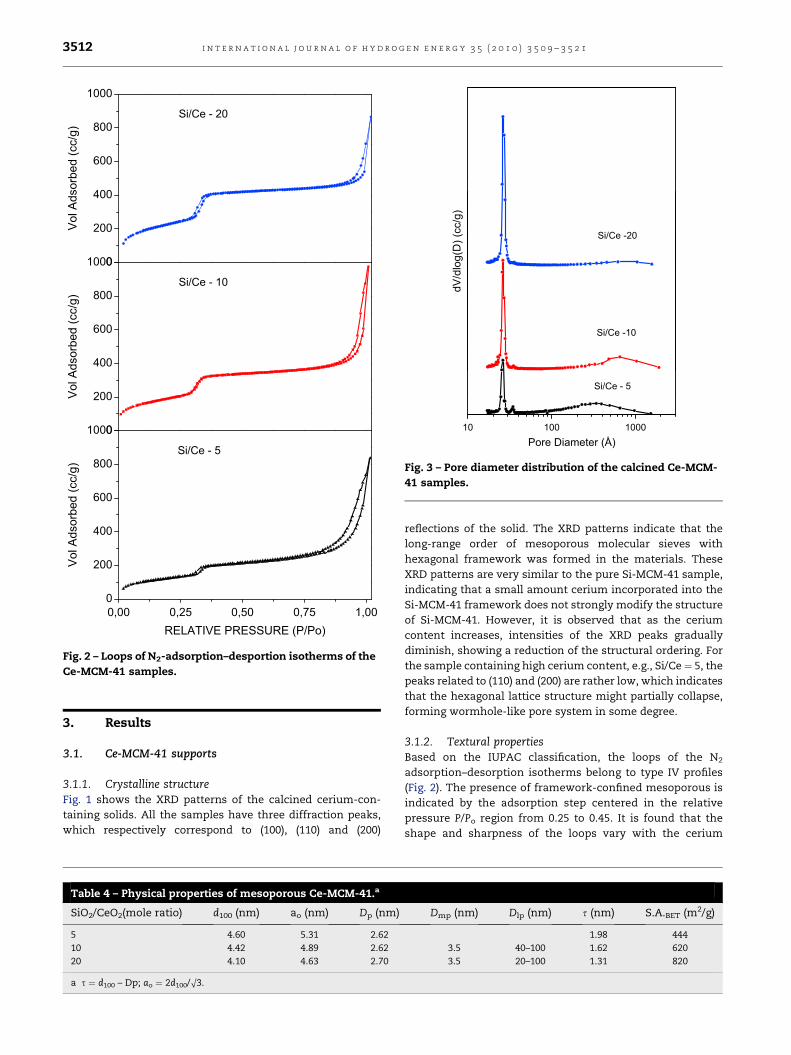
Fig. 2 – Loops of N2-adsorption–desportion isotherms of the
Ce-MCM-41 samples.
10 100 1000
Si/Ce - 5
dV/d
log(
D) (
cc/g
)Pore Diameter (Å)
Si/Ce -20
Si/Ce -10
Fig. 3 – Pore diameter distribution of the calcined Ce-MCM-
41 samples.
i n t e r n a t i o n a l j o u r n a l o f h y d r o g e n e n e r g y 3 5 ( 2 0 1 0 ) 3 5 0 9 – 3 5 2 13512
3. Results
3.1. Ce-MCM-41 supports
3.1.1. Crystalline structureFig. 1 shows the XRD patterns of the calcined cerium-con-
taining solids. All the samples have three diffraction peaks,
which respectively correspond to (100), (110) and (200)
Table 4 – Physical properties of mesoporous Ce-MCM-41.a
SiO2/CeO2(mole ratio) d100 (nm) ao (nm) Dp (nm)
5 4.60 5.31 2.62
10 4.42 4.89 2.62
20 4.10 4.63 2.70
a s ¼ d100 – Dp; ao ¼ 2d100/O3.
reflections of the solid. The XRD patterns indicate that the
long-range order of mesoporous molecular sieves with
hexagonal framework was formed in the materials. These
XRD patterns are very similar to the pure Si-MCM-41 sample,
indicating that a small amount cerium incorporated into the
Si-MCM-41 framework does not strongly modify the structure
of Si-MCM-41. However, it is observed that as the cerium
content increases, intensities of the XRD peaks gradually
diminish, showing a reduction of the structural ordering. For
the sample containing high cerium content, e.g., Si/Ce¼ 5, the
peaks related to (110) and (200) are rather low, which indicates
that the hexagonal lattice structure might partially collapse,
forming wormhole-like pore system in some degree.
3.1.2. Textural propertiesBased on the IUPAC classification, the loops of the N2
adsorption–desorption isotherms belong to type IV profiles
(Fig. 2). The presence of framework-confined mesoporous is
indicated by the adsorption step centered in the relative
pressure P/Po region from 0.25 to 0.45. It is found that the
shape and sharpness of the loops vary with the cerium
Dmp (nm) Dlp (nm) s (nm) S.A.BET (m2/g)
1.98 444
3.5 40–100 1.62 620
3.5 20–100 1.31 820
0
10
20
30
40
50
60
70
80
90
100
0 200 400 600 800 1000 1200 1400
TIME (MIN)
Co
nversio
n (%
)
Ni30%/Ce-MCM-41-5
Ni50%/Ce-MCM-41-5
0
10
20
30
40
50
60
70
80
90
100
0 200 400 600 800 1000 1200 1400
TIME (MIN)
Co
nversio
n (%
)
Ni30%/Ce-MCM-41-10
Ni50%/Ce-MCM-41-10
0
10
20
30
40
50
60
70
80
90
100
0 200 400 600 800 1000 1200 1400
TIME (MIN)
Co
nversio
n (%
)
Ni30%/Ce-MCM-41-20
Ni50%/Ce-MCM-41-20
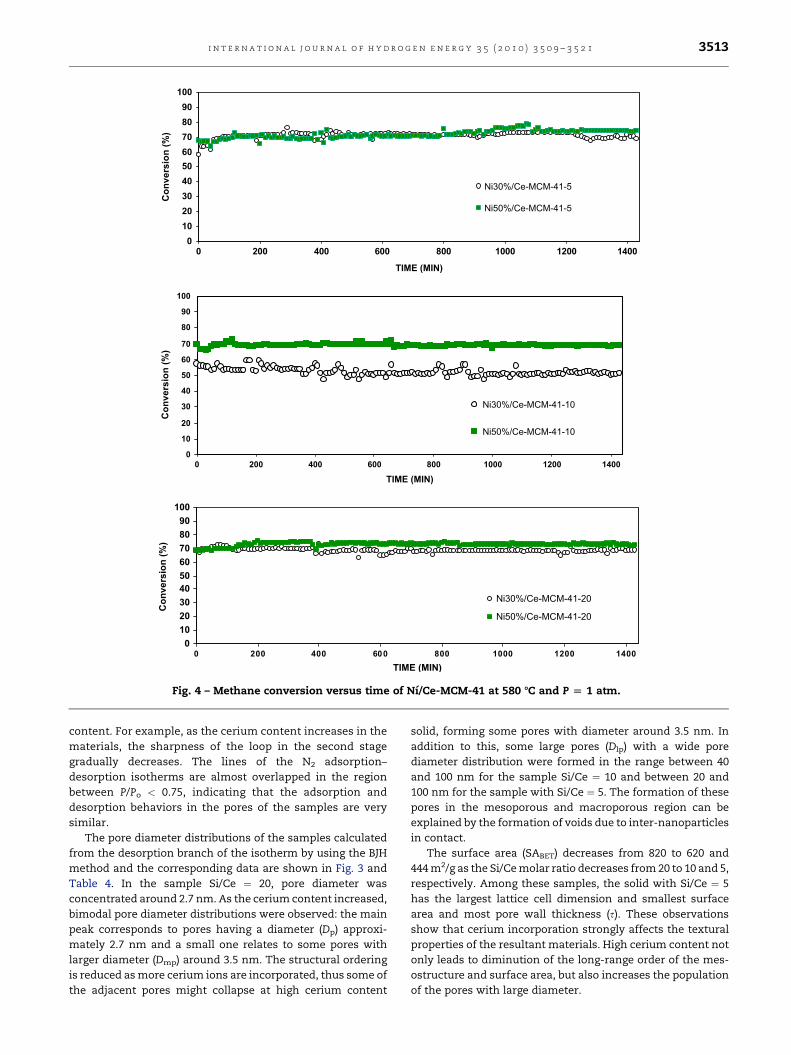
Fig. 4 – Methane conversion versus time of Nı/Ce-MCM-41 at 580 8C and P [ 1 atm.
i n t e r n a t i o n a l j o u r n a l o f h y d r o g e n e n e r g y 3 5 ( 2 0 1 0 ) 3 5 0 9 – 3 5 2 1 3513
content. For example, as the cerium content increases in the
materials, the sharpness of the loop in the second stage
gradually decreases. The lines of the N2 adsorption–
desorption isotherms are almost overlapped in the region
between P/Po < 0.75, indicating that the adsorption and
desorption behaviors in the pores of the samples are very
similar.
The pore diameter distributions of the samples calculated
from the desorption branch of the isotherm by using the BJH
method and the corresponding data are shown in Fig. 3 and
Table 4. In the sample Si/Ce ¼ 20, pore diameter was
concentrated around 2.7 nm. As the cerium content increased,
bimodal pore diameter distributions were observed: the main
peak corresponds to pores having a diameter (Dp) approxi-
mately 2.7 nm and a small one relates to some pores with
larger diameter (Dmp) around 3.5 nm. The structural ordering
is reduced as more cerium ions are incorporated, thus some of
the adjacent pores might collapse at high cerium content
solid, forming some pores with diameter around 3.5 nm. In
addition to this, some large pores (Dlp) with a wide pore
diameter distribution were formed in the range between 40
and 100 nm for the sample Si/Ce ¼ 10 and between 20 and
100 nm for the sample with Si/Ce ¼ 5. The formation of these
pores in the mesoporous and macroporous region can be
explained by the formation of voids due to inter-nanoparticles
in contact.
The surface area (SABET) decreases from 820 to 620 and
444 m2/g as the Si/Ce molar ratio decreases from 20 to 10 and 5,
respectively. Among these samples, the solid with Si/Ce ¼ 5
has the largest lattice cell dimension and smallest surface
area and most pore wall thickness (s). These observations
show that cerium incorporation strongly affects the textural
properties of the resultant materials. High cerium content not
only leads to diminution of the long-range order of the mes-
ostructure and surface area, but also increases the population
of the pores with large diameter.
20 30 40 50
b
a
Inte
nsity
(a.
u.)
c
Two Theta (degree)
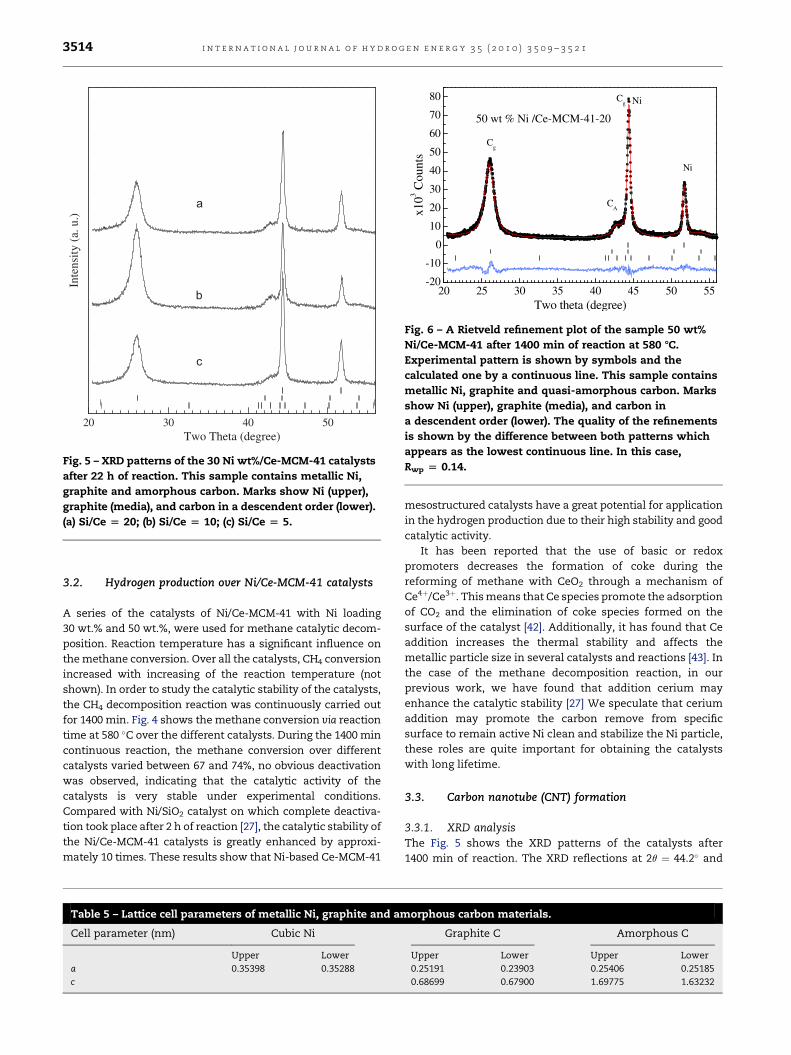
Fig. 5 – XRD patterns of the 30 Ni wt%/Ce-MCM-41 catalysts
after 22 h of reaction. This sample contains metallic Ni,
graphite and amorphous carbon. Marks show Ni (upper),
graphite (media), and carbon in a descendent order (lower).
(a) Si/Ce [ 20; (b) Si/Ce [ 10; (c) Si/Ce [ 5.
20 25 30 35 40 45 50 55-20
-10
0
10
20
30
40
50
60
70
80 Cg
CA
Cg
Ni
x103 C
ount
s
Two theta (degree)
50 wt % Ni /Ce-MCM-41-20
Ni
Fig. 6 – A Rietveld refinement plot of the sample 50 wt%
Ni/Ce-MCM-41 after 1400 min of reaction at 580 8C.
Experimental pattern is shown by symbols and the
calculated one by a continuous line. This sample contains
metallic Ni, graphite and quasi-amorphous carbon. Marks
show Ni (upper), graphite (media), and carbon in
a descendent order (lower). The quality of the refinements
is shown by the difference between both patterns which
appears as the lowest continuous line. In this case,
Rwp [ 0.14.
i n t e r n a t i o n a l j o u r n a l o f h y d r o g e n e n e r g y 3 5 ( 2 0 1 0 ) 3 5 0 9 – 3 5 2 13514
3.2. Hydrogen production over Ni/Ce-MCM-41 catalysts
A series of the catalysts of Ni/Ce-MCM-41 with Ni loading
30 wt.% and 50 wt.%, were used for methane catalytic decom-
position. Reaction temperature has a significant influence on
the methane conversion. Over all the catalysts, CH4 conversion
increased with increasing of the reaction temperature (not
shown). In order to study the catalytic stability of the catalysts,
the CH4 decomposition reaction was continuously carried out
for 1400 min. Fig. 4 shows the methane conversion via reaction
time at 580 �C over the different catalysts. During the 1400 min
continuous reaction, the methane conversion over different
catalysts varied between 67 and 74%, no obvious deactivation
was observed, indicating that the catalytic activity of the
catalysts is very stable under experimental conditions.
Compared with Ni/SiO2 catalyst on which complete deactiva-
tion took place after 2 h of reaction [27], the catalytic stability of
the Ni/Ce-MCM-41 catalysts is greatly enhanced by approxi-
mately 10 times. These results show that Ni-based Ce-MCM-41
Table 5 – Lattice cell parameters of metallic Ni, graphite and am
Cell parameter (nm) Cubic Ni
Upper Lower
a 0.35398 0.35288
c
mesostructured catalysts have a great potential for application
in the hydrogen production due to their high stability and good
catalytic activity.
It has been reported that the use of basic or redox
promoters decreases the formation of coke during the
reforming of methane with CeO2 through a mechanism of
Ce4þ/Ce3þ. This means that Ce species promote the adsorption
of CO2 and the elimination of coke species formed on the
surface of the catalyst [42]. Additionally, it has found that Ce
addition increases the thermal stability and affects the
metallic particle size in several catalysts and reactions [43]. In
the case of the methane decomposition reaction, in our
previous work, we have found that addition cerium may
enhance the catalytic stability [27] We speculate that cerium
addition may promote the carbon remove from specific
surface to remain active Ni clean and stabilize the Ni particle,
these roles are quite important for obtaining the catalysts
with long lifetime.
3.3. Carbon nanotube (CNT) formation
3.3.1. XRD analysisThe Fig. 5 shows the XRD patterns of the catalysts after
1400 min of reaction. The XRD reflections at 2q ¼ 44.2� and
orphous carbon materials.
Graphite C Amorphous C
Upper Lower Upper Lower
0.25191 0.23903 0.25406 0.25185
0.68699 0.67900 1.69775 1.63232
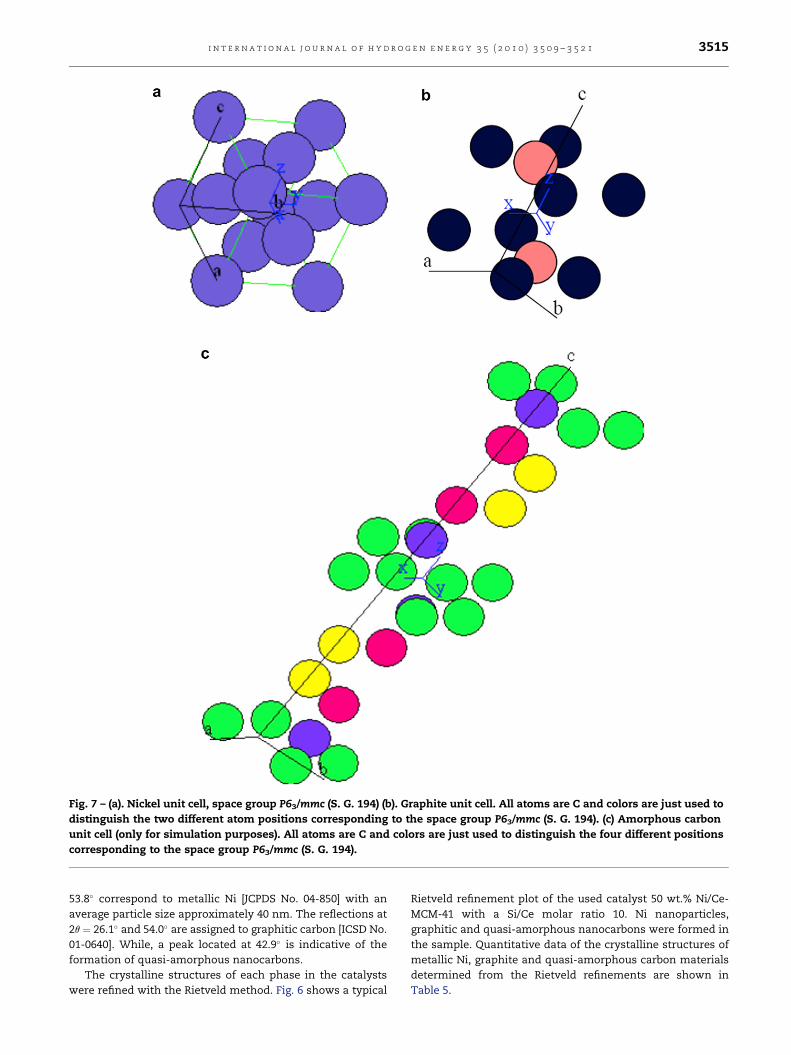
Fig. 7 – (a). Nickel unit cell, space group P63/mmc (S. G. 194) (b). Graphite unit cell. All atoms are C and colors are just used to
distinguish the two different atom positions corresponding to the space group P63/mmc (S. G. 194). (c) Amorphous carbon
unit cell (only for simulation purposes). All atoms are C and colors are just used to distinguish the four different positions
corresponding to the space group P63/mmc (S. G. 194).
i n t e r n a t i o n a l j o u r n a l o f h y d r o g e n e n e r g y 3 5 ( 2 0 1 0 ) 3 5 0 9 – 3 5 2 1 3515
53.8� correspond to metallic Ni [JCPDS No. 04-850] with an
average particle size approximately 40 nm. The reflections at
2q ¼ 26.1� and 54.0� are assigned to graphitic carbon [ICSD No.
01-0640]. While, a peak located at 42.9� is indicative of the
formation of quasi-amorphous nanocarbons.
The crystalline structures of each phase in the catalysts
were refined with the Rietveld method. Fig. 6 shows a typical
Rietveld refinement plot of the used catalyst 50 wt.% Ni/Ce-
MCM-41 with a Si/Ce molar ratio 10. Ni nanoparticles,
graphitic and quasi-amorphous nanocarbons were formed in
the sample. Quantitative data of the crystalline structures of
metallic Ni, graphite and quasi-amorphous carbon materials
determined from the Rietveld refinements are shown in
Table 5.
800 1000 1200 1400 1600 1800
1585
cm
-1
1352
.5 c
m-1
50wt% Ni/Ce-MCM-41-5
50 wt %NI/Ce-MCM-41-10
50wt % Ni/Ce-MCM-41-20
Raman Shift (cm-1)
Inte
nsity
(a.u
.)
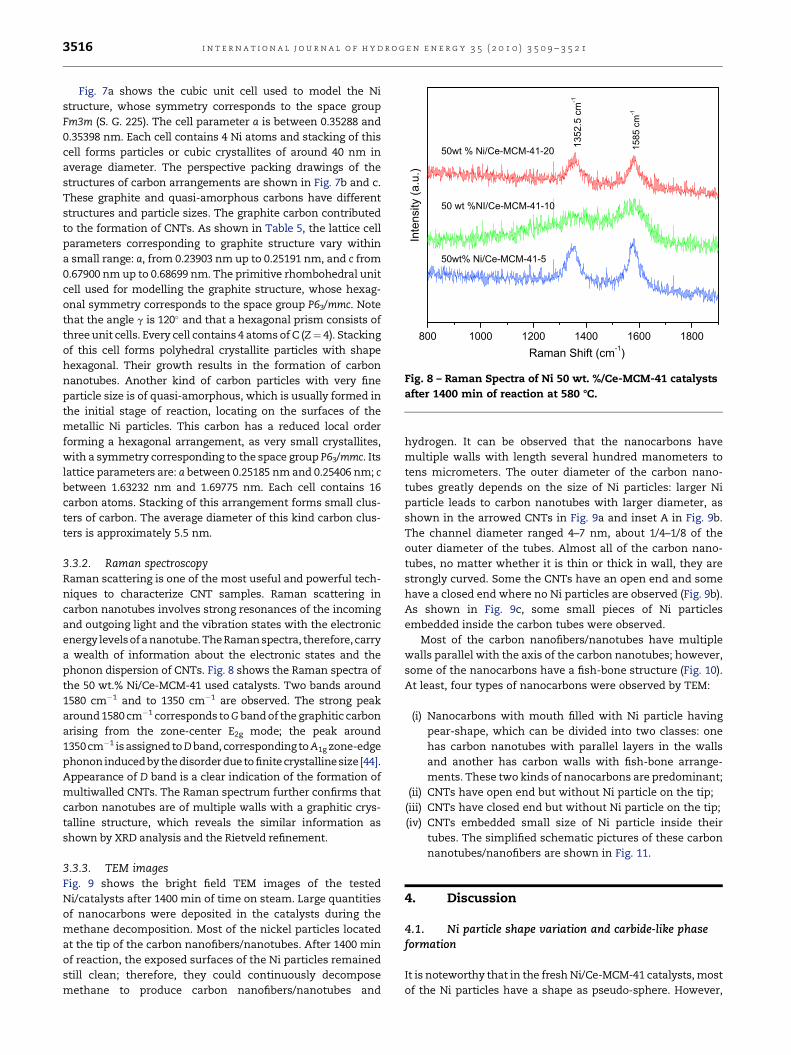
Fig. 8 – Raman Spectra of Ni 50 wt. %/Ce-MCM-41 catalysts
after 1400 min of reaction at 580 8C.
i n t e r n a t i o n a l j o u r n a l o f h y d r o g e n e n e r g y 3 5 ( 2 0 1 0 ) 3 5 0 9 – 3 5 2 13516
Fig. 7a shows the cubic unit cell used to model the Ni
structure, whose symmetry corresponds to the space group
Fm3m (S. G. 225). The cell parameter a is between 0.35288 and
0.35398 nm. Each cell contains 4 Ni atoms and stacking of this
cell forms particles or cubic crystallites of around 40 nm in
average diameter. The perspective packing drawings of the
structures of carbon arrangements are shown in Fig. 7b and c.
These graphite and quasi-amorphous carbons have different
structures and particle sizes. The graphite carbon contributed
to the formation of CNTs. As shown in Table 5, the lattice cell
parameters corresponding to graphite structure vary within
a small range: a, from 0.23903 nm up to 0.25191 nm, and c from
0.67900 nm up to 0.68699 nm. The primitive rhombohedral unit
cell used for modelling the graphite structure, whose hexag-
onal symmetry corresponds to the space group P63/mmc. Note
that the angle g is 120� and that a hexagonal prism consists of
three unit cells. Every cell contains 4 atoms of C (Z¼ 4). Stacking
of this cell forms polyhedral crystallite particles with shape
hexagonal. Their growth results in the formation of carbon
nanotubes. Another kind of carbon particles with very fine
particle size is of quasi-amorphous, which is usually formed in
the initial stage of reaction, locating on the surfaces of the
metallic Ni particles. This carbon has a reduced local order
forming a hexagonal arrangement, as very small crystallites,
with a symmetry corresponding to the space group P63/mmc. Its
lattice parameters are: a between 0.25185 nm and 0.25406 nm; c
between 1.63232 nm and 1.69775 nm. Each cell contains 16
carbon atoms. Stacking of this arrangement forms small clus-
ters of carbon. The average diameter of this kind carbon clus-
ters is approximately 5.5 nm.
3.3.2. Raman spectroscopyRaman scattering is one of the most useful and powerful tech-
niques to characterize CNT samples. Raman scattering in
carbon nanotubes involves strong resonances of the incoming
and outgoing light and the vibration states with the electronic
energy levels of a nanotube. The Raman spectra, therefore,carry
a wealth of information about the electronic states and the
phonon dispersion of CNTs. Fig. 8 shows the Raman spectra of
the 50 wt.% Ni/Ce-MCM-41 used catalysts. Two bands around
1580 cm�1 and to 1350 cm�1 are observed. The strong peak
around 1580 cm�1 corresponds to G band of the graphitic carbon
arising from the zone-center E2g mode; the peak around
1350 cm�1 is assigned to D band, corresponding to A1g zone-edge
phonon inducedby the disorder due to finite crystalline size [44].
Appearance of D band is a clear indication of the formation of
multiwalled CNTs. The Raman spectrum further confirms that
carbon nanotubes are of multiple walls with a graphitic crys-
talline structure, which reveals the similar information as
shown by XRD analysis and the Rietveld refinement.
3.3.3. TEM imagesFig. 9 shows the bright field TEM images of the tested
Ni/catalysts after 1400 min of time on steam. Large quantities
of nanocarbons were deposited in the catalysts during the
methane decomposition. Most of the nickel particles located
at the tip of the carbon nanofibers/nanotubes. After 1400 min
of reaction, the exposed surfaces of the Ni particles remained
still clean; therefore, they could continuously decompose
methane to produce carbon nanofibers/nanotubes and
hydrogen. It can be observed that the nanocarbons have
multiple walls with length several hundred manometers to
tens micrometers. The outer diameter of the carbon nano-
tubes greatly depends on the size of Ni particles: larger Ni
particle leads to carbon nanotubes with larger diameter, as
shown in the arrowed CNTs in Fig. 9a and inset A in Fig. 9b.
The channel diameter ranged 4–7 nm, about 1/4–1/8 of the
outer diameter of the tubes. Almost all of the carbon nano-
tubes, no matter whether it is thin or thick in wall, they are
strongly curved. Some the CNTs have an open end and some
have a closed end where no Ni particles are observed (Fig. 9b).
As shown in Fig. 9c, some small pieces of Ni particles
embedded inside the carbon tubes were observed.
Most of the carbon nanofibers/nanotubes have multiple
walls parallel with the axis of the carbon nanotubes; however,
some of the nanocarbons have a fish-bone structure (Fig. 10).
At least, four types of nanocarbons were observed by TEM:
(i) Nanocarbons with mouth filled with Ni particle having
pear-shape, which can be divided into two classes: one
has carbon nanotubes with parallel layers in the walls
and another has carbon walls with fish-bone arrange-
ments. These two kinds of nanocarbons are predominant;
(ii) CNTs have open end but without Ni particle on the tip;
(iii) CNTs have closed end but without Ni particle on the tip;
(iv) CNTs embedded small size of Ni particle inside their
tubes. The simplified schematic pictures of these carbon
nanotubes/nanofibers are shown in Fig. 11.
4. Discussion
4.1. Ni particle shape variation and carbide-like phaseformation
It is noteworthy that in the fresh Ni/Ce-MCM-41 catalysts, most
of the Ni particles have a shape as pseudo-sphere. However,
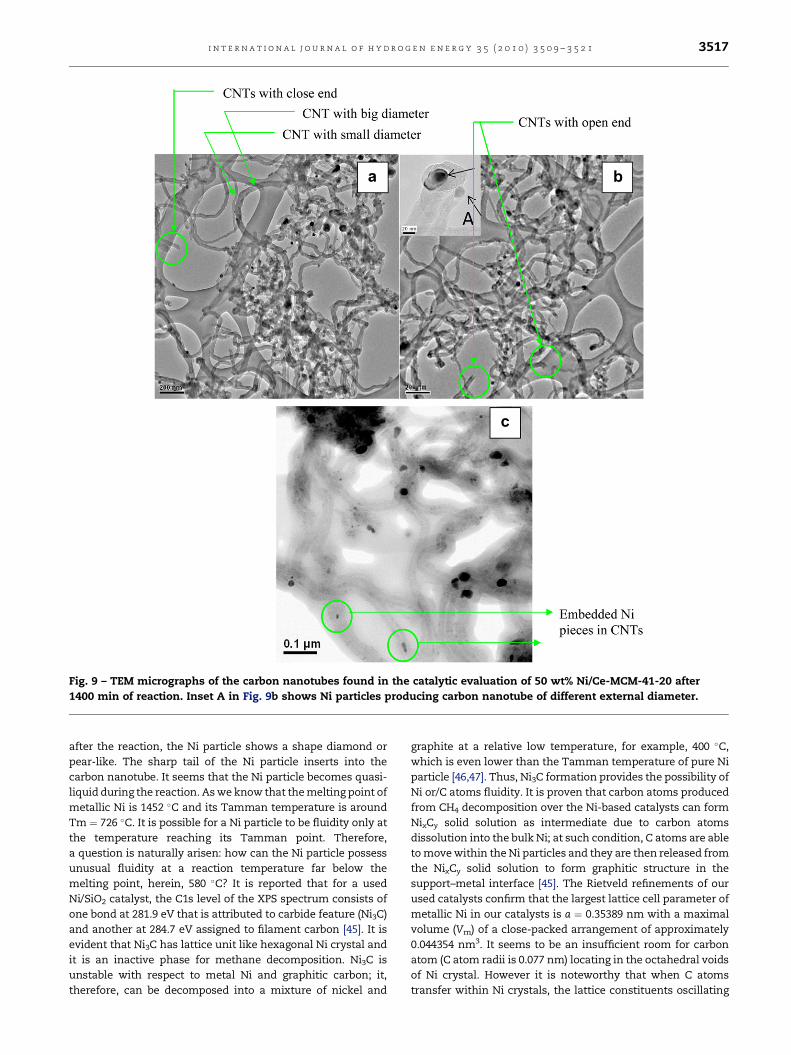
Fig. 9 – TEM micrographs of the carbon nanotubes found in the catalytic evaluation of 50 wt% Ni/Ce-MCM-41-20 after
1400 min of reaction. Inset A in Fig. 9b shows Ni particles producing carbon nanotube of different external diameter.
i n t e r n a t i o n a l j o u r n a l o f h y d r o g e n e n e r g y 3 5 ( 2 0 1 0 ) 3 5 0 9 – 3 5 2 1 3517
after the reaction, the Ni particle shows a shape diamond or
pear-like. The sharp tail of the Ni particle inserts into the
carbon nanotube. It seems that the Ni particle becomes quasi-
liquid during the reaction. As we know that the melting point of
metallic Ni is 1452 �C and its Tamman temperature is around
Tm ¼ 726 �C. It is possible for a Ni particle to be fluidity only at
the temperature reaching its Tamman point. Therefore,
a question is naturally arisen: how can the Ni particle possess
unusual fluidity at a reaction temperature far below the
melting point, herein, 580 �C? It is reported that for a used
Ni/SiO2 catalyst, the C1s level of the XPS spectrum consists of
one bond at 281.9 eV that is attributed to carbide feature (Ni3C)
and another at 284.7 eV assigned to filament carbon [45]. It is
evident that Ni3C has lattice unit like hexagonal Ni crystal and
it is an inactive phase for methane decomposition. Ni3C is
unstable with respect to metal Ni and graphitic carbon; it,
therefore, can be decomposed into a mixture of nickel and
graphite at a relative low temperature, for example, 400 �C,
which is even lower than the Tamman temperature of pure Ni
particle [46,47]. Thus, Ni3C formation provides the possibility of
Ni or/C atoms fluidity. It is proven that carbon atoms produced
from CH4 decomposition over the Ni-based catalysts can form
NixCy solid solution as intermediate due to carbon atoms
dissolution into the bulk Ni; at such condition, C atoms are able
to move within the Ni particles and they are then released from
the NixCy solid solution to form graphitic structure in the
support–metal interface [45]. The Rietveld refinements of our
used catalysts confirm that the largest lattice cell parameter of
metallic Ni in our catalysts is a ¼ 0.35389 nm with a maximal
volume (Vm) of a close-packed arrangement of approximately
0.044354 nm3. It seems to be an insufficient room for carbon
atom (C atom radii is 0.077 nm) locating in the octahedral voids
of Ni crystal. However it is noteworthy that when C atoms
transfer within Ni crystals, the lattice constituents oscillating
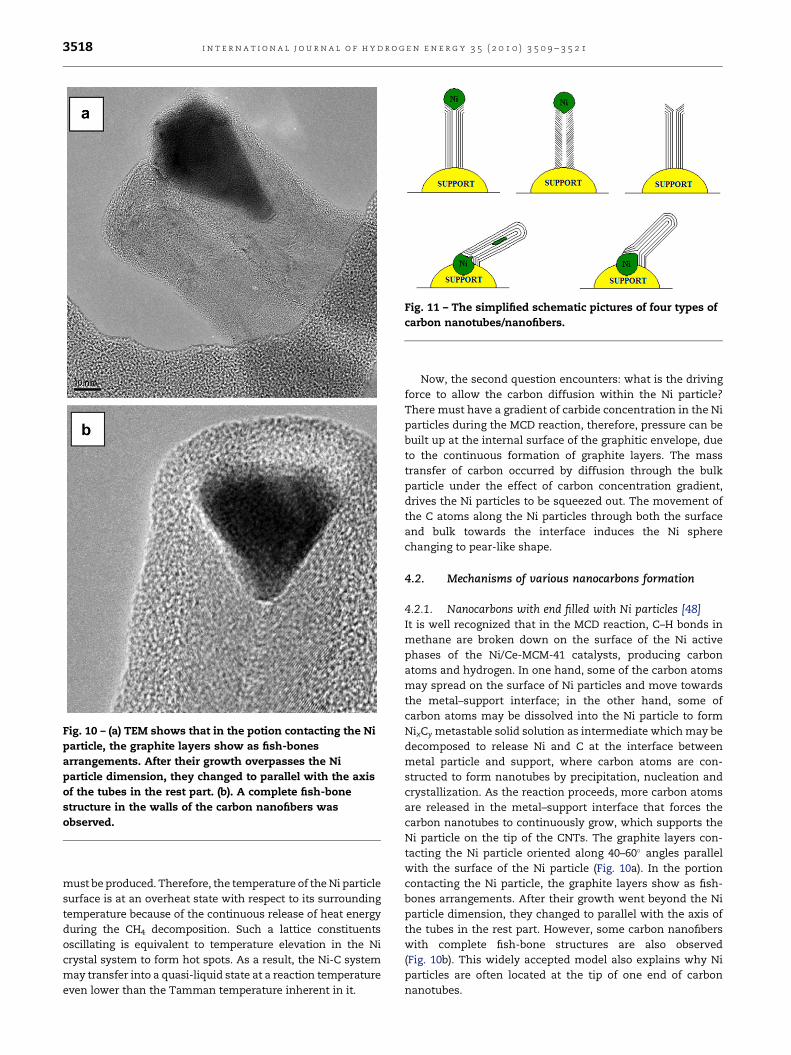
Fig. 10 – (a) TEM shows that in the potion contacting the Ni
particle, the graphite layers show as fish-bones
arrangements. After their growth overpasses the Ni
particle dimension, they changed to parallel with the axis
of the tubes in the rest part. (b). A complete fish-bone
structure in the walls of the carbon nanofibers was
observed.
Fig. 11 – The simplified schematic pictures of four types of
carbon nanotubes/nanofibers.
i n t e r n a t i o n a l j o u r n a l o f h y d r o g e n e n e r g y 3 5 ( 2 0 1 0 ) 3 5 0 9 – 3 5 2 13518
must be produced. Therefore, the temperature of the Ni particle
surface is at an overheat state with respect to its surrounding
temperature because of the continuous release of heat energy
during the CH4 decomposition. Such a lattice constituents
oscillating is equivalent to temperature elevation in the Ni
crystal system to form hot spots. As a result, the Ni-C system
may transfer into a quasi-liquid state at a reaction temperature
even lower than the Tamman temperature inherent in it.
Now, the second question encounters: what is the driving
force to allow the carbon diffusion within the Ni particle?
There must have a gradient of carbide concentration in the Ni
particles during the MCD reaction, therefore, pressure can be
built up at the internal surface of the graphitic envelope, due
to the continuous formation of graphite layers. The mass
transfer of carbon occurred by diffusion through the bulk
particle under the effect of carbon concentration gradient,
drives the Ni particles to be squeezed out. The movement of
the C atoms along the Ni particles through both the surface
and bulk towards the interface induces the Ni sphere
changing to pear-like shape.
4.2. Mechanisms of various nanocarbons formation
4.2.1. Nanocarbons with end filled with Ni particles [48]It is well recognized that in the MCD reaction, C–H bonds in
methane are broken down on the surface of the Ni active
phases of the Ni/Ce-MCM-41 catalysts, producing carbon
atoms and hydrogen. In one hand, some of the carbon atoms
may spread on the surface of Ni particles and move towards
the metal–support interface; in the other hand, some of
carbon atoms may be dissolved into the Ni particle to form
NixCy metastable solid solution as intermediate which may be
decomposed to release Ni and C at the interface between
metal particle and support, where carbon atoms are con-
structed to form nanotubes by precipitation, nucleation and
crystallization. As the reaction proceeds, more carbon atoms
are released in the metal–support interface that forces the
carbon nanotubes to continuously grow, which supports the
Ni particle on the tip of the CNTs. The graphite layers con-
tacting the Ni particle oriented along 40–60� angles parallel
with the surface of the Ni particle (Fig. 10a). In the portion
contacting the Ni particle, the graphite layers show as fish-
bones arrangements. After their growth went beyond the Ni
particle dimension, they changed to parallel with the axis of
the tubes in the rest part. However, some carbon nanofibers
with complete fish-bone structures are also observed
(Fig. 10b). This widely accepted model also explains why Ni
particles are often located at the tip of one end of carbon
nanotubes.
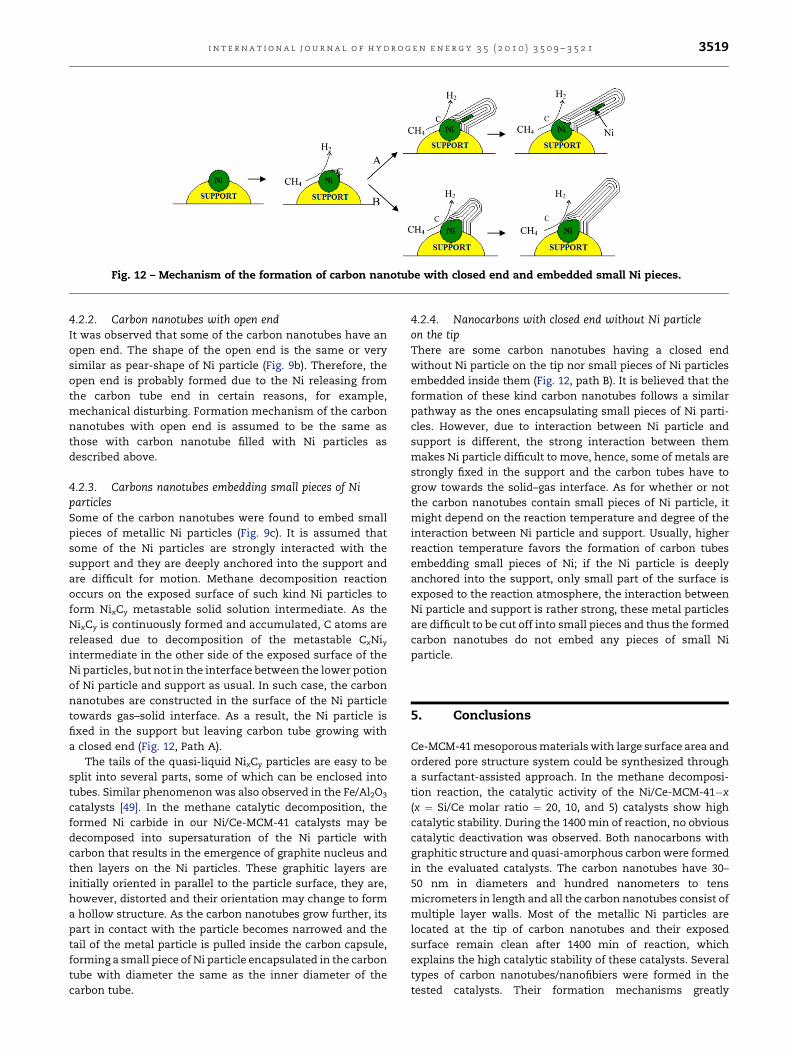
Fig. 12 – Mechanism of the formation of carbon nanotube with closed end and embedded small Ni pieces.
i n t e r n a t i o n a l j o u r n a l o f h y d r o g e n e n e r g y 3 5 ( 2 0 1 0 ) 3 5 0 9 – 3 5 2 1 3519
4.2.2. Carbon nanotubes with open endIt was observed that some of the carbon nanotubes have an
open end. The shape of the open end is the same or very
similar as pear-shape of Ni particle (Fig. 9b). Therefore, the
open end is probably formed due to the Ni releasing from
the carbon tube end in certain reasons, for example,
mechanical disturbing. Formation mechanism of the carbon
nanotubes with open end is assumed to be the same as
those with carbon nanotube filled with Ni particles as
described above.
4.2.3. Carbons nanotubes embedding small pieces of NiparticlesSome of the carbon nanotubes were found to embed small
pieces of metallic Ni particles (Fig. 9c). It is assumed that
some of the Ni particles are strongly interacted with the
support and they are deeply anchored into the support and
are difficult for motion. Methane decomposition reaction
occurs on the exposed surface of such kind Ni particles to
form NixCy metastable solid solution intermediate. As the
NixCy is continuously formed and accumulated, C atoms are
released due to decomposition of the metastable CxNiyintermediate in the other side of the exposed surface of the
Ni particles, but not in the interface between the lower potion
of Ni particle and support as usual. In such case, the carbon
nanotubes are constructed in the surface of the Ni particle
towards gas–solid interface. As a result, the Ni particle is
fixed in the support but leaving carbon tube growing with
a closed end (Fig. 12, Path A).
The tails of the quasi-liquid NixCy particles are easy to be
split into several parts, some of which can be enclosed into
tubes. Similar phenomenon was also observed in the Fe/Al2O3
catalysts [49]. In the methane catalytic decomposition, the
formed Ni carbide in our Ni/Ce-MCM-41 catalysts may be
decomposed into supersaturation of the Ni particle with
carbon that results in the emergence of graphite nucleus and
then layers on the Ni particles. These graphitic layers are
initially oriented in parallel to the particle surface, they are,
however, distorted and their orientation may change to form
a hollow structure. As the carbon nanotubes grow further, its
part in contact with the particle becomes narrowed and the
tail of the metal particle is pulled inside the carbon capsule,
forming a small piece of Ni particle encapsulated in the carbon
tube with diameter the same as the inner diameter of the
carbon tube.
4.2.4. Nanocarbons with closed end without Ni particleon the tipThere are some carbon nanotubes having a closed end
without Ni particle on the tip nor small pieces of Ni particles
embedded inside them (Fig. 12, path B). It is believed that the
formation of these kind carbon nanotubes follows a similar
pathway as the ones encapsulating small pieces of Ni parti-
cles. However, due to interaction between Ni particle and
support is different, the strong interaction between them
makes Ni particle difficult to move, hence, some of metals are
strongly fixed in the support and the carbon tubes have to
grow towards the solid–gas interface. As for whether or not
the carbon nanotubes contain small pieces of Ni particle, it
might depend on the reaction temperature and degree of the
interaction between Ni particle and support. Usually, higher
reaction temperature favors the formation of carbon tubes
embedding small pieces of Ni; if the Ni particle is deeply
anchored into the support, only small part of the surface is
exposed to the reaction atmosphere, the interaction between
Ni particle and support is rather strong, these metal particles
are difficult to be cut off into small pieces and thus the formed
carbon nanotubes do not embed any pieces of small Ni
particle.
5. Conclusions
Ce-MCM-41 mesoporous materials with large surface area and
ordered pore structure system could be synthesized through
a surfactant-assisted approach. In the methane decomposi-
tion reaction, the catalytic activity of the Ni/Ce-MCM-41�x
(x ¼ Si/Ce molar ratio ¼ 20, 10, and 5) catalysts show high
catalytic stability. During the 1400 min of reaction, no obvious
catalytic deactivation was observed. Both nanocarbons with
graphitic structure and quasi-amorphous carbon were formed
in the evaluated catalysts. The carbon nanotubes have 30–
50 nm in diameters and hundred nanometers to tens
micrometers in length and all the carbon nanotubes consist of
multiple layer walls. Most of the metallic Ni particles are
located at the tip of carbon nanotubes and their exposed
surface remain clean after 1400 min of reaction, which
explains the high catalytic stability of these catalysts. Several
types of carbon nanotubes/nanofibiers were formed in the
tested catalysts. Their formation mechanisms greatly
i n t e r n a t i o n a l j o u r n a l o f h y d r o g e n e n e r g y 3 5 ( 2 0 1 0 ) 3 5 0 9 – 3 5 2 13520
depended on the reaction temperature and degree of the
interaction between the metallic Ni and the support.
Acknowledgments
The authors thank the financial support from CONACyT-
Mexico (Grant No. CONACyT-51007) and Instituto de Ciencia y
Tecnologia de la Ciudad de Mexico (ICyTDF2008) and Instituto
Politecnico Nacional, Mexico (IPN-SIP-20082507 and IPN-SIP-
20090826). J. C. Guevara thanks the Instituto Politecnico
Nacional, Mexico for providing him doctoral scholarship.
r e f e r e n c e s
[1] Aiello R, Fiscus JE, Loyea Z, Amiridis MD. Hydrogenproduction via the direct cracking of methane over Ni/SiO2:catalyst deactivation and regeneration. Applied Catalysis A:General 2000;192(2):227–34.
[2] Li Y, Chen J, Qin Y, Chang L. Simultaneous production ofhydrogen and nanocarbon from decomposition of methane ona nickel-based catalyst. Energy and Fuels 2000;14(6):1188–94.
[3] Gosselink JW. Pathways to a more sustainable production ofenergy: sustainable hydrogenda research objective for shell.International Journal of Hydrogen Energy 2002;27(11–12):1125–9.
[4] Zhang T, Amiridis MD. Hydrogen production via the directcracking of methane over silica-supported nickel catalysts.Applied Catalysis A: General 1998;167(2):161–72.
[5] Holladay JD, Hu J, King DL, Wang Y. An overview of hydrogenproduction technologies. Catalysis Today 2009;139(4):244–60.
[6] Armor JN. The multiple roles for catalysis in the productionof H2. Applied Catalysis A: General 1999;176(2):159–76.
[7] Song CS. Fuel processing for low-temperature and high-temperature fuel cells: challenges, and opportunities forsustainable development in the 21st century. CatalysisToday 2002;77(1–2):17–49.
[8] MuHugh K. Hydrogen production methods. MPR AssociatesInc; 2005. pp. 41.
[9] Song H, Zhang L, Ozkan US. Effect of synthesis parameterson the catalytic activity of Co–ZrO2 for bio-ethanol steamreforming. Green Chemistry 2007;9(6):686–94.
[10] Hoogers G. Fuel cell technology handbook. Boca Raton: CRCPress; 2003. pp. 23.
[11] Zhang Y, Smith KJ. CH4 decomposition on Co catalysts: effectof temperature, dispersion, and the presence of H2 or CO inthe feed. Catalysis Today 2002;77(3):257–68.
[12] Chum HI, Overend RP. Biomass and renewable fuels. FuelProcessing Technology 2001;71(1–3):187–95.
[13] Muradov N. CO2-free production of hydrogen by catalyticpyrolysis of hydrocarbon fuel. Energy and Fuels 1998;12(1):41–8.
[14] Shah N, Panjala D, Huffman GP. Hydrogen production bycatalytic decomposition of methane. Energy and Fuels 2001;15(6):1528–34.
[15] Otsuka K, Takenaka S. Production of hydrogen frommethane by a CO2 emission-suppressed process: methanedecomposition and gasification of carbon nanofibers.Catalysis Surveys from Asia 2004;8(2):77–90.
[16] Wang H, Baker RTK. Decomposition of methane overa Ni�Cu�MgO catalyst to produce hydrogen and carbonnanofibers. The Journal of Physical Chemistry B 2004;108(52):20273–7.
[17] Couttenye RA, De Vila MH, Suib SL. Decomposition ofmethane with an autocatalytically reduced nickel catalyst.Journal of Catalysis 2005;233(2):317–26.
[18] Muradov N. Hydrogen via methane decomposition: anapplication for decarbonization of fossil fuels. InternationalJournal of Hydrogen Energy 2001;26:1165–75.
[19] Muradov NZ, Veziroglu TN. From hydrocarbon to hydrogen–carbon to hydrogen economy. International Journal ofHydrogen Energy 2005;30:225–37.
[20] Otsuka K, Kobayashi S, Takenaka S. Hydrogen–deuteriumexchange studies on the decomposition of methane overNi/SiO2. Journal of Catalysis 2001;200(1):4–9.
[21] Emrakova MA, Emrakov DY, Plyasova LM, Kuvshinov GG.XRD studies of evolution of catalytic nickel nanoparticlesduring synthesis of filamentous carbon from methane.Catalysis Letters 1999;62(2–4):93–7.
[22] Venugopal A, Naveen S, Ashok J, Hari Prasad D, DurgaKumari V, Prasad KBS, et al. Hydrogen production bycatalytic decomposition of methane over Ni/SiO2.International Journal of Hydrogen Energy 2007;32(12):1782–8.
[23] De Jong KP, Gues JW. Carbon nanofibers: catalytic synthesisand applications. Catalysis Reviews Science and Engineering2000;42(4):481–510.
[24] Takenaka S, Ogihara H, Yamanaka I, Otsuka K.Decomposition of methane over supported-Ni catalysts:effects of the supports on the catalytic lifetime. AppliedCatalysis A: General 2001;217(1–2):101–10.
[25] Chesnokov VV, Chichkan AS. Production of hydrogen bymethane catalytic decomposition over Ni–Cu–Fe/Al2O3 catalyst.International Journal of Hydrogen Energy 2009;34(7):2979–85.
[26] Ashok J, Raju G, Shiva Reddy P, Subrahmanyam M,Venugopal A. Catalytic decomposition of CH4 over NiO–Al2O3–SiO2 catalysts: influence of catalyst preparationconditions on the production of H2. International Journal ofHydrogen Energy 2008;33(18):4809–18.
[27] Gonzalez OA, Valenzuela MA, Wang JA. Catalyticdecomposition of methane over cerium-doped Ni catalysts,in the book ‘‘The Hydrogen Cycle Generation, Storage, andFuel cells’’. Materials Research Society SymposiaProceedings. Materials Research Society 2006;885(E):223–38.
[28] Valenzuela MA, Gonzalez O, Cordova I, Flores S, Wang JA.Hydrogen production by methane decomposition on nickel/zinc aluminate catalyst. Chemical Engineering Transactions2004;4(1):61–6.
[29] Salmones J, Wang JA, Valenzuela MA, Sanchez E, Garcia A.Pore geometry influence on the deactivation behaviors of Ni-based catalysts for simultaneous production of hydrogenand nanocarbon. Catalysis Today 2009;148(1–2):134–9.
[30] Lazaro MJ, Pinilla JL, Suelves I, Moliner R. Study of thedeactivation mechanism of carbon blacks used in methanedecomposition. International Journal of Hydrogen Energy2008;33:4104–11.
[31] Bai Z, Chen H, Li B, Li W. Methane decomposition over Niloaded activated carbon for hydrogen production and theformation of filamentous carbon. International Journal ofHydrogen Energy 2007;32:32–7.
[32] Serrano DP, Botas JA, Guil-Lopez R. H2 production frommethane pyrolysis over commercial carbon catalysts: kineticand deactivation study. International Journal of HydrogenEnergy 2009;34:4488–94.
[33] Ashok J, Subrahmanyam M, Venugopal A. Hydrotalcitestructure derived Ni–Cu–Al catalysts for the production of H2
by CH4 decomposition. International Journal of HydrogenEnergy 2008;33(11):2704–13.
[34] Li DX, Chen JL, Li DY. Evidence of composition deviation ofmetal particles of a Ni–Cu/Al2O3 catalyst during methanedecomposition to COx-free hydrogen. International Journalof Hydrogen Energy 2009;34(1):299–307.
i n t e r n a t i o n a l j o u r n a l o f h y d r o g e n e n e r g y 3 5 ( 2 0 1 0 ) 3 5 0 9 – 3 5 2 1 3521
[35] Nakagawa K, Nishitani M, Ando T. Hydrogen productionfrom methane for fuel cell using oxidized diamond-supported catalysts. International Journal Hydrogen Energy2005;30(1):201–7.
[36] Muradov N.Catalysisof methanedecompositionoverelementalcarbon. Catalysis Communications 2001;2(3–4):89–94.
[37] Rodriguez NM, Chambers A, Baker RTK. Catalyticengineering of carbon nanostructures. Langmuir 1995;11(10):3862–6.
[38] Terribile D, Trovarelli A, Llorca J, de Leitemburg C, Dolcetti G.The preparation of high surface area CeO2–ZrO2 mixedoxides by a surfactant-assisted approach. Catalysis Today1998;43(1–2):79–88.
[39] Chen LF, Wang JA, Norena L, Aguilar J, Navarrete J,Montoya JA, et al. Synthesis and physicochemical propertiesof Zr-MCM-41 mesoporous molecular sieves and Pt/H3PW12O40/Zr-MCM-41 catalysts. Journal of Solid StateChemistry 2007;180(11):2958–72.
[40] Rodrıguez-Carbajal MJ. Laboratoire Leon Brillouin (CEA-CNRS), [email protected]. France Tel: (33) 1 6908 3343,Fax: (33) 1 6908 8261.
[41] Young RA, Sakthivel A, Moss TS, Paiva-Santos CO. DBWS-9411-an upgrade of the DBWS*.* programs for Rietveldrefinement with PC and mainframe computers. Journal ofApplied Crystallography 1995;28(3):366–7.
[42] Carlos Enrique Daza, Alain Kiennemann, Sonia Moreno,Rafael Molina. Dry reforming of methane using Ni–Cecatalysts supported on a modified mineral clay. 2009;364(1–2): 65–74.
[43] Xu Shan, Yan Xingbin, Wang Xiaolai. Catalytic performancesof NiO–CeO2 for the reforming of methane with CO2 and O2.Fuel 2006;85(14–15):2243–7.
[44] Dresselhaus MS, Dresselhaus G, Saito R, Jorio A. Ramanspectroscopy in graphene. Physics Reports 2009;473(5–6):51–87.
[45] Choudhari TV, Sivadinarayana C, Chusei CC, Klinghoffer A,Goodman DW. Hydrogen production via catalyticdecomposition of methane. Journal of Catalysis 2001;199(1):9–18.
[46] Zaikovskii VI, Chesnokov VV, Buyanov RA. The relationshipbetween the state of active species in Ni/Al2O3 catalyst andthe mechanism of growth of filamentous carbon. Kineticsand Catalysis 2001;42(6):813–20.
[47] Nagakura SI. Study of metallic carbides by electrondiffraction part I. Formation and decomposition of nickelcarbide. Journal of the Physical Society of Japan 1957;12(2):482–94.
[48] Monzon A, Latorre N, Ubieto T, Royo C, Romeo E,Villacampa JI, et al. Improvement of activity and stabilityof Ni–Mg–Al catalysts by Cu addition during hydrogenproduction by catalytic decomposition of methane.Catalysis Today 2006;116(3):264–70.
[49] Ermakova MA, Ermakov DY, Chuvilin AL, Kuvshinov GG.Decomposition of methane over iron catalysts at the range ofmoderate temperatures: the influence of structure of thecatalytic systems and the reaction conditions on the yield ofcarbon and morphology of carbon filaments. Journal ofCatalysis 2001;201(2):183–97.