nicky c. caiazza california institute of technology ... · california institute of technology...
TRANSCRIPT
Nicky C. Caiazza California Institute of Technology Microbial Diversity Course 2006
Enrichments For Rare Phototrophs
Abstract Anoxygenic phototrophic bacteria are a diverse class of organisms that are evolutionarily and physiologically diverse. This report describes attempted enrichments for three rare classes of phototrophs. Two of the enrichments had a metabolic basis and utilized soluble reduced metal (Fe or Mn) as an electron source. The third enrichment aimed to isolate phototrophic spirochetes and was based on the inherent resistance of spirochetes to the antibacterial agent rifamycin SV. In all cases, none of the enrichments were able to be taken to the point of pure culture which would allow for successful identification of the organism by through 16s ribosomal sequence. However, growth and enrichment for phototrophic organisms was observed when Fe or Mn was used as the electron donors. The Fe enrichments did not proceed past a primary enrichment during the course. The Mn enrichments were transferred to secondary cultures and were also cultured on agar plates. The enrichment for phototrophic spirochetes was not successful. Only a handful of Fe oxidizing anoxygenic phototrophs have been isolated and Mn oxidizing anoxygenic phototrophs have yet to be cultured. Samples were collected at School Street Marsh in Woods Hole, MA for both the Fe and Mn oxidizing anoxygenic phototroph studies, indicating that this site may be of interest for future isolation attempts of these rare phototrophs.

Introduction To date, only a handful of Fe oxidizing phototrophs have been isolated and of these only one isolate (Rhodopseudomonas palustris TIE-1) is genetically tractable in the sense that it forms colonies on agar plates (1). To gain further insight into the evolutionary and phylogenic aspects of this ancient metabolism requires that more organisms with this metabolism be brought into culture. Furthermore, to fully understand the molecular mechanism of anoxygenic phototrophic Fe oxidation will require genetic tractability of the isolated organisms. Previous reports indicate that enriching for Fe oxidizing phototrophs is a slow process and can take up to 4 weeks (2). A possible reason for the slow growth of these organisms may be inherently related to the metabolism itself. Upon oxidation of soluble Fe(II), insoluble Fe(III) (hydro)oxides form which can encase the organism and possibly hinder cell growth and division. In an effort to minimize this potential problem an iron chelator was added to the medium in the from of nitrilotriacetic acid (NTA). The logK of Fe(III)-NTA is 15.87 while the logK of Fe(II)-NTA is 8.84 (NIST database) indicating that NTA has much greater affinity for Fe(III) than Fe(II) and might preferentially chelate the Fe(III) that results from anoxygenic phototrophic Fe oxidation and prevent cell encrustation. A second advantage of using a chelator is that it can affect the thermodynamics of the redox couple. Based on the Nernst equation: εh = εh˚ - (RT/F) ln (k product-ligand / k reactant-ligand) When a chelator is used that preferentially binds Fe(III) (the product of Fe oxidation) over Fe(II) (the reactant of Fe oxidation) the midpoint potential of the Fe(III)/Fe(II) redox couple will be lowered making it a more reducing electron donor and may ultimately enhance the kinetics of Fe based phototrophy. To date, the only genetically tractable anoxygenic Fe oxidizing phototroph cultured was isolated from an iron mat in School Street Marsh located in Woods Hole, MA (1). Therefore I sampled this iron mat and set up enrichments for Fe oxidizing phototrophic bacteria. In addition to setting up enrichments on soluble Fe(II), enrichments were set up using Fe(II) complexed to NTA for the reasons mentioned above.
There have been no reports of the existence of anoxygenic phototrophic Mn oxidizing bacteria despite the fact that this metabolism is thermodynamically possible. The midpoint potential of the Mn redox couple is similar to that of Fe (~+0.2 kV) making it a thermodynamically suitable electron donor for anoxygenic photosynthesis (the photosynthetic reaction center of purple non-sulfur bacteria have a redox potential of ~+0.45 kV). Furthermore, in comparison to Fe the reduced form of Mn is far more stable in the presence of atmospheric O2 making it all the more likely that Mn oxides observed in the environment are biological in origin. In addition to oxidized Fe, the microbial mat located at School Street Marsh also contains manganese oxides. Due to the fact that these Mn oxides are located in the midst of a microbial mat indicates that they may be of biological and could possibly be a result of anoxygenic photosynthesis since the O2 -concentration in a microbial mat or biofilm is rapidly depleted. Therefore, School Street

Marsh mat material served as the inoculum for Mn based anoxygenic phototroph enrichments.
As mentioned above microbial mats are microbiologically diverse. A second microbial mat that we visited during the course was marine and located in Sippiwisset Salt Marsh. Here we were able to isolate phototrophs that belonged to the following bacterial classes; purple sulfur, purple non-sulfur, and green sulfur. However, upon microscopic observation spirochetes were present in both mat material and even in some of the primary phototroph enrichment cultures. This begs us to question the possible existence of phototrophic spirochetes. To date no cultured spirochetes have been reported to be photosynthetic. To address this we isolated mat material from Sippiwisset Salt Marsh and inoculated it into medium containing rifamycin (spirochetes are naturally resistant to this antibacterial agent) and incubated the contents anaerobic photosynthetic conditions.

Material and Methods media: Fe or Mn medium 1x Fresh water base 975 mL 1M MOPS, pH 6.8 2.5 mL 0.5 M NH4Cl 10 mL 150 mM phosphate sol’n 1 mL HCL trace elements 1 mL autoclave in 2 Vessel cool under stream of CO2 12-vitamin sol’n 0.1 mL Vitamin B12 sol’n 0.1 mL 1 M NaSulfate 0.25 mL 1 M Bicarb/CO2 70 mL DCMU 12.5 mg transfer to 1 L bottle, tighten cap, move into glove box 1 M FeCl2 or 1M MnCl2 10 mL shake and let sit over night Filter into sterile, anaerobic 1 L bottle aliquot into sterile anaerobic serum bottles exchange headspace with N2 CO2 mixed gas add NTA to 10 mM from 0.5 M stock with syringe where applicable Spirochete medium 1x seawater base 975 mL 1M MOPS, pH 7.2 2.5 mL 0.5 M NH4Cl 10 mL 150 mM phosphate sol’n 10 mL HCL trace elements 1 mL BMS 2 g 1 M NaSuccinate 10 mL 1 M NaAcetate 10 mL autoclave in Widdel Vessel cool under stream of CO2 12-vitamin sol’n 0.1 mL Vitamin B12 sol’n 0.1 mL 1 M NaThioSulfate 10 mL 1 M Bicarb/CO2 70 mL 1 M sulfide 1 mL DCMU 12.5 mg
rifamycin SV 0.1% w/v dispense into Pfenning bottles Sample collection and inoculation School Street Marsh Samples were taken from two locations for Fe experiments. Samples were either taken from the flocculent material of the mat or from the sediment below the mat. Samples(~20 mL) were collected in 50 mL falcon tubes and taken back to the lab. For Mn experiments samples were collected from the surface water above the mat where a blue iridescent material corresponding to Mn oxides was found. Samples (~20 mL) were collected in 50 mL falcon tubes and taken back to the lab. Once back in the lab ~200 µL of sample was inoculated with a syringe into serum bottles containing 50 mL of medium and the bottles were incubated under different light regimes (880 nm, 660 nm, 575 nm, and 470 nm) at room temperature. Sippiwisset Salt Marsh Mat samples were a gift from Naomi Levine and Erika Quintana. Pea sized (~200 mg) bits of mat were removed and inoculated into spirochete phototroph medium and incubated under different light regimes (880 nm, 660 nm, 575 nm, and 470 nm) at room temperature. Alternatively, 200 µL aliquots from the group IV’s primary succinate-based phototroph enrichment at 880 nm was inoculated into spirochete phototroph medium and incubated at 880 nm at room temperature. Transfers For the Mn oxidizing phototroph enrichment, after 2.5 weeks, growth was sufficient for the primary culture at 880 nm to be transferred. 5 mL of this culture was removed with a syringe and transferred to a serum bottle with 50 mL of fresh medium and the contents were incubated at room temperature in front of a white incandescent light. Ferrozine assay Aliquots were removed from a given culture with a syringe and placed on a piece of parafilm. 10 µL of the aliquot was immediately transferred to 990 µL of 1 N HCl. 150 µL of the diluted sample was added to 1.5 mL of ferrozine (12 g/L in HEPES, pH 7.0) reagent in a cuvette and mixed. Absorbance measurements were recorded at 562 nm and a standard curve was used to determine the Fe(II) concentration of the sample. Pigment Analysis For pigment analysis 10 mL of sample was removed from a 2.5 week old culture, pelleted, and resuspended in 1 m L of clean medium (which was used a blank) and the absorbance spectra was measured from 200 nm –1000 nm. Alternatively, 10 mL of sample was removed from a 2.5-week-old culture and extracted with 2 mL of ethyl

acetate. The organic phase was removed and the absorbance spectra were measured in a quartz cuvette from 200 nm –1000 nm. Pure ethyl acetate was used as the blank. DNA Extraction and molecular techniques DNA was extracted from mat material and from sediment from the microbial mat at School Street Marsh using the Mobio Ultraclean soil DNA isolation kit as described by the manufacturer. For PCR, 1:10 dilutions of the DNA were used in 25 uL reactions using a 2x master mix containing primers (0.4 µg oligo) specific to the pio genes.

Results Anoxygenic Fe oxidizing phototrophs Environmental samples were collected from School Street Marsh. Images of School Street Marsh and sample collection are show below in Figure 1. Figure 1 School Street Marsh Fe Mat. Left and middle are images of flocculent mat material. Right image shows sample collection. Once taken back to the lab, samples were inoculated into medium containing Fe(II) as the sole electron source and incubated under various light regimes as described in the methods section. Upon inoculation and at the end of the experiment (2.5 weeks of incubation) Fe(II) levels were recorded using the ferrozine assay (Figure 2).
Figure 2. Fe oxidation. The Fe concentration of the various bottle was measured immediately after inoculation and was ~3 mM and is represented by the start column. After 2.5 weeks of incubation the Fe(II) levels were again measured using the ferrozine assay. Little Fe(II) oxidation was observed over the course of 2.5 weeks. The maximum oxidation occurred from mat samples that were incubated at 880 nm and 660 nm and the Fe(II) concentration decreased from ~3 mM to ~2.25 mM. The chelator NTA had little affect on iron oxidation. More Fe oxidation was observed in higher wavelength light which corresponds to purple sulfur, and non-sulfur bacteria and it noteworthy to mention
Figure 2 Fe Oxidation
0
0.5
1
1.5
2
2.5
3
3.5
start 880 mat 880 mat
NTA
880 sed NTA 470 mat 525 mat 660 mat
Fe(II) m
M

that phototrophic Fe oxidizing purple non-sulfur bacteria have been isolated from this site (1). Although little Fe was oxidized when the mat material was incubated at 880 nm, iron precipitates could still be observed on the inside of the serum bottle and on the walls of the serum vial (Figure 3). Figure 3. Image of serum bottle tipped upside down. The black arrow points to a faint ring of Fe oxide that has precipitated on the wall of the vial after 2.5 weeks of incubation at 880 nm. Furthermore, when sample was removed from the culture bottle shown in Figure 3 and observed under the microscope cells that were encrusted in Fe precipitates were clearly visible (Figure 4). Figure 4. 40x phase contrast image of phototrophically grown cells on Fe(II) at 880 nm. The cells are clumped together in small microcolonies and encased in irregular minerals. If the cover slip was compressed the minerals could be broken apart and more planktonic cells could observed swimming in the surrounding milieu. Previous studies have shown that it may take up 4 weeks to enrich for Fe oxidizing phototrophs (2). Thus the fact that not all of the Fe(II) was oxidized in this experiment is not surprising and suggests that these cultures may continue to oxidize Fe and the biomass and cell numbers could still increase leading to successful enrichment for Fe oxidizing phototrophs.
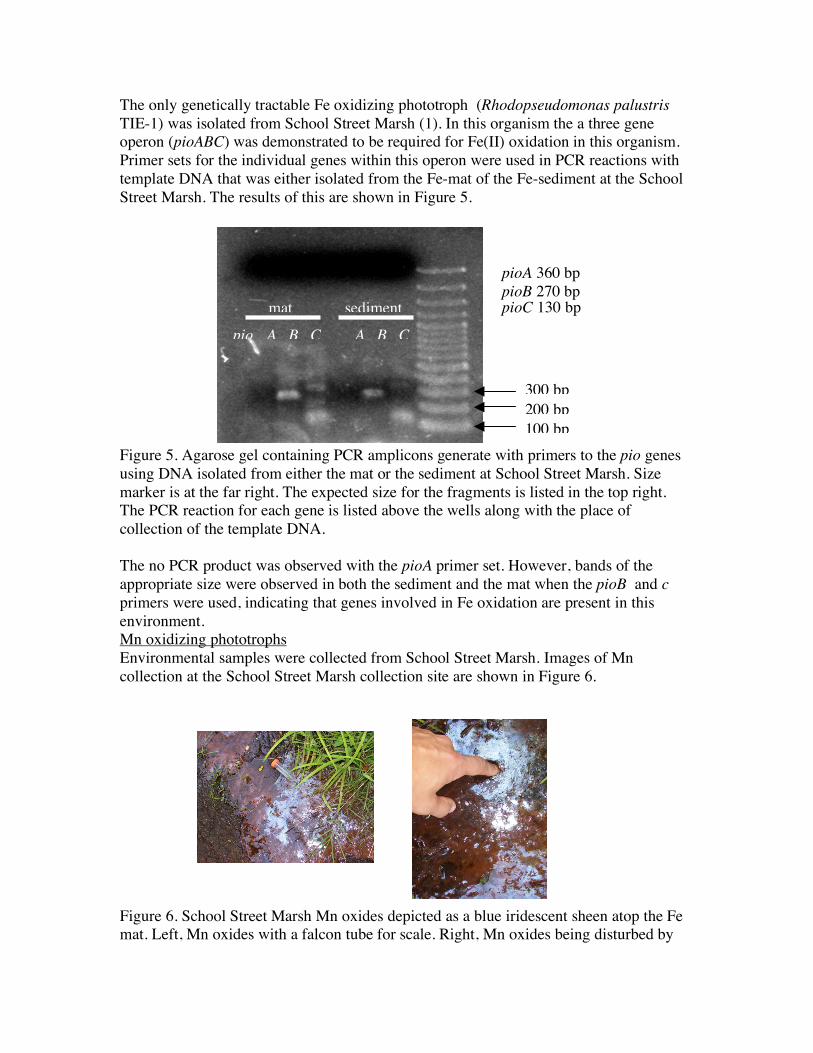
The only genetically tractable Fe oxidizing phototroph (Rhodopseudomonas palustris TIE-1) was isolated from School Street Marsh (1). In this organism the a three gene operon (pioABC) was demonstrated to be required for Fe(II) oxidation in this organism. Primer sets for the individual genes within this operon were used in PCR reactions with template DNA that was either isolated from the Fe-mat of the Fe-sediment at the School Street Marsh. The results of this are shown in Figure 5. Figure 5. Agarose gel containing PCR amplicons generate with primers to the pio genes using DNA isolated from either the mat or the sediment at School Street Marsh. Size marker is at the far right. The expected size for the fragments is listed in the top right. The PCR reaction for each gene is listed above the wells along with the place of collection of the template DNA. The no PCR product was observed with the pioA primer set. However, bands of the appropriate size were observed in both the sediment and the mat when the pioB and c primers were used, indicating that genes involved in Fe oxidation are present in this environment. Mn oxidizing phototrophs Environmental samples were collected from School Street Marsh. Images of Mn collection at the School Street Marsh collection site are shown in Figure 6. Figure 6. School Street Marsh Mn oxides depicted as a blue iridescent sheen atop the Fe mat. Left, Mn oxides with a falcon tube for scale. Right, Mn oxides being disturbed by
pio
mat sediment
A B C A B C
pioA 360 bp pioB 270 bp pioC 130 bp
300 bp 200 bp 100 bp
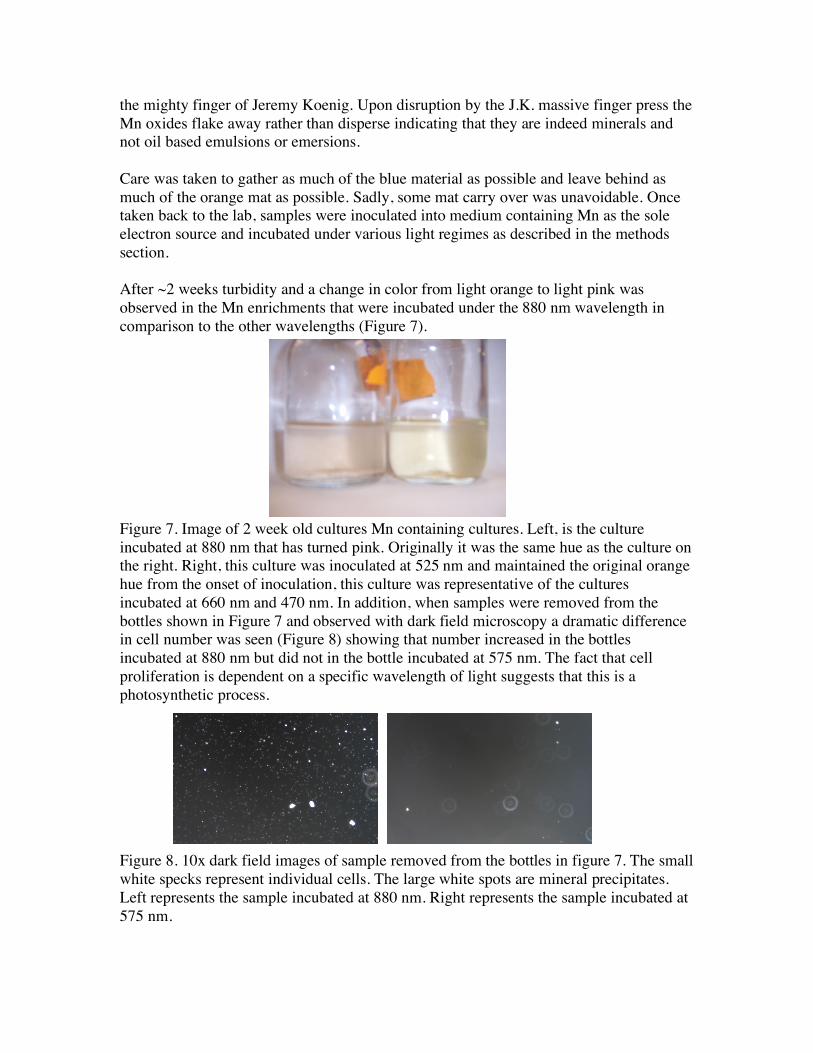
the mighty finger of Jeremy Koenig. Upon disruption by the J.K. massive finger press the Mn oxides flake away rather than disperse indicating that they are indeed minerals and not oil based emulsions or emersions. Care was taken to gather as much of the blue material as possible and leave behind as much of the orange mat as possible. Sadly, some mat carry over was unavoidable. Once taken back to the lab, samples were inoculated into medium containing Mn as the sole electron source and incubated under various light regimes as described in the methods section. After ~2 weeks turbidity and a change in color from light orange to light pink was observed in the Mn enrichments that were incubated under the 880 nm wavelength in comparison to the other wavelengths (Figure 7). Figure 7. Image of 2 week old cultures Mn containing cultures. Left, is the culture incubated at 880 nm that has turned pink. Originally it was the same hue as the culture on the right. Right, this culture was inoculated at 525 nm and maintained the original orange hue from the onset of inoculation, this culture was representative of the cultures incubated at 660 nm and 470 nm. In addition, when samples were removed from the bottles shown in Figure 7 and observed with dark field microscopy a dramatic difference in cell number was seen (Figure 8) showing that number increased in the bottles incubated at 880 nm but did not in the bottle incubated at 575 nm. The fact that cell proliferation is dependent on a specific wavelength of light suggests that this is a photosynthetic process. Figure 8. 10x dark field images of sample removed from the bottles in figure 7. The small white specks represent individual cells. The large white spots are mineral precipitates. Left represents the sample incubated at 880 nm. Right represents the sample incubated at 575 nm.

Higher magnification was used to examine the cell behavior and morphology of the cells grown at 880 nm (Figure 9). Under 40x, large macrocolonies were often observed containing curved rod shaped cells, minerals (possible rhodochrysite) and hollow tubular structures. The rod shaped bacteria tend to polarly attach to the mineral and the tubular structures. Under 60x, individual cells could be imaged and the curved rod shape could be easily seen, In addition, the poles of the cells were observed to be asymmetrical with one end slightly larger than the other and the larger end is also kinked. The kinked end was often observed to be involved in polar attachment. Figure 9. Microscopic images of Mn grown cells at 880 nm. Left image at 40x Right image at 60x. After 2 weeks the primary enrichment at 880 nm was ready to be transferred, after only 4 days under incandescent light growth was observed in the transfer (Figure 10). When examined using dark field microscopy numerous cells are observed in the field of view and seen light specks. There are more cells in the transfer culture than the primary culture at 575 nm (compare Figures 8 and 10). Using higher magnification the cells in the transfer also polarly attach to minerals and form microcolonies associated with minerals (Figure 10). Figure 10. Images of secondary Mn cultures grown under incandescent light. Left is 10x dark field, right is 40x phase contrast.
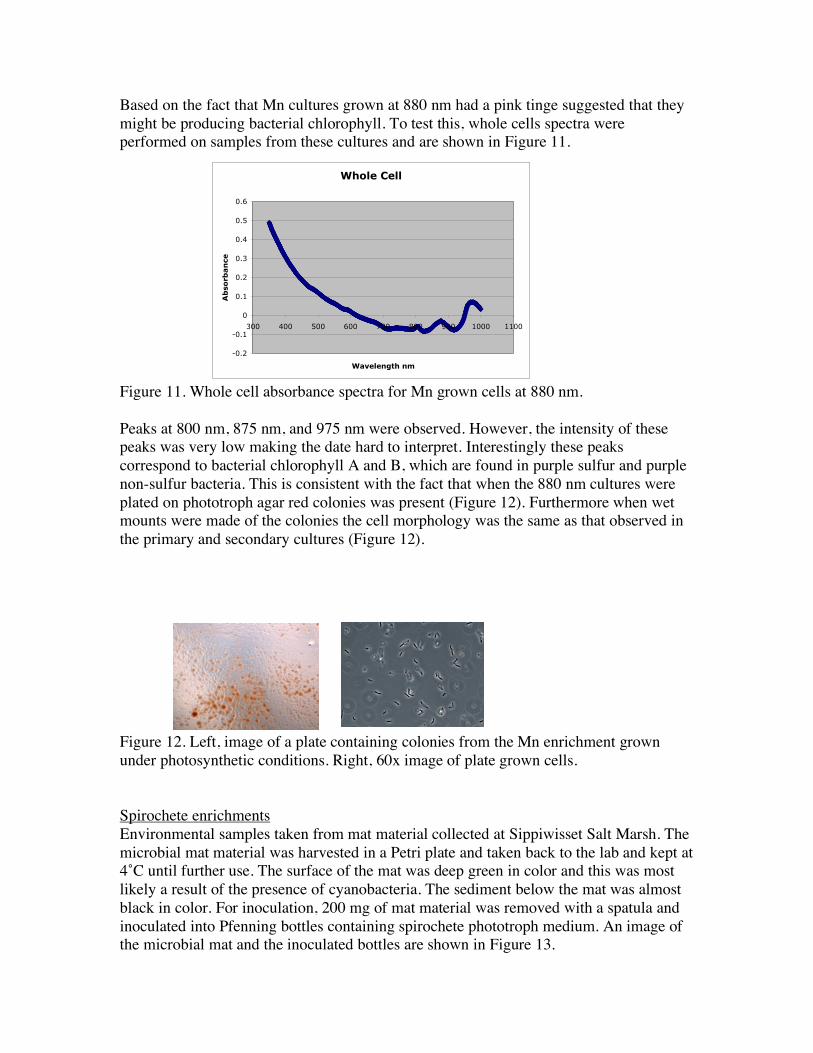
Based on the fact that Mn cultures grown at 880 nm had a pink tinge suggested that they might be producing bacterial chlorophyll. To test this, whole cells spectra were performed on samples from these cultures and are shown in Figure 11.
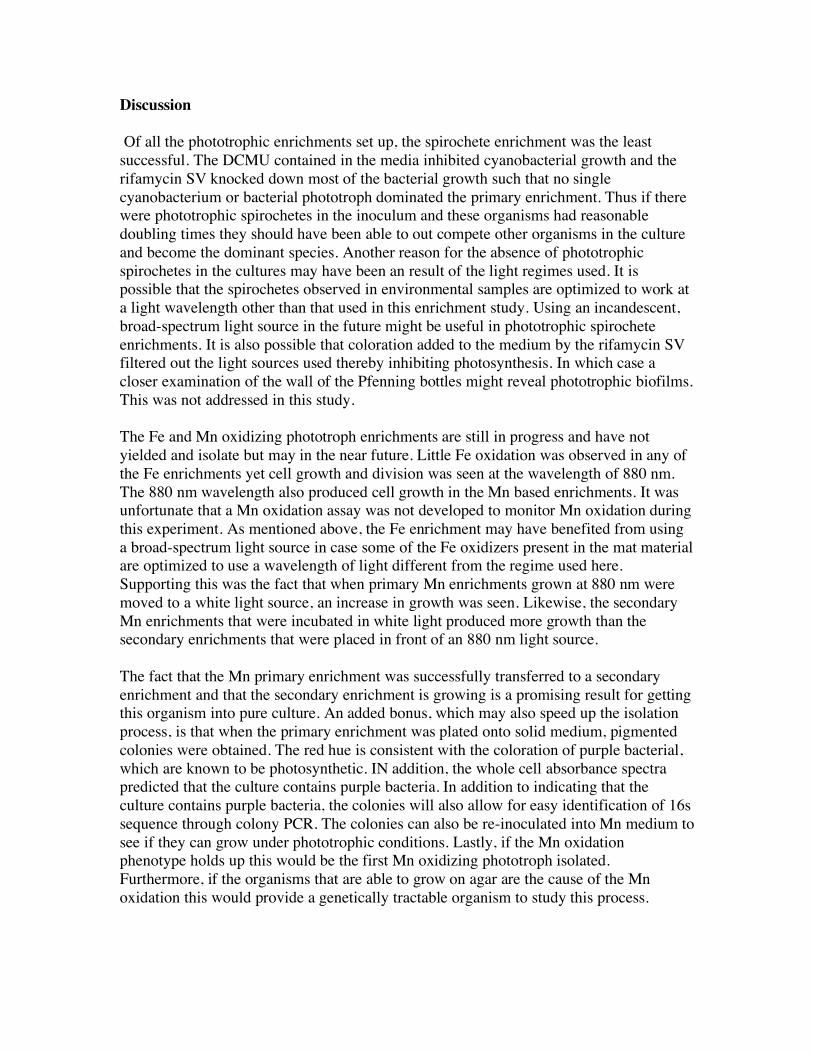
Figure 11. Whole cell absorbance spectra for Mn grown cells at 880 nm. Peaks at 800 nm, 875 nm, and 975 nm were observed. However, the intensity of these peaks was very low making the date hard to interpret. Interestingly these peaks correspond to bacterial chlorophyll A and B, which are found in purple sulfur and purple non-sulfur bacteria. This is consistent with the fact that when the 880 nm cultures were plated on phototroph agar red colonies was present (Figure 12). Furthermore when wet mounts were made of the colonies the cell morphology was the same as that observed in the primary and secondary cultures (Figure 12). Figure 12. Left, image of a plate containing colonies from the Mn enrichment grown under photosynthetic conditions. Right, 60x image of plate grown cells. Spirochete enrichments Environmental samples taken from mat material collected at Sippiwisset Salt Marsh. The microbial mat material was harvested in a Petri plate and taken back to the lab and kept at 4˚C until further use. The surface of the mat was deep green in color and this was most likely a result of the presence of cyanobacteria. The sediment below the mat was almost black in color. For inoculation, 200 mg of mat material was removed with a spatula and inoculated into Pfenning bottles containing spirochete phototroph medium. An image of the microbial mat and the inoculated bottles are shown in Figure 13.
Whole Cell
-0.2
-0.1
0
0.1
0.2
0.3
0.4
0.5
0.6
300 400 500 600 700 800 900 1000 1100
Wavelength nm
Ab
so
rb
an
ce

Figure 13. Left is an image of mat material taken from the mat at Sippiwisset Salt Marsh. Right, is the spirochete phototroph medium containing rifamycin SV. After 2.5 weeks of incubation there was little enrichment for spirochetes in any of the light regimes tested. However, it is worth noting that spirochetes could be detected in all cultures indicated that they were present in the original mat material (Figure 14). Figure 14. 60X microscopic images of spirochetes from cultures incubated at 880 nm (left) and 575 nm (right).
Discussion Of all the phototrophic enrichments set up, the spirochete enrichment was the least successful. The DCMU contained in the media inhibited cyanobacterial growth and the rifamycin SV knocked down most of the bacterial growth such that no single cyanobacterium or bacterial phototroph dominated the primary enrichment. Thus if there were phototrophic spirochetes in the inoculum and these organisms had reasonable doubling times they should have been able to out compete other organisms in the culture and become the dominant species. Another reason for the absence of phototrophic spirochetes in the cultures may have been an result of the light regimes used. It is possible that the spirochetes observed in environmental samples are optimized to work at a light wavelength other than that used in this enrichment study. Using an incandescent, broad-spectrum light source in the future might be useful in phototrophic spirochete enrichments. It is also possible that coloration added to the medium by the rifamycin SV filtered out the light sources used thereby inhibiting photosynthesis. In which case a closer examination of the wall of the Pfenning bottles might reveal phototrophic biofilms. This was not addressed in this study. The Fe and Mn oxidizing phototroph enrichments are still in progress and have not yielded and isolate but may in the near future. Little Fe oxidation was observed in any of the Fe enrichments yet cell growth and division was seen at the wavelength of 880 nm. The 880 nm wavelength also produced cell growth in the Mn based enrichments. It was unfortunate that a Mn oxidation assay was not developed to monitor Mn oxidation during this experiment. As mentioned above, the Fe enrichment may have benefited from using a broad-spectrum light source in case some of the Fe oxidizers present in the mat material are optimized to use a wavelength of light different from the regime used here. Supporting this was the fact that when primary Mn enrichments grown at 880 nm were moved to a white light source, an increase in growth was seen. Likewise, the secondary Mn enrichments that were incubated in white light produced more growth than the secondary enrichments that were placed in front of an 880 nm light source. The fact that the Mn primary enrichment was successfully transferred to a secondary enrichment and that the secondary enrichment is growing is a promising result for getting this organism into pure culture. An added bonus, which may also speed up the isolation process, is that when the primary enrichment was plated onto solid medium, pigmented colonies were obtained. The red hue is consistent with the coloration of purple bacterial, which are known to be photosynthetic. IN addition, the whole cell absorbance spectra predicted that the culture contains purple bacteria. In addition to indicating that the culture contains purple bacteria, the colonies will also allow for easy identification of 16s sequence through colony PCR. The colonies can also be re-inoculated into Mn medium to see if they can grow under phototrophic conditions. Lastly, if the Mn oxidation phenotype holds up this would be the first Mn oxidizing phototroph isolated. Furthermore, if the organisms that are able to grow on agar are the cause of the Mn oxidation this would provide a genetically tractable organism to study this process.

References
1. Jiao, Y., Kappler, A., Croal, L. R. & Newman, D. K. (2005) Appl Environ Microbiol 71, 4487-4496.
2. Widdel, F., Schnell, S., Heising, S., Ehrenreich, A., Assmus, B. & Schink, B. (1993) Nature 362, 834-836.