nigeria markets & bridge to markets ii elizabeth ellis director, usaid/nigeria markets ii...
TRANSCRIPT


NigeriaMARKETS &
Bridge to MARKETS II
Elizabeth EllisDirector, USAID/Nigeria MARKETS II

Today’s discussion
• Livelihood and Nutrition pilot
• Improved rural incomes and livelihoods (core)

Livelihood and Nutrition Pilot

Reaching Communities in Northern Nigeria
• Work through village elders
• Community assessment
• Target the most vulnerable
• Segregated training where needed

Livelihood and Nutrition Components
• Enterprise Skills
• Household Asset Management
• Nutrition Best Practices
• Homestead Gardening

Savings for Health Videohttp://vimeo.com/32976940

Note: n = 1000 for baseline and 353 for impact assessment
Percentage of participants responding yes; eating nutritious meals has a positive effect
on:
Percentage of participants responding yes to when they wash
hands with soap:
Percentage of participants responding yes to factors that indicate their child is growing
properly:
Shift in the number one factor when deciding which foods to prepare for the householdExclusive Breastfeeding
•Before 20% of mothers exclusively breastfed through six months before the training.
•After 75% reported that they would exclusively breastfeed for 6 months after the training.
Exclusive Breastfeeding•Before 20% of mothers exclusively breastfed through six months before the training.
•After 75% reported that they would exclusively breastfeed for 6 months after the training.
Knowledge & Practice:Improved nutrition related behaviors; Improved utilization of
maternal and child health & nutrition services
Improved Nutrition:Knowledge and Practice
Improved Nutrition:Knowledge and Practice

Increased Income of Vulnerable Communities:
Increased resilience of vulnerable communities & households
USD $50 annual per capita investment in healthcare
in Nigeria
60% of participants reported saving for the first time at an
average of $3.75 per week, estimated $194 per year
Estimated Yearly Total Savings of New Savers: USD $470,000
USD $50 annual per capita investment in healthcare
in Nigeria
60% of participants reported saving for the first time at an
average of $3.75 per week, estimated $194 per year
Estimated Yearly Total Savings of New Savers: USD $470,000
Increased Income After the Training:
“The money will not vanish because I now know how to save and allocate my money properly” -Livelihood and Household Nutrition Pilot Activity participant, Kano State
Increased Income and Resilience of Vulnerable Communities

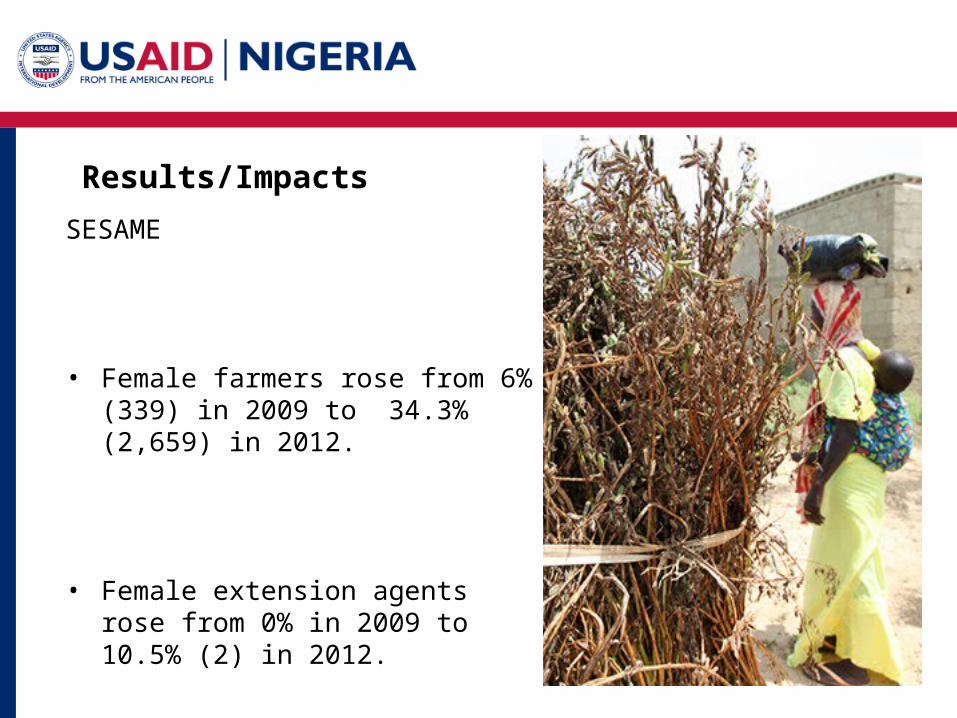
Results/Impacts

MARKETS Private Sector, Facilitative Approach
• Increased access to seeds, fertilizer, and credit
• Increased access to extension services
• Increased yields per ha for male and female farmers
• Increased gross revenue for all farmers
• Increased net income for all farmers
• Premium prices received by farmers for quality
• Increased local capacity

Challenge: Low Female Farmer & Extension Agent Participation Rates in Northern Nigeria
• Low participation rates for female farmers
• Low numbers of female extension agents
• Extension efforts for female farmers not the same as
for male farmers

Gender Strategy
• Performance-based subcontracts
• Requirements in MoUs with state governments
• Training on inclusive programming for women and youth
• Break down performance stereotypes with evidence
• Promote women’s leadership and empowerment
Results/Impacts
SESAME
• Female farmers rose from 6% (339) in 2009 to 34.3% (2,659) in 2012.
• Female extension agents rose from 0% in 2009 to 10.5% (2) in 2012.

Results/Impacts - SESAME
Baseline Yield.4 t/ha
% Yield Increase
Gross Revenue
per ha
Net Income per ha
Average Farm Size
SESAMEMale2011
235%(1.34 t)
$1417 $1157 1.33
SESAMEFemale2011
250%(1.4 t)
$1464 $1200 1.15

Results/Impacts
SORGHUM
• Participation of female farmers rose from 0% in 2009 to 33.1% (5,006) in 2012.
• Female extension agents rose from 0% in 2009 to 33.3% (10) in 2012

Results/Impacts - SORGHUM
Baseline Yield1.0 t/ha
% Yield Increase
Gross Revenue
per ha
Net Income per ha
Average Farm Size
SORGHUMMale2010
118%(2.18 t)
$597 $316 1.04
SORGHUMFemale2010
117%(2.17 t)
$591 $305 0.79

Results/Impacts
RICE – NORTHERN NIGERIA
• Female farmers rose from 0.4% (6) in 2010 to 40.2% (4,026) in 2012.
• Female extension agents rose from 0% in 2009 to 18.2% (4) in 2012

Results/Impacts - RICE
Baseline Yield1.5 t/ha
% Yield Increase
Gross Revenue
per ha
Net Income per ha
Average Farm Size
RICEMale2010
266%(5.55 t)
$2257 $1621 2.13
RICEFemale2010
275%(5.63 t)
$3097 $2150 2.25

Results/Impacts
MAIZE
• Participation of female farmers rose from 20.1% (602) in 2010 to 41.0% (4,920) in 2012.
• Female extension agents rose from 0% in 2009 to 50% (12) in 2012

Results/Impacts - MAIZE
Baseline Yield1.2 t/ha
% Yield Increase
Gross Revenue
per ha
Net Income per ha
Average Farm Size
MAIZEMale2010
266%(4.85 t)
$1406 $816 1.38
MAIZEFemale2010
275%(4.86 t)
$1448 $845 1.12


To learn more about MARKETS
• www.nigeriamarkets.org
Video - Savings for Health (Full version)
• http://vimeo.com/32976940
Video – MARKETS Overview
• http://www.youtube.com/watch?v=qSlsSU4PayI&feature=plcp
Video – A Bigger Haul (Aquaculture value chain)
• http://www.youtube.com/watch?v=vu-j3aoAGco&feature=context-chv