nih public access in polycystic ovary syndrome am j obstet
TRANSCRIPT

Evidence of mononuclear cell preactivation in the fasting state in polycystic ovary syndrome
Frank GONZÁLEZ, MD,Dept. of Obstetrics and Gynecology, Indiana University School of Medicine, Indianapolis, IN 46202
John P. KIRWAN, PhD,Dept. of PathoBiology, Lerner Research Institute, Cleveland Clinic, Cleveland, OH 44195
Neal S. ROTE, PhD, andDept. of Reproductive Biology, Case Western Reserve University School of Medicine, Cleveland, OH 44109
Judi MINIUM, BSDept. of Reproductive Biology, Case Western Reserve University School of Medicine, Cleveland, OH 44109
Abstract
OBJECTIVE—We evaluated mononuclear cell (MNC) preactivation in women with Polycystic
Ovary Syndrome (PCOS) by examining the effect of in vitro lipopolysaccharide (LPS) exposure
on cytokine release in the fasting state.
STUDY DESIGN—Twenty women with PCOS (10 lean, 10 obese) and 20 weight-matched
controls (10 lean, 10 obese) volunteered for study participation. Tumor necrosis factor-α (TNF α)
and interleukin-6 (IL-6) release was measured from mononuclear cell isolated from fasting blood
samples and cultured in the presence and absence of lipopolysaccharide. Plasma IL-6 was
measured from the same fasting blood samples. Insulin sensitivity was derived from an oral
glucose tolerance test using the Matsuda index and truncal fat was measured by dual energy x-ray
absorptiometry.
RESULTS—The percent change from baseline in TNFα and IL-6 release from mononuclear cell
following lipopolysaccharide exposure was increased (pitalic>0.04) in lean and obese women with
© 2014 Mosby, Inc. All rights reserved.
CORRESPONDING AUTHOR: Frank González, Indiana University School of Medicine, Department of Obstetrics and Gynecology, AOC Room 6046, 550 N. University Boulevard, Indianapolis, IN 46202, [email protected], TELEPHONE #: (317) 944-4058, FAX #: (317) 944-7417.LOCATIONS OF STUDY CONDUCT: Cleveland Ohio and Indianapolis, Indiana
DISCLOSURE STATEMENT: The authors report no conflict of interest.
PAPER PRESENTATION: This work was presented at the 7th Annual Meeting of Androgen Excess and PCOS Society, Washington, D.C., June 9, 2009.
Publisher's Disclaimer: This is a PDF file of an unedited manuscript that has been accepted for publication. As a service to our customers we are providing this early version of the manuscript. The manuscript will undergo copyediting, typesetting, and review of the resulting proof before it is published in its final citable form. Please note that during the production process errors may be discovered which could affect the content, and all legal disclaimers that apply to the journal pertain.
NIH Public AccessAuthor ManuscriptAm J Obstet Gynecol. Author manuscript; available in PMC 2015 December 01.
Published in final edited form as:Am J Obstet Gynecol. 2014 December ; 211(6): 635.e1–635.e7. doi:10.1016/j.ajog.2014.06.044.
NIH
-PA
Author M
anuscriptN
IH-P
A A
uthor Manuscript
NIH
-PA
Author M
anuscript

PCOS and obese controls compared with lean controls. Plasma IL-6 was increased (pbold>0.02) in
obese women with PCOS compared with lean women with PCOS, which in turn was increased
(p<0.02) compared with lean controls. The mononuclear cell -derived TNFα and IL-6 responses
from mononuclear cell were negatively correlated with insulin sensitivity (p<0.03) and positively
correlated with testosterone (p<0.03) and androstenedione (p<0.006) for the combined groups.
Plasma IL-6 was positively correlated with percent truncal fat (p<0.008).
CONCLUSIONS—In PCOS, increased cytokine release from mononuclear cell following
lipopolysaccharide exposure in the fasting state reveals the presence of mononuclear cell
preactivation. Importantly, this phenomenon is independent of obesity and may contribute to the
development of insulin resistance and hyperandrogenism in PCOS. In contrast, the source of
plasma IL-6 elevations in PCOS may be excess adiposity.
Keywords
inflammation; lipopolysaccharide; mononuclear cell preactivation
Introduction
The Polycystic Ovary Syndrome (PCOS) affects as many as 15% of reproductive-age
women and is characterized by hyperandrogenism, chronic oligo- or anovulation and
polycystic ovaries.1,2 Obesity and insulin resistance are often present in PCOS and the
compensatory hyperinsulinemia is thought to promote the hyperandrogenism.3,4 Many
young women with PCOS also possess risk factors for cardiovascular disease such as
metabolic syndrome, type 2 diabetes, dyslipidemia and hypertension which are associated
with atherosclerosis.5,6 In PCOS, oxidative stress and chronic low-grade inflammation have
been implicated in the development of insulin resistance and accelerated atherogenesis.7–9
Women with PCOS exhibit increased circulating levels of protein carbonyls, tumor necrosis
factor-α (TNF α) and interleukin-6 (IL-6), decreased insulin signaling and a higher
prevalence of coronary artery calcification.10–14
Our previous studies have highlighted the ability of nutrient ingestion to trigger a prooxidant
proinflammatory response from peripheral blood mononuclear cells (MNC) that is
independent of obesity.8,15–19 Indeed, MNC of lean women with PCOS exhibit increases in
reactive oxygen species (ROS) generation and nuclear factor κB (NFκB) activation
following ingestion of glucose and lipid.17,20 NFκB regulates the transcription of a variety
of inflammatory mediators including that of TNFα and IL-6. These cytokines exert positive
feedback to up-regulate the preceding molecular events that mediate insulin resistance and
atherogenesis.21,22 Thus, MNC of women with PCOS have an increased sensitivity to
nutrient ingestion.
MNC preactivation in the fasting state may account for increased MNC sensitivity in PCOS.
In this instance, the NFκB inflammation pathway that culminates in cytokine release from
MNC may already be upregulated prior to nutrient ingestion similar to what has been
reported in obesity.23 As such, we evaluated MNC obtained in the fasting state for the
amount of TNFα and IL-6 release following in vitro exposure to lipopolysaccharide (LPS)
and also evaluated the status of fasting plasma IL-6 in women with PCOS. We anticipated
GONZÁLEZ et al. Page 2
Am J Obstet Gynecol. Author manuscript; available in PMC 2015 December 01.
NIH
-PA
Author M
anuscriptN
IH-P
A A
uthor Manuscript
NIH
-PA
Author M
anuscript

that plasma IL-6 would be elevated in these women based on previous studies.14 However,
we hypothesized that MNC-derived cytokine release is increased in response to in vitro LPS
exposure in women with PCOS compared with weight-matched controls; and that this
cytokine response to LPS along with plasma IL-6 levels are related to abdominal adiposity,
insulin sensitivity and circulating androgens.
Materials and Methods
Subjects
Twenty women with PCOS (10 lean and 10 obese) 20–34 years of age and 20 weight-
matched control subjects (10 lean and 10 obese) 20–39 years of age volunteered for study
participation. Some subjects in the current study were involved in our previous work on
PCOS and insulin resistance.16 Additional subjects were recruited via newspaper
advertisements and flyers within the Indiana University community between the years 2011
and 2013. Obesity was defined as a body mass index (BMI) between 30 and 40 kg/m2. Lean
subjects had a BMI between 18 and 25 kg/m2. The women with PCOS were diagnosed on
the basis of oligo-amenorrhea and hyperandrogenemia after excluding nonclassic congenital
adrenal hyperplasia, Cushing’s Syndrome, hyperprolactinemia and thyroid disease.
Polycystic ovaries were present on ultrasound in all subjects with PCOS. All control
subjects had regular menses lasting 25 to 35 days and a luteal range serum progesterone
level consistent with ovulation (>5 ng/ml). All control subjects exhibited normal circulating
androgen levels and did not have any skin manifestations of androgen excess or polycystic
ovaries on ultrasound.
Diabetes and inflammatory illnesses were excluded in all subjects. None of them suffered
from depression, smoked tobacco, ingested more than two alcoholic beverages per month or
used medications that could impact carbohydrate metabolism or immune function for a
minimum of 6 weeks before beginning the study. All subjects were sedentary defined as
exercise less than once a month during the 6 months before study participation. Written
informed consent was obtained from all subjects according to Institutional Review Board
guidelines.
Study Design
All study subjects were provided with a healthy diet consisting of 50% carbohydrate, 35%
fat and 15% protein for 3 consecutive days before testing between days 5 and 8 after the
onset of menstruation. All but one of the subjects was compliant with the diet based on
completion of a checklist of consumed food and inspection of returned empty food
containers. The less compliant individual was a lean control who consumed 85% of the food
provided. Testing began with an assessment of body composition. After an overnight fast of
~12 hours, a blood sample was obtained for MNC isolation and culture, and to isolate
plasma that was stored at −80° C until assayed for IL-6. All study subjects then underwent
an oral glucose tolerance test (OGTT) to assess insulin sensitivity.
GONZÁLEZ et al. Page 3
Am J Obstet Gynecol. Author manuscript; available in PMC 2015 December 01.
NIH
-PA
Author M
anuscriptN
IH-P
A A
uthor Manuscript
NIH
-PA
Author M
anuscript
Body Composition Assessment
Height without shoes was measured to the nearest 1.0 cm. Body weight was measured to the
nearest 0.1 kg. Waist circumference was measured at the level of the umbilicus and used to
estimate abdominal adiposity. In addition, all subjects underwent dual energy x-ray
absorptiometry to determine percent total body fat and percent truncal fat using the QDR
4500 Elite model scanner (Hologic Inc., Waltham, MA) as previously described.15,24
MNC Culture
MNC were isolated by density gradient centrifugation in Histopaque-1077 (Sigma-Aldrich
Co., St. Louis, MO). The cells were washed twice in pyrogen-free saline, resuspended in
RPMI (0.3mg/ml L-glutamine, 100 U/ml penicillin, 100 ug/ml streptomycin) with TCH™
Serum Replacement (MD Biomedicals, Inc., Irvine, CA) and seeded in coated culture plates
(VWR International, West Chester, PA) at a concentration of 2.5×10⁶ cells/ml. The cells
were then incubated (95% humidity, 5% CO2, 37° C) for 24 hours in the presence (exposed)
and absence (unexposed) of 1 ng/ml of LPS endotoxin from Escherichia coli 0127:B8
(Sigma-Aldrich Co. LLC, St. Louis, MO). Culture supernatants were collected and stored at
−80° C until assayed for TNFα and IL-6.
Oral Glucose Tolerance Test
Blood samples were drawn at 0, 30, 60, 90, 120 and 180 minutes after ingestion of a 75 gm
glucose beverage to measure glucose and insulin. Plasma glucose concentrations were
assayed immediately, and insulin measurements were performed later from plasma stored at
−80° C. Insulin sensitivity was derived using the Matsuda index formula (ISOGTT): 10,000
divided by the square root of (fasting glucose x fasting insulin) x (mean glucose x mean
insulin).25 This particular formula is highly correlated with insulin sensitivity measurements
using the gold standard hyperinsulinemic-euglycemic clamp procedure.25–27
Serum, Plasma and Culture Supernatant Measurements
Serum luteinizing hormone (LH), testosterone, androstenedione and
dehydroepiandrosterone-sulfate (DHEA-S) levels were measured by RIA (Siemens Medical
Solutions Diagnostics, Los Angeles, CA). Plasma glucose was measured by the glucose
oxidase method (YSI 2300 STAT Plus, Yellow Springs, OH), while plasma insulin was
measured by a double antibody RIA (Millipore, St. Charles, MO). Plasma IL-6
concentrations along with those of TNFα and IL-6 in MNC culture supernatants were
measured by ELISA (eBioscience, San Diego, CA). The interassay and intraassay
coefficients of variation for all assays did not exceed 7.4% and 12%, respectively.
Statistics
Data were analyzed using StatView (SAS Institute, Cary, NC). All values were initially
examined graphically for departure from normality, and the natural logarithm transformation
was applied as needed. Descriptive data and change from baseline of variables were
compared between groups using ANOVA for multiple group comparisons. The source of
significance by ANOVA was identified by Tukey’s post hoc test. Furthermore, ANCOVA
was performed to confirm significance of inflammation variables using significantly altered
GONZÁLEZ et al. Page 4
Am J Obstet Gynecol. Author manuscript; available in PMC 2015 December 01.
NIH
-PA
Author M
anuscriptN
IH-P
A A
uthor Manuscript
NIH
-PA
Author M
anuscript

metabolic parameters as covariates that might influence inflammation when comparing lean
PCOS vs. lean controls or obese PCOS vs. obese controls. The treatment effect was
determined by calculating the percent change in LPS-exposed cytokine release from the
unexposed baseline for each subject in view of intersubject variability. Pearson linear
regression was employed for correlation analyses using the method of least squares. Data are
presented as mean ± SE, and results with a two-tailed α-level of 0.05 were considered
significant.
Results
Age, Body Composition, Blood Pressure and Lipids
All four groups were similar in age and height (Table 1). Obese subjects had significantly
(p<0.05) higher weight, body mass index (BMI), percent total body fat, percent truncal fat
and waist circumference compared with lean subjects whether or not they had PCOS.
However, these measures of body composition were similar when women with PCOS were
compared with weight-matched controls.
Systolic blood pressure was similar among groups. Diastolic blood pressure was
significantly (p<0.05) higher in obese controls compared with lean women with PCOS and
lean controls, but mean values were in the normotensive range. The levels of total
cholesterol, triglyceride and high and low density lipoprotein cholesterol were similar
among groups.
Plasma Hormone Levels, Glycemic Status and Insulin Sensitivity
Women with PCOS exhibited significantly (p<0.05) higher serum levels of LH, testosterone,
androstenedione and DHEA-S compared with control subjects regardless of weight class
(Table 1). Women with PCOS who were lean had significantly (p<0.05) higher serum LH
levels compared with those who were obese.
Women with PCOS and controls exhibited similar glucose levels while fasting and 2 hours
post glucose ingestion regardless of weight status. All subjects had a normal glucose
response during the OGTT, with fasting glucose levels <100 mg/dl and 2-hour glucose
levels ranging between 75 and 137 mg/dl. Fasting insulin levels were significantly higher
(p<0.05) in obese women with PCOS compared with lean women with PCOS and both
control groups and in obese controls compared with lean controls. The ISOGTT was
significantly higher (p<0.05) in obese subjects regardless of PCOS status compared with
lean controls and in lean women with PCOS compared with lean controls.
MNC-Derived TNFα and IL-6 Release and Plasma IL-6
Baseline TNFα and IL-6 release from MNC in the fasting state was similar in all four
groups (data not shown). The change from baseline in TNFα and IL-6 release from MNC
following LPS exposure was significantly (p<0.04) greater in in both PCOS groups and
obese controls compared with lean controls (Figure 1A–B).
Fasting plasma IL-6 was significantly (p<0.02) higher in obese subjects whether or not they
had PCOS and lean women with PCOS compared with lean controls (Figure 2). Obese
GONZÁLEZ et al. Page 5
Am J Obstet Gynecol. Author manuscript; available in PMC 2015 December 01.
NIH
-PA
Author M
anuscriptN
IH-P
A A
uthor Manuscript
NIH
-PA
Author M
anuscript
women with PCOS also exhibited significantly (p<0.02) higher fasting plasma IL-6 levels
compared with lean women with PCOS.
The MNC-derived TNFα and IL-6 responses and fasting plasma IL-6 remained significantly
increased in lean women with PCOS when comparing the lean groups after controlling for
insulin sensitivity (ISOGTT), and remained similar when comparing the obese groups after
controlling for fasting insulin.
Correlations
Waist circumference was positively correlated with BMI (r= 0.76, p<0.0001), percent body
fat (r= 0.61, p<0.0001) and percent truncal fat (r= 0.68, p<0.0001) and ISOGTT was
negatively correlated with BMI (r= −0.49, p<0.002), waist circumference (r= −0.45,
p<0.005) and percent truncal fat (r= −0.42, p<0.008) for the combined groups.
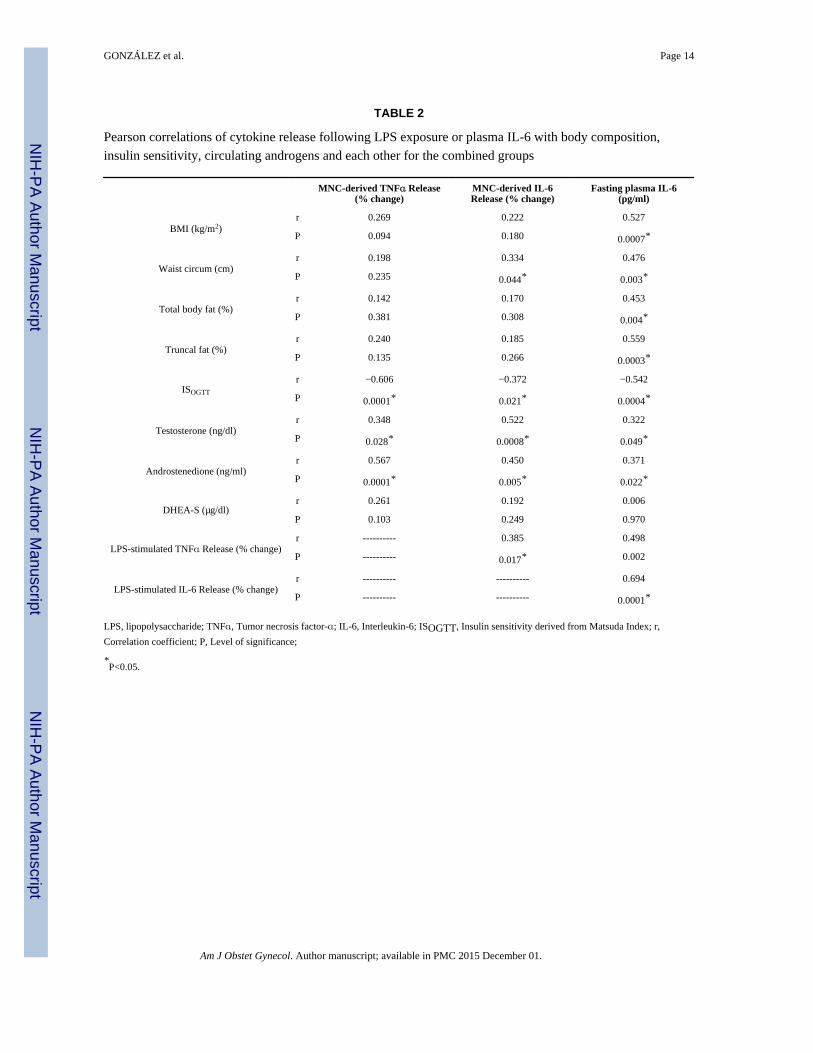
The change from baseline in IL-6 release from MNC following LPS exposure was positively
correlated with that of TNFα and plasma IL-6 for the combined groups (Table 2). Fasting
plasma IL-6 was positively correlated with BMI, waist circumference, percent body fat and
percent truncal fat. The MNC-derived TNFα and IL-6 responses and plasma IL-6 were
negatively correlated with ISOGTT and were positively correlated with serum levels of
testosterone and androstenedione. There was also a positive correlation between MNC-
derived TNFα response and serum LH (r= 0.50, p<0.002).
In women with PCOS, fasting plasma IL-6 was positively correlated with the MNC-derived
IL-6 response (r= 0.63, p<0.005), percent body fat (r= 0.53, p<0.002), percent truncal fat (r=
0.60, p<0.008) and serum levels of testosterone (r= 0.46, p<0.05) and DHEA-S (r= 0.49,
p<0.04). There was also a positive correlation between the MNC-derived IL-6 response and
serum testosterone (r= 0.56, p<0.02).
Comment
Our data provide the first clear evidence that in PCOS, MNC are preactivated in the fasting
state and that this phenomenon is independent of obesity. Moreover, a proinflammatory
stimulus in the form of LPS increases MNC-derived cytokine release in the fasting state in
lean women with PCOS compared with lean controls. There are also independent
associations of cytokine release from MNC following LPS exposure with insulin sensitivity,
LH, and androgens. Furthermore circulating IL-6 levels are directly associated with
measures of adiposity. Thus, MNC preactivation may contribute to the development of
insulin resistance and hyperandrogenism while excess abdominal adiposity may be a source
of plasma IL-6 elevations in PCOS.
The MNC of lean healthy reproductive-age women do not appear to be preactivated. There
is minimal increase in TNFα and IL-6 release from resting MNC following in vitro LPS
exposure in lean controls. This is consistent with our previous reports of the MNC-derived
responses of these cytokines in the fasting state following in vitro glucose exposure in lean
healthy young women.16,28 These observations are important because the collective effects
of TNFα and IL-6 are responsible for mediating insulin resistance and atherogenesis.21,22
GONZÁLEZ et al. Page 6
Am J Obstet Gynecol. Author manuscript; available in PMC 2015 December 01.
NIH
-PA
Author M
anuscriptN
IH-P
A A
uthor Manuscript
NIH
-PA
Author M
anuscript

Thus, the limited MNC-derived response to proinflammatory stimuli in lean young women
may serve to maintain insulin sensitivity and curtail atherogenesis to optimize glucose
disposal and preserve blood vessel integrity.
In contrast, resting MNC of women with PCOS are in a proinflammatory state. TNFα and
IL-6 release from MNC is increased in response to in vitro LPS exposure in lean women
with PCOS compared with lean controls. Obese individuals regardless of PCOS status also
exhibit increases in these parameters compared with lean controls. These results mimic our
previous findings for these cytokines in response to in vitro glucose exposure particularly in
obese women with PCOS.16,28 These proinflammatory responses provide evidence of MNC
preactivation as the underpinning for the increased MNC sensitivity to nutrient ingestion
observed in vivo in women with PCOS.8,9,17,29 The inverse relationship between LPS-
stimulated cytokine release and insulin sensitivity supports the concept that MNC
preactivation may ultimately play a part in the mechanism of insulin resistance. In the case
of obese individuals regardless of PCOS status, the impetus for MNC preactivation may be
cytokines such as TNFα and IL-6 that are secreted into the circulation from the expanded
adipose tissue compartment as a result of inflammation induced by hypoxia-related cell
death.23,30 In fact, there is a positive association between fasting plasma IL-6 and the MNC-
derived IL-6 response. Almost one-third of lean women with PCOS exhibit excess
abdominal adiposity and this may contribute to MNC preactivation.31 However, excess
adiposity does not completely account for our findings in this group based on our recent
report of increased MNC sensitivity to glucose ingestion in lean women with PCOS who
lack excess abdominal adiposity.27,32 Furthermore, we have recently shown that induction
of hyperandrogenemia in lean healthy reproductive-age women without PCOS who lack
inflammation can activate and sensitize MNC to glucose, but that suppression of
hyperandrogenemia in lean women with PCOS does not reduce the inflammatory load.33,34
Thus, it is possible that hyperandrogenism is the progenitor of nutrient-induced
inflammation in PCOS, but is not required for maintenance of this phenomenon in the
chronic state.
Our data suggest that in PCOS, the chronic presence of excess adiposity may be a primary
source of elevated cytokines such as IL-6 in the circulation. Fasting plasma IL-6 levels are
highest in obese women with PCOS compared with lean women with PCOS who in turn
have IL-6 levels that are higher compared with lean controls. This pattern mimics the one
observed for insulin sensitivity in our study subjects. Furthermore, measures of adiposity,
including abdominal fat are positively associated with fasting plasma IL-6 levels. Roughly
half of the IL-6 in the expanded adipose mass of obese individuals is produced by MNC-
derived macrophages and serves as a paracrine stimulator of adipocyte IL-6 production.35
Insulin sensitivity is also inversely related to fasting plasma IL-6 and abdominal adiposity.
Thus, circulating MNC and excess adipose tissue may be joint contributors to systemic
inflammation and insulin resistance in PCOS.
In PCOS, MNC preactivation may ultimately result in hyperandrogenism. Circulating LH,
testosterone, androstenedione and DHEA-S are all directly related to MNC-derived cytokine
release and/or fasting plasma IL-6 levels. This is supported by our findings in previous
studies.8,9,16,17,29,32 While the relationship with LH raises the possibility that inflammation
GONZÁLEZ et al. Page 7
Am J Obstet Gynecol. Author manuscript; available in PMC 2015 December 01.
NIH
-PA
Author M
anuscriptN
IH-P
A A
uthor Manuscript
NIH
-PA
Author M
anuscript

contributes to pituitary LH hypersecretion in PCOS to enhance androgen production, impact
at the local level is well characterized. MNC-derived macrophages are present in the
ovary.36 Exposure of cultured theca cells to prooxidants increases the mRNA content of
CYP17, the androgen producing steroidogenic enzyme, whereas exposure to anti-oxidants
such as resveratrol and statins decreases CYP17 mRNA content.37,38 Statins are also
capable of inhibiting proliferation of theca cells from rat and human polycystic ovaries in
vitro.39,40 Thus, excess ovarian androgen production in PCOS may be the consequence of an
oxidative stress-induced local inflammatory response from preactivated MNC that migrate
into the polycystic ovary. Interestingly, PCOS theca cells in long-term culture produce
excess androgens in the absence of macrophages.41 Although this latter finding may
represent a fostering effect of chronic in vitro conditions, it raises the possibility that a
proinflammatory milieu within the polycystic ovary confers a permanent independent
propensity for PCOS theca cell hyperandrogenism.
In conclusion, cytokine release from MNC following LPS exposure in the fasting state is
increased in women with PCOS. This phenomenon is consistent with preactivation of
circulating MNC and is independent of obesity. MNC preactivation in PCOS may be the
cause of increased MNC sensitivity to proinflammatory nutrients that may ultimately
contribute to insulin resistance and hyperandrogenism. Furthermore, excess abdominal
adiposity may be the source of plasma IL-6 elevations in this disorder.
Acknowledgments
FUNDING: This research was supported by grant HD-048535 to F.G. from the National Institutes of Health.
References
1. Fauser BC, Tarlatzis BC, Rebar RW, et al. Consensus on women’s health aspects of polycystic ovary syndrome (PCOS): the Amsterdam ESHRE/ASRM-Sponsored 3rd PCOS Consensus Workshop Group. Fertil Steril. 2012; 97:28–38.e25. [PubMed: 22153789]
2. The Rotterdam ESHRE/ASRM-Sponsored PCOS Conference Workshop Group. Revised 2003 consensus on diagnostic criteria and long-term health risks related to polycystic ovary syndrome. Fertil Steril. 2004; 81:19–25.
3. Burghen GA, Givens JR, Kitabachi AE. Correlation of hyperandrogenism with hyperinsulinemia in polycystic ovarian disease. J Clin Endocrinol Metab. 1980; 50:113–6. [PubMed: 7350174]
4. Dunaif A, Segal KR, Futterweit W, Dobrjansky A. Profound insulin resistance, independent of obesity in polycystic ovary syndrome. Diabetes. 1989; 38:1165–74. [PubMed: 2670645]
5. Wild RA, Carmina E, Diamanti-Kandarakis E, et al. Assessment of cardiovascular risk and prevention of cardiovascular disease in women with the polycystic ovary syndrome: a consensus statement by the Androgen Excess and Polycystic Ovary Syndrome (AE-PCOS) Society. J Clin Endocrinol Metab. 2010; 95:2038–49. [PubMed: 20375205]
6. Freeman MS, Mansfield MW, Barrett JH, Grant PJ. Insulin resistance: an atherothrombotic syndrome. Thromb Haemost. 2003; 89:161–8. [PubMed: 12540966]
7. Kelly CC, Lyall H, Petrie JR, Gould GW, Connell JMC, Sattar N. Low grade chronic inflammation in women in women with polycystic ovary syndrome. J Clin Endocrinol Metab. 2001; 86:2453–5. [PubMed: 11397838]
8. González F, Rote NS, Minium J, Kirwan JP. Increased activation of nuclear factor κB triggers inflammation and insulin resistance in polycystic ovary syndrome. J Clin Endocrinol Metab. 2006; 91:150–12.
GONZÁLEZ et al. Page 8
Am J Obstet Gynecol. Author manuscript; available in PMC 2015 December 01.
NIH
-PA
Author M
anuscriptN
IH-P
A A
uthor Manuscript
NIH
-PA
Author M
anuscript

9. González F, Rote NS, Minium J, Kirwan JP. Glucose ingestion stimulates atherothrombotic inflammation in polycystic ovary syndrome. Am J Physiol Endocrinol Metab. 2013; 304:E375–83. [PubMed: 23249695]
10. González F, Thusu K, Abdel-Rahman E, Prabhala A, Tomani M, Dandona P. Elevated serum levels of tumor necrosis factor α in normal-weight women with polycystic ovary syndrome. Metabolism. 1999; 48:437–41. [PubMed: 10206434]
11. Fenkci V, Fenkci S, Yilmazer M, Serteser M. Decreased total antioxidant status and increased oxidative stress in women with polycystic ovary syndrome may contribute to the risk of cardiovascular disease. Fertil Steril. 2003; 80:123–7. [PubMed: 12849813]
12. Talbott EO, Zborowski JV, Rager JR, Boudreaux MY, Edmundowicz DA, Guzick DS. Evidence for an association between metabolic cardiovascular syndrome and coronary and aortic calcification among women with polycystic ovary syndrome. J Clin Endocrinol Metab. 2004; 89:5454–61. [PubMed: 15531497]
13. Corbould A, Kim YB, Youngren JF, et al. Insulin resistance in the skeletal muscle of women with PCOS involves intrinsic and acquired defects in insulin signaling. Am J Physiol Endocrinol Metab. 2005; 288:E1047–54. [PubMed: 15613682]
14. Tarkun I, Cetinarslan B, Türemen E, Cantürk Z, Biyikli M. Association between circulating tumor necrosis factor-alpha, interleukin-6, and insulin resistance in normal-weight women with polycystic ovary syndrome. Metab Syndr Relat Disord. 2006; 4:122–8. [PubMed: 18370758]
15. González F, Rote NS, Minium J, Kirwan JP. Hyperglycemia alters tumor necrosis factor-α release from mononuclear cells in women with polycystic ovary syndrome. J Clin Endocrinol Metab. 2005; 90:5336–42. [PubMed: 15985479]
16. González F, Rote NS, Minium J, Kirwan JP. In vitro evidence that hyperglycemia stimulates tumor necrosis factor-α release in obese women with polycystic ovary syndrome. J Endocrinol. 2006; 88:521–9. [PubMed: 16522732]
17. González F, Rote NS, Minium J, Kirwan JP. Reactive oxygen species-induced oxidative stress in the development of insulin resistance and hyperandrogenism in polycystic ovary syndrome. J Clin Endocrinol Metab. 2006; 91:336–40. [PubMed: 16249279]
18. González F, Rote NS, Minium J, Kirwan JP. Evidence of proatherogenic inflammation in polycystic ovary syndrome. Metabolism. 2009; 58:954–62. [PubMed: 19375763]
19. González F, Rote NS, Minium J, Kirwan JP. Elevated circulating levels of macrophage migration inhibitory factor in polycystic ovary syndrome. Cytokine. 2010; 51:240–4. [PubMed: 20598902]
20. Abdelhadi OA, Shepard MK, Sia CL, Garrett TJ, González F. Activation of nuclear factor κB in response to cream ingestion is related to ovarian androgen hypersecretion in polycystic ovary syndrome. Fertil Steril. 2013; 100(2 Suppl):S39.
21. Barnes PJ, Karin M. Nuclear factor-κB: a pivotal transcription factor in chronic inflammatory diseases. N Engl J Med. 1997; 336:1066–71. [PubMed: 9091804]
22. Rui L, Aguirre V, Kim JK, et al. Insulin/IGF-1 and TNF-α stimulate phosphorylation of IRS-1 at inhibitory Ser307 via distinct pathways. J Clin Invest. 2001; 107:181–9. [PubMed: 11160134]
23. Ghanim H, Aljada A, Hofmeyer D, Syed T, Dandona P. Circulating mononuclear cells in the obese are in a proinflammatory state. Circulation. 2004; 110:1564–1571. [PubMed: 15364812]
24. Taylor RW, Keil D, Gold EJ, Williams SM, Goulding A. Body mass index, waist girth, and waist to hip ratio as indexes of total and regional adiposity in women: evaluation using receiver operating characteristic curves. Am J Clin Nutr. 1998; 67:44–9. [PubMed: 9440374]
25. Matsuda M, DeFronzo R. Insulin sensitivity indices obtained from oral glucose tolerance testing. Diabetes Care. 1999; 22:1462–70. [PubMed: 10480510]
26. Kirwan JP, Huston-Presley L, Kalhan SC, Catalano PM. Clinically useful estimates of insulin sensitivity during pregnancy: validation studies in women with normal glucose tolerance and gestational diabetes mellitus. Diabetes Care. 2001; 24:1602–7. [PubMed: 11522706]
27. Ciampelli M, Leoni F, Cucinelli F, Mancuso S, Panunzi S, De Gaetano A, et al. Assessment of insulin sensitivity from measurements in the fasting state and during an oral glucose tolerance test in polycystic ovary syndrome and menopausal patients. J Clin Endocrinol Metab. 2005; 90:1398–1406. [PubMed: 15598698]
GONZÁLEZ et al. Page 9
Am J Obstet Gynecol. Author manuscript; available in PMC 2015 December 01.
NIH
-PA
Author M
anuscriptN
IH-P
A A
uthor Manuscript
NIH
-PA
Author M
anuscript
28. González F, Rote NS, Minium J, Kirwan JP. In vitro evidence that hyperglycemia stimulates increased IL-6 release from mononuclear cells of obese women with polycystic ovary syndrome. Fertil Steril. 2006; 86(2 Suppl):S449–50.
29. González F, Sia CL, Shepard MK, Rote NS, Minium J. Inflammation in response to glucose ingestion is independent of excess abdominal adiposity in normal weight women with polycystic ovary syndrome. J Clin Endocrinol Metab. 2012; 97:4071–9. [PubMed: 22904174]
30. Cinti S, Mitchell G, Barbatelli G, Murano I, Ceresi E, Faloia E, et al. Adipocyte death defines macrophage localization and function in adipose tissue of obese mice and humans. J Lipid Res. 2005; 46:2347–55. [PubMed: 16150820]
31. Carmina E, Bucchierri S, Esposito A, et al. Abdominal fat quantity and distribution in women with polycystic ovary syndrome and extent of its relation to insulin resistance. J Clin Endocrinol Metab. 2007; 92:2500–5. [PubMed: 17405838]
32. González F, Sia CL, Shepard MK, Rote NS, Minium J. Hyperglycemia-induced oxidative stress is independent of excess abdominal adiposity in normal weight women with polycystic ovary syndrome. Hum Reprod. 2012; 27:3560–8. [PubMed: 22940766]
33. González F, Nair KS, Daniels JK, Basal E, Schimke JM. Hyperandrogenism sensitizes mononuclear cells to promote glucose-induced inflammation in lean reproductive-age women. Am J Physiol Endocrinol Metab. 2012; 302:E297–306. [PubMed: 22045316]
34. González F, Sia CL, Stanczyk FZ, Blair HE, Krupa ME. Hyperandrogenism exerts an anti-inflammatory effect in obese women with polycystic ovary syndrome. Endocrine. 2012; 42:726–35. [PubMed: 22752961]
35. Weisberg SP, McCann D, Desai M, Rosenbaum M, Leibel RL, Ferrante AW Jr. Obesity is associated with macrophage accumulation in adipose tissue. J Clin Invest. 2003; 112:1796–1808. [PubMed: 14679176]
36. Best CL, Pudney J, Welch WR, Burger N, Hill JA. Localization and characterization of white blood cell populations within the human ovary throughout the menstrual cycle and menopause. Hum Reprod. 1996; 11:790–7. [PubMed: 8671330]
37. Piotrowski PC, Rzepczynska IJ, Kwintkiewicz J, Duleba AJ. Oxidative stress induces expression of CYP11A, CYP17, STAR and 3-HSD in rat theca-interstitial cells. J Soc Gynecol Invest. 2005; 12(2 Suppl):319A.
38. Wong DH, Villanueva JA, Cress AB, Sokalska A, Ortega I, Duleba AJ. Resveratrol inhibits the mevalonate pathway and potentiates the antiproliferative effects of simvastatin in rat theca-interstitial cells. Fertil Steril. 2011; 96:1252–8. [PubMed: 21907337]
39. Spazynsky RZ, Arici A, Duleba AJ. Tumor necrosis factor alpha stimulates proliferation of rat ovarian theca-interstitial cells. Biol Reprod. 1999; 61:993–8. [PubMed: 10491635]
40. Sokalska A, Piotrowski PC, Rzepczynska IJ, Cress A, Duleba AJ. Statins inhibit growth of human theca-interstitial cells in PCOS and non-PCOS tissues independently of cholesterol availability. J Clin Endocrinol Metab. 2012; 95:5390–4. [PubMed: 20826585]
41. Nelson VL, Legro RS, Strauss JF 3rd, McAllister JM. Augmented androgen production is a stable steroidogenic phenotype of propagated theca cells from polycystic ovaries. Mol Endocrinol. 1999; 13:946–57. [PubMed: 10379893]
GONZÁLEZ et al. Page 10
Am J Obstet Gynecol. Author manuscript; available in PMC 2015 December 01.
NIH
-PA
Author M
anuscriptN
IH-P
A A
uthor Manuscript
NIH
-PA
Author M
anuscript

FIGURE 1. Mononuclear cell cytokine releaseChange from baseline (%, percent) in lipopolysaccharide (LPS)-exposed (A) tumor necrosis
factor-α (TNFα) and (B) interleukin-6 (IL-6) release from an unexposed baseline in
mononuclear cells isolated from fasting samples and cultured for 24 hours. * Significantly
higher in obese controls compared with lean controls for TNFα (P<0.005) and IL-6
(P<0.04). † Significantly higher in lean women with PCOS compared with lean controls for
TNFα (P<0.0002) and IL-6 (P<0.008). ‡ Significantly higher in obese women with PCOS
compared with lean controls for TNFα (P<0.0001) and IL-6 (P<0.001).
GONZÁLEZ et al. Page 11
Am J Obstet Gynecol. Author manuscript; available in PMC 2015 December 01.
NIH
-PA
Author M
anuscriptN
IH-P
A A
uthor Manuscript
NIH
-PA
Author M
anuscript

FIGURE 2. Fasting plasma interleukin-6 levels* Significantly higher in obese controls compared with lean controls (P<0.0005). †
Significantly higher in lean women with PCOS compared with lean controls (P<0.02). ‡
Significantly higher in obese women with PCOS compared with lean controls (P<0.0001). §
Significantly higher in obese women with PCOS compared with lean women with PCOS
(P<0.02).
GONZÁLEZ et al. Page 12
Am J Obstet Gynecol. Author manuscript; available in PMC 2015 December 01.
NIH
-PA
Author M
anuscriptN
IH-P
A A
uthor Manuscript
NIH
-PA
Author M
anuscript

NIH
-PA
Author M
anuscriptN
IH-P
A A
uthor Manuscript
NIH
-PA
Author M
anuscript
GONZÁLEZ et al. Page 13
TABLE 1
Age, body composition, endocrine and metabolic parameters of subjects
CONTROLS PCOS
Lean Obese Lean Obese
Age, yr 30±2 30±2 27±2 26±2
Height, cm 165.9±1.3 164.0±2.1 162.4±3.4 165.5±1.7
Body weight, kg 62.8±2.0 93.4±3.4a,b 61.1±1.9 96.6±3.5c,d
Body mass index, kg/m2 22.8±0.5 34.7±0.9a,b 23.3±0.7 35.2±1.0c,d
Total body fat, % 32.9±1.7 42.3±0.8a,b 30.3±1.4 44.5±1.2c,d
Truncal fat, % 30.2±1.7 41.7±0.8a,b 29.3±2.2 46.1±1.1c,d
Waist circumference, cm 74.2±1.4 100.8±2.9a,b 77.1±2.3 99.3±5.1c,d
Systolic blood pressure, mmHg 109±2 118±4 112±2 118±4
Diastolic blood pressure, mmHg 64±1 75±3a,b 65±3 72±4
Total cholesterol, mg/dl 177±12 188±20 177±12 178±12
Triglycerides, mg/dl 63±18 113±35 122±34 94±14
HDL – cholesterol, mg/dl 54±5 48±4 52±5 47±4
LDL – cholesterol, mg/dl 115±13 115±18 108±10 118±11
LH, mIU/ml 4.9±0.4 2.8±0.4b,f 10.7±1.2e 8.3±1.1c,d
Testosterone, ng/dl 44.5±3.3 31.4±3.9b,f 66.1±6.5e 72.6±4.7c
Androstendione, ng/ml 1.4±0.1 1.8±0.1b,f 3.3±0.3e 3.5±0.2c
DHEA-S, μg/dl 118±13 161±26b,f 343±41e 291±46c
Fasting glucose, mg/dl 87±2 87±4 84±2 88±2
2 hour glucose, mg/dl 113±6 117±5 106±8 110±6
Fasting insulin, μiU/ml 5.4±0.9 13.9±1.7a,f 11.4±1.3 19.7±3.1c,d
ISOGTT 9.4±1.0 4.6±0.9a 4.3±0.4e 3.0±0.5c
Values are expressed as means ± SE. Conversion factors to SI units: Testosterone x3.467 (nmol/liter), Androstenedione x3.492 (nmol/liter), DHEA-S x0.002714 (μmol/liter), Glucose x0.0551 (mmol/liter), Insulin x7.175 (pmol/liter). ISOGTT, Insulin sensitivity derived from the OGTT.
aObese Control vs. Lean Control, P < 0.03
bObese Control vs. Lean PCOS, P < 0.0007
cObese PCOS vs. Lean Control, P < 0.001
dObese PCOS vs. Lean PCOS, P < 0.05
eLean PCOS vs. Lean Control, P < 0.05
fObese Control vs. Obese PCOS, P < 0.05
Am J Obstet Gynecol. Author manuscript; available in PMC 2015 December 01.
NIH
-PA
Author M
anuscriptN
IH-P
A A
uthor Manuscript
NIH
-PA
Author M
anuscript
GONZÁLEZ et al. Page 14
TABLE 2
Pearson correlations of cytokine release following LPS exposure or plasma IL-6 with body composition,
insulin sensitivity, circulating androgens and each other for the combined groups
MNC-derived TNFα Release (% change)
MNC-derived IL-6 Release (% change)
Fasting plasma IL-6 (pg/ml)
BMI (kg/m2)r 0.269 0.222 0.527
P 0.094 0.180 0.0007*
Waist circum (cm)r 0.198 0.334 0.476
P 0.235 0.044* 0.003*
Total body fat (%)r 0.142 0.170 0.453
P 0.381 0.308 0.004*
Truncal fat (%)r 0.240 0.185 0.559
P 0.135 0.266 0.0003*
ISOGTT
r −0.606 −0.372 −0.542
P 0.0001* 0.021* 0.0004*
Testosterone (ng/dl)r 0.348 0.522 0.322
P 0.028* 0.0008* 0.049*
Androstenedione (ng/ml)r 0.567 0.450 0.371
P 0.0001* 0.005* 0.022*
DHEA-S (μg/dl)r 0.261 0.192 0.006
P 0.103 0.249 0.970
LPS-stimulated TNFα Release (% change)r ---------- 0.385 0.498
P ---------- 0.017* 0.002
LPS-stimulated IL-6 Release (% change)r ---------- ---------- 0.694
P ---------- ---------- 0.0001*
LPS, lipopolysaccharide; TNFα, Tumor necrosis factor-α; IL-6, Interleukin-6; ISOGTT, Insulin sensitivity derived from Matsuda Index; r,
Correlation coefficient; P, Level of significance;
*P<0.05.
Am J Obstet Gynecol. Author manuscript; available in PMC 2015 December 01.