nilay shah centre for process systems engineering...
TRANSCRIPT

1
Pharmaceutical supply chains: key issues and strategies for optimisation
Nilay ShahCentre for Process Systems Engineering
Imperial College London
2
Outline
• Some conclusions• Background• The pharmaceutical industry supply and value chains• Supply chain issues• Primary manufacturing:
– Risk management– Process development
• Challenges for the future

3
Some conclusions
• The pharmaceutical supply chain is very complex, with many interacting facets– Difficult to generate radical improvements quickly– Piecemeal approaches (e.g. improved logistics) will generate
incremental benefits• Current process technology is one of the main supply chain
bottlenecks– Many “built-in” inefficiencies that constrain performance– Not a very responsive system
• Current models in the research community are too “company-centric”– Future models need to consider a holistic view of an extended
supply chain of specialist agents• IP generators• Testing specialists• Contract manufacturers• Logistics providers• Healthcare providers/consumers

4
Trends in the pharmaceutical and related industries
• Time to market is the key metric• R&D productivity (numbers of new chemical entities registered
per unit amount of investment) is declining• effective patent lives are shortening• even while active, patents provide lower barriers to entry• many cheaper product substitutes in many therapeutic areas
– alternative compounds (“me-too drugs”)– off-patent generics
• payers of healthcare exerting strong price pressure and influencing prescribing practices
• for approval, new drugs must:– address new therapeutic areas; or– have very significant cost or health benefits over existing
treatments.

5
Value growth
119.1
10.1
50.6
17.5
86.3
14.7
0
20
40
60
80
100
120
140
1981 1999
$ bnUSJapanEurope

6
Product pipeline
DiscoveryPre-Clinical
ClinicalTrials
Launch Commercial

7
Compound success rates by stages

8
Decreasing R&D efficiency
Total Spending on R&D $bn
New Drug Applications to FDA

9
The value chain
• Discovery generates candidate molecules• Variety of trials evaluates efficacy and safety• Complex regulation process• Manufacturing:
– Primary manufacture of active ingredient (usually 1-2 sites)– Secondary manufacture – production of actual doses (up to 20
sites)– Often geographically separate for taxation, political etc reasons– Complex logistics
• Distribution– Supply chains often global– Many third parties become involved
• Distributors, health authorities etc.
• Retail– Pharmacies, doctors and hospitals are main outlets for ethical
drugs
The
“sup
ply
chai
n”

10
The value chain
Research & development 15%
Primary manufacturing 5 - 10%
Secondary mfg/packaging 15 - 20%
Marketing/distribution 30 - 35%
General administration 5%
Profit 20%
Total 100%

11
The supply chain
• Difficult to get value from early stage discovery/trials processes (cf. decreasing R&D efficiency, recent mergers)– Can Process Systems Engineering techniques help generate
more focussed searches/libraries?• Companies view supply chain differently:
– was a means of getting product to where it was needed– now a means of delivering additional value
• (At least) three interesting problems:– Process development and design– Planning of trials/testing and capacity under uncertainty– “Classical” Supply chain planning and management

12
Process development and design
• Problems:– Process chemistry, solvent and catalyst choices result in
• Low material efficiencies (of order 1%)
– Inefficient, very traditional batch manufacturing processes result in• Low velocity ratio or value-added time (of order 1%)
– Sub-optimal design of drug delivery systems results in• Low bio-availability where required (of order 1% for traditional
formulations e.g. pills)
• 1mg delivered to target area:– may require 10kg of materials overall!– ties up a considerable amount of capital!

13
One stage: typical overall mass balance
Effluent 42%
Manufacture
Landfill 9%
Incineration 6%
Material in 100%
Product 10%
Recovery/recycle 29%Solvent ‘loss’ 2%
By-product sold 2%

14
Typical batch process
Measure
Working capital for 4 days
How long does the conversion process really take?
Low value-added time!
Store
2 days
React
12 hrSeparate
12 hr
Store
18 hr
Purify
12 hr Product
Separate
12 hr

15
Longer time: higher costs and lower quality
Cost
Time
Quality

16
Process development and design
• Many research groups now working in relevant fields• More of a design than operations issue
– Significant improvements in material efficiencies required• Involvement of process (systems) engineering at early stage
– Model-based design– True catalysis rather than stoichiometric reagents– Optimise overall material efficiency rather than reaction yields– Large reductions in solvents
» Need for better heat transfer technology– Improve manufacturing performance
• Run processes as close to intrinsic rates as possible• Use small-scale continuous processing where possible• Avoid stage-to-stage isolation where possible• Cleaning and changeovers! (see later)
– Improve drug delivery to be more targeted (new field)

17
The supply chain
• Difficult to get value from early stage discovery/trials processes (cf. decreasing R&D efficiency, recent mergers)– Can Process Systems Engineering techniques help generate
more focussed searches/libraries?• Companies view supply chain differently:
– was a means of getting product to where it was needed– now a means of delivering additional value
• (At least) three interesting problems:– Process development and design– Planning of trials/testing and capacity under uncertainty– “Classical” supply chain planning and management

18
Testing and capacity planning
• “Traditional” sequential approach:
Tests foractivity
Tests fortoxicity
Tests forefficacy
fail
fail
fail
pass
pass
Tests characterised by:Duration*
Cost (in-house or outsourced)*
Resource requirements*
Hard precedence constraintsSoft/conditional precedence constraintsProbability of success
*may be distributions rather than known
Sequential approach conserves resources, butmay increase time to market

19
Optimised planning of tests(Grossmann & co-workers, Pekny, Reklaitis and co-workers)
• Rather than follow sequential approach, approach from a resource-constrained scheduling perspective
• Some tasks have conditional dependence• Degrees of freedom on task precedence• Optimisation balances:
– Risk of unnecessary expenditure– Potential rewards of coming to market earlier– Resource constraints and outsourcing costs
• Resource-constrained stochastic optimisation problem– Conservative approaches (always feasible)– Hybrid simulation-optimisation approaches

20
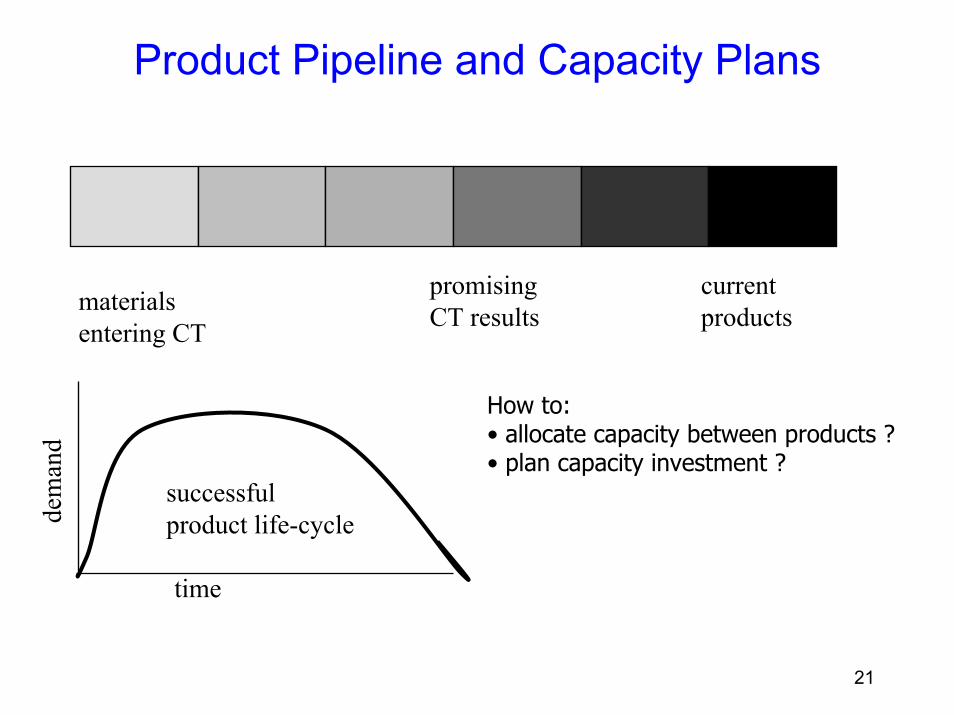
Capacity and portfolio planning under uncertainty
• What technology/capacity, where, when (plant fabrication lead times!), whether to outsource
• Products to prioritise in the R&D pipeline to structure the future portfolio optimally
• Most severe for pharmaceuticals:– capacity requirements very dependent on outcome of
clinical trials, registration etc.
• Extreme cases– pessimistic: no investment and many successful
products: severe capacity limitations– optimistic: investment → plenty of capacity but no
new products → patent expiry issues
• Need for systematic way to balance risks
21
Product Pipeline and Capacity Plans
promisingCT results
current productsmaterials
entering CT
time
dem
and
successfulproduct life-cycle
How to:• allocate capacity between products ?• plan capacity investment ?
22
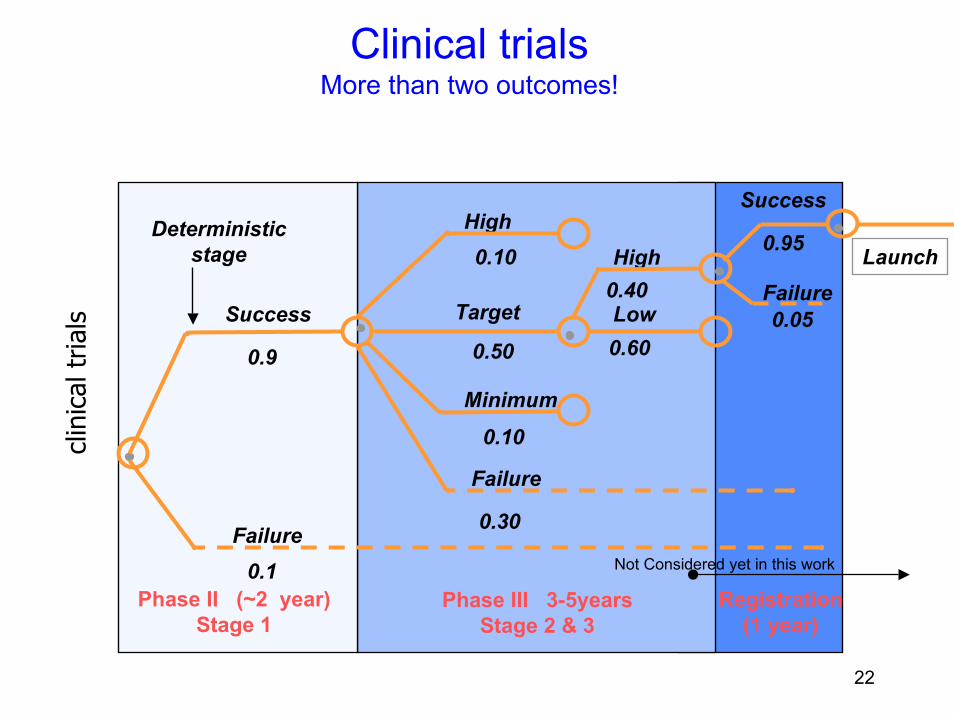
Clinical trialsMore than two outcomes!
clin
ical
tria
ls
Phase II (~2 year)Stage 1
Phase III 3-5yearsStage 2 & 3
Registration(1 year)
Success
Failure
0.9
0.1
High
Target
Minimum
Failure
0.10
0.10
0.30
0.50
0.40
0.60
Success
Failure
0.95
0.05
Not Considered yet in this work
High
Low
Deterministic stage Launch

23
Scenario Tree & Clinical Trial Outcomes
Stage 316
1-4
29-32
61-64
+1 StochasticProduct C3
H T L 7
Stage 4
11
2
3
4
+1 StochasticProduct C2
H F
H T
H H TH H
H L
H F F
+1 StochasticProduct C4
1 DeterministicProduct C1
H
Clinical Trial OutcomesH – High Success T – TargetL – LowF – Failure
Stage 1Periods
1
Scn 28H T L F
30 40101 20
Stage 2
Scn 63H F F L
Scn 2H H H T

24
ResultsNPV profile

25
Strategy matrix: risk analysis
Worst Case ( Exposure ) NPVs(-100) Scenarios Legend
Aa AbBa BbCD
FaGH
EbFb
Bc
Ea(INCREASINGRISK)
(-130)
(-160)
Probability of Losses15%30% 0%

26
Combined testing and capacity planning(Grossmann and co-workers)
• Interesting way forward– Holistic analysis of value chain
• Better synchronisation leads to material being ready if tests are successful
– Avoid shortage of material for clinical trials
• Basis for future work; extensions:– Management of risk is a key feature
• Real options techniques should be relevant
– Needs to take account of global trading structures– Needs to include creative possibilities in model
• e.g. placing of low-commitment options with subcontractors
– Needs to take more extended view of supply chain

27
The supply chain
• Difficult to get value from early stage discovery/trials processes (cf. decreasing R&D efficiency, recent mergers)– Can Process Systems Engineering techniques help generate
more focussed searches/libraries?• Companies view supply chain differently:
– was a means of getting product to where it was needed– now a means of delivering additional value
• (At least) three interesting problems:– Process development and design– Planning of trials/testing and capacity under uncertainty– “Classical” Supply chain planning and management

28
“Classical” supply chain planning and management
• Some performance measures– Pipeline stocks may be 30-110% of annual demand– Finished good stocks 10-50% (4-26 weeks) of annual demand– Supply chain cycle times of order 1000s of hours– Value added times 0.3-5% of cycle times– Supply chain costs overtaking R&D costs
• What can better operations deliver?– 30% stock reduction– 30% increase in value-added time– 7% reduction in supply chain costs
• Benefits of improved operation for one large drug:– $30m one-off– $8-16m p.a.
29
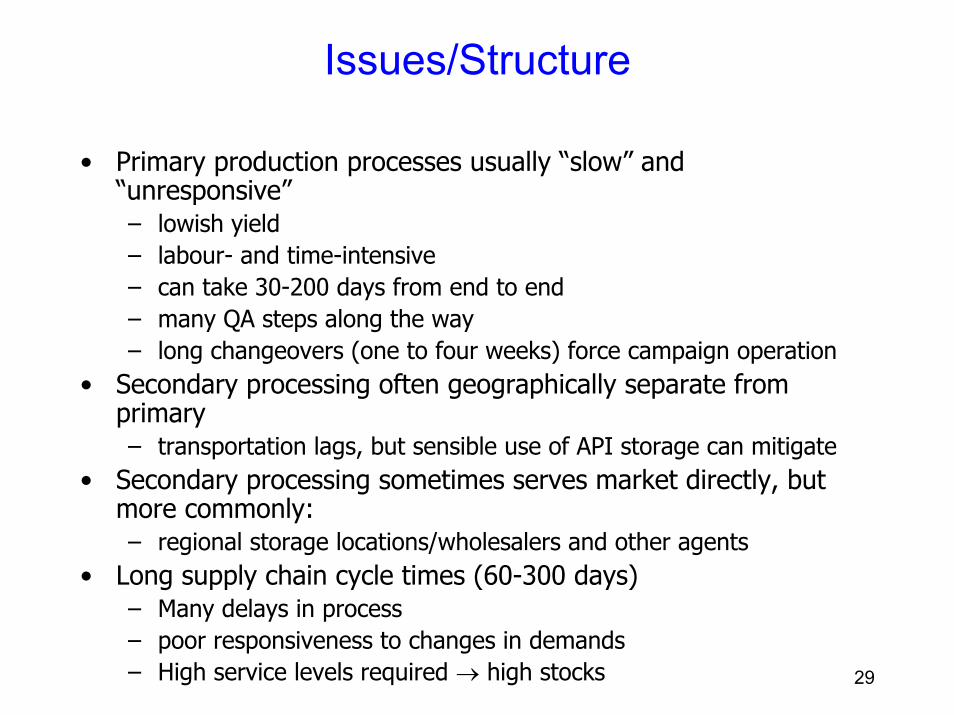
Issues/Structure
• Primary production processes usually “slow” and “unresponsive”– lowish yield– labour- and time-intensive – can take 30-200 days from end to end– many QA steps along the way– long changeovers (one to four weeks) force campaign operation
• Secondary processing often geographically separate from primary– transportation lags, but sensible use of API storage can mitigate
• Secondary processing sometimes serves market directly, but more commonly:– regional storage locations/wholesalers and other agents
• Long supply chain cycle times (60-300 days)– Many delays in process– poor responsiveness to changes in demands– High service levels required → high stocks
30
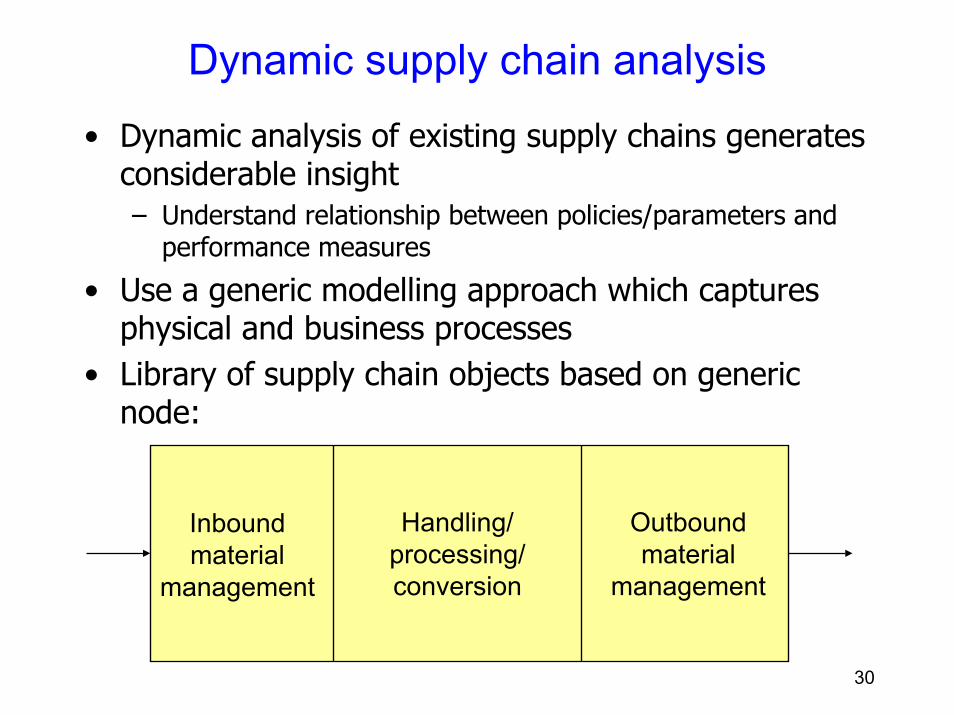
Dynamic supply chain analysis
• Dynamic analysis of existing supply chains generates considerable insight– Understand relationship between policies/parameters and
performance measures
• Use a generic modelling approach which captures physical and business processes
• Library of supply chain objects based on generic node:
Inboundmaterial
management
Handling/processing/conversion
Outboundmaterial
management

31
One SKU: forward look
0
0.1
0.2
0.3
0.4
0.5
0.6
0.7
4 5 6 7 8
Weeks Safety Stock
Expected number of stock out (per period)
0.00E+00
5.00E+05
1.00E+06
1.50E+06
2.00E+06
2.50E+06
3.00E+06
3.50E+06
Jan-0
0
Feb-0
0
Mar-
00
Apr-
00
May-0
0
Jun-0
0
Jul-00
Aug-0
0
Sep-0
0
Oct-
00
Nov-0
0
Dec-0
0
Jan-0
1
Feb-0
1
Mar-
01
Apr-
01
May-0
1
Jun-0
1
Jul-01
Aug-0
1
Sep-0
1
Oct-
01
Nov-0
1
Dec-0
1
Average InventorySafety StockHigh ConfidenceLow Confidence
99.4
99.6
99.8
100
4 5 6 7 8
Weeks Safety Stock
Customer service level
0.00E+00
5.00E+05
1.00E+06
1.50E+06
2.00E+06
2.50E+06
4 5 6 7 8
Weeks Safety Stock
Average inventory kept

32
A particular market
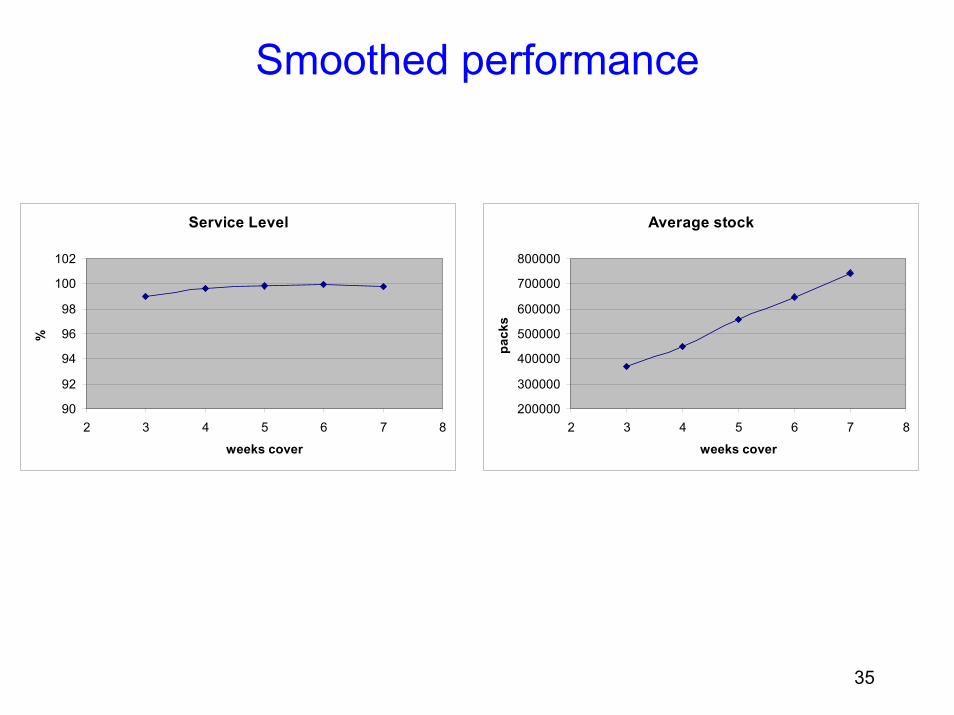
• End-user demand fairly steady, but• Internal processes create additional dynamics• Need for high safety stocks to buffer• Aim for high service levels – high perceived
opportunity cost• What if demand was more in line with end-use ?
33
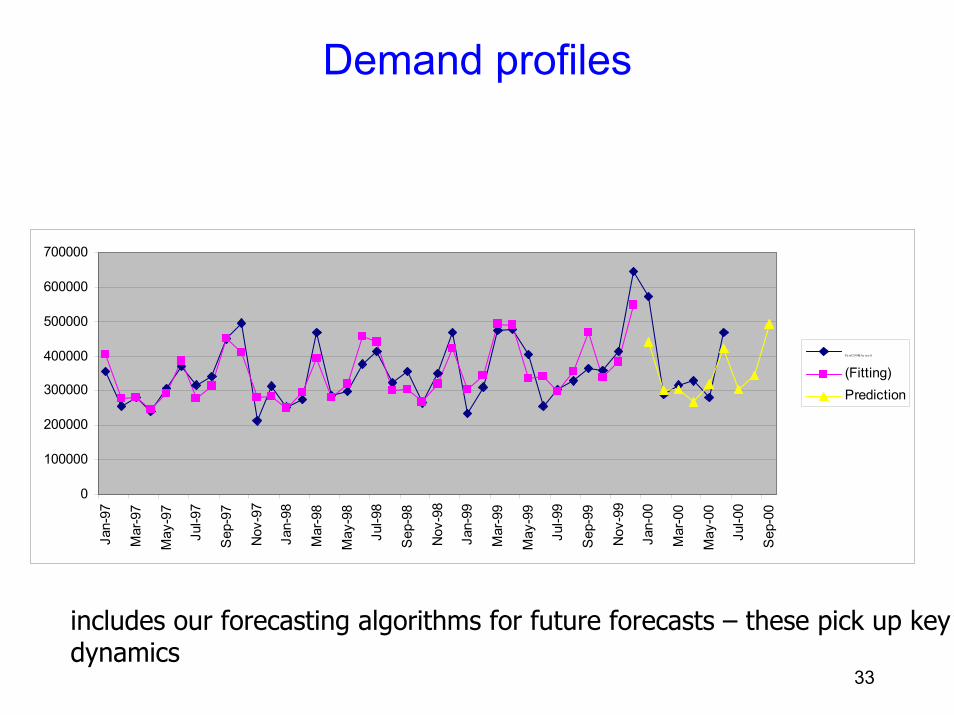
Demand profiles
0
100000
200000
300000
400000
500000
600000
700000
Jan-
97
Mar
-97
May
-97
Jul-9
7
Sep
-97
Nov
-97
Jan-
98
Mar
-98
May
-98
Jul-9
8
Sep
-98
Nov
-98
Jan-
99
Mar
-99
May
-99
Jul-9
9
Sep
-99
Nov
-99
Jan-
00
Mar
-00
May
-00
Jul-0
0
Sep
-00
Pa xil2 01 00(Ac tu a l)
(Fitting)Prediction
includes our forecasting algorithms for future forecasts – these pick up key dynamics

34
Current policy: performance
Service Level
90
92
94
96
98
100
2 3 4 5 6 7 8
weeks cover
%
Average stock
200000
300000
400000
500000
600000
700000
800000
2 3 4 5 6 7 8
weeks cover
pack
s
35
Smoothed performance
Service Level
90
92
94
96
98
100
102
2 3 4 5 6 7 8
weeks cover
%
Average stock
200000
300000
400000
500000
600000
700000
800000
2 3 4 5 6 7 8
weeks cover
pack
s

36
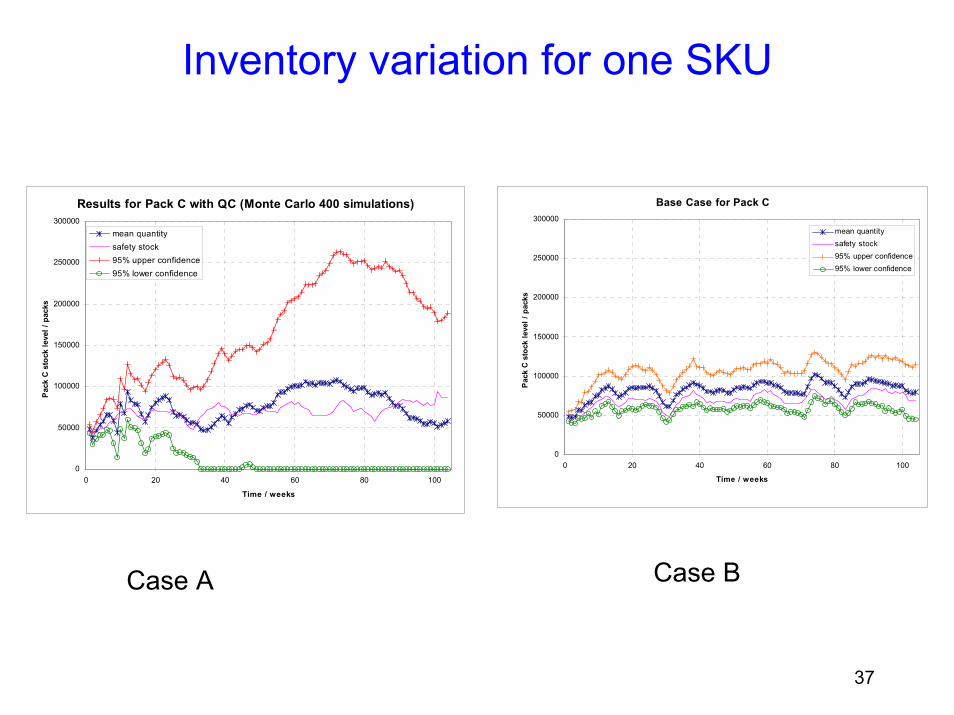
Comparison of two supply chain responses
• Pharmaceutical process– primary production has five synthesis stages– two secondary manufacturing sites
• Two different process principles– Case A: QC at the end of each synthesis stage and the final
products– Case B: QC for the product of the primary process (AI), and
the final product
37
Inventory variation for one SKU
Results for Pack C with QC (Monte Carlo 400 simulations)
0
50000
100000
150000
200000
250000
300000
0 20 40 60 80 100
Time / weeks
Pack
C s
tock
leve
l / p
acks
mean quantitysafety stock95% upper confidence95% lower confidence
Base Case for Pack C
0
50000
100000
150000
200000
250000
300000
0 20 40 60 80 100
Time / weeks
Pack
C s
tock
leve
l / p
acks
mean quantitysafety stock95% upper confidence95% lower confidence
Case BCase A

38
SCM more generally…
• Re-emphasise need for better process technology for 10
manufacture• Currently push-based at back-end of supply chain:
– hard to be responsive– complicated dynamics– can’t exploit short-term opportunities (e.g. tenders)
• aim for much faster processes• avoid too many quality control interventions and isolations• aim for easy to clean/reconfigure (disposable?) plants
– Move towards short-term scheduling• Interim:
– optimise campaign planning (cf. literature of 1980s!)– optimise changeovers using SMED concepts

39
SCM more generally (cont’d) …
• Current SCM methodologies involve a degree of decentralisation– Regional demand management– Primary or secondary planning– Subcontractors– Robust, but built-in inefficiencies
• Need for more integrated, seamless planning– Very large-scale multi-site problems with large geographical span– Looser alliances may arise (e.g. semiconductors, computers)
• Increased co-ordination problems
– Tailored optimisation algorithms will be required– Need to build in robustness (cf. work of Maranas and co-workers,
Sahinidis and co-workers)

40
Some conclusions
• The pharmaceutical supply chain is very complex, with many interacting facets– Difficult to generate radical improvements quickly– Piecemeal approaches (e.g. improved logistics) will generate
incremental benefits• Current process technology is one of the main supply chain
bottlenecks– Many “built-in” inefficiencies that constrain performance– Not a very responsive system
• Current models in the research community are too “company-centric”– Future models need to consider a holistic view of an extended
supply chain of specialist agents• IP generators• Testing specialists• Contract manufacturers• Logistics providers• Healthcare providers/consumers

41
Future perspectives
• Industry– at crossroads?
• “Big is beautiful” v. alliances of specialists• Latter will need next generation of supply chain tools
• Products– More complex, more synthesis stages, more chiral, more active,
smaller lot-sizes– Better drug delivery mechanisms
• Smaller dosages– Likely to become more specialised
• Local solutions to local problems• Genetic research leading to target sub-populations• Current manufacturing and supply chain poorly suited to this
– Economies of scale 1-2 orders of magnitude out– Rapid response vaccines (civilian and military)– More crop-derived products – new supply chains

42
Acknowledgements
• Members of Britest project (www.britest.co.uk)• UK Engineering and Physical Sciences Research
Council• Fellow researchers: Gabriel Gatica, Jonatan
Gjerdrum, Wing Yan Hung, Rodney Johnson, Lazaros Papageorgiou, Nouri Samsatli, Mona Sharif, Trevor Tsang