nisource powerpoint template - nasdaqfiles.shareholder.com/downloads/ni/0x0x902502/bd... · •...
TRANSCRIPT

Supplemental SlidesSecond Quarter 2016 Earnings
August 2, 2016
Forward-Looking Statements
Forward-Looking Statements This presentation contains forward-looking statements within the meaning of federal securities laws. These forward-looking
statements are subject to various risks and uncertainties. Examples of forward-looking statements in this presentation include
statements and expectations regarding NiSource’s business, performance, infrastructure or utility investments and growth. Factors
that could cause actual results to differ materially from the projections, forecasts, estimates, plans and expectations discussed in this
presentation include, but are not limited to, NiSource’s debt obligations; any changes in NiSource’s credit rating; NiSource’s ability to
execute its growth strategy; changes in general economic, capital and commodity market conditions; pension funding obligations;
economic regulation and the impact of regulatory rate reviews; compliance with environmental laws and the costs of associated
liabilities; fluctuations in demand from residential and commercial customers; economic conditions of certain industries; the price of
energy commodities and related transportation costs; the reliability of customers and suppliers to fulfill their payment and contractual
obligations; potential impairments of goodwill or definite-lived intangible assets; changes in taxation and accounting principles;
potential incidents and other operating risks associated with our business; the impact of an aging infrastructure; the impact of climate
change; potential cyber-attacks; risks associated with construction and natural gas cost and supply; extreme weather conditions; the
ability of subsidiaries to generate cash; uncertainties related to the expected benefits of the separation of Columbia Pipeline Group
Inc. and other matters referenced in the “Risk Factors” section of NiSource’s Annual Report on Form 10-K for the fiscal year ended
December 31, 2015 and in other filings with the Securities and Exchange Commission. NiSource expressly disclaims any duty to
update, supplement or amend any of its forward-looking statements contained in this presentation, whether as a result of new
information, subsequent events or otherwise, except as required by applicable law.
Regulation G Disclosure Statement This presentation includes financial results and guidance for NiSource with respect to net operating earnings and operating earnings,
which are non-GAAP financial measures as defined by the SEC’s Regulation G. The company includes such measures because
management believes they permit investors to view the company’s performance using the same tools that management uses and to
better evaluate the Company’s ongoing business performance. With respect to such guidance, it should be noted that there will likely
be differences between such measures and GAAP equivalents due to various factors, including, but not limited to, fluctuations in
weather, asset sales and impairments, separation transaction-related and other items included in GAAP results. NiSource is not able
to estimate the impact of such factors on GAAP earnings and, as such, is not providing earnings guidance on a GAAP basis.
2
Continued Execution & Growth
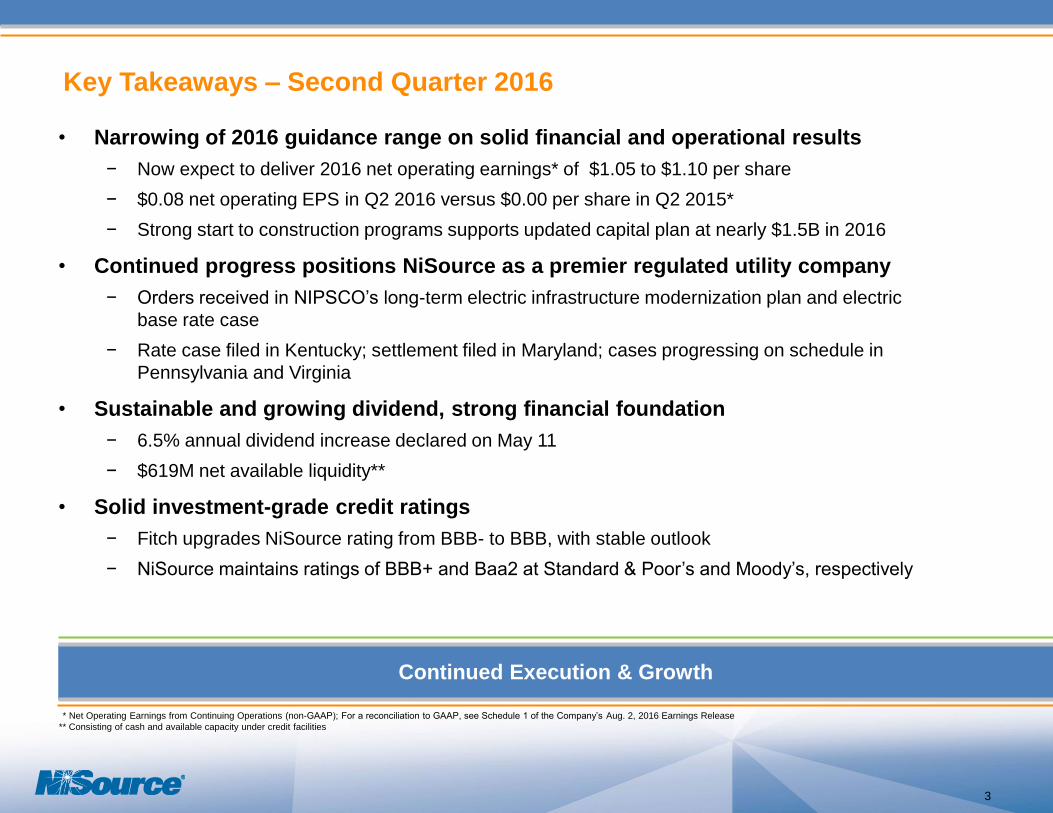
Key Takeaways – Second Quarter 2016
• Narrowing of 2016 guidance range on solid financial and operational results
− Now expect to deliver 2016 net operating earnings* of $1.05 to $1.10 per share
− $0.08 net operating EPS in Q2 2016 versus $0.00 per share in Q2 2015*
− Strong start to construction programs supports updated capital plan at nearly $1.5B in 2016
• Continued progress positions NiSource as a premier regulated utility company
− Orders received in NIPSCO’s long-term electric infrastructure modernization plan and electric
base rate case
− Rate case filed in Kentucky; settlement filed in Maryland; cases progressing on schedule in
Pennsylvania and Virginia
• Sustainable and growing dividend, strong financial foundation
− 6.5% annual dividend increase declared on May 11
− $619M net available liquidity**
• Solid investment-grade credit ratings
− Fitch upgrades NiSource rating from BBB- to BBB, with stable outlook
− NiSource maintains ratings of BBB+ and Baa2 at Standard & Poor’s and Moody’s, respectively
* Net Operating Earnings from Continuing Operations (non-GAAP); For a reconciliation to GAAP, see Schedule 1 of the Company’s Aug. 2, 2016 Earnings Release
** Consisting of cash and available capacity under credit facilities
3
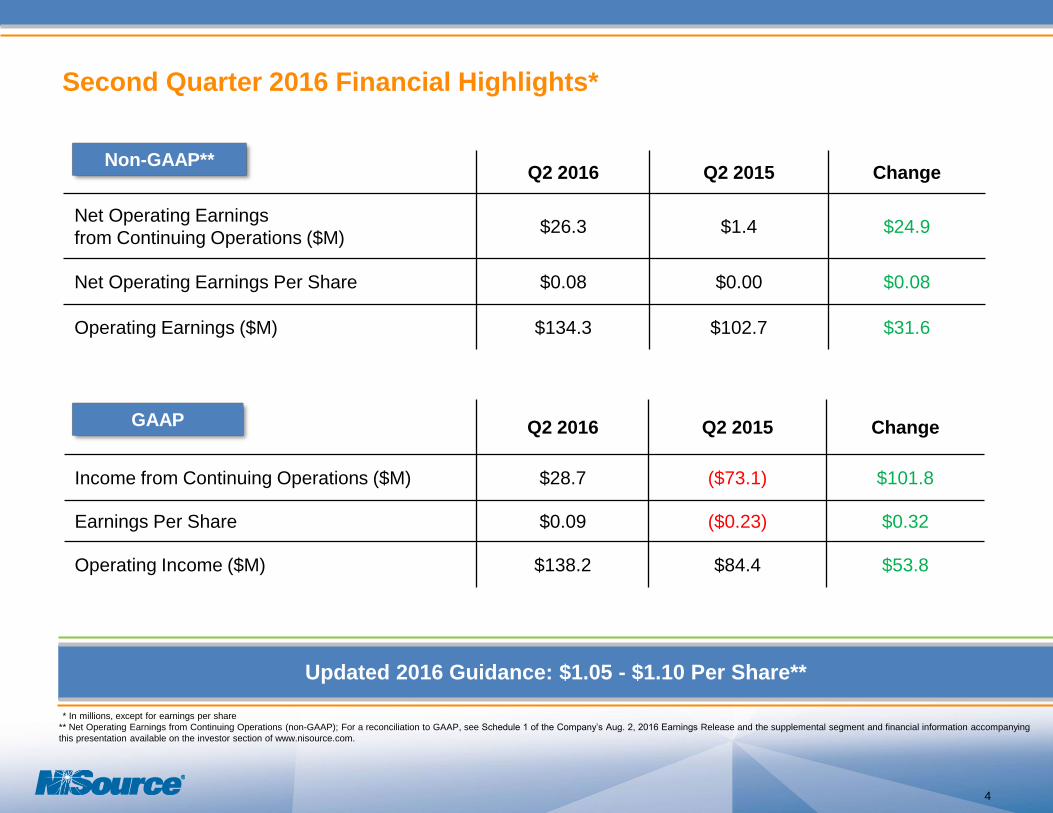
Updated 2016 Guidance: $1.05 - $1.10 Per Share**
Second Quarter 2016 Financial Highlights*
Q2 2016 Q2 2015 Change
Net Operating Earnings
from Continuing Operations ($M)$26.3 $1.4 $24.9
Net Operating Earnings Per Share $0.08 $0.00 $0.08
Operating Earnings ($M) $134.3 $102.7 $31.6
Q2 2016 Q2 2015 Change
Income from Continuing Operations ($M) $28.7 ($73.1) $101.8
Earnings Per Share $0.09 ($0.23) $0.32
Operating Income ($M) $138.2 $84.4 $53.8
GAAP
Non-GAAP**
* In millions, except for earnings per share
** Net Operating Earnings from Continuing Operations (non-GAAP); For a reconciliation to GAAP, see Schedule 1 of the Company’s Aug. 2, 2016 Earnings Release and the supplemental segment and financial information accompanying
this presentation available on the investor section of www.nisource.com.
4
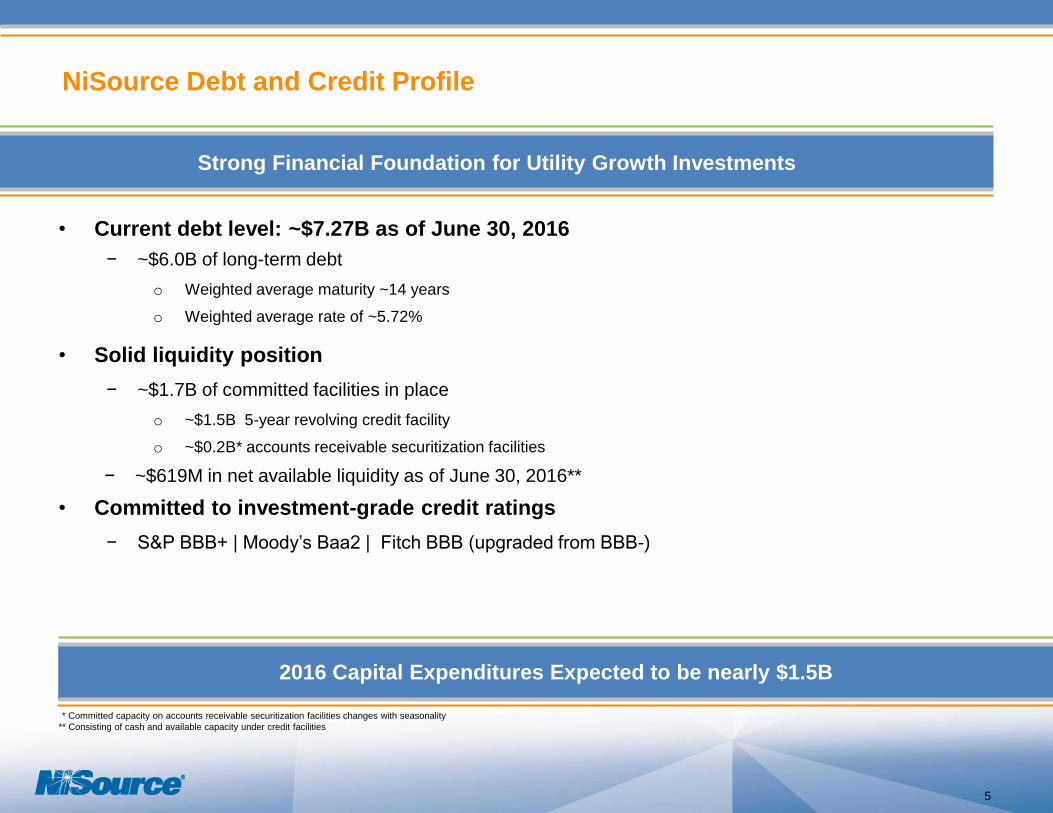
* Committed capacity on accounts receivable securitization facilities changes with seasonality
** Consisting of cash and available capacity under credit facilities
NiSource Debt and Credit Profile
2016 Capital Expenditures Expected to be nearly $1.5B
Strong Financial Foundation for Utility Growth Investments
• Current debt level: ~$7.27B as of June 30, 2016
− ~$6.0B of long-term debt
o Weighted average maturity ~14 years
o Weighted average rate of ~5.72%
• Solid liquidity position
− ~$1.7B of committed facilities in place
o ~$1.5B 5-year revolving credit facility
o ~$0.2B* accounts receivable securitization facilities
− ~$619M in net available liquidity as of June 30, 2016**
• Committed to investment-grade credit ratings
− S&P BBB+ | Moody’s Baa2 | Fitch BBB (upgraded from BBB-)
5
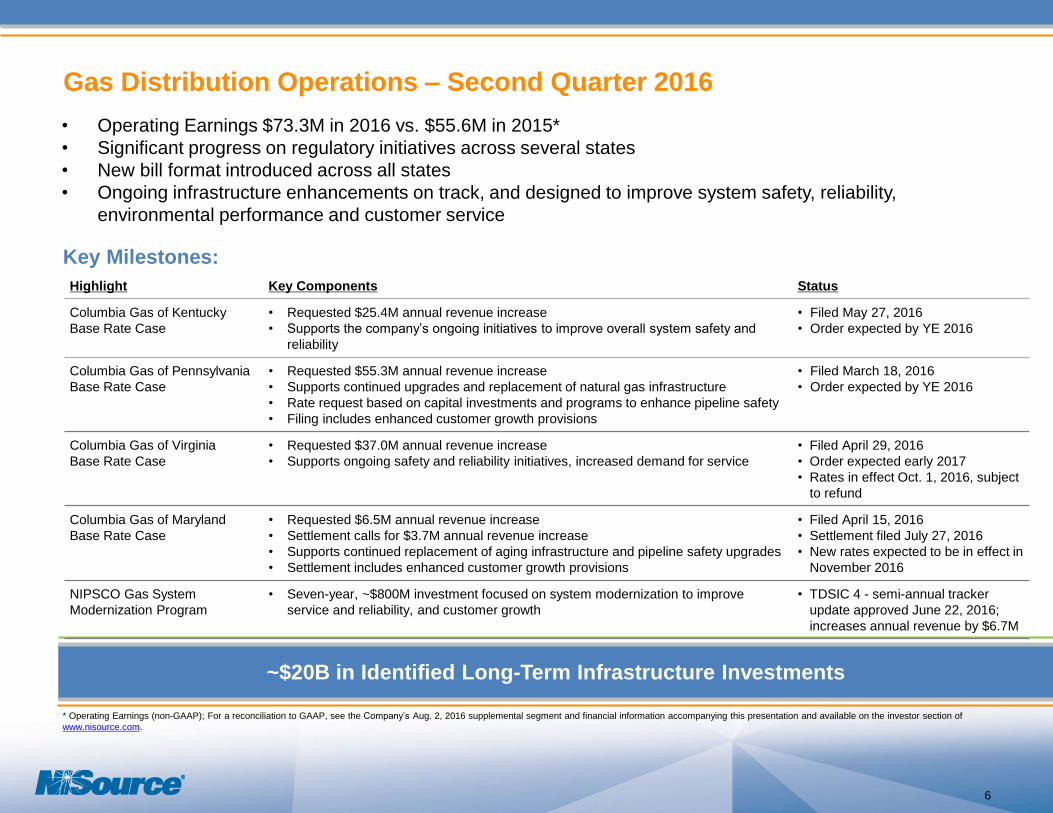
~$20B in Identified Long-Term Infrastructure Investments
6
Highlight Key Components Status
Columbia Gas of Kentucky
Base Rate Case
• Requested $25.4M annual revenue increase
• Supports the company’s ongoing initiatives to improve overall system safety and
reliability
• Filed May 27, 2016
• Order expected by YE 2016
Columbia Gas of Pennsylvania
Base Rate Case
• Requested $55.3M annual revenue increase
• Supports continued upgrades and replacement of natural gas infrastructure
• Rate request based on capital investments and programs to enhance pipeline safety
• Filing includes enhanced customer growth provisions
• Filed March 18, 2016
• Order expected by YE 2016
Columbia Gas of Virginia
Base Rate Case
• Requested $37.0M annual revenue increase
• Supports ongoing safety and reliability initiatives, increased demand for service
• Filed April 29, 2016
• Order expected early 2017
• Rates in effect Oct. 1, 2016, subject
to refund
Columbia Gas of Maryland
Base Rate Case
• Requested $6.5M annual revenue increase
• Settlement calls for $3.7M annual revenue increase
• Supports continued replacement of aging infrastructure and pipeline safety upgrades
• Settlement includes enhanced customer growth provisions
• Filed April 15, 2016
• Settlement filed July 27, 2016
• New rates expected to be in effect in
November 2016
NIPSCO Gas System
Modernization Program
• Seven-year, ~$800M investment focused on system modernization to improve
service and reliability, and customer growth
• TDSIC 4 - semi-annual tracker
update approved June 22, 2016;
increases annual revenue by $6.7M
• Operating Earnings $73.3M in 2016 vs. $55.6M in 2015*
• Significant progress on regulatory initiatives across several states
• New bill format introduced across all states
• Ongoing infrastructure enhancements on track, and designed to improve system safety, reliability,
environmental performance and customer service
* Operating Earnings (non-GAAP); For a reconciliation to GAAP, see the Company’s Aug. 2, 2016 supplemental segment and financial information accompanying this presentation and available on the investor section of
www.nisource.com.
Gas Distribution Operations – Second Quarter 2016
Key Milestones:
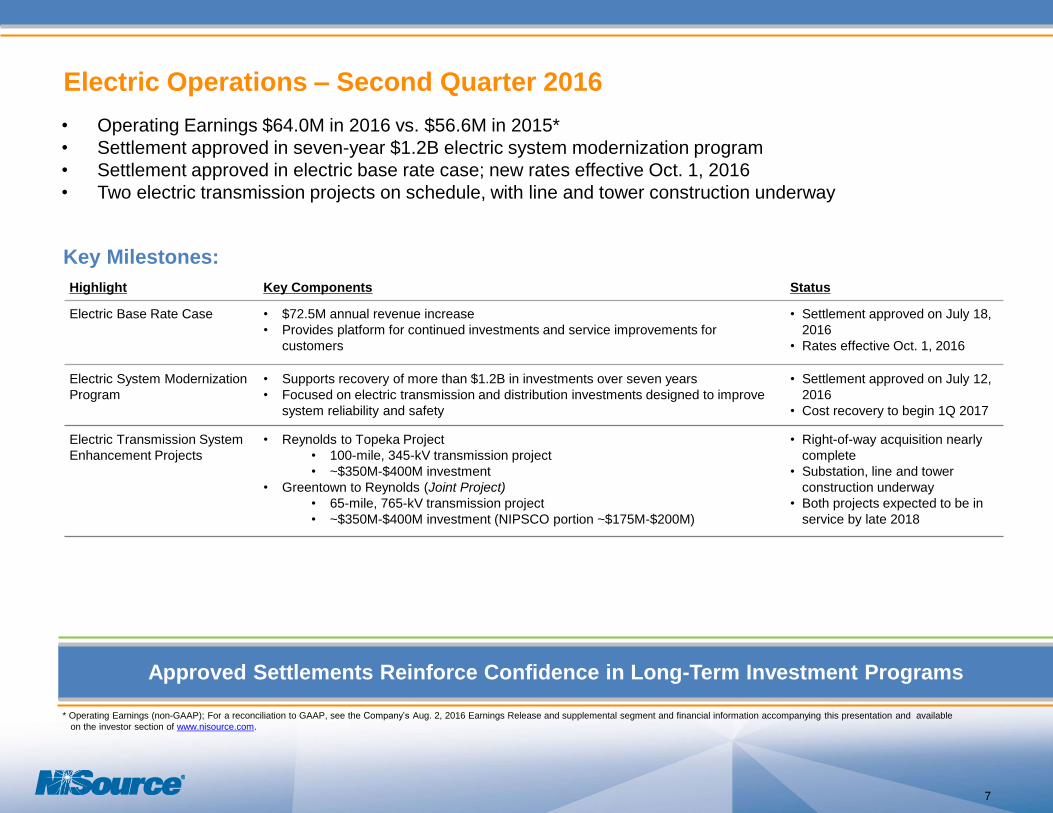
Approved Settlements Reinforce Confidence in Long-Term Investment Programs
• Operating Earnings $64.0M in 2016 vs. $56.6M in 2015*
• Settlement approved in seven-year $1.2B electric system modernization program
• Settlement approved in electric base rate case; new rates effective Oct. 1, 2016
• Two electric transmission projects on schedule, with line and tower construction underway
Highlight Key Components Status
Electric Base Rate Case • $72.5M annual revenue increase
• Provides platform for continued investments and service improvements for
customers
• Settlement approved on July 18,
2016
• Rates effective Oct. 1, 2016
Electric System Modernization
Program
• Supports recovery of more than $1.2B in investments over seven years
• Focused on electric transmission and distribution investments designed to improve
system reliability and safety
• Settlement approved on July 12,
2016
• Cost recovery to begin 1Q 2017
Electric Transmission System
Enhancement Projects
• Reynolds to Topeka Project
• 100-mile, 345-kV transmission project
• ~$350M-$400M investment
• Greentown to Reynolds (Joint Project)
• 65-mile, 765-kV transmission project
• ~$350M-$400M investment (NIPSCO portion ~$175M-$200M)
• Right-of-way acquisition nearly
complete
• Substation, line and tower
construction underway
• Both projects expected to be in
service by late 2018
Electric Operations – Second Quarter 2016
Key Milestones:
* Operating Earnings (non-GAAP); For a reconciliation to GAAP, see the Company’s Aug. 2, 2016 Earnings Release and supplemental segment and financial information accompanying this presentation and available
on the investor section of www.nisource.com.
7
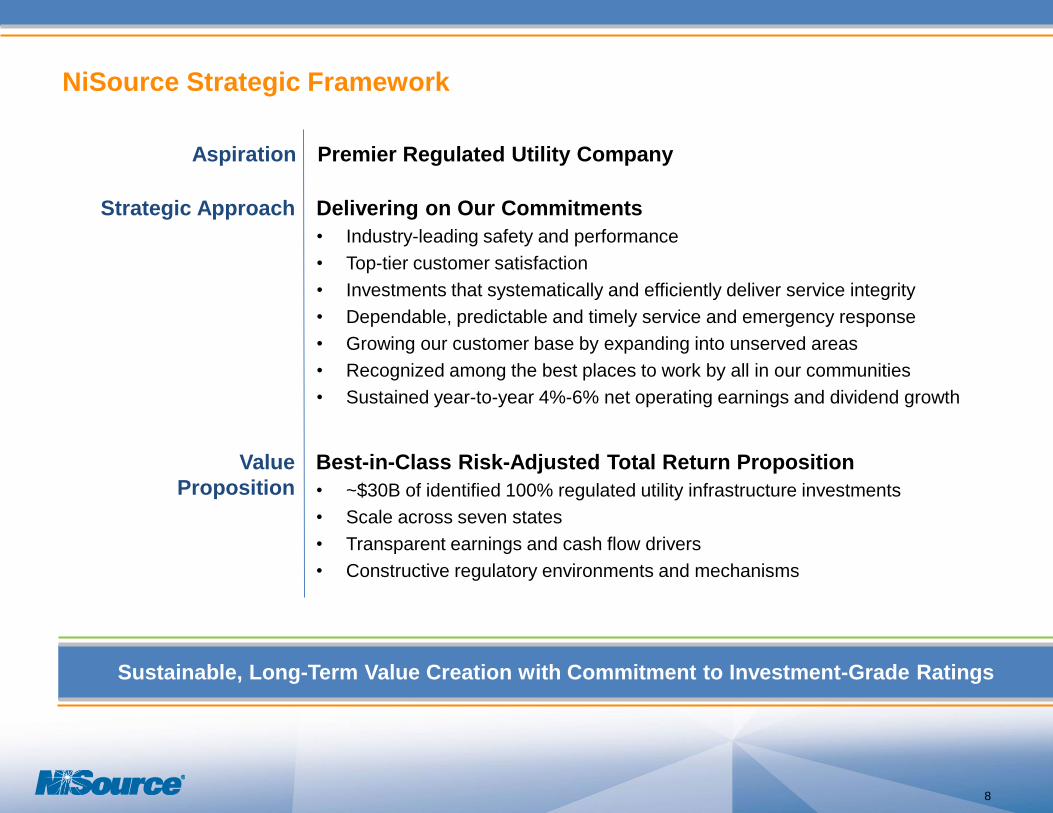
NiSource Strategic Framework
8
Sustainable, Long-Term Value Creation with Commitment to Investment-Grade Ratings
Aspiration Premier Regulated Utility Company
Strategic Approach Delivering on Our Commitments
• Industry-leading safety and performance
• Top-tier customer satisfaction
• Investments that systematically and efficiently deliver service integrity
• Dependable, predictable and timely service and emergency response
• Growing our customer base by expanding into unserved areas
• Recognized among the best places to work by all in our communities
• Sustained year-to-year 4%-6% net operating earnings and dividend growth
Value
Proposition
Best-in-Class Risk-Adjusted Total Return Proposition
• ~$30B of identified 100% regulated utility infrastructure investments
• Scale across seven states
• Transparent earnings and cash flow drivers
• Constructive regulatory environments and mechanisms

Appendix:Second Quarter 2016 Earnings
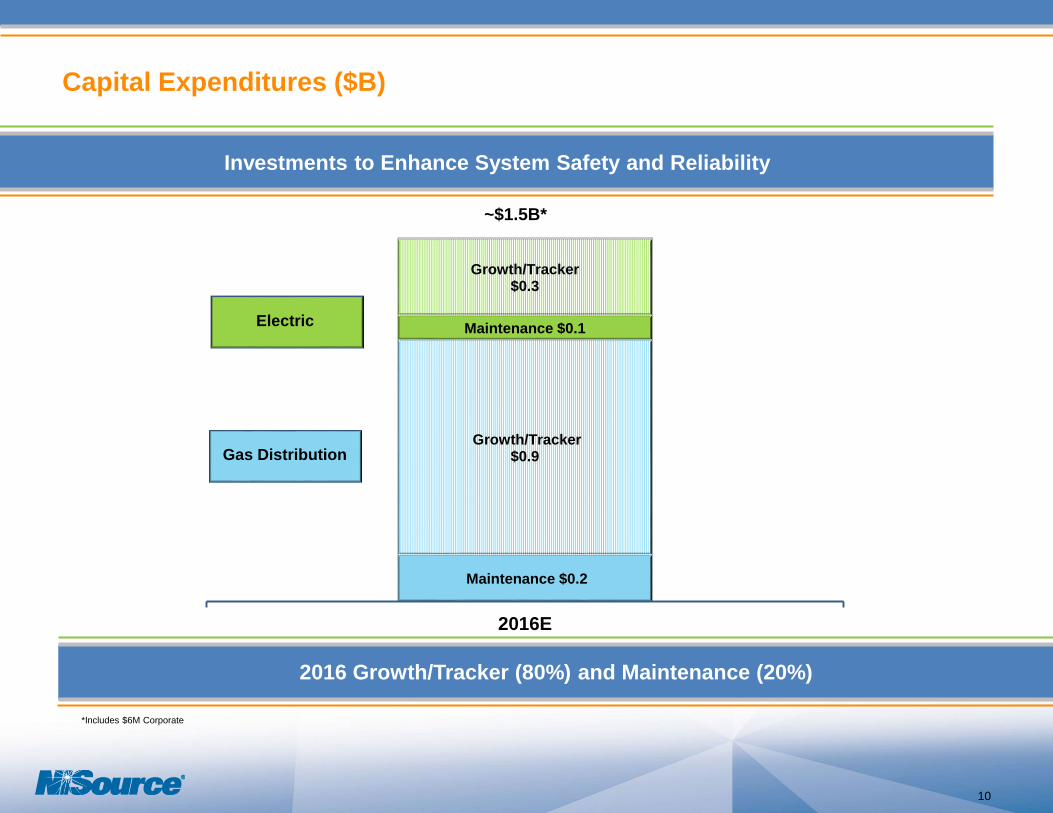
Maintenance $0.2
Growth/Tracker$0.9
Maintenance $0.1
Growth/Tracker$0.3
2016E
Gas Distribution
Electric
Capital Expenditures ($B)
10
2016 Growth/Tracker (80%) and Maintenance (20%)
Investments to Enhance System Safety and Reliability
~$1.5B*
*Includes $6M Corporate
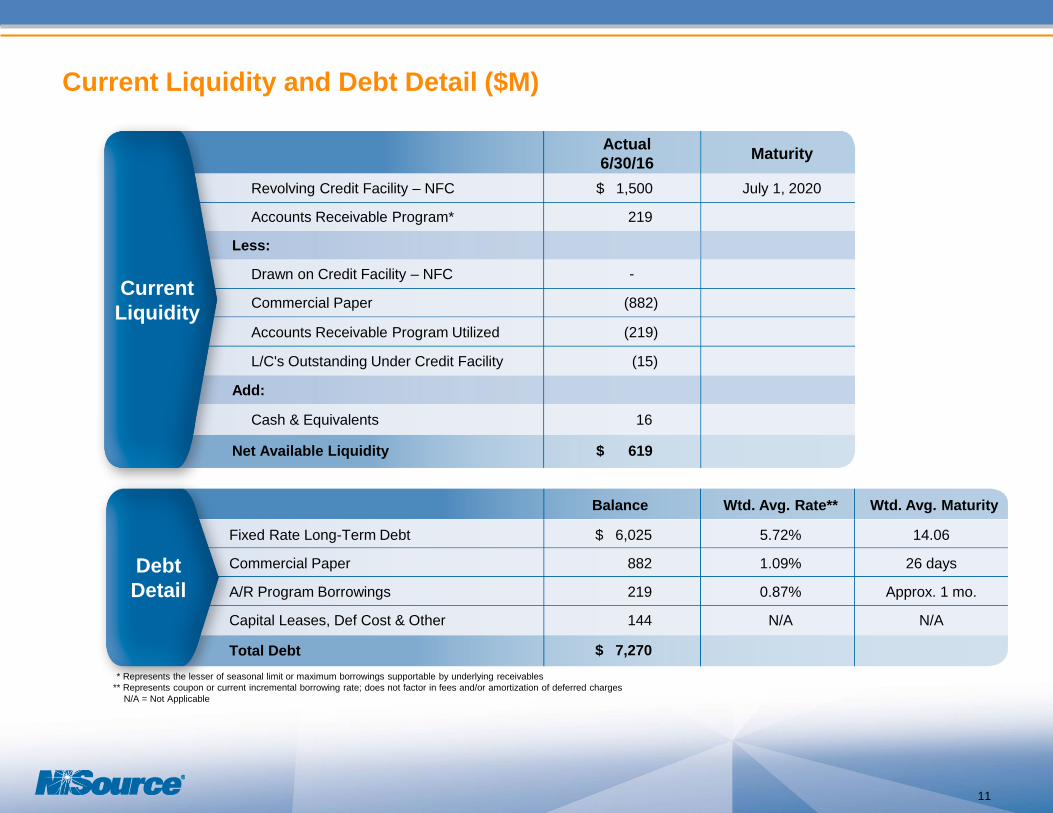
* Represents the lesser of seasonal limit or maximum borrowings supportable by underlying receivables
** Represents coupon or current incremental borrowing rate; does not factor in fees and/or amortization of deferred charges
N/A = Not Applicable
Actual
6/30/16Maturity
Revolving Credit Facility – NFC $ 1,500 July 1, 2020
Accounts Receivable Program* 219
Less:
Drawn on Credit Facility – NFC -
Commercial Paper (882)
Accounts Receivable Program Utilized (219)
L/C's Outstanding Under Credit Facility (15)
Add:
Cash & Equivalents 16
Net Available Liquidity $ 619
Current Liquidity and Debt Detail ($M)
Current
Liquidity
Debt
Detail
Balance Wtd. Avg. Rate** Wtd. Avg. Maturity
Fixed Rate Long-Term Debt $ 6,025 5.72% 14.06
Commercial Paper 882 1.09% 26 days
A/R Program Borrowings 219 0.87% Approx. 1 mo.
Capital Leases, Def Cost & Other 144 N/A N/A
Total Debt $ 7,270
11
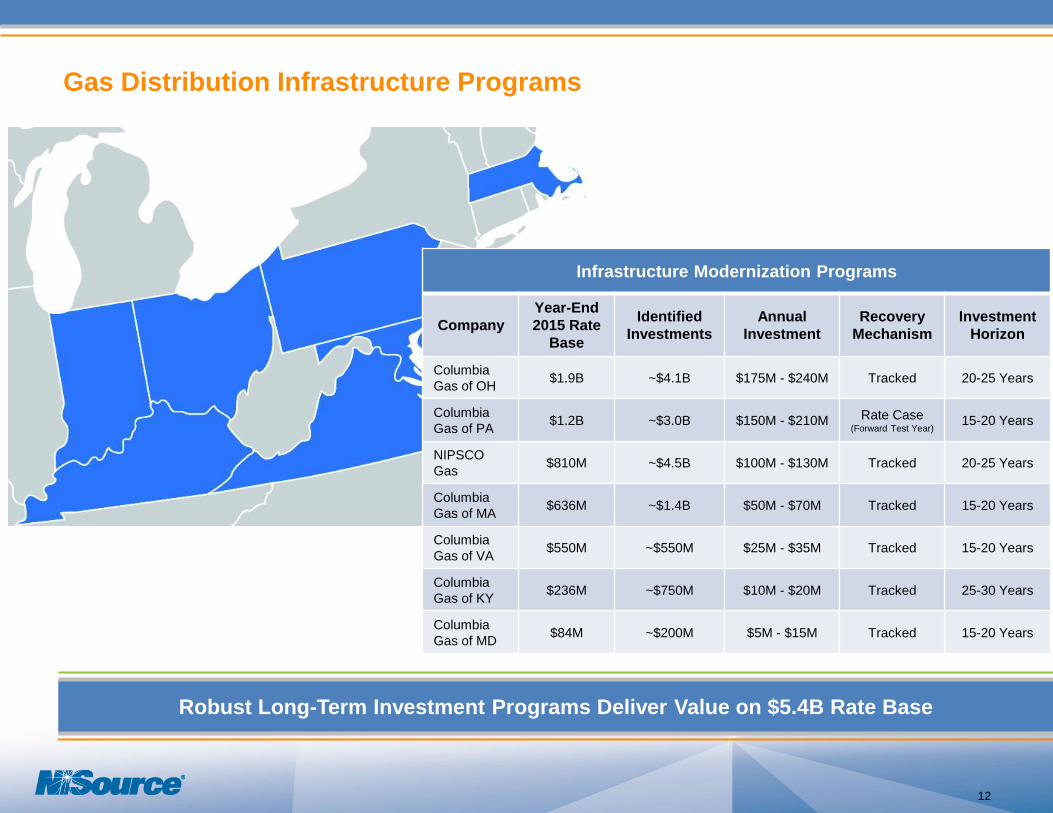
Gas Distribution Infrastructure Programs
Infrastructure Modernization Programs
Company
Year-End
2015 Rate
Base
Identified
Investments
Annual
Investment
Recovery
Mechanism
Investment
Horizon
Columbia
Gas of OH$1.9B ~$4.1B $175M - $240M Tracked 20-25 Years
Columbia
Gas of PA$1.2B ~$3.0B $150M - $210M Rate Case
(Forward Test Year)15-20 Years
NIPSCO
Gas$810M ~$4.5B $100M - $130M Tracked 20-25 Years
Columbia
Gas of MA$636M ~$1.4B $50M - $70M Tracked 15-20 Years
Columbia
Gas of VA$550M ~$550M $25M - $35M Tracked 15-20 Years
Columbia
Gas of KY$236M ~$750M $10M - $20M Tracked 25-30 Years
Columbia
Gas of MD$84M ~$200M $5M - $15M Tracked 15-20 Years
Robust Long-Term Investment Programs Deliver Value on $5.4B Rate Base
12
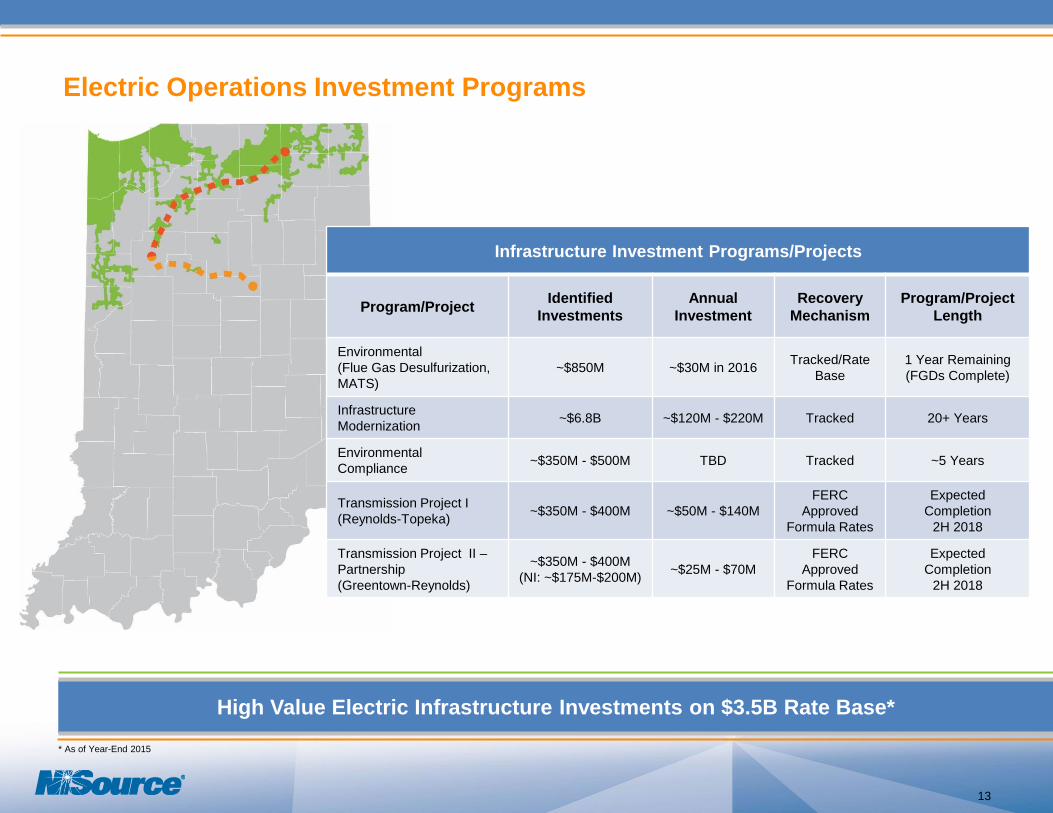
Electric Operations Investment Programs
Infrastructure Investment Programs/Projects
Program/ProjectIdentified
Investments
Annual
Investment
Recovery
Mechanism
Program/Project
Length
Environmental
(Flue Gas Desulfurization,
MATS)
~$850M ~$30M in 2016Tracked/Rate
Base
1 Year Remaining
(FGDs Complete)
Infrastructure
Modernization~$6.8B ~$120M - $220M Tracked 20+ Years
Environmental
Compliance~$350M - $500M TBD Tracked ~5 Years
Transmission Project I
(Reynolds-Topeka)~$350M - $400M ~$50M - $140M
FERC
Approved
Formula Rates
Expected
Completion
2H 2018
Transmission Project II –
Partnership
(Greentown-Reynolds)
~$350M - $400M
(NI: ~$175M-$200M)~$25M - $70M
FERC
Approved
Formula Rates
Expected
Completion
2H 2018
High Value Electric Infrastructure Investments on $3.5B Rate Base*
13
* As of Year-End 2015
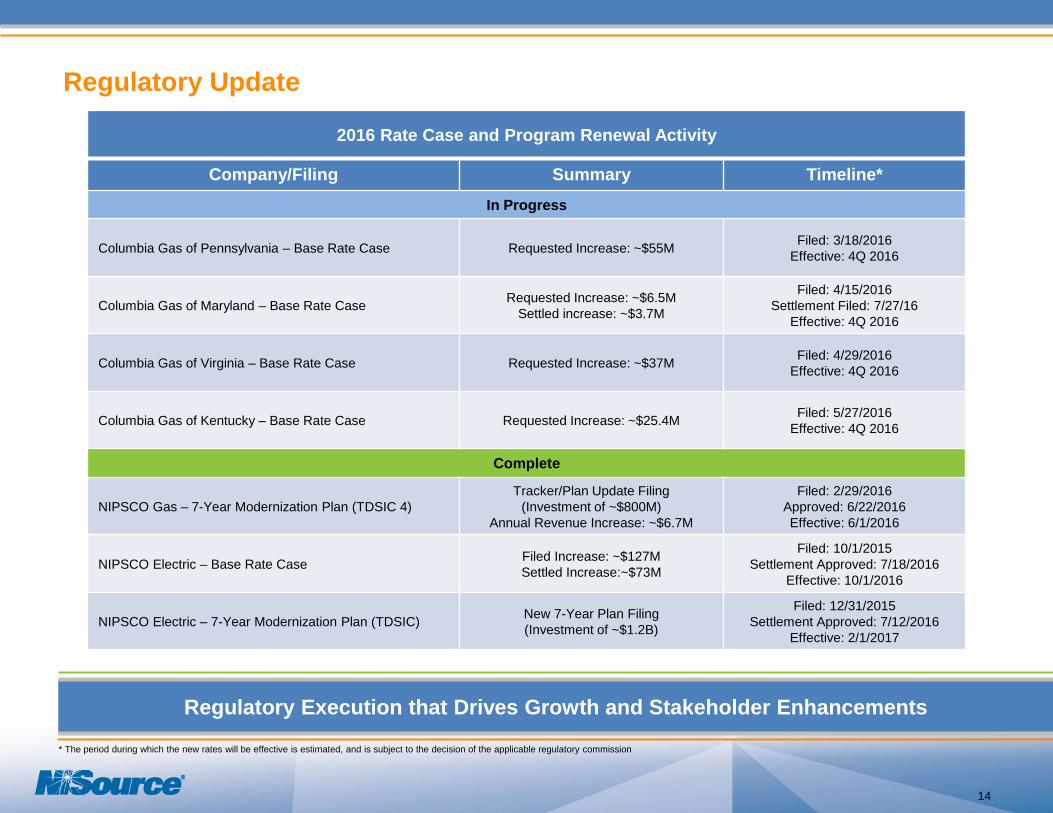
Regulatory Update
2016 Rate Case and Program Renewal Activity
Company/Filing Summary Timeline*
In Progress
Columbia Gas of Pennsylvania – Base Rate Case Requested Increase: ~$55MFiled: 3/18/2016
Effective: 4Q 2016
Columbia Gas of Maryland – Base Rate CaseRequested Increase: ~$6.5M
Settled increase: ~$3.7M
Filed: 4/15/2016
Settlement Filed: 7/27/16
Effective: 4Q 2016
Columbia Gas of Virginia – Base Rate Case Requested Increase: ~$37MFiled: 4/29/2016
Effective: 4Q 2016
Columbia Gas of Kentucky – Base Rate Case Requested Increase: ~$25.4MFiled: 5/27/2016
Effective: 4Q 2016
Complete
NIPSCO Gas – 7-Year Modernization Plan (TDSIC 4)
Tracker/Plan Update Filing
(Investment of ~$800M)
Annual Revenue Increase: ~$6.7M
Filed: 2/29/2016
Approved: 6/22/2016
Effective: 6/1/2016
NIPSCO Electric – Base Rate CaseFiled Increase: ~$127M
Settled Increase:~$73M
Filed: 10/1/2015
Settlement Approved: 7/18/2016
Effective: 10/1/2016
NIPSCO Electric – 7-Year Modernization Plan (TDSIC)New 7-Year Plan Filing
(Investment of ~$1.2B)
Filed: 12/31/2015
Settlement Approved: 7/12/2016
Effective: 2/1/2017
14
* The period during which the new rates will be effective is estimated, and is subject to the decision of the applicable regulatory commission
Regulatory Execution that Drives Growth and Stakeholder Enhancements
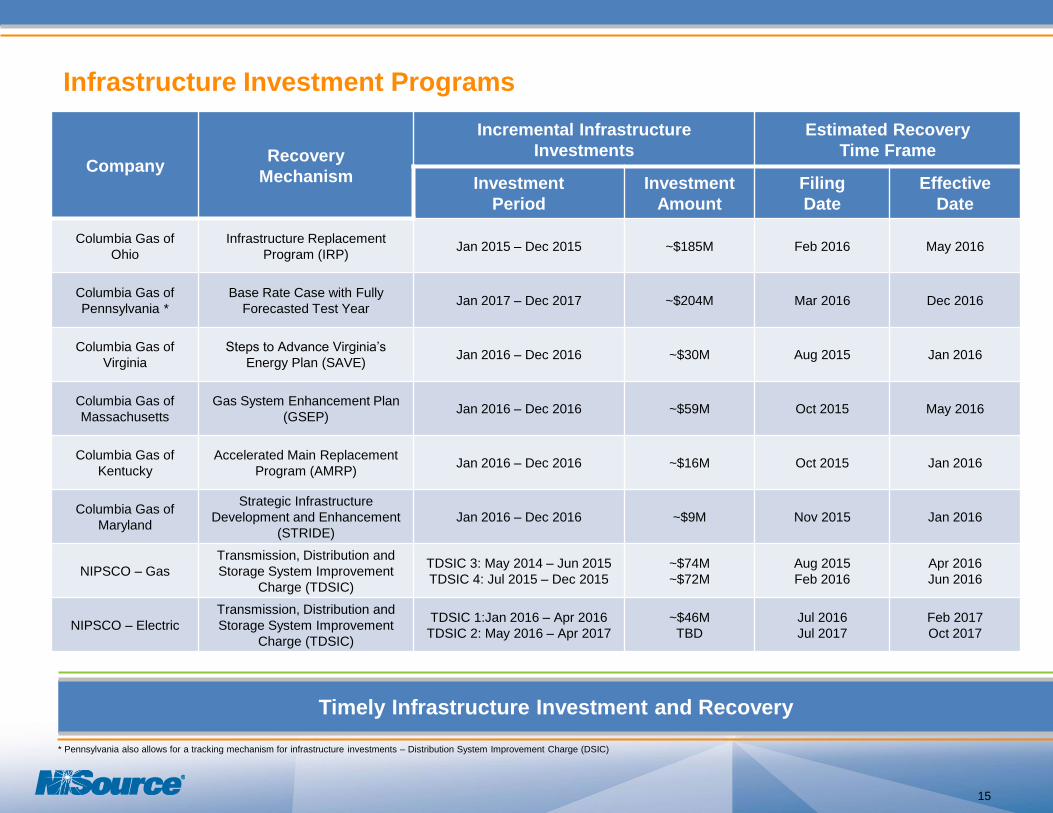
CompanyRecovery
Mechanism
Incremental Infrastructure
Investments
Estimated Recovery
Time Frame
Investment
Period
Investment
Amount
Filing
Date
Effective
Date
Columbia Gas of
Ohio
Infrastructure Replacement
Program (IRP)Jan 2015 – Dec 2015 ~$185M Feb 2016 May 2016
Columbia Gas of
Pennsylvania *
Base Rate Case with Fully
Forecasted Test YearJan 2017 – Dec 2017 ~$204M Mar 2016 Dec 2016
Columbia Gas of
Virginia
Steps to Advance Virginia’s
Energy Plan (SAVE)Jan 2016 – Dec 2016 ~$30M Aug 2015 Jan 2016
Columbia Gas of
Massachusetts
Gas System Enhancement Plan
(GSEP)Jan 2016 – Dec 2016 ~$59M Oct 2015 May 2016
Columbia Gas of
Kentucky
Accelerated Main Replacement
Program (AMRP)Jan 2016 – Dec 2016 ~$16M Oct 2015 Jan 2016
Columbia Gas of
Maryland
Strategic Infrastructure
Development and Enhancement
(STRIDE)
Jan 2016 – Dec 2016 ~$9M Nov 2015 Jan 2016
NIPSCO – Gas
Transmission, Distribution and
Storage System Improvement
Charge (TDSIC)
TDSIC 3: May 2014 – Jun 2015
TDSIC 4: Jul 2015 – Dec 2015
~$74M
~$72M
Aug 2015
Feb 2016
Apr 2016
Jun 2016
NIPSCO – Electric
Transmission, Distribution and
Storage System Improvement
Charge (TDSIC)
TDSIC 1:Jan 2016 – Apr 2016
TDSIC 2: May 2016 – Apr 2017
~$46M
TBD
Jul 2016
Jul 2017
Feb 2017
Oct 2017
Infrastructure Investment Programs
15
* Pennsylvania also allows for a tracking mechanism for infrastructure investments – Distribution System Improvement Charge (DSIC)
Timely Infrastructure Investment and Recovery