nisource statistical summary book 2004
TRANSCRIPT
page 1
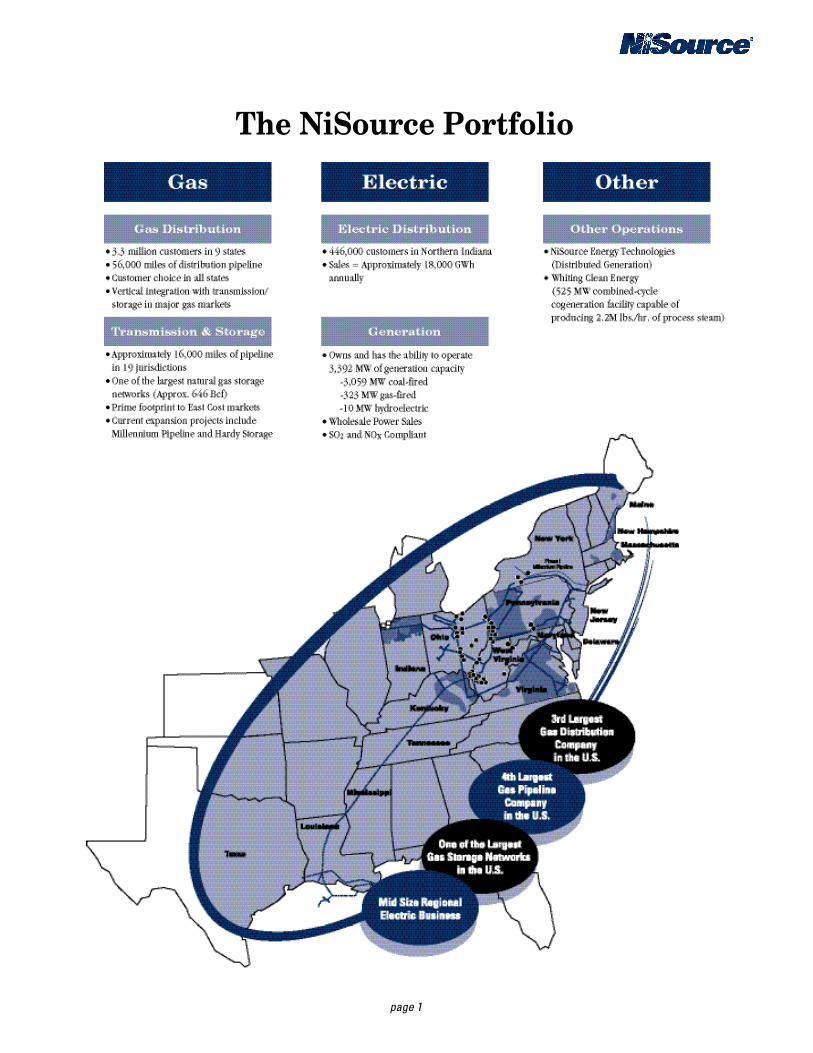
The NiSource Portfolio
NiSource Inc.NiSource Inc. (NiSource) is an energy holding company whose subsidiaries provide natural gas, electricity andother products and services to approximately 3.7 million customers located within a corridor that runs from theGulf Coast through the Midwest to New England. NiSource’s primary business segments are: Gas DistributionOperations; Gas Transmission and Storage Operations; Electric Operations; and Other Operations.
Gas Distribution OperationsNiSource’s natural gas distribution operations serve more than 3.3 million customers in 9 states and operate over56,000 miles of pipeline. Through its wholly owned subsidiary, Columbia, NiSource owns five distribution subsidiariesthat provide natural gas to approximately 2.2 million residential, commercial and industrial customers in Ohio,Pennsylvania, Virginia, Kentucky and Maryland. NiSource also distributes natural gas to approximately 784,000customers in northern Indiana through three subsidiaries: Northern Indiana Public Service Company (NorthernIndiana), Kokomo Gas and Fuel Company and Northern Indiana Fuel and Light Company, Inc. Additionally, NiSource’ssubsidiaries Bay State and Northern Utilities, Inc. distribute natural gas to more than 335,000 customers inMassachusetts, Maine and New Hampshire.
Gas Transmission and Storage OperationsNiSource’s Gas Transmission and Storage Operations subsidiaries own and operate approximately 16,000 miles ofinterstate pipelines and operate one of the nation’s largest underground natural gas storage systems capable of storingapproximately 646 billion cubic feet (Bcf) of natural gas. Through its subsidiaries, Columbia Gas TransmissionCorporation (Columbia Transmission), Columbia Gulf Transmission Company (Columbia Gulf), Crossroads PipelineCompany and Granite State Gas Transmission, Inc. (Granite State), NiSource owns and operates an interstate pipelinenetwork extending from offshore in the Gulf of Mexico to near Lake Erie, New York and the eastern seaboard. Together,these companies serve customers in 19 northeastern, mid-Atlantic, midwestern and southern states and the District ofColumbia. The Gas Transmission and Storage Operations subsidiaries are engaged in several projects that will expandtheir facilities and throughput. The largest such project is the proposed Millennium Pipeline. The Millennium Pipeline isa project proposed by a partnership of energy companies including Columbia Transmission, which would replace partsof an existing Columbia Transmission pipeline. Another project is Hardy Storage, a Columbia Transmission partnershipto develop a storage field in West Virginia to provide additional natural gas storage for the eastern United States.
Electric OperationsNiSource generates and distributes electricity through its subsidiary Northern Indiana to approximately 446,000 customersin 21 counties in the northern part of Indiana. Northern Indiana owns and has the ability to operate four coal-fired electricgenerating stations with a net capability of 3,059 megawatts (mw), six gas-fired generating units with a net capability of323 mw and two hydroelectric generating plants with a net capability of 10 mw. These facilities provide for a total systemnet capability of 3,392 mw.
Other OperationsThe Other Operations segment participates in energy-related services including gas marketing, power trading andventures focused on distributed power generation technologies, including a cogeneration facility, fuel cells and storagesystems. NiSource subsidiary PEI Holdings, Inc., operates the Whiting Clean Energy project, which is a 525 mwcogeneration facility that uses natural gas to produce electricity for sale in the wholesale markets and also providessteam for industrial use.
page 2
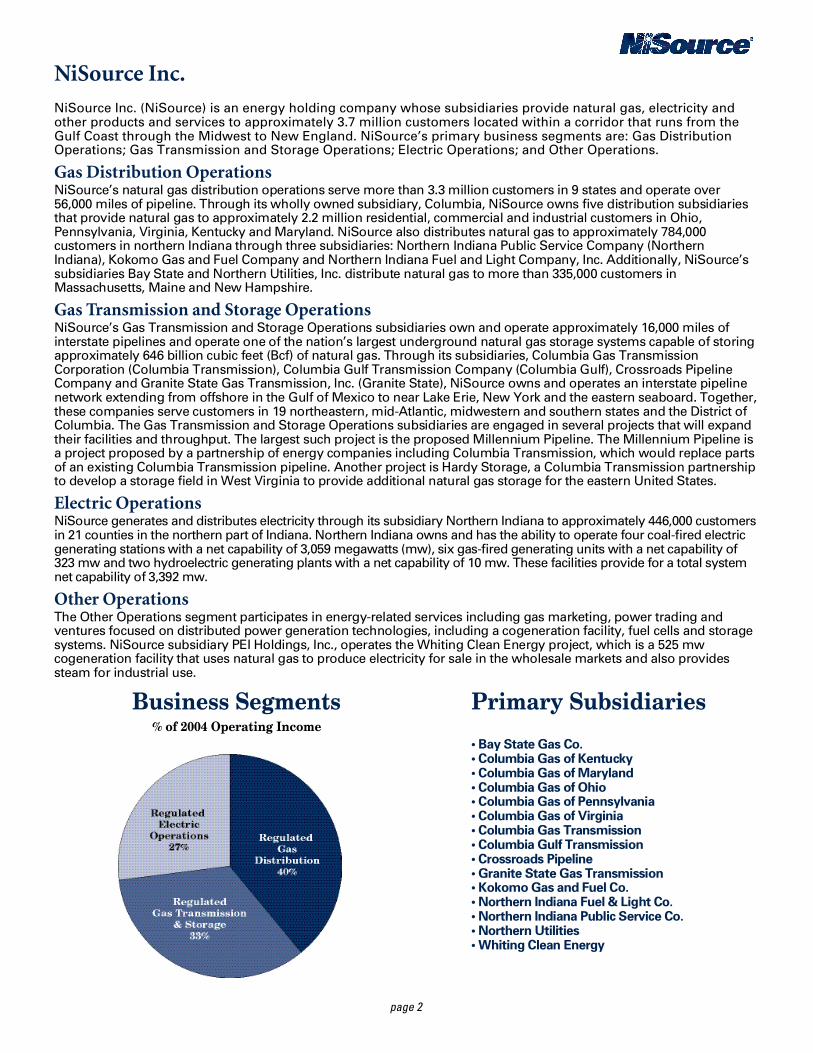
Business Segments% of 2004 Operating Income
• Bay State Gas Co.• Columbia Gas of Kentucky• Columbia Gas of Maryland• Columbia Gas of Ohio• Columbia Gas of Pennsylvania• Columbia Gas of Virginia• Columbia Gas Transmission• Columbia Gulf Transmission• Crossroads Pipeline• Granite State Gas Transmission• Kokomo Gas and Fuel Co.• Northern Indiana Fuel & Light Co.• Northern Indiana Public Service Co.• Northern Utilities• Whiting Clean Energy
Primary Subsidiaries
Contents
page 3
F I N A N C I A L
Consolidated Financial Data and Ratios .......................................................................................................4Statements of Consolidated Income .............................................................................................................5Consolidated Balance Sheets ........................................................................................................................6Statements of Consolidated Cash Flows ......................................................................................................8Statements of Consolidated Capitalization ..................................................................................................9Statements of Consolidated Long-Term Debt ............................................................................................10Income Taxes ..................................................................................................................................................11Statements of Consolidated Common Stockholders’ Equity and Comprehensive Income................12Current Security and Bond Ratings.............................................................................................................14
S T O C K H O L D E R S
Common Stockholders — State...................................................................................................................15Common Stockholders...................................................................................................................................15
BUSINESS SEGMENTS
Gas Distribution Statistics.............................................................................................................................16Gas Distribution Customers and Throughput Statistics by State .......................................................17
Gas Transmission and Storage Operations................................................................................................18Electric Operations.........................................................................................................................................19
Electric Generation and Production Statistics ......................................................................................20Fuel for Electric Generation ......................................................................................................................21Capacity and Operating Margins .............................................................................................................22
Glossary of Selected Energy Terms.............................................................................................................23Board of Directors and NiSource Officers.................................................................................................24Shareholder Information/Contacts ..............................................................................................back cover
page 4
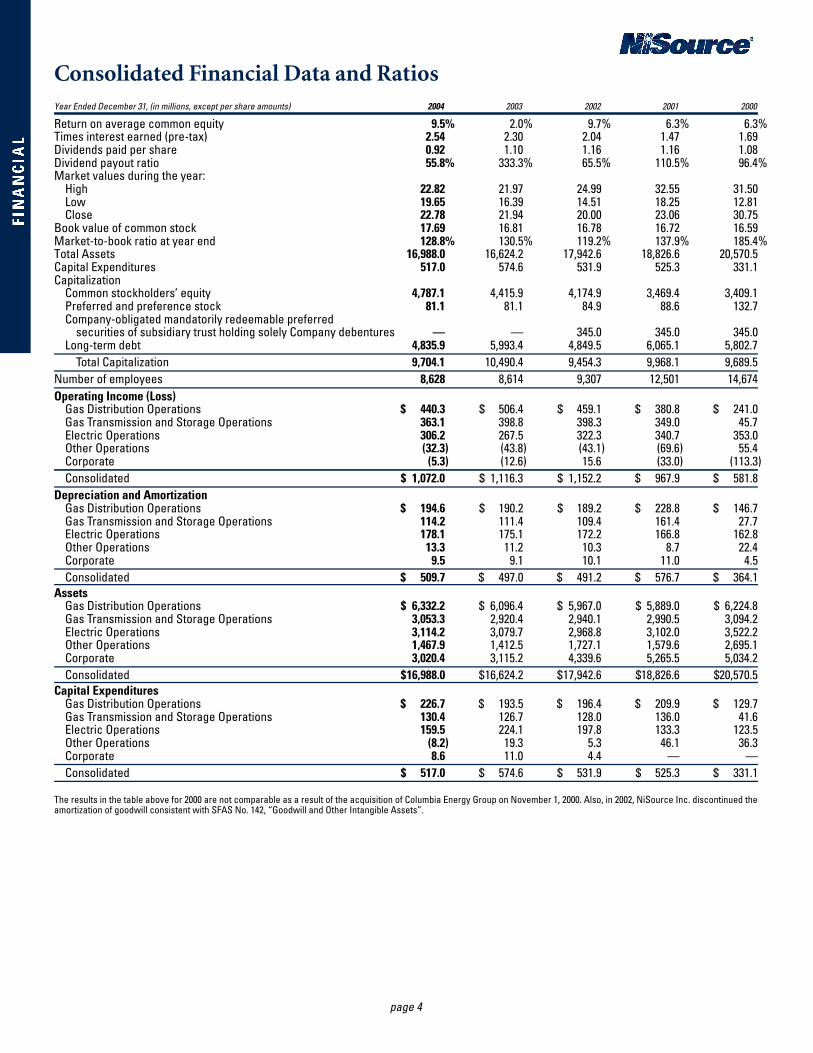
Consolidated Financial Data and RatiosYear Ended December 31, (in millions, except per share amounts) 2004 2003 2002 2001 2000
Return on average common equity 9.5% 2.0% 9.7% 6.3% 6.3%Times interest earned (pre-tax) 2.54 2.30 2.04 1.47 1.69Dividends paid per share 0.92 1.10 1.16 1.16 1.08Dividend payout ratio 55.8% 333.3% 65.5% 110.5% 96.4%Market values during the year:
High 22.82 21.97 24.99 32.55 31.50Low 19.65 16.39 14.51 18.25 12.81Close 22.78 21.94 20.00 23.06 30.75
Book value of common stock 17.69 16.81 16.78 16.72 16.59Market-to-book ratio at year end 128.8% 130.5% 119.2% 137.9% 185.4%Total Assets 16,988.0 16,624.2 17,942.6 18,826.6 20,570.5Capital Expenditures 517.0 574.6 531.9 525.3 331.1Capitalization
Common stockholders’ equity 4,787.1 4,415.9 4,174.9 3,469.4 3,409.1Preferred and preference stock 81.1 81.1 84.9 88.6 132.7Company-obligated mandatorily redeemable preferred
securities of subsidiary trust holding solely Company debentures — — 345.0 345.0 345.0Long-term debt 4,835.9 5,993.4 4,849.5 6,065.1 5,802.7
Total Capitalization 9,704.1 10,490.4 9,454.3 9,968.1 9,689.5Number of employees 8,628 8,614 9,307 12,501 14,674Operating Income (Loss)
Gas Distribution Operations $ 440.3 $ 506.4 $ 459.1 $ 380.8 $ 241.0Gas Transmission and Storage Operations 363.1 398.8 398.3 349.0 45.7Electric Operations 306.2 267.5 322.3 340.7 353.0Other Operations (32.3) (43.8) (43.1) (69.6) 55.4Corporate (5.3) (12.6) 15.6 (33.0) (113.3)Consolidated $ 1,072.0 $ 1,116.3 $ 1,152.2 $ 967.9 $ 581.8
Depreciation and AmortizationGas Distribution Operations $ 194.6 $ 190.2 $ 189.2 $ 228.8 $ 146.7Gas Transmission and Storage Operations 114.2 111.4 109.4 161.4 27.7Electric Operations 178.1 175.1 172.2 166.8 162.8Other Operations 13.3 11.2 10.3 8.7 22.4Corporate 9.5 9.1 10.1 11.0 4.5Consolidated $ 509.7 $ 497.0 $ 491.2 $ 576.7 $ 364.1
AssetsGas Distribution Operations $ 6,332.2 $ 6,096.4 $ 5,967.0 $ 5,889.0 $ 6,224.8Gas Transmission and Storage Operations 3,053.3 2,920.4 2,940.1 2,990.5 3,094.2Electric Operations 3,114.2 3,079.7 2,968.8 3,102.0 3,522.2Other Operations 1,467.9 1,412.5 1,727.1 1,579.6 2,695.1Corporate 3,020.4 3,115.2 4,339.6 5,265.5 5,034.2Consolidated $16,988.0 $16,624.2 $17,942.6 $18,826.6 $20,570.5
Capital ExpendituresGas Distribution Operations $ 226.7 $ 193.5 $ 196.4 $ 209.9 $ 129.7Gas Transmission and Storage Operations 130.4 126.7 128.0 136.0 41.6Electric Operations 159.5 224.1 197.8 133.3 123.5Other Operations (8.2) 19.3 5.3 46.1 36.3Corporate 8.6 11.0 4.4 — —Consolidated $ 517.0 $ 574.6 $ 531.9 $ 525.3 $ 331.1
The results in the table above for 2000 are not comparable as a result of the acquisition of Columbia Energy Group on November 1, 2000. Also, in 2002, NiSource Inc. discontinued theamortization of goodwill consistent with SFAS No. 142, “Goodwill and Other Intangible Assets”.
page 5
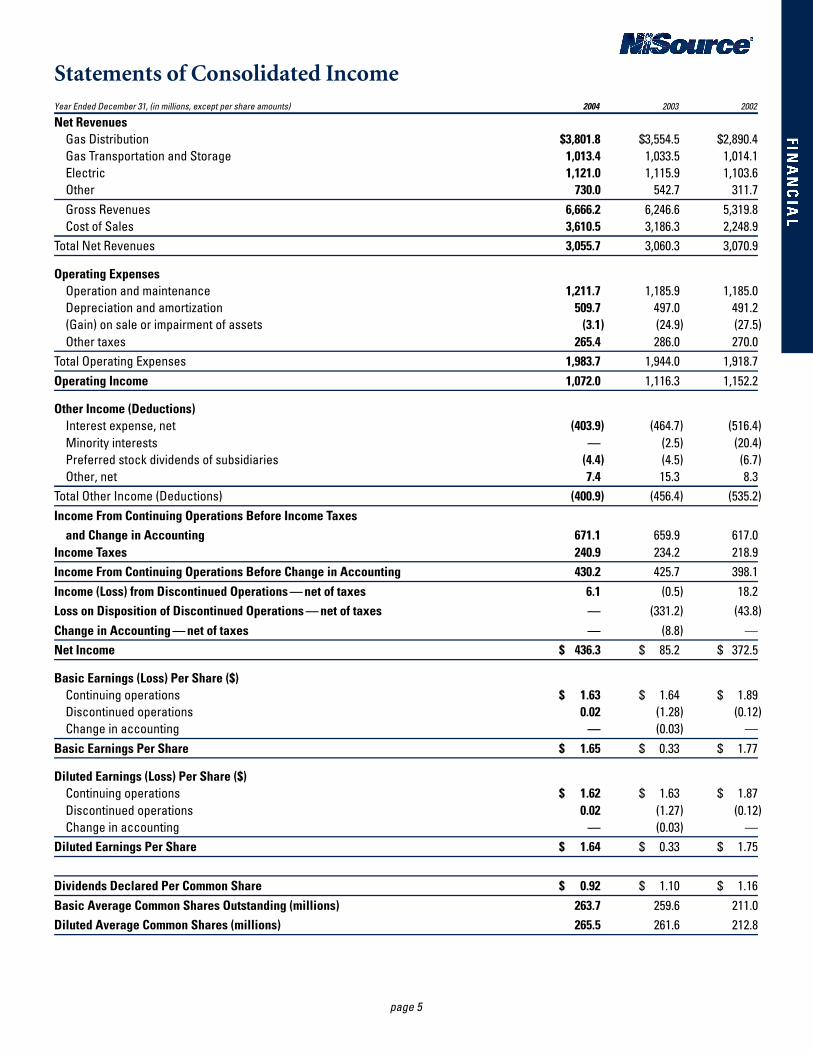
Statements of Consolidated IncomeYear Ended December 31, (in millions, except per share amounts) 2004 2003 2002
Net RevenuesGas Distribution $3,801.8 $3,554.5 $2,890.4Gas Transportation and Storage 1,013.4 1,033.5 1,014.1Electric 1,121.0 1,115.9 1,103.6 Other 730.0 542.7 311.7Gross Revenues 6,666.2 6,246.6 5,319.8Cost of Sales 3,610.5 3,186.3 2,248.9
Total Net Revenues 3,055.7 3,060.3 3,070.9
Operating ExpensesOperation and maintenance 1,211.7 1,185.9 1,185.0Depreciation and amortization 509.7 497.0 491.2(Gain) on sale or impairment of assets (3.1) (24.9) (27.5)Other taxes 265.4 286.0 270.0
Total Operating Expenses 1,983.7 1,944.0 1,918.7Operating Income 1,072.0 1,116.3 1,152.2
Other Income (Deductions)Interest expense, net (403.9) (464.7) (516.4)Minority interests — (2.5) (20.4)Preferred stock dividends of subsidiaries (4.4) (4.5) (6.7)Other, net 7.4 15.3 8.3
Total Other Income (Deductions) (400.9) (456.4) (535.2)Income From Continuing Operations Before Income Taxes
and Change in Accounting 671.1 659.9 617.0Income Taxes 240.9 234.2 218.9Income From Continuing Operations Before Change in Accounting 430.2 425.7 398.1Income (Loss) from Discontinued Operations — net of taxes 6.1 (0.5) 18.2Loss on Disposition of Discontinued Operations — net of taxes — (331.2) (43.8)Change in Accounting — net of taxes — (8.8) —Net Income $ 436.3 $ 85.2 $ 372.5
Basic Earnings (Loss) Per Share ($)Continuing operations $ 1.63 $ 1.64 $ 1.89Discontinued operations 0.02 (1.28) (0.12)Change in accounting — (0.03) —
Basic Earnings Per Share $ 1.65 $ 0.33 $ 1.77
Diluted Earnings (Loss) Per Share ($)Continuing operations $ 1.62 $ 1.63 $ 1.87Discontinued operations 0.02 (1.27) (0.12)Change in accounting — (0.03) —
Diluted Earnings Per Share $ 1.64 $ 0.33 $ 1.75
Dividends Declared Per Common Share $ 0.92 $ 1.10 $ 1.16Basic Average Common Shares Outstanding (millions) 263.7 259.6 211.0Diluted Average Common Shares (millions) 265.5 261.6 212.8
page 6
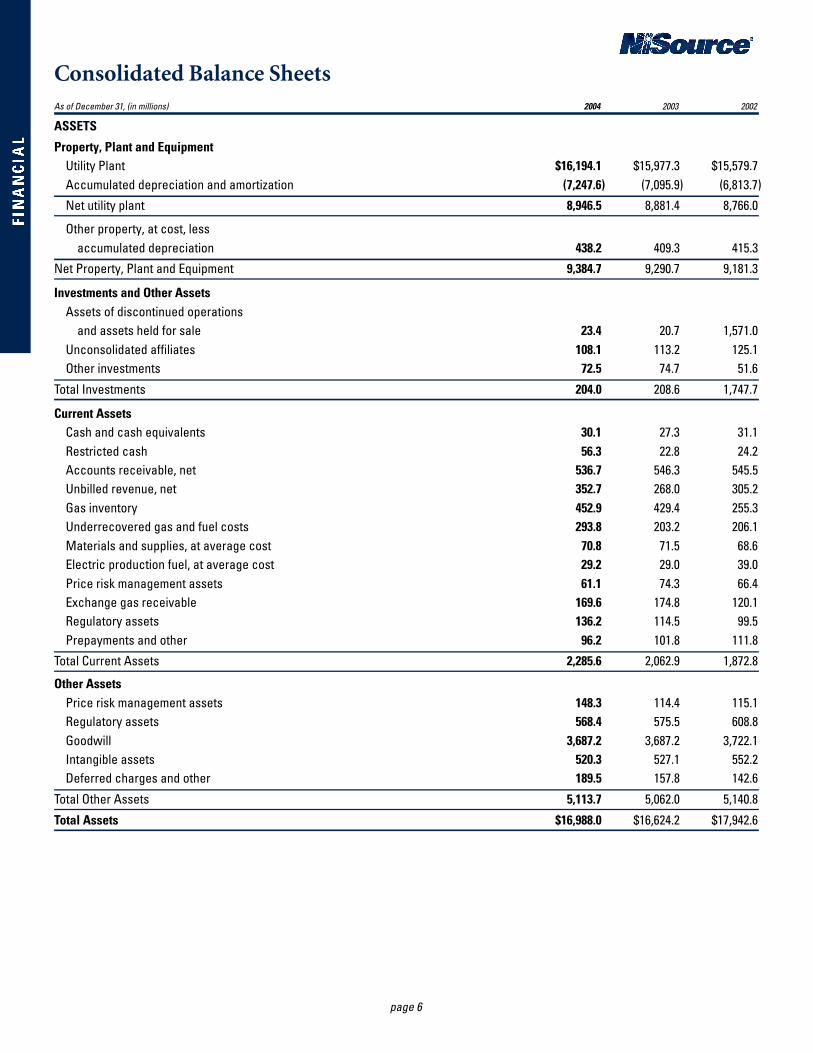
Consolidated Balance SheetsAs of December 31, (in millions) 2004 2003 2002
ASSETS
Property, Plant and EquipmentUtility Plant $16,194.1 $15,977.3 $15,579.7Accumulated depreciation and amortization (7,247.6) (7,095.9) (6,813.7)Net utility plant 8,946.5 8,881.4 8,766.0
Other property, at cost, less accumulated depreciation 438.2 409.3 415.3
Net Property, Plant and Equipment 9,384.7 9,290.7 9,181.3
Investments and Other AssetsAssets of discontinued operations
and assets held for sale 23.4 20.7 1,571.0Unconsolidated affiliates 108.1 113.2 125.1Other investments 72.5 74.7 51.6
Total Investments 204.0 208.6 1,747.7
Current AssetsCash and cash equivalents 30.1 27.3 31.1Restricted cash 56.3 22.8 24.2Accounts receivable, net 536.7 546.3 545.5Unbilled revenue, net 352.7 268.0 305.2Gas inventory 452.9 429.4 255.3Underrecovered gas and fuel costs 293.8 203.2 206.1Materials and supplies, at average cost 70.8 71.5 68.6Electric production fuel, at average cost 29.2 29.0 39.0Price risk management assets 61.1 74.3 66.4Exchange gas receivable 169.6 174.8 120.1Regulatory assets 136.2 114.5 99.5Prepayments and other 96.2 101.8 111.8
Total Current Assets 2,285.6 2,062.9 1,872.8
Other AssetsPrice risk management assets 148.3 114.4 115.1Regulatory assets 568.4 575.5 608.8Goodwill 3,687.2 3,687.2 3,722.1Intangible assets 520.3 527.1 552.2Deferred charges and other 189.5 157.8 142.6
Total Other Assets 5,113.7 5,062.0 5,140.8Total Assets $16,988.0 $16,624.2 $17,942.6
page 7
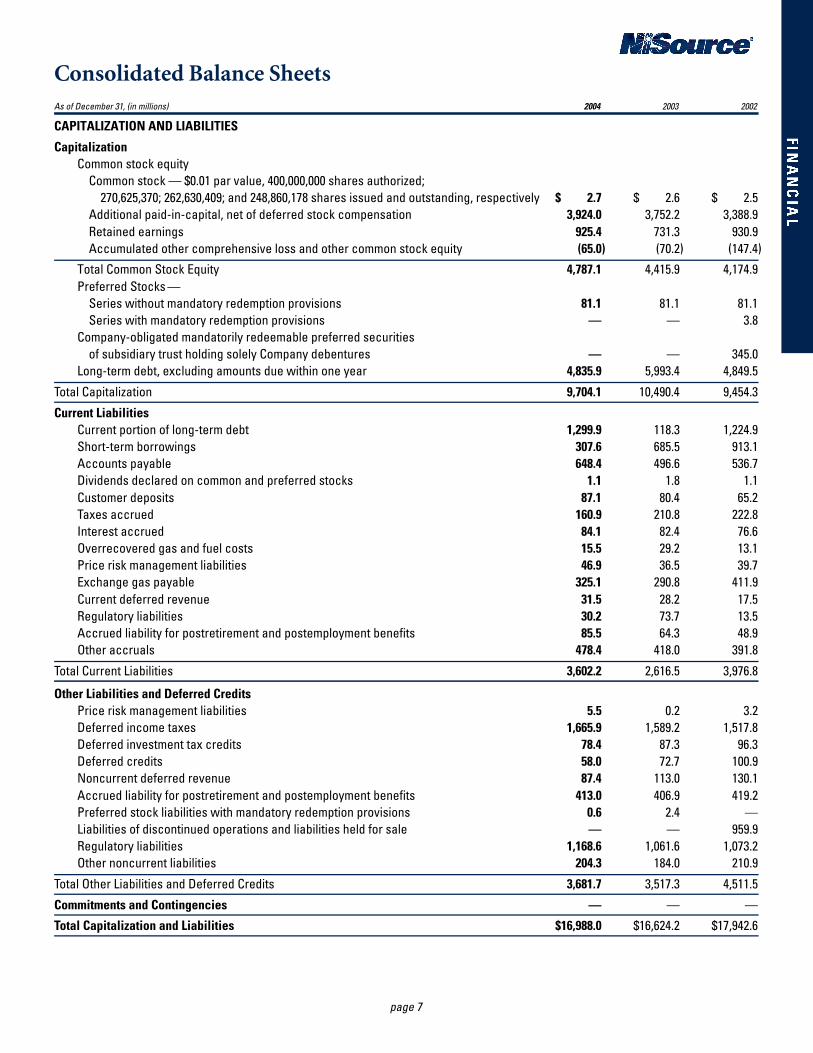
Consolidated Balance SheetsAs of December 31, (in millions) 2004 2003 2002
CAPITALIZATION AND LIABILITIES
CapitalizationCommon stock equity
Common stock — $0.01 par value, 400,000,000 shares authorized;270,625,370; 262,630,409; and 248,860,178 shares issued and outstanding, respectively $ 2.7 $ 2.6 $ 2.5
Additional paid-in-capital, net of deferred stock compensation 3,924.0 3,752.2 3,388.9Retained earnings 925.4 731.3 930.9Accumulated other comprehensive loss and other common stock equity (65.0) (70.2) (147.4)
Total Common Stock Equity 4,787.1 4,415.9 4,174.9Preferred Stocks —
Series without mandatory redemption provisions 81.1 81.1 81.1Series with mandatory redemption provisions — — 3.8
Company-obligated mandatorily redeemable preferred securitiesof subsidiary trust holding solely Company debentures — — 345.0
Long-term debt, excluding amounts due within one year 4,835.9 5,993.4 4,849.5Total Capitalization 9,704.1 10,490.4 9,454.3Current Liabilities
Current portion of long-term debt 1,299.9 118.3 1,224.9Short-term borrowings 307.6 685.5 913.1Accounts payable 648.4 496.6 536.7Dividends declared on common and preferred stocks 1.1 1.8 1.1Customer deposits 87.1 80.4 65.2Taxes accrued 160.9 210.8 222.8Interest accrued 84.1 82.4 76.6Overrecovered gas and fuel costs 15.5 29.2 13.1Price risk management liabilities 46.9 36.5 39.7Exchange gas payable 325.1 290.8 411.9Current deferred revenue 31.5 28.2 17.5Regulatory liabilities 30.2 73.7 13.5Accrued liability for postretirement and postemployment benefits 85.5 64.3 48.9Other accruals 478.4 418.0 391.8
Total Current Liabilities 3,602.2 2,616.5 3,976.8
Other Liabilities and Deferred CreditsPrice risk management liabilities 5.5 0.2 3.2Deferred income taxes 1,665.9 1,589.2 1,517.8Deferred investment tax credits 78.4 87.3 96.3Deferred credits 58.0 72.7 100.9Noncurrent deferred revenue 87.4 113.0 130.1Accrued liability for postretirement and postemployment benefits 413.0 406.9 419.2Preferred stock liabilities with mandatory redemption provisions 0.6 2.4 —Liabilities of discontinued operations and liabilities held for sale — — 959.9Regulatory liabilities 1,168.6 1,061.6 1,073.2Other noncurrent liabilities 204.3 184.0 210.9
Total Other Liabilities and Deferred Credits 3,681.7 3,517.3 4,511.5Commitments and Contingencies — — —Total Capitalization and Liabilities $16,988.0 $16,624.2 $17,942.6
page 8
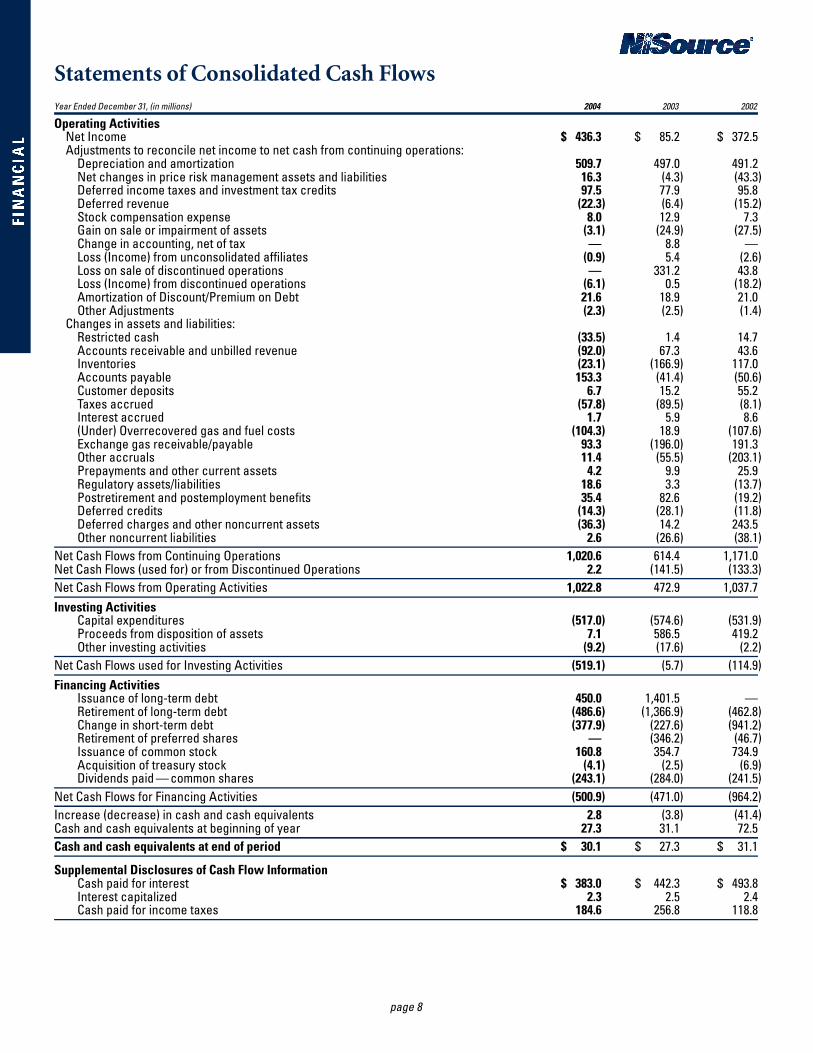
Statements of Consolidated Cash FlowsYear Ended December 31, (in millions) 2004 2003 2002
Operating ActivitiesNet Income $ 436.3 $ 85.2 $ 372.5Adjustments to reconcile net income to net cash from continuing operations:
Depreciation and amortization 509.7 497.0 491.2Net changes in price risk management assets and liabilities 16.3 (4.3) (43.3)Deferred income taxes and investment tax credits 97.5 77.9 95.8Deferred revenue (22.3) (6.4) (15.2)Stock compensation expense 8.0 12.9 7.3Gain on sale or impairment of assets (3.1) (24.9) (27.5)Change in accounting, net of tax — 8.8 —Loss (Income) from unconsolidated affiliates (0.9) 5.4 (2.6)Loss on sale of discontinued operations — 331.2 43.8Loss (Income) from discontinued operations (6.1) 0.5 (18.2)Amortization of Discount/Premium on Debt 21.6 18.9 21.0Other Adjustments (2.3) (2.5) (1.4)
Changes in assets and liabilities:Restricted cash (33.5) 1.4 14.7Accounts receivable and unbilled revenue (92.0) 67.3 43.6Inventories (23.1) (166.9) 117.0Accounts payable 153.3 (41.4) (50.6)Customer deposits 6.7 15.2 55.2Taxes accrued (57.8) (89.5) (8.1)Interest accrued 1.7 5.9 8.6(Under) Overrecovered gas and fuel costs (104.3) 18.9 (107.6)Exchange gas receivable/payable 93.3 (196.0) 191.3Other accruals 11.4 (55.5) (203.1)Prepayments and other current assets 4.2 9.9 25.9Regulatory assets/liabilities 18.6 3.3 (13.7)Postretirement and postemployment benefits 35.4 82.6 (19.2)Deferred credits (14.3) (28.1) (11.8)Deferred charges and other noncurrent assets (36.3) 14.2 243.5Other noncurrent liabilities 2.6 (26.6) (38.1)
Net Cash Flows from Continuing Operations 1,020.6 614.4 1,171.0Net Cash Flows (used for) or from Discontinued Operations 2.2 (141.5) (133.3)Net Cash Flows from Operating Activities 1,022.8 472.9 1,037.7Investing Activities
Capital expenditures (517.0) (574.6) (531.9)Proceeds from disposition of assets 7.1 586.5 419.2Other investing activities (9.2) (17.6) (2.2)
Net Cash Flows used for Investing Activities (519.1) (5.7) (114.9)Financing Activities
Issuance of long-term debt 450.0 1,401.5 —Retirement of long-term debt (486.6) (1,366.9) (462.8)Change in short-term debt (377.9) (227.6) (941.2)Retirement of preferred shares — (346.2) (46.7)Issuance of common stock 160.8 354.7 734.9Acquisition of treasury stock (4.1) (2.5) (6.9)Dividends paid — common shares (243.1) (284.0) (241.5)
Net Cash Flows for Financing Activities (500.9) (471.0) (964.2)Increase (decrease) in cash and cash equivalents 2.8 (3.8) (41.4)Cash and cash equivalents at beginning of year 27.3 31.1 72.5Cash and cash equivalents at end of period $ 30.1 $ 27.3 $ 31.1
Supplemental Disclosures of Cash Flow InformationCash paid for interest $ 383.0 $ 442.3 $ 493.8Interest capitalized 2.3 2.5 2.4Cash paid for income taxes 184.6 256.8 118.8
page 9
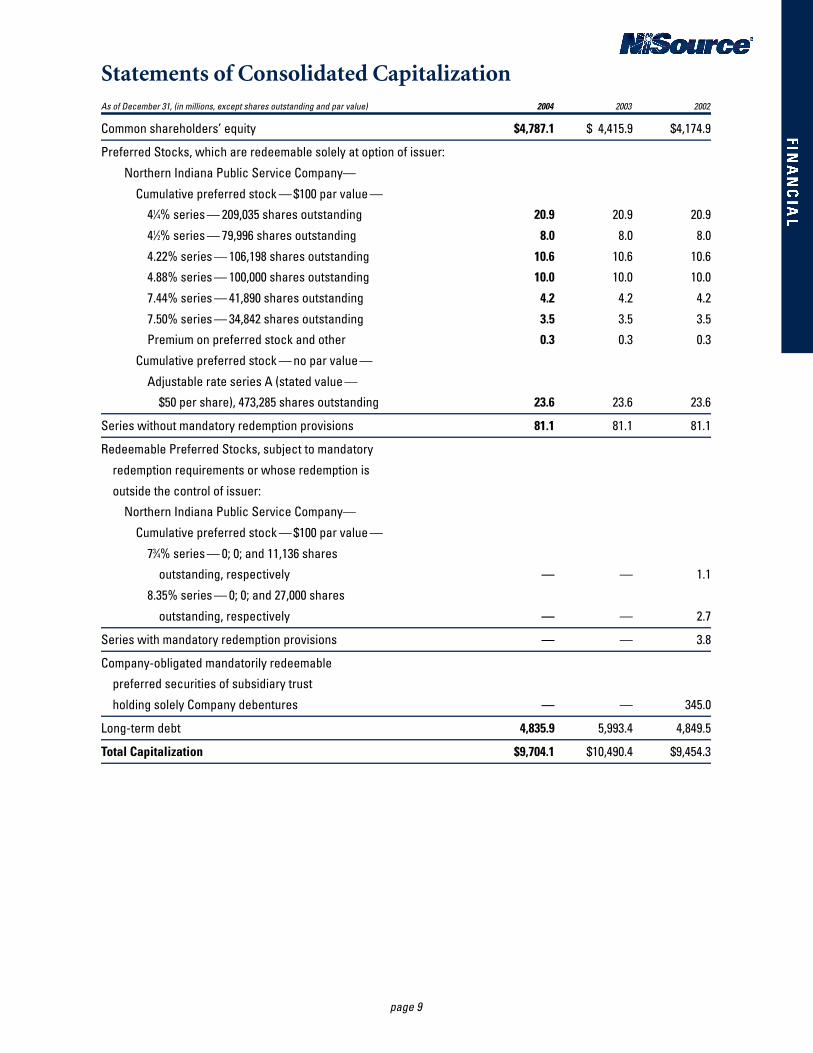
Statements of Consolidated CapitalizationAs of December 31, (in millions, except shares outstanding and par value) 2004 2003 2002
Common shareholders’ equity $4,787.1 $ 4,415.9 $4,174.9
Preferred Stocks, which are redeemable solely at option of issuer:Northern Indiana Public Service Company—
Cumulative preferred stock — $100 par value —41⁄4% series — 209,035 shares outstanding 20.9 20.9 20.941⁄2% series — 79,996 shares outstanding 8.0 8.0 8.04.22% series — 106,198 shares outstanding 10.6 10.6 10.64.88% series — 100,000 shares outstanding 10.0 10.0 10.07.44% series — 41,890 shares outstanding 4.2 4.2 4.27.50% series — 34,842 shares outstanding 3.5 3.5 3.5Premium on preferred stock and other 0.3 0.3 0.3
Cumulative preferred stock — no par value —Adjustable rate series A (stated value —
$50 per share), 473,285 shares outstanding 23.6 23.6 23.6
Series without mandatory redemption provisions 81.1 81.1 81.1
Redeemable Preferred Stocks, subject to mandatory redemption requirements or whose redemption is outside the control of issuer:
Northern Indiana Public Service Company—Cumulative preferred stock — $100 par value —
73⁄4% series — 0; 0; and 11,136 shares outstanding, respectively — — 1.1
8.35% series — 0; 0; and 27,000 shares outstanding, respectively — — 2.7
Series with mandatory redemption provisions — — 3.8
Company-obligated mandatorily redeemable preferred securities of subsidiary trust holding solely Company debentures — — 345.0
Long-term debt 4,835.9 5,993.4 4,849.5
Total Capitalization $9,704.1 $10,490.4 $9,454.3
page 10
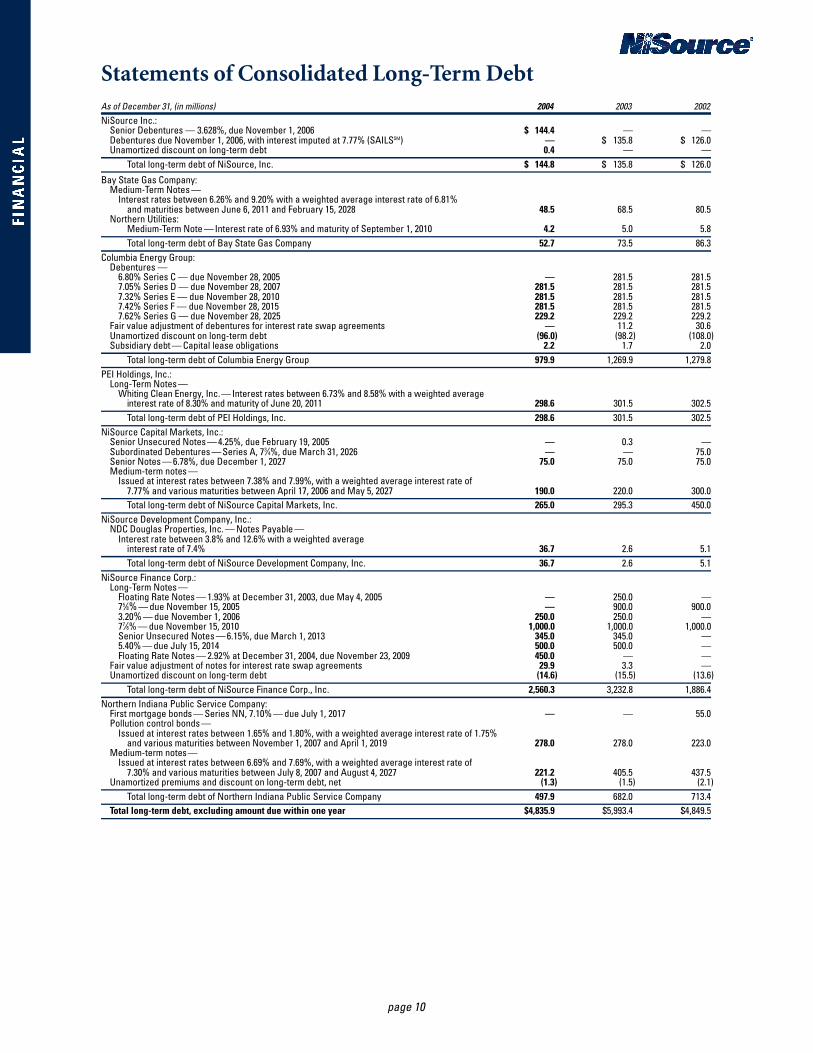
Statements of Consolidated Long-Term DebtAs of December 31, (in millions) 2004 2003 2002NiSource Inc.:
Senior Debentures — 3.628%, due November 1, 2006 $ 144.4 — —Debentures due November 1, 2006, with interest imputed at 7.77% (SAILSSM) — $ 135.8 $ 126.0Unamortized discount on long-term debt 0.4 — —
Total long-term debt of NiSource, Inc. $ 144.8 $ 135.8 $ 126.0Bay State Gas Company:
Medium-Term Notes —Interest rates between 6.26% and 9.20% with a weighted average interest rate of 6.81%
and maturities between June 6, 2011 and February 15, 2028 48.5 68.5 80.5Northern Utilities:
Medium-Term Note — Interest rate of 6.93% and maturity of September 1, 2010 4.2 5.0 5.8Total long-term debt of Bay State Gas Company 52.7 73.5 86.3
Columbia Energy Group:Debentures —
6.80% Series C — due November 28, 2005 — 281.5 281.57.05% Series D — due November 28, 2007 281.5 281.5 281.57.32% Series E — due November 28, 2010 281.5 281.5 281.57.42% Series F — due November 28, 2015 281.5 281.5 281.57.62% Series G — due November 28, 2025 229.2 229.2 229.2
Fair value adjustment of debentures for interest rate swap agreements — 11.2 30.6Unamortized discount on long-term debt (96.0) (98.2) (108.0)Subsidiary debt — Capital lease obligations 2.2 1.7 2.0
Total long-term debt of Columbia Energy Group 979.9 1,269.9 1,279.8PEI Holdings, Inc.:
Long-Term Notes —Whiting Clean Energy, Inc.— Interest rates between 6.73% and 8.58% with a weighted average
interest rate of 8.30% and maturity of June 20, 2011 298.6 3 0 1 . 5 302.5Total long-term debt of PEI Holdings, Inc. 298.6 301.5 302.5
NiSource Capital Markets, Inc.:Senior Unsecured Notes — 4.25%, due February 19, 2005 — 0.3 —Subordinated Debentures — Series A, 73⁄4%, due March 31, 2026 — — 75.0Senior Notes — 6.78%, due December 1, 2027 75.0 75.0 75.0Medium-term notes —
Issued at interest rates between 7.38% and 7.99%, with a weighted average interest rate of 7.77% and various maturities between April 17, 2006 and May 5, 2027 190.0 220.0 300.0Total long-term debt of NiSource Capital Markets, Inc. 265.0 295.3 450.0
NiSource Development Company, Inc.:NDC Douglas Properties, Inc. — Notes Payable —
Interest rate between 3.8% and 12.6% with a weighted average interest rate of 7.4% 36.7 2.6 5.1Total long-term debt of NiSource Development Company, Inc. 36.7 2.6 5.1
NiSource Finance Corp.:Long-Term Notes —
Floating Rate Notes — 1.93% at December 31, 2003, due May 4, 2005 — 250.0 —75⁄8% — due November 15, 2005 — 900.0 900.03.20% — due November 1, 2006 250.0 250.0 —77⁄8% — due November 15, 2010 1,000.0 1,000.0 1,000.0Senior Unsecured Notes — 6.15%, due March 1, 2013 345.0 345.0 —5.40% — due July 15, 2014 500.0 500.0 —Floating Rate Notes — 2.92% at December 31, 2004, due November 23, 2009 450.0 — —
Fair value adjustment of notes for interest rate swap agreements 29.9 3.3 —Unamortized discount on long-term debt (14.6) (15.5) (13.6)
Total long-term debt of NiSource Finance Corp., Inc. 2,560.3 3,232.8 1,886.4Northern Indiana Public Service Company:
First mortgage bonds — Series NN, 7.10% — due July 1, 2017 — — 55.0Pollution control bonds —
Issued at interest rates between 1.65% and 1.80%, with a weighted average interest rate of 1.75% and various maturities between November 1, 2007 and April 1, 2019 278.0 278.0 223.0
Medium-term notes—Issued at interest rates between 6.69% and 7.69%, with a weighted average interest rate of
7.30% and various maturities between July 8, 2007 and August 4, 2027 221.2 405.5 437.5Unamortized premiums and discount on long-term debt, net (1.3) (1.5) (2.1)
Total long-term debt of Northern Indiana Public Service Company 497.9 682.0 713.4Total long-term debt, excluding amount due within one year $4,835.9 $5,993.4 $4,849.5
page 11
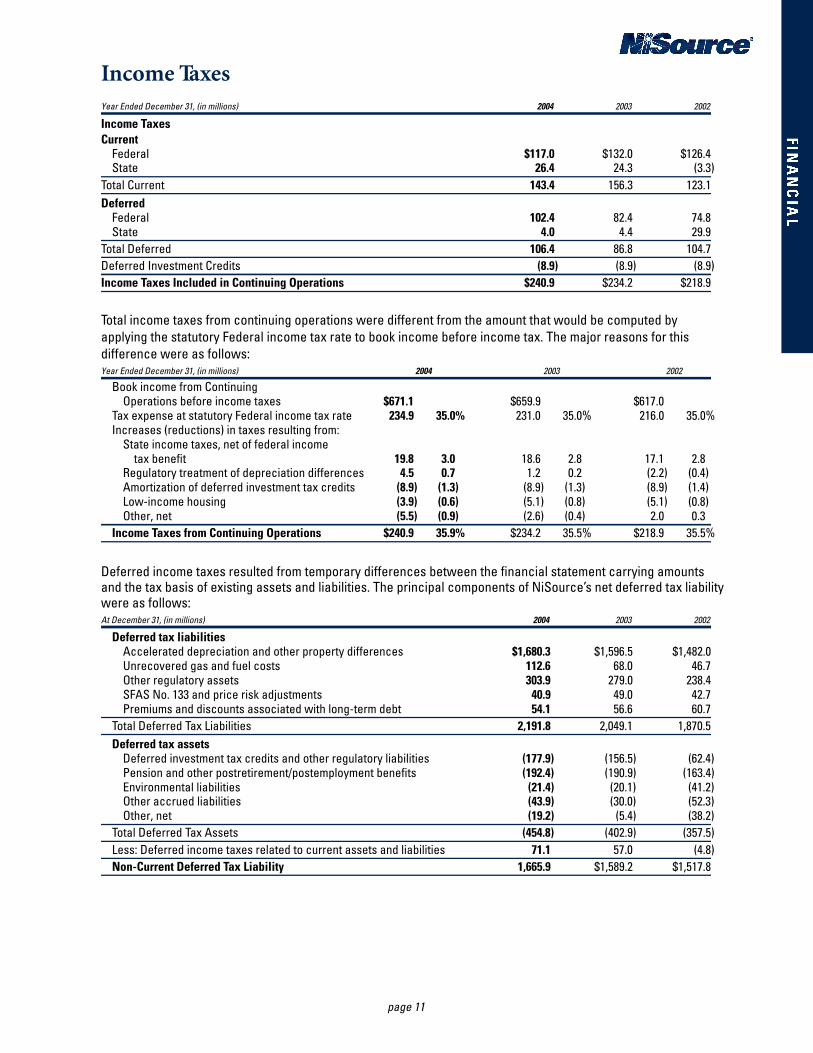
Income TaxesYear Ended December 31, (in millions) 2004 2003 2002
Income TaxesCurrent
Federal $117.0 $132.0 $126.4State 26.4 24.3 (3.3)
Total Current 143.4 156.3 123.1Deferred
Federal 102.4 82.4 74.8State 4.0 4.4 29.9
Total Deferred 106.4 86.8 104.7Deferred Investment Credits (8.9) (8.9) (8.9)Income Taxes Included in Continuing Operations $240.9 $234.2 $218.9
Total income taxes from continuing operations were different from the amount that would be computed byapplying the statutory Federal income tax rate to book income before income tax. The major reasons for thisdifference were as follows:Year Ended December 31, (in millions) 2004 2003 2002
Book income from Continuing Operations before income taxes $671.1 $659.9 $617.0
Tax expense at statutory Federal income tax rate 234.9 35.0% 231.0 35.0% 216.0 35.0%Increases (reductions) in taxes resulting from:
State income taxes, net of federal income tax benefit 19.8 3.0 18.6 2.8 17.1 2.8
Regulatory treatment of depreciation differences 4.5 0.7 1.2 0.2 (2.2) (0.4)Amortization of deferred investment tax credits (8.9) (1.3) (8.9) (1.3) (8.9) (1.4)Low-income housing (3.9) (0.6) (5.1) (0.8) (5.1) (0.8)Other, net (5.5) (0.9) (2.6) (0.4) 2.0 0.3
Income Taxes from Continuing Operations $240.9 35.9% $234.2 35.5% $218.9 35.5%
Deferred income taxes resulted from temporary differences between the financial statement carrying amountsand the tax basis of existing assets and liabilities. The principal components of NiSource’s net deferred tax liabilitywere as follows:At December 31, (in millions) 2004 2003 2002
Deferred tax liabilitiesAccelerated depreciation and other property differences $1,680.3 $1,596.5 $1,482.0Unrecovered gas and fuel costs 112.6 68.0 46.7Other regulatory assets 303.9 279.0 238.4SFAS No. 133 and price risk adjustments 40.9 49.0 42.7Premiums and discounts associated with long-term debt 54.1 56.6 60.7
Total Deferred Tax Liabilities 2,191.8 2,049.1 1,870.5Deferred tax assets
Deferred investment tax credits and other regulatory liabilities (177.9) (156.5) (62.4)Pension and other postretirement/postemployment benefits (192.4) (190.9) (163.4)Environmental liabilities (21.4) (20.1) (41.2)Other accrued liabilities (43.9) (30.0) (52.3)Other, net (19.2) (5.4) (38.2)
Total Deferred Tax Assets (454.8) (402.9) (357.5)Less: Deferred income taxes related to current assets and liabilities 71.1 57.0 (4.8)Non-Current Deferred Tax Liability 1,665.9 $1,589.2 $1,517.8
page 12
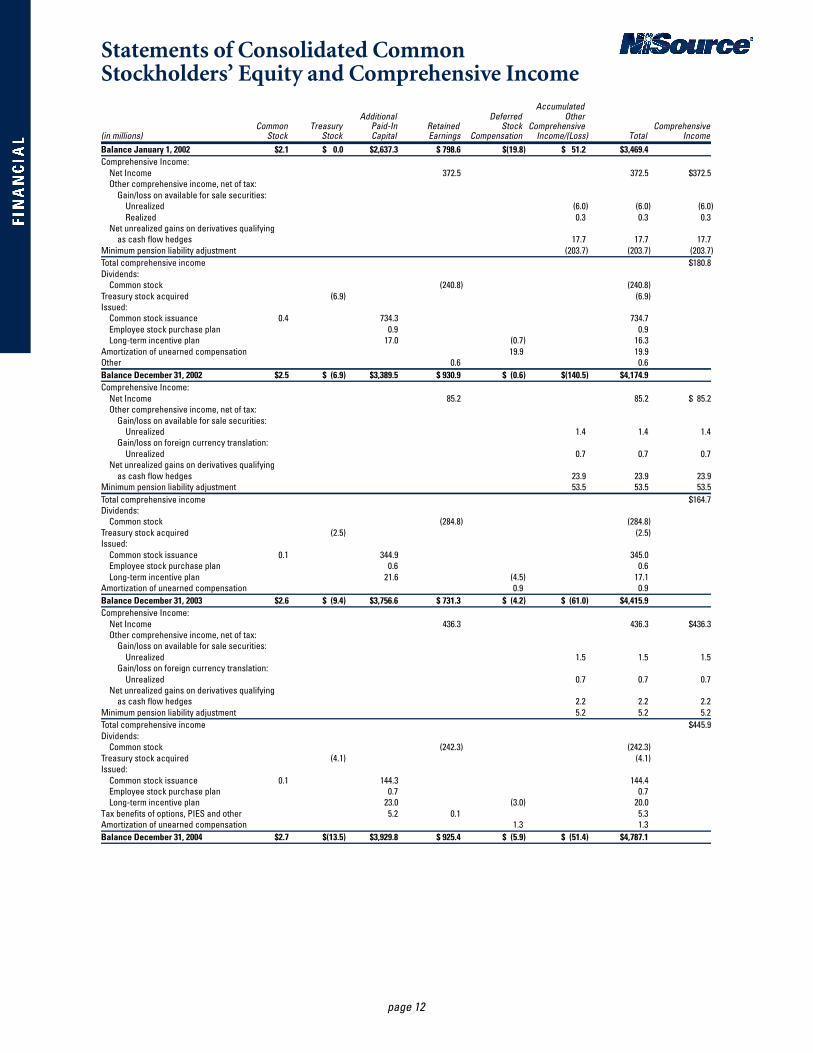
Statements of Consolidated Common Stockholders’ Equity and Comprehensive Income
AccumulatedAdditional Deferred Other
Common Treasury Paid-In Retained Stock Comprehensive Comprehensive(in millions) Stock Stock Capital Earnings Compensation Income/(Loss) Total IncomeBalance January 1, 2002 $2.1 $ 0.0 $2,637.3 $ 798.6 $(19.8) $ 51.2 $3,469.4Comprehensive Income:
Net Income 372.5 372.5 $372.5Other comprehensive income, net of tax:
Gain/loss on available for sale securities:Unrealized (6.0) (6.0) (6.0)Realized 0.3 0.3 0.3
Net unrealized gains on derivatives qualifying as cash flow hedges 17.7 17.7 17.7
Minimum pension liability adjustment (203.7) (203.7) (203.7)Total comprehensive income $180.8Dividends:
Common stock (240.8) (240.8)Treasury stock acquired (6.9) (6.9)Issued:
Common stock issuance 0.4 734.3 734.7Employee stock purchase plan 0.9 0.9Long-term incentive plan 17.0 (0.7) 16.3
Amortization of unearned compensation 19.9 19.9Other 0.6 0.6Balance December 31, 2002 $2.5 $ (6.9) $3,389.5 $ 930.9 $ (0.6) $(140.5) $4,174.9Comprehensive Income:
Net Income 85.2 85.2 $ 85.2Other comprehensive income, net of tax:
Gain/loss on available for sale securities:Unrealized 1.4 1.4 1.4
Gain/loss on foreign currency translation:Unrealized 0.7 0.7 0.7
Net unrealized gains on derivatives qualifying as cash flow hedges 23.9 23.9 23.9
Minimum pension liability adjustment 53.5 53.5 53.5Total comprehensive income $164.7Dividends:
Common stock (284.8) (284.8)Treasury stock acquired (2.5) (2.5)Issued:
Common stock issuance 0.1 344.9 345.0Employee stock purchase plan 0.6 0.6Long-term incentive plan 21.6 (4.5) 17.1
Amortization of unearned compensation 0.9 0.9Balance December 31, 2003 $2.6 $ (9.4) $3,756.6 $ 731.3 $ (4.2) $ (61.0) $4,415.9Comprehensive Income:
Net Income 436.3 436.3 $436.3Other comprehensive income, net of tax:
Gain/loss on available for sale securities:Unrealized 1.5 1.5 1.5
Gain/loss on foreign currency translation:Unrealized 0.7 0.7 0.7
Net unrealized gains on derivatives qualifying as cash flow hedges 2.2 2.2 2.2
Minimum pension liability adjustment 5.2 5.2 5.2Total comprehensive income $445.9Dividends:
Common stock (242.3) (242.3)Treasury stock acquired (4.1) (4.1)Issued:
Common stock issuance 0.1 144.3 144.4Employee stock purchase plan 0.7 0.7Long-term incentive plan 23.0 (3.0) 20.0
Tax benefits of options, PIES and other 5.2 0.1 5.3Amortization of unearned compensation 1.3 1.3Balance December 31, 2004 $2.7 $(13.5) $3,929.8 $ 925.4 $ (5.9) $ (51.4) $4,787.1
page 13
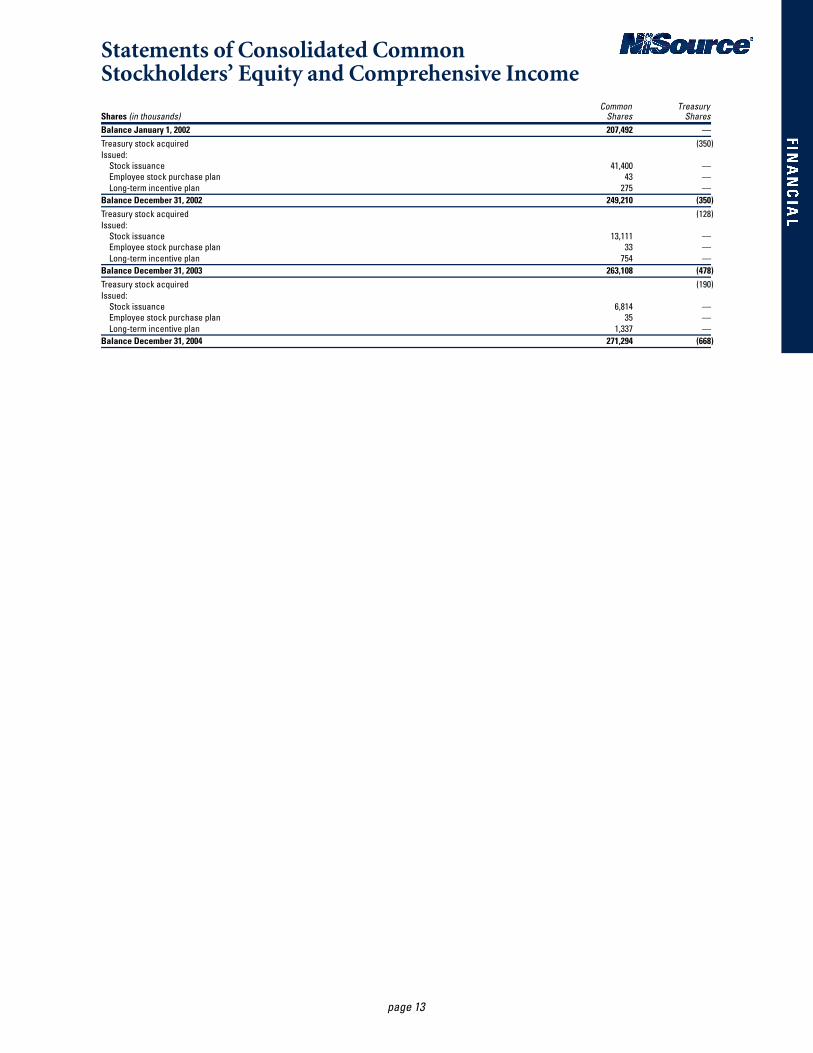
Statements of Consolidated Common Stockholders’ Equity and Comprehensive Income
Common TreasuryShares (in thousands) Shares SharesBalance January 1, 2002 207,492 —Treasury stock acquired (350)Issued:
Stock issuance 41,400 —Employee stock purchase plan 43 —Long-term incentive plan 275 —
Balance December 31, 2002 249,210 (350)Treasury stock acquired (128)Issued:
Stock issuance 13,111 —Employee stock purchase plan 33 —Long-term incentive plan 754 —
Balance December 31, 2003 263,108 (478)Treasury stock acquired (190)Issued:
Stock issuance 6,814 —Employee stock purchase plan 35 —Long-term incentive plan 1,337 —
Balance December 31, 2004 271,294 (668)
page 14
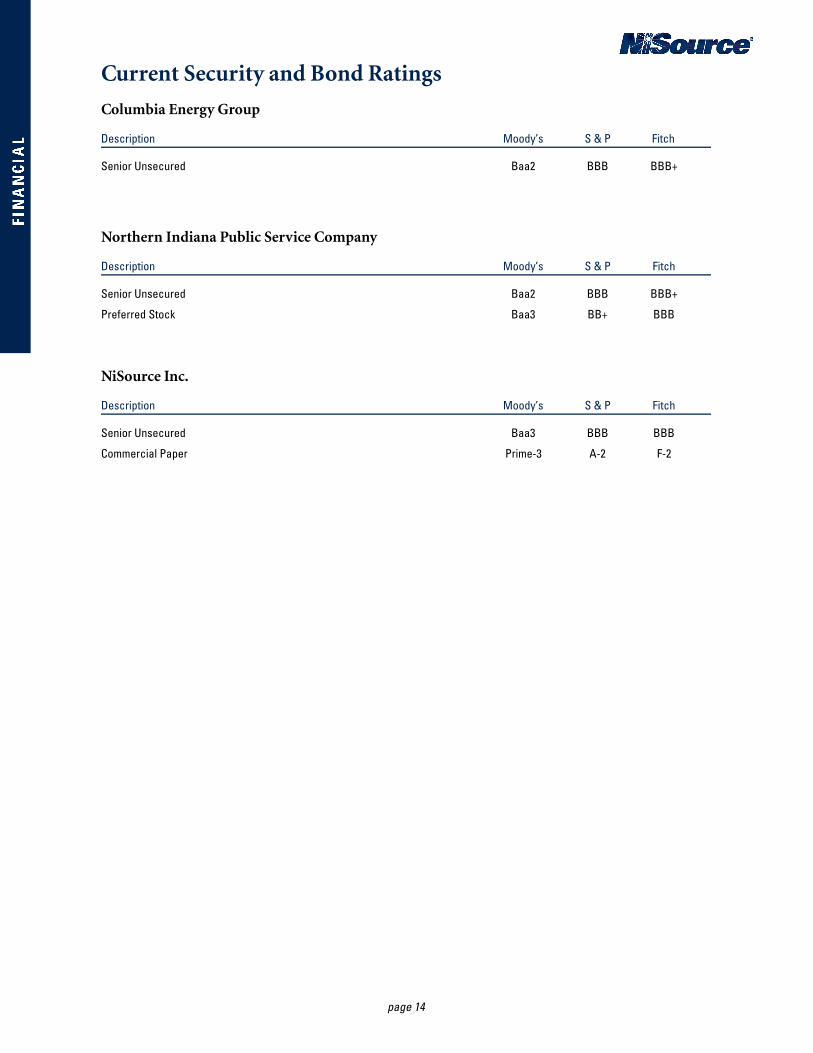
Current Security and Bond RatingsColumbia Energy Group
Description Moody’s S & P Fitch
Senior Unsecured Baa2 BBB BBB+
Northern Indiana Public Service Company
Description Moody’s S & P Fitch
Senior Unsecured Baa2 BBB BBB+
Preferred Stock Baa3 BB+ BBB
NiSource Inc.
Description Moody’s S & P Fitch
Senior Unsecured Baa3 BBB BBB
Commercial Paper Prime-3 A-2 F-2
page 15
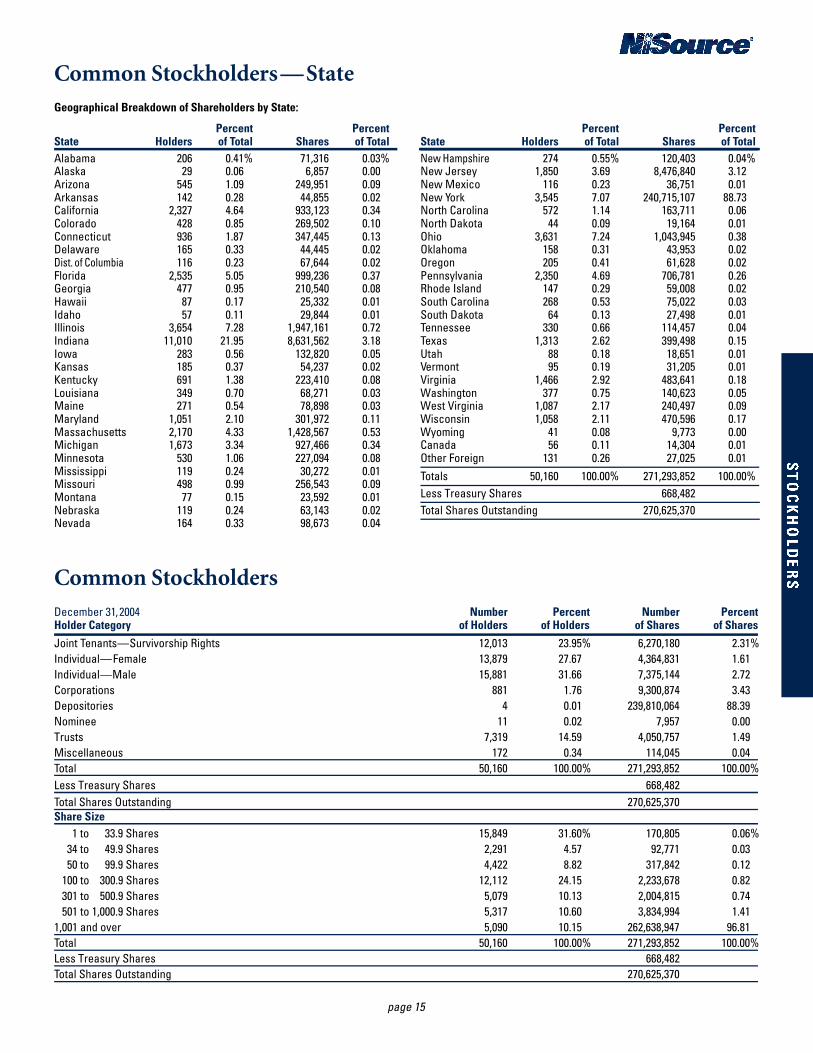
Common Stockholders —State
Common Stockholders
Geographical Breakdown of Shareholders by State:
Percent PercentState Holders of Total *Shares of TotalAlabama 206 0.41% 71,316 0.03% Alaska 29 0.06% 6,857 0.00%Arizona 545 1.09% 249,951 0.09%Arkansas 142 0.28% 44,855 0.02%California 2,327 4.64% 933,123 0.34%Colorado 428 0.85% 269,502 0.10%Connecticut 936 1.87% 347,445 0.13%Delaware 165 0.33% 44,445 0.02%Dist. of Columbia 116 0.23% 67,644 0.02%Florida 2,535 5.05% 999,236 0.37%Georgia 477 0.95% 210,540 0.08%Hawaii 87 0.17% 25,332 0.01%Idaho 57 0.11% 29,844 0.01%Illinois 3,654 7.28% 1,947,161 0.72%Indiana 11,010 21.95% 8,631,562 3.18%Iowa 283 0.56% 132,820 0.05%Kansas 185 0.37% 54,237 0.02%Kentucky 691 1.38% 223,410 0.08%Louisiana 349 0.70% 68,271 0.03%Maine 271 0.54% 78,898 0.03%Maryland 1,051 2.10% 301,972 0.11%Massachusetts 2,170 4.33% 1,428,567 0.53%Michigan 1,673 3.34% 927,466 0.34%Minnesota 530 1.06% 227,094 0.08%Mississippi 119 0.24% 30,272 0.01%Missouri 498 0.99% 256,543 0.09%Montana 77 0.15% 23,592 0.01%Nebraska 119 0.24% 63,143 0.02%Nevada 164 0.33% 98,673 0.04%
Percent PercentState Holders of Total Shares of TotalNew Hampshire 274 0.55% 120,403 0.04%New Jersey 1,850 3.69% 8,476,840 3.12%New Mexico 116 0.23% 36,751 0.01%New York 3,545 7.07% 240,715,107 88.73%North Carolina 572 1.14% 163,711 0.06%North Dakota 44 0.09% 19,164 0.01%Ohio 3,631 7.24% 1,043,945 0.38%Oklahoma 158 0.31% 43,953 0.02%Oregon 205 0.41% 61,628 0.02%Pennsylvania 2,350 4.69% 706,781 0.26%Rhode Island 147 0.29% 59,008 0.02%South Carolina 268 0.53% 75,022 0.03%South Dakota 64 0.13% 27,498 0.01%Tennessee 330 0.66% 114,457 0.04%Texas 1,313 2.62% 399,498 0.15%Utah 88 0.18% 18,651 0.01%Vermont 95 0.19% 31,205 0.01%Virginia 1,466 2.92% 483,641 0.18%Washington 377 0.75% 140,623 0.05%West Virginia 1,087 2.17% 240,497 0.09%Wisconsin 1,058 2.11% 470,596 0.17%Wyoming 41 0.08% 9,773 0.00%Canada 56 0.11% 14,304 0.01%Other Foreign 131 0.26% 27,025 0.01%Totals 50,160 100.00% 271,293,852 100.00%Less Treasury Shares 668,482Total Shares Outstanding 270,625,370
December 31, 2 0 0 4 Number Percent Number PercentHolder Category of Holders of Holders of Shares of SharesJoint Tenants—Survivorship Rights 12,013 23.95% 6,270,180 2.31%Individual—Female 13,879 27.67% 4,364,831 1.61%Individual—Male 15,881 31.66% 7,375,144 2.72%Corporations 881 1.76% 9,300,874 3.43%Depositories 4 0.01% 239,810,064 88.39%Nominee 11 0.02% 7,957 0.00%Trusts 7,319 14.59% 4,050,757 1.49%Miscellaneous 172 0.34% 114,045 0.04%Total 50,160 100.00% 271,293,852 100.00%Less Treasury Shares 668,482Total Shares Outstanding 270,625,370Share Size %3,331 to 33.9 Shares 15,849 31.60% 170,805 0.06%3, 34 to 49.9 Shares 2,291 4.57% 92,771 0.03%3, 50 to 99.9 Shares 4,422 8.82% 317,842 0.12%3,100 to 300.9 Shares 12,112 24.15% 2,233,678 0.82%3,301 to 500.9 Shares 5,079 10.13% 2,004,815 0.74%3,501 to 1,000.9 Shares 5,317 10.60% 3,834,994 1.41%1,001 and over 5,090 10.15% 262,638,947 96.81Total 50,160 100.00% 271,293,852 100.00%Less Treasury Shares 668,482Total Shares Outstanding 270,625,370
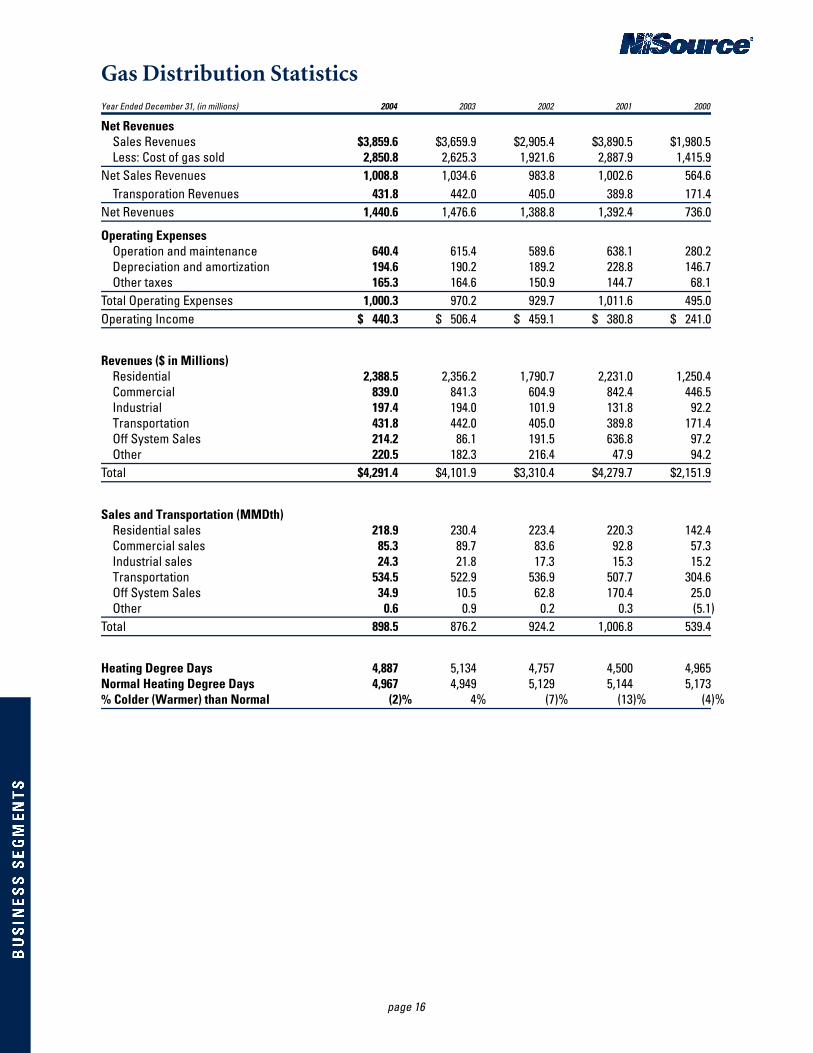
Gas Distribution Statistics
page 16
Year Ended December 31, (in millions) 2004 2003 2002 2001 2000
Net RevenuesSales Revenues $3,859.6 $3,659.9 $2,905.4 $3,890.5 $1,980.5Less: Cost of gas sold 2,850.8 2,625.3 1,921.6 2,887.9 1,415.9
Net Sales Revenues 1,008.8 1,034.6 983.8 1,002.6 564.6Transporation Revenues 431.8 442.0 405.0 389.8 171.4
Net Revenues 1,440.6 1,476.6 1,388.8 1,392.4 736.0
Operating ExpensesOperation and maintenance 640.4 615.4 589.6 638.1 280.2Depreciation and amortization 194.6 190.2 189.2 228.8 146.7Other taxes 165.3 164.6 150.9 144.7 68.1
Total Operating Expenses 1,000.3 970.2 929.7 1,011.6 495.0Operating Income $ 440.3 $ 506.4 $ 459.1 $ 380.8 $ 241.0
Revenues ($ in Millions)Residential 2,388.5 2,356.2 1,790.7 2,231.0 1,250.4Commercial 839.0 841.3 604.9 842.4 446.5Industrial 197.4 194.0 101.9 131.8 92.2Transportation 431.8 442.0 405.0 389.8 171.4Off System Sales 214.2 86.1 191.5 636.8 97.2Other 220.5 182.3 216.4 47.9 94.2
Total $4,291.4 $4,101.9 $3,310.4 $4,279.7 $2,151.9
Sales and Transportation (MMDth)Residential sales 218.9 230.4 223.4 220.3 142.4Commercial sales 85.3 89.7 83.6 92.8 57.3Industrial sales 24.3 21.8 17.3 15.3 15.2Transportation 534.5 522.9 536.9 507.7 304.6Off System Sales 34.9 10.5 62.8 170.4 25.0Other 0.6 0.9 0.2 0.3 (5.1)
Total 898.5 876.2 924.2 1,006.8 539.4
Heating Degree Days 4,887 5,134 4,757 4,500 4,965Normal Heating Degree Days 4,967 4,949 5,129 5,144 5,173% Colder (Warmer) than Normal (2)% 4% (7)% (13)% (4)%
page 17
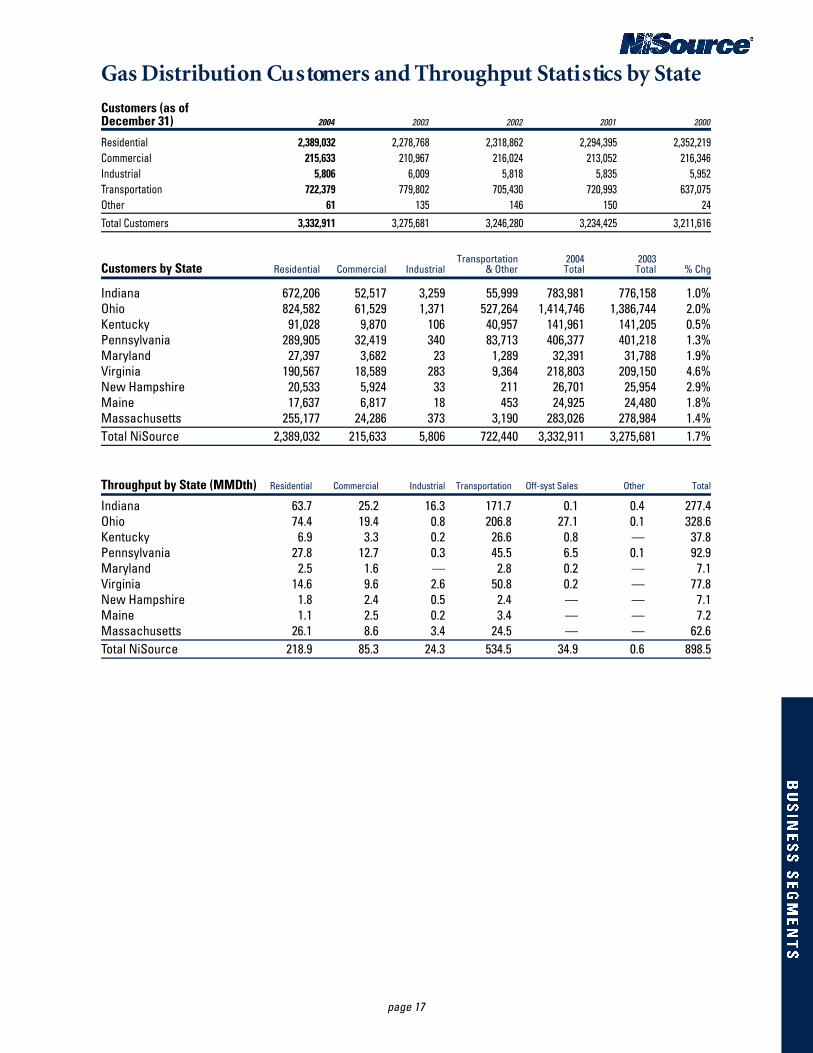
Gas Distri buti on Cu s tom ers and Thro u gh p ut St a ti s tics by St a teCustomers (as of December 31) 2004 2003 2002 2001 2000
Residential 2,389,032 2,278,768 2,318,862 2,294,395 2,352,219Commercial 215,633 210,967 216,024 213,052 216,346Industrial 5,806 6,009 5,818 5,835 5,952Transportation 722,379 779,802 705,430 720,993 637,075Other 61 135 146 150 24Total Customers 3,332,911 3,275,681 3,246,280 3,234,425 3,211,616
Transportation 2004 2003Customers by State RResidential Commercial Industrial & Other Total Total % Chg
Indiana 672,206 52,517 3,259 55,999 783,981 776,158 1.0%Ohio 824,582 61,529 1,371 527,264 1,414,746 1,386,744 2.0%Kentucky 91,028 9,870 106 40,957 141,961 141,205 0.5%Pennsylvania 289,905 32,419 340 83,713 406,377 401,218 1.3%Maryland 27,397 3,682 23 1,289 32,391 31,788 1.9%Virginia 190,567 18,589 283 9,364 218,803 209,150 4.6%New Hampshire 20,533 5,924 33 211 26,701 25,954 2.9%Maine 17,637 6,817 18 453 24,925 24,480 1.8%Massachusetts 255,177 24,286 373 3,190 283,026 278,984 1.4%Total NiSource 2,389,032 215,633 5,806 722,440 3,332,911 3,275,681 1.7%
Throughput by State (MMDth) R e s i d e n t i a l C o m m e r c i a l I n d u s t r i a l T r a n s p o r t a t i o n Off-syst Sales O t h e r T o t a l
Indiana 63.7 25.2 16.3 171.7 0.1 0.4 277.4Ohio 74.4 19.4 0.8 206.8 27.1 0.1 328.6Kentucky 6.9 3.3 0.2 26.6 0.8 — 37.8Pennsylvania 27.8 12.7 0.3 45.5 6.5 0.1 92.9Maryland 2.5 1.6 — 2.8 0.2 — 7.1Virginia 14.6 9.6 2.6 50.8 0.2 — 77.8New Hampshire 1.8 2.4 0.5 2.4 — — 7.1Maine 1.1 2.5 0.2 3.4 — — 7.2Massachusetts 26.1 8.6 3.4 24.5 — — 62.6Total NiSource 218.9 85.3 24.3 534.5 34.9 0.6 898.5
page 18
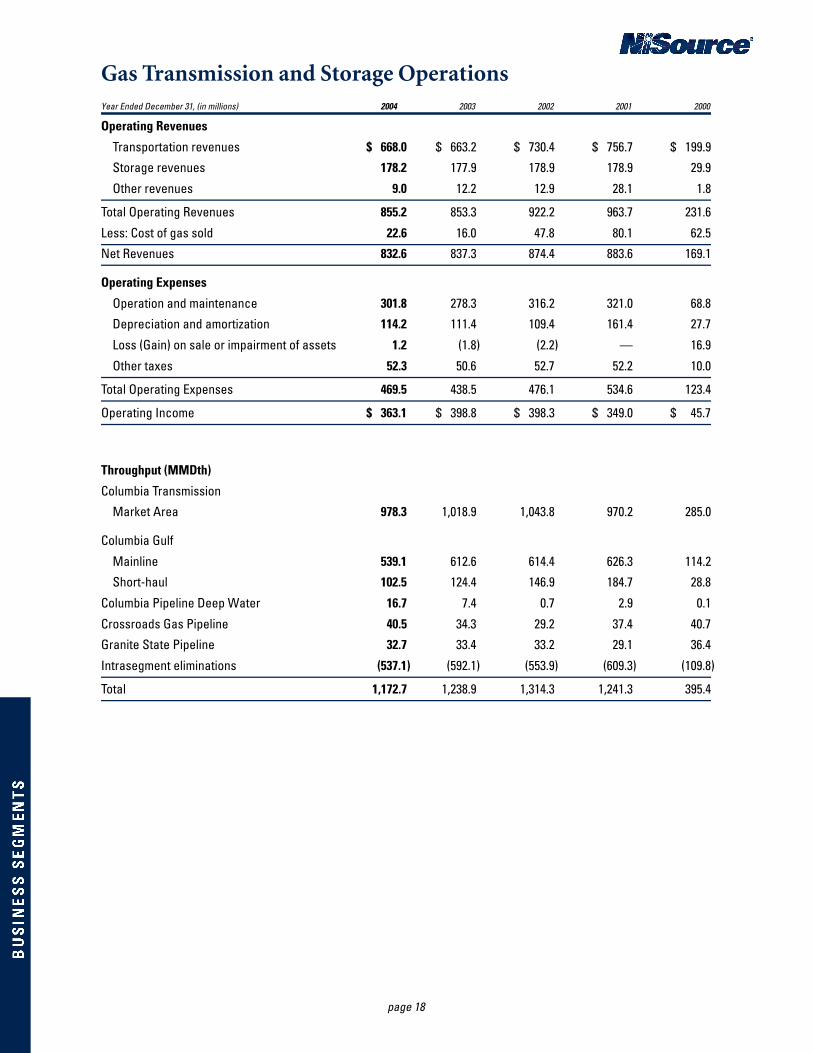
Gas Transmission and Storage OperationsYear Ended December 31, (in millions) 2004 2003 2002 2001 2000
Operating Revenues
Transportation revenues $ 668.0 $ 663.2 $ 730.4 $ 756.7 $ 199.9Storage revenues 178.2 177.9 178.9 178.9 29.9Other revenues 9.0 12.2 12.9 28.1 1.8
Total Operating Revenues 855.2 853.3 922.2 963.7 231.6Less: Cost of gas sold 22.6 16.0 47.8 80.1 62.5Net Revenues 832.6 837.3 874.4 883.6 169.1
Operating Expenses
Operation and maintenance 301.8 278.3 316.2 321.0 68.8Depreciation and amortization 114.2 111.4 109.4 161.4 27.7Loss (Gain) on sale or impairment of assets 1.2 (1.8) (2.2) — 16.9Other taxes 52.3 50.6 52.7 52.2 10.0
Total Operating Expenses 469.5 438.5 476.1 534.6 123.4
Operating Income $ 363.1 $ 398.8 $ 398.3 $ 349.0 $ 45.7
Throughput (MMDth)
Columbia TransmissionMarket Area 978.3 1,018.9 1,043.8 970.2 285.0
Columbia GulfMainline 539.1 612.6 614.4 626.3 114.2Short-haul 102.5 124.4 146.9 184.7 28.8
Columbia Pipeline Deep Water 16.7 7.4 0.7 2.9 0.1Crossroads Gas Pipeline 40.5 34.3 29.2 37.4 40.7Granite State Pipeline 32.7 33.4 33.2 29.1 36.4Intrasegment eliminations (537.1) (592.1) (553.9) (609.3) (109.8)
Total 1,172.7 1,238.9 1,314.3 1,241.3 395.4
page 19
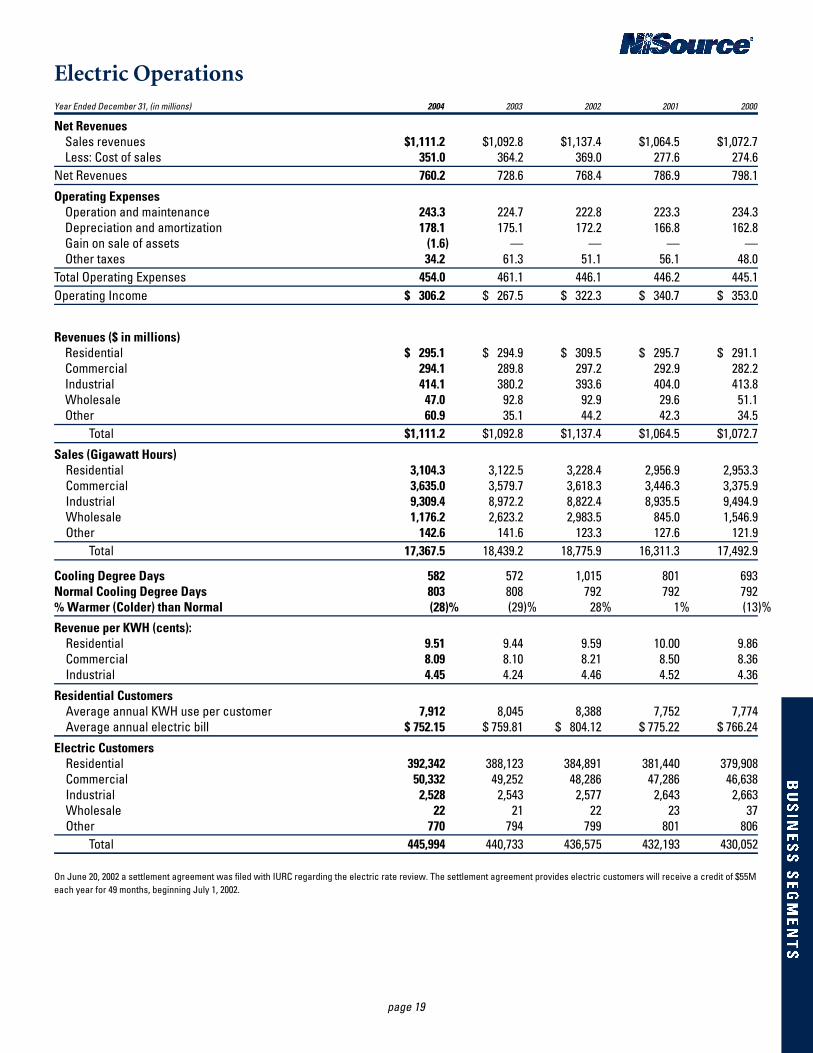
Electric OperationsYear Ended December 31, (in millions) 2004 2003 2002 2001 2000
Net RevenuesSales revenues $1,111.2 $1,092.8 $1,137.4 $1,064.5 $1,072.7Less: Cost of sales 351.0 364.2 369.0 277.6 274.6
Net Revenues 760.2 728.6 768.4 786.9 798.1Operating Expenses
Operation and maintenance 243.3 224.7 222.8 223.3 234.3Depreciation and amortization 178.1 175.1 172.2 166.8 162.8Gain on sale of assets (1.6) — — — —Other taxes 34.2 61.3 51.1 56.1 48.0
Total Operating Expenses 454.0 461.1 446.1 446.2 445.1Operating Income $ 306.2 $ 267.5 $ 322.3 $ 340.7 $ 353.0
Revenues ($ in millions)Residential $ 295.1 $ 294.9 $ 309.5 $ 295.7 $ 291.1Commercial 294.1 289.8 297.2 292.9 282.2Industrial 414.1 380.2 393.6 404.0 413.8Wholesale 47.0 92.8 92.9 29.6 51.1Other 60.9 35.1 44.2 42.3 34.5
Total $1,111.2 $1,092.8 $1,137.4 $1,064.5 $1,072.7Sales (Gigawatt Hours)
Residential 3,104.3 3,122.5 3,228.4 2,956.9 2,953.3Commercial 3,635.0 3,579.7 3,618.3 3,446.3 3,375.9Industrial 9,309.4 8,972.2 8,822.4 8,935.5 9,494.9Wholesale 1,176.2 2,623.2 2,983.5 845.0 1,546.9Other 142.6 141.6 123.3 127.6 121.9
Total 17,367.5 18,439.2 18,775.9 16,311.3 17,492.9
Cooling Degree Days 582 572 1,015 801 693Normal Cooling Degree Days 803 808 792 792 792% Warmer (Colder) than Normal (28)% (29)% 28% 1% (13)%Revenue per KWH (cents):
Residential 9.51 9.44 9.59 10.00 9.86Commercial 8.09 8.10 8.21 8.50 8.36Industrial 4.45 4.24 4.46 4.52 4.36
Residential CustomersAverage annual KWH use per customer 7,912 8,045 8,388 7,752 7,774Average annual electric bill $ 752.15 $ 759.81 $ 804.12 $ 775.22 $ 766.24
Electric CustomersResidential 392,342 388,123 384,891 381,440 379,908Commercial 50,332 49,252 48,286 47,286 46,638Industrial 2,528 2,543 2,577 2,643 2,663Wholesale 22 21 22 23 37Other 770 794 799 801 806
Total 445,994 440,733 436,575 432,193 430,052
On June 20, 2002 a settlement agreement was filed with IURC regarding the electric rate review. The settlement agreement provides electric customers will receive a credit of $55Meach year for 49 months, beginning July 1, 2002.
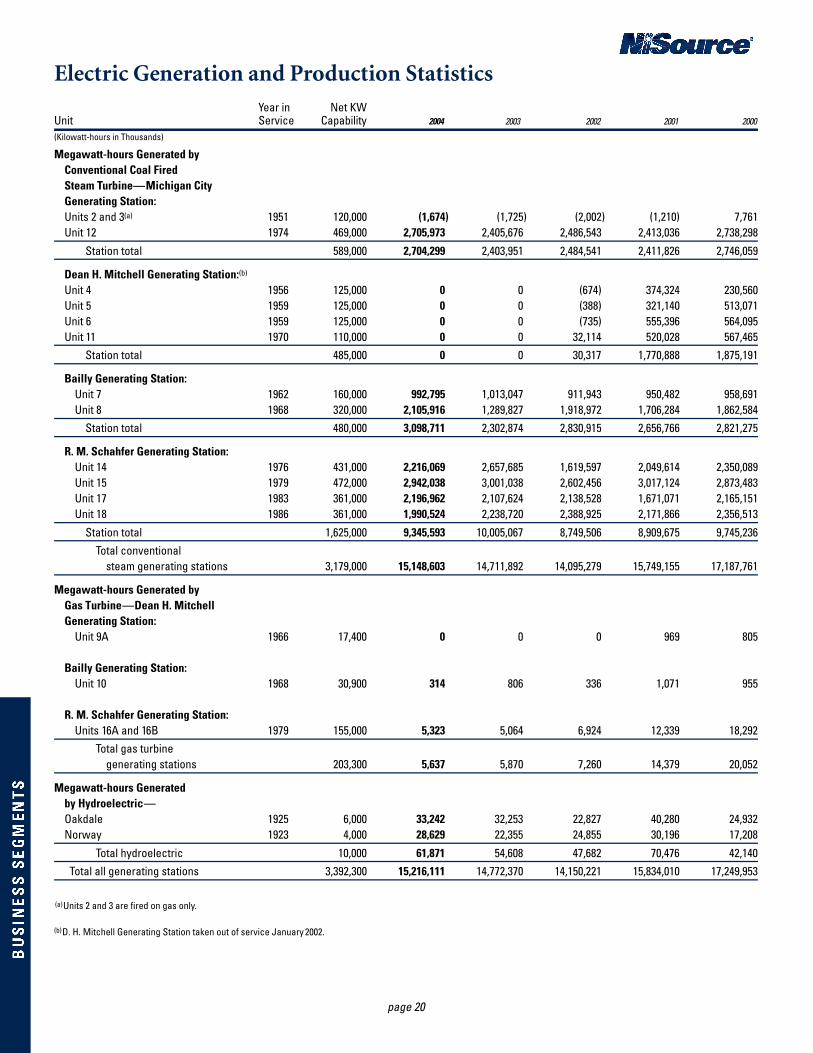
page 20
Electric Generation and Production StatisticsYear in Net KW
Unit Service C a p a b i l i t y 2 0 0 4 2 0 0 3 2 0 0 2 2 0 0 1 2 0 0 0
(Kilowatt-hours in Thousands)
Megawatt-hours Generated by Conventional Coal Fired Steam Turbine—Michigan City Generating Station:Units 2 and 3(a) 1951 120,000 (1,674) (1,725) (2,002) (1,210) 7,761Unit 12 1974 469,000 2,705,973 2,405,676 2,486,543 2,413,036 2,738,298
Station total 589,000 2,704,299 2,403,951 2,484,541 2,411,826 2,746,059
Dean H. Mitchell Generating Station:(b)
Unit 4 1956 125,000 0 0 (674) 374,324 230,560Unit 5 1959 125,000 0 0 (388) 321,140 513,071Unit 6 1959 125,000 0 0 (735) 555,396 564,095Unit 1 1 1970 110,000 0 0 32,114 520,028 567,465
Station total 485,000 0 0 30,317 1,770,888 1,875,191
Bailly Generating Station:Unit 7 1962 160,000 992,795 1,013,047 911,943 950,482 958,691Unit 8 1968 320,000 2,105,916 1,289,827 1,918,972 1,706,284 1,862,584
Station total 480,000 3,098,711 2,302,874 2,830,915 2,656,766 2,821,275
R. M. Schahfer Generating Station:Unit 14 1976 431,000 2,216,069 2,657,685 1,619,597 2,049,614 2,350,089Unit 15 1979 472,000 2,942,038 3,001,038 2,602,456 3,017,124 2,873,483Unit 17 1983 361,000 2,196,962 2,107,624 2,138,528 1,671,071 2,165,151Unit 18 1986 361,000 1,990,524 2,238,720 2,388,925 2,171,866 2,356,513
Station total 1,625,000 9,345,593 10,005,067 8,749,506 8,909,675 9,745,236Total conventional
steam generating stations 3,179,000 15,148,603 14,711,892 14,095,279 15,749,155 17,187,761
Megawatt-hours Generated by Gas Turbine—Dean H. Mitchell Generating Station:
Unit 9A 1966 17,400 0 0 0 969 805
Bailly Generating Station:Unit 10 1968 30,900 314 806 336 1,071 955
R. M. Schahfer Generating Station:Units 16A and 16B 1979 155,000 5,323 5,064 6,924 12,339 18,292
Total gas turbine generating stations 203,300 5,637 5,870 7,260 14,379 20,052
Megawatt-hours Generated by Hydroelectric—Oakdale 1925 6,000 33,242 32,253 22,827 40,280 24,932Norway 1923 4,000 28,629 22,355 24,855 30,196 17,208
Total hydroelectric 10,000 61,871 54,608 47,682 70,476 42,140Total all generating stations 3,392,300 15,216,111 14,772,370 14,150,221 15,834,010 17,249,953
(a)Units 2 and 3 are fired on gas only.
(b)D. H. Mitchell Generating Station taken out of service January 2002.
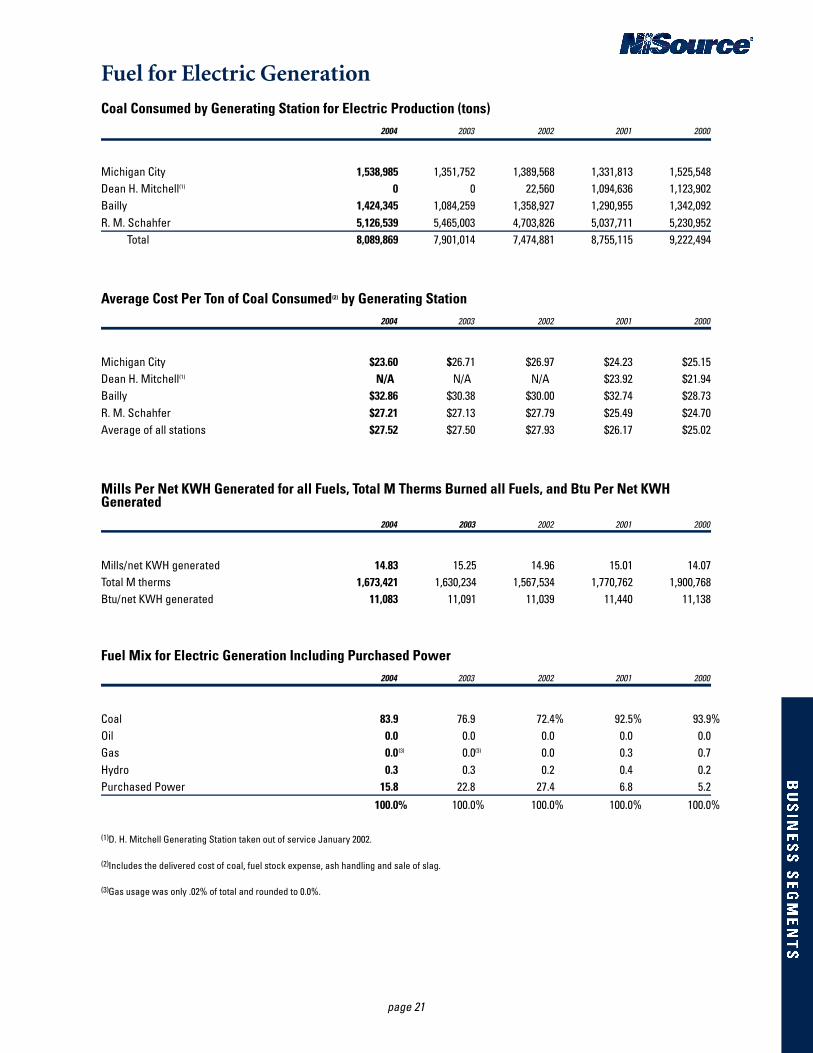
page 21
Fuel for Electric GenerationCoal Consumed by Generating Station for Electric Production (tons)
2004 2003 2002 2001 2000
Michigan City 1,538,985 1,351,752 1,389,568 1,331,813 1,525,548Dean H. Mitchell(1) 0 0 22,560 1,094,636 1,123,902Bailly 1,424,345 1,084,259 1,358,927 1,290,955 1,342,092R. M. Schahfer 5,126,539 5,465,003 4,703,826 5,037,711 5,230,952
Total 8,089,869 7,901,014 7,474,881 8,755,115 9,222,494
Average Cost Per Ton of Coal Consumed(2) by Generating Station 2004 2003 2002 2001 2000
Michigan City $23.60 $26.71 $26.97 $24.23 $25.15Dean H. Mitchell(1) N/A.0 N/A.00 N/A0 $23.92 $21.94Bailly $32.86 $30.38 $30.00 $32.74 $28.73R. M. Schahfer $27.21 $27.13 $27.79 $25.49 $24.70Average of all stations $27.52 $27.50 $27.93 $26.17 $25.02
Mills Per Net KWH Generated for all Fuels, Total M Therms Burned all Fuels, and Btu Per Net KWHGenerated
2004 2003 2002 2001 2000
Mills/net KWH generated 14.83 15.25 14.96 15.01 14.07Total M therms 1,673,421 1,630,234 1,567,534 1,770,762 1,900,768Btu/net KWH generated 11,083 11,091 11,039 11,440 11,138
Fuel Mix for Electric Generation Including Purchased Power2004 2003 2002 2001 2000
Coal 83.9 76.9 72.4% 92.5% 93.9%Oil 0.0 0.0 0.0 0.0 0.0Gas 0.0(3) 0.0(3) 0.0 0.3 0.7Hydro 0.3 0.3 0.2 0.4 0.2Purchased Power 15.8 22.8 27.4 6.8 5.2
100.0% 100.0% 100.0% 100.0% 100.0%
(1)D. H. Mitchell Generating Station taken out of service January 2002.
(2)Includes the delivered cost of coal, fuel stock expense, ash handling and sale of slag.
(3)Gas usage was only .02% of total and rounded to 0.0%.
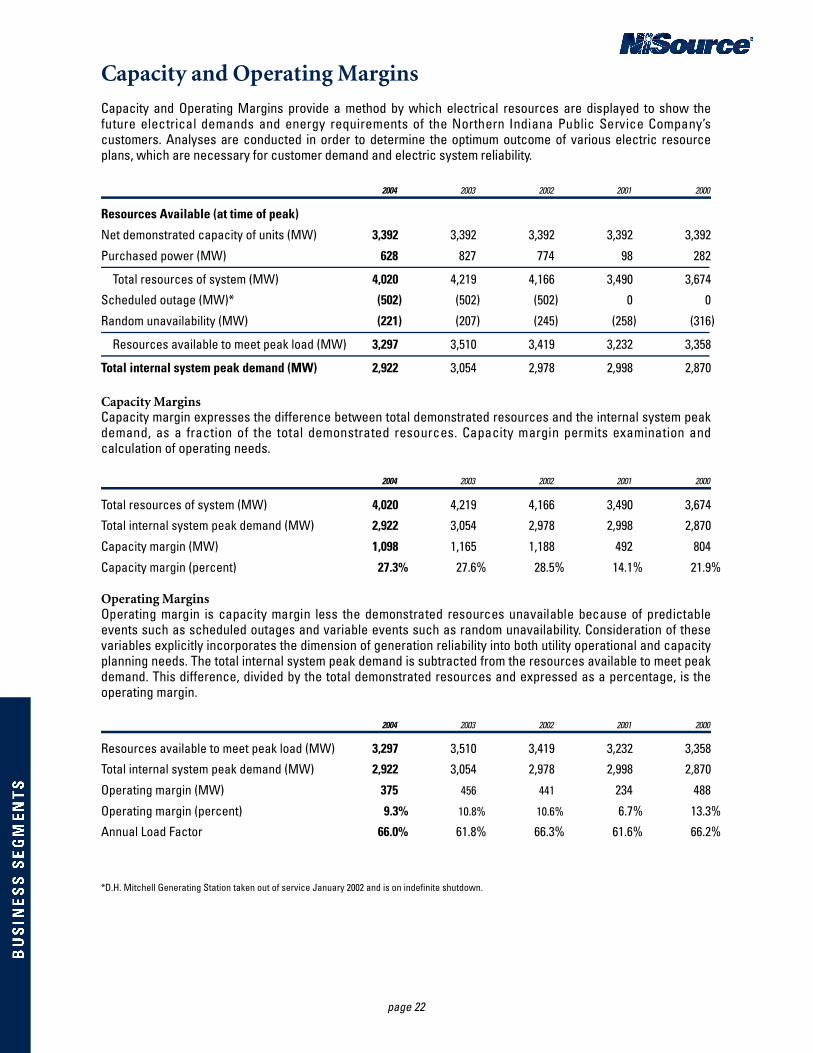
page 22
Capacity and Operating MarginsCapacity and Operating Margins provide a method by which electrical resources are displayed to show thefuture electrical demands and energy requirements of the Northern Indiana Public Service Company’scustomers. Analyses are conducted in order to determine the optimum outcome of various electric resourceplans, which are necessary for customer demand and electric system reliability.
2 0 0 4 2 0 0 3 2 0 0 2 2 0 0 1 2 0 0 0
Resources Available (at time of peak)
Net demonstrated capacity of units (MW) 3,392 3,392 3,392 3,392 3,392Purchased power (MW) 628 827 774 98 282
Total resources of system (MW) 4,020 4,219 4,166 3,490 3,674Scheduled outage (MW)* (502) (502) (502) 0 0Random unavailability (MW) (221) (207) (245) (258) (316)
Resources available to meet peak load (MW) 3,297 3,510 3,419 3,232 3,358
Total internal system peak demand (MW) 2,922 3,054 2,978 2,998 2,870
Capacity MarginsCapacity margin expresses the difference between total demonstrated resources and the internal system peakdemand, as a fraction of the total demonstrated resources. Capacity margin permits examination andcalculation of operating needs.
2 0 0 4 2 0 0 3 2 0 0 2 2 0 0 1 2 0 0 0
Total resources of system (MW) 4,020 4,219 4,166 3,490 3,674Total internal system peak demand (MW) 2,922 3,054 2,978 2,998 2,870Capacity margin (MW) 1,098 1,165 1,188 492 804Capacity margin (percent) 27.3% 27.6% 28.5% 14.1% 21.9%
Operating MarginsOperating margin is capacity margin less the demonstrated resources unavailable because of predictableevents such as scheduled outages and variable events such as random unavailability. Consideration of thesevariables explicitly incorporates the dimension of generation reliability into both utility operational and capacityplanning needs. The total internal system peak demand is subtracted from the resources available to meet peakdemand. This difference, divided by the total demonstrated resources and expressed as a percentage, is theoperating margin.
2 0 0 4 2 0 0 3 2 0 0 2 2 0 0 1 2 0 0 0
Resources available to meet peak load (MW) 3,297 3,510 3,419 3,232 3,358Total internal system peak demand (MW) 2,922 3,054 2,978 2,998 2,870Operating margin (MW) 375 456 441 234 488Operating margin (percent) 9.3% 10.8% 10.6% 6.7% 13.3%Annual Load Factor 66.0% 61.8% 66.3% 61.6% 66.2%
*D.H. Mitchell Generating Station taken out of service January 2002 and is on indefinite shutdown.
page 23
Glossary of Selected Energy TermsBcf: (billions of cubic feet) A common measurement of a large
volume of natural gas. Gas volume is denominated in cubic feetby the thousands (Mcf), millions (MMcf), billions (Bcf) andtrillions (Tcf).
Block: Offshore area identified numerically.Btu: Abbreviation for British thermal unit, a measure of heating
value — the quantity of heat required to raise the temperature ofone pound of water one degree Fahrenheit at sea level.
Cogeneration: A process that produces electrical and thermalenergy simultaneously from a single source, often natural gas.
Cost Tracker Revenue: A special revenue provision approved bystate regulatory commissions to recover operating and capitalexpenses not contained in rate base.
Deferred Taxes: Income taxes resulting from the use of income taxlaw provisions which allow recognition of certain items ofrevenue and expense in the tax return prior to their beingrecorded on the books of the company. Deferred taxes do notconstitute earnings available to pay dividends to investors.
Degree-Day, Cooling: A measure of the need for air conditioning(cooling) based on temperature. A cooling degree-day measuresthe variations to the daily mean temperature above a referencetemperature. NiSource measures cooling degree-days relativeto a reference temperature of 65 degrees
Degree-Day, Heating: A measure of the coldness of the weatherbased on temperature. A heating degree-day measures thevariations to the daily mean temperature below a referencetemperature (estimated temperature at which heating loadbegins). NiSource uses a reference temperature that variesslightly across the region, resulting in a compositemeasurement based on 62 degrees.
Dekatherm: (Dt or Dth) A measure of heating value equal to onemillion Btus (MMBtu). One dekatherm is roughly equivalent toone thousand cubic feet (1 Mcf) of natural gas; specifically, for1998, the conversion factor for the production of dry natural gasis 1 Mcf equals 1.026 MMBtu (or, 1.026 dekatherm).
Derivatives: A financial instrument whose value is based on acommodity or other security, e.g., futures, options, swaps, andforwards. A derivative’s value changes with changes in one ormore underlying market variables, such as commodity prices,interest rates or foreign exchange rates.
Distributed Generation: A system of energy production that islocated at the point of use. It typically involves less than 500kilowatts of capacity and often includes provision for thermalenergy recovery and electric production.
Exchange Gas: Gas that is received from (or delivered to) anotherparty in exchange for gas delivered to (or received from) thatparty.
Exposure: A firm’s vulnerability to loss from unanticipated events.These events might include movement in financial marketvariables, such as foreign exchange rates, interest rates orcommodity prices.
Federal Energy Regulatory Commission (FERC): An independentfive-member commission within the Department of Energyresponsible for setting rates and charges for the wholesaletransportation and sale of natural gas and electricity; thelicensing of hydroelectric power projects; and for establishingrates or charges for the transportation of oil by pipeline, as wellas the valuation of such pipelines.
Firm Power, Electric: Power or power-producing capacity intendedto be available at all times during the period covered by acommitment, even under adverse conditions.
Firm Service: Service offered to customers under tariff authorityand associated contracts. It anticipates no interruptions otherthan unexpected and uncontrollable events.
Gigawatt: One billion watts.Gigawatt Hour: (Gwh) the energy of one gigawatt supplied for one
hour.Interruptible Service: A reduced-cost gas transportation service
offered to customers that anticipates and permits interruptionson short notice.
Kilowatt (kw): 1,000 watts. A watt is a measure of the rate at whichelectricity is generated or consumed.
Liquefied Natural Gas (LNG): Natural gas that is converted to aliquid state by reducing its temperature to minus 260°F atatmospheric pressure. As a liquid, LNG takes up one six-hundredth of the space that the comparable gas vapor wouldrequire, allowing it to be stored economically in cryogenictanks, or transported in cryogenic ships.
MMBtu: One million Btu.Market Center or Market Hub: An interchange where a shipper
can gain access to multiple transportation paths, flexiblesupply/delivery points and, as a general rule, other servicessuch as imbalance protection, short-term storage (“parkingservice”) and gas lending or borrowing services.
Mark to Market: The daily adjustment of the value of derivativepositions to reflect profits and losses resulting from pricemovements occurring during the last trading session.
Megawatt (mw): The generating capacity of utility plants isexpressed in megawatts; a megawatt is 1,000 kilowatts or 1million watts.
Operating Margin: The difference between operating revenuesand the cost of sales. It is the contribution made to cover allother operating costs, fixed costs and profit margin.
Peak Day: The day of greatest total gas sendout.Peak Load Demand: Electricity or gas supplied during a period of
the greatest demand.Rate Base: The amounts invested on which a regulatory agency
allows utilities to earn a return.Risk Management: The process of identifying the risk-return
tradeoffs available to a company in the course of its businessactivities and the process of developing and implementingplans which limit or reduce risks while simultaneouslyproviding an acceptable return.
Sales for Resale: Sales made to a local distribution company,pipeline, or municipality where the gas will be resold by the purchaser.
Shipper: Owner of the transportation contract, for whom gas is transported.
Short-haul Transportation: A gas transportation service providedby a transmission company over short distances along itspipeline system.
Spot Market: A market characterized by short-term, interruptible(or best efforts) contracts for specified volumes of gas.Participants may be any of the elements of the gas industry—producer, transporter, distributor, or end user. Brokers mayalso be utilized.
Therm: A quantity of heat equivalent to 100,000 British thermal units (Btus).
Throughput: Total volume of gas delivered.Transportation: The act of moving gas from a designated receipt
point to a designated delivery point pursuant to the terms ofa contract between the transporter and the shipper. Generallyit is the shipper’s own gas which is being moved.
Transporter: A legal entity which has the capability of providingthe service of transporting gas. Transporter includes gather-ing companies, pipeline companies and local distributioncompanies.
Underground Storage: A service that permits the injection oflarge quantities of natural gas into underground rockformations during periods of low market demand andwithdrawn during periods of peak market demand.
Utility Plant: All property and equipment used for the generation,transmission, and distribution of electricity and storage,transmission and distribution of gas.
Value at Risk (VaR): The potential loss or gain for an instrumentor portfolio from changes in market factors, for a specifiedtime period and at a specified confidence level.
Volatility: The degree to which the price of a commodity orsecurity fluctuates around some mean value. It is usuallymeasured as the variance or standard deviation of the price.
Wheeling: Electric utility operation wherein transmissionfacilities of one system are used to transmit power producedby another system.
page 24
Board of Directors
Gary L. NealeChairman, President andChief Executive OfficerNiSource Inc.Merrillville, Indiana
Stephen P. AdikRetired Vice ChairmanNiSource Inc.Merrillville, Indiana
Dr. Steven C. BeeringPresident EmeritusPurdue UniversityWest Lafayette, Indiana
Arthur J. DecioChairman and DirectorSkyline CorporationElkhart, Indiana
Dennis E. FosterRetired Vice ChairmanALLTEL CorporationLittle Rock, Arkansas
Ian M. RollandRetired Chairman andChief Executive OfficerLincoln NationalCorporationFort Wayne, Indiana
John W. ThompsonChairman and Chief Executive OfficerSymantec Corp.Cupertino, California
Richard L. ThompsonRetired Group PresidentCaterpillar Inc.Peoria, Illinois
Robert J. WelshChairman and Chief Executive OfficerWelsh Holdings, LLCMerrillville, Indiana
Dr. Carolyn Y. WooMartin J. Gillen Deanand Ray and Milann SiegfriedProfessor of Entrepreneurial StudiesUniversity of Notre DameMendoza College of BusinessNotre Dame, Indiana
Roger A. YoungRetired ChairmanBay State Gas CompanyWestborough, Massachusetts
NiSource Officers
Gary L. NealeChairman and Chief Executive Officer
Robert C. Skaggs, Jr.President
Christopher A. HelmsPipeline Group President
Michael W. O’DonnellExecutive Vice President andChief Financial Officer
S. LaNette ZimmermanExecutive Vice President,Human Resources andCommunications
Peter V. Fazio, Jr.Executive Vice President and General Counsel
Mark D. WyckoffSenior Vice President
Arthur E. Smith, Jr.Senior Vice President and Environmental Counsel
Jeffrey W. GrossmanVice President and Controller
Barbara S. McKayVice President, Communications
Larry J. FranciscoVice President, Audit
Dennis E. SenchakVice President, Investor Relations,Assistant Treasurer and AssistantSecretary
David J. VajdaVice President and Treasurer
Gary W. PottorffSecretary
801 E. 86th AvenueMerrillville, Indiana 46410-6272
Security Contacts:Transfer Agent, Registrar, Shareholder Records and Dividend Disbursing Agent
Account Maintenance:Mellon Investor ServicesPO Box 3315South Hackensack, NJ 07606-1916
Registered/Overnight Delivery:Mellon Investor Services Stock Transfer Department 85 Challenger Road Overpeck Centre Ridgefield Park, NJ 07660
Phone Contact:(888) 884-7790
Web Site:www.melloninvestor.com
Investor Relations Contacts:Investor RelationsNiSource Inc.801 E. 86th Ave.Merrillville, IN 46410
Dennis E. SenchakVice President, Investor Relations,Assistant Treasurer and Assistant Secretary
[email protected](219) 647-6085
Randy G. HulenDirector, Investor Relations
[email protected](219) 647-5688
Rae KozlowskiManager, Investor Relations
[email protected](219) 647-6083
Internet: http://www.nisource.com
Shareholder Information:Shareholder ServicesNiSource Inc.801 E. 86th Ave.Merrillville, IN 46410
www.nisource.com