nistir 6483, randomness testing of the advanced encryption
TRANSCRIPT

NISTIR 6483
Randomness Testing of the Advanced Encryption Standard Finalist Candidates
Juan Soto Lawrence Bassham U.S. DEPARTMENT OF COMMERCE Technology Administration Computer Security Division National Institute of Standards and Technology Gaithersburg, MD 20899
April 2000
U.S. DEPARTMENT OF COMMERCE William M. Daley, Secretary
TECHNOLOGY ADMINISTRATION Dr. Cheryl L. Shavers, Under Secretary of Commerce for Technology
NATIONAL INSTITUTE OF STANDARDS AND TECHNOLOGY Raymond G. Kammer, Director
Randomness Testing of the Advanced Encryption Standard Finalist Candidates1
Juan Soto and Lawrence Bassham Computer Security Division
National Institute of Standards and Technology 100 Bureau Drive, Stop 8930
Gaithersburg, MD 20899-8930 Email: [email protected], [email protected]
March 28, 2000
Abstract. Mars, RC6, Rijndael, Serpent and Twofish were selected as finalists for the Advanced Encryption Standard (AES). To evaluate the finalists’ suitability as random number generators, empirical statistical testing is commonly employed. Although it widely believed that these five algorithms are indeed random, randomness testing was conducted to show that there is empirical evidence supporting this belief. In this paper, NIST reports on the studies that were conducted on the finalists for the 192-bit key size and 256-bit key size. The results to date suggest that all five of the finalists appear to be random.
1 Introduction
During the Advanced Encryption Standard (AES) Round 1 analysis period, NIST conducted randomness tests focusing strictly on the 128-bit keysize case and reported on each of the fifteen candidate algorithms being considered for the standard [3]. On August 9, 1999, five encryption algorithms (i.e., Mars, RC6, Rijndael, Serpent and Twofish) were selected as finalist candidates for the AES.
During the AES Round 2 analysis period, NIST further evaluated the suitability of the five finalists as random number generators, focusing on the 192-bit and 256-bit keysize (under full round2 considerations) and the 128-bit keysize (under partial round3 considerations). As time permits, additional randomness testing efforts will be conducted.
This paper describes how the output for each of the finalist algorithms was collected and then evaluated for randomness. It discusses what was learned utilizing the NIST statistical tests [2] and offers an interpretation of the empirical results. In Section 2, the Randomness Testing Experimental Setup is defined and described. In Sections 3 and 4, the Full Round Testing and Partial Round Testing efforts are discussed, respectively. Lastly, in Section 5, Summary and Conclusion, a final interpretation of the test results is drawn.
2 Randomness Testing Experimental Setup
Randomness testing activities can be divided into two parts. NIST analyzed the output for each of the five algorithms under full round and partial round considerations. All randomness testing was based on the application of the NIST Statistical Test Suite. This suite consists of 16 core statistical tests that, under different parameter inputs, can be viewed as 189 statistical tests. Table 1 lists each of the core statistical
1 For up-to-date information on the AES development effort visit http://csrc.nist.gov/encryption/aes/ aes_home.htm. 2 That is, examination of the output of an encryption algorithm upon completion of all prescribed rounds. 3 That is, examination of the output of an encryption algorithm after each round for all prescribed rounds.

tests, followed by the number of P-values4 reported by each core test and the test identifier. Each P-value corresponds to the application of an individual statistical test on a single binary sequence. For a brief description of each of these tests, see Appendix A. Full details documenting the derivation and description of the tests may be found in a forthcoming NIST publication [2].
Statistical Test No. of P-values
Test ID Statistical Test No. of
P-values Test ID
Monobit 1 1 Periodic Template 1 157 Block Frequency 1 2 Universal Statistical 1 158 Cusum 2 3-4 Approximate Entropy 1 159 Runs 1 5 Random Excursions 8 160-167 Long Runs of Ones 1 6 Random Excursions
Variant 18 168-185
Rank 1 7 Serial 2 186-187 Spectral DFT 1 8 Lempel-Ziv Compression 1 188 Aperiodic Templates 148 9-156 Linear Complexity 1 189
Table 1. Breakdown of the 189 statistical tests applied during experimentation
Randomness testing was performed using the following strategy:
(a) Input parameters such as the sequence length, sample size, and significance level 5 were fixed for each sample6. These parameters were set at 220 bits, 300 binary sequences, and 0.01, respectively. For each binary sequence and each statistical test, a P-value was reported.
(b) For each P-value, a success/failure assessment was made based on whether or not it exceeded or fell below the pre-selected significance level.
(c) For each statistical test and each sample, two evaluations were made. First, the proportion of binary sequences in a sample that passed the statistical test was calculated. The P-value for this proportion is equal to the probability of observing a value equal to or greater than the calculated proportion. Second, an additional P-value was calculated, based on a c2 test (with nine degrees of freedom) applied to the P-values in the entire sample to ensure uniformity.
(d) For both measures described in step (c), an assessment was made. A sample was considered to have passed a statistical test if it satisfied both the proportion and uniformity assessments. If either of the two P-values in step (c) fell below 0.0001, then the sample was flagged as suspect7. If this occurred, additional samples were evaluated. Otherwise, the sample was believed to have satisfied the criterion for being random (from the point of view of a specific statistical test).
4 A P-value is the probability of obtaining a test statistic as large or larger than the one observed if the sequence is random. Hence, small values (conventionally, P-values < 0.05 or P-values < 0.01) are interpreted as evidence that a sequence is unlikely to be random. 5 The significance level was fixed at 0.01 in each experiment. Thus, the expected number of rejections is 1 out of every 100 binary sequences per sample. In practice, however, this will not necessarily be satisfied. 6 In addition, statistical test input parameters such as the block frequency block length, long runs substring length, aperiodic template length, periodic template length, universal statistical test block length, number of remaining blocks, number of initialization blocks, approximate entropy block length, serial test block length and linear complexity substring length were also fixed for each sample. They were set at 128, 10000, 9, 9, 7, 141577, 1280, 10, 16, and 500, respectively. 7 Based on the order (size) of the number of sequences and tests that were performed, 1 in 10,000 will not give an excessive number of rejections when a generator is good.
2

3 Full Round Testing (FRT)
FRT activities were conducted over a period of several months on multiple SUN Ultra8 workstations. All data was generated and evaluated online. Only the data used as the plaintext and the 192-bit and 256-bit keys were stored offline. These values were based on data generated using the Blum-Blum-Shub (BBS) pseudorandom bit generator9. All 189 statistical tests were applied to each data set as described in Appendix B.
3.1 Data Description
NIST harnessed and analyzed eight data types for each of the two keysizes (i.e., 192 and 256 bits) for each of the algorithms, for a total of 80 different data sets10. These data sets were selected based on the belief that they would be useful in evaluating the randomness of cryptographic algorithms. Table 2 lists the eight data types. For a description of the data types, see Appendix B.
Key Avalanche Plaintext Avalanche Plaintext/Ciphertext Correlation Cipher Block Chaining Mode Low Density Plaintext Low Density Keys High Density Plaintext High Density Keys
Table 2. Data types
3.2 Empirical Results & Analysis
The application of the aperiodic template11 statistical test on Serpent’s Plaintext/Ciphertext Correlation (based on 256-bit keys) yielded 12 rejections out of a sample of 300 binary sequences. According to the probability table in Appendix C, the P-value of such an event is 0.0000629219.
Subsequent experiments were conducted for this particular case. In all, a total of 1,167,600 binary sequences were evaluated. This constituted 3,892 repetitions of the original experiment. In no other instance did such an event occur. Therefore, the 12 rejections obtained from the original experiment could be considered as an anomaly. If the 3,892 samples were collectively viewed as a single data set, the resulting number of rejections was 11,758, a number well within acceptable limits (i.e., the ideal number of rejections would be 11,676).
4 Partial Round Testing (PRT)
Partial round testing activities were conducted over a period of several months on several SUN Ultra workstations. All data was generated and evaluated online. However, due to resource constraints, partial round testing was limited to the low-density plaintext case using 128-bit BBS generated keys. As in FRT, all 189 statistical tests were applied to each (round-by-round) data set.
8 "Certain commercial equipment, instruments, or materials are identified in this paper in order to specify the experimental procedure adequately. Such identification is not intended to imply recommendation or endorsement by the National Institute of Standards and Technology, nor is it intended to imply that the materials or equipment identified are necessarily the best available for the purpose." 9 The Blum-Blum-Shub pseudorandom bit generator (PRBG) was chosen because it has been shown to be a cryptographically secure pseudo-random bit generator. For additional information see page 186, Section 5.5.2 in [1]. 10 That is, 8 data types x 2 key sizes x 5 algorithms. 11 The specific template was 110010010.
3
4.1 Data Description
Testing was conducted on partial round versions of the algorithms under 128-bit keys. Each data set consisted of the low-density plaintexts described in Table 2 and Appendix B. Each data set was encrypted under a distinct, randomly chosen key. For each algorithm, the round outputs were evaluated against all of the applicable tests. Table 3 lists the earliest round for each algorithm at which the outputs appeared to be random in all of the tests. As one might expect, the outputs of all subsequent rounds also appeared to be random.
There were a few issues to address in defining partial round versions of the algorithms. If input whitening was prescribed (MARS, RC6, Rijndael, Twofish), then it was left intact; however, output whitening (MARS, RC6, Twofish) was omitted. In fact, the outputs of the final rounds for the algorithms were not considered at all, because full round testing was previously conducted for low-density plaintexts under 128bit keys during AES Round 1 analysis. Subkeys were applied in their original order, as were rounds, so that if a modified final round was prescribed (Rijndael, Serpent), then it was never used.
Thus, the round outputs of RC6 were evaluated from rounds 1 to 19; Rijndael, from rounds 1 to 9; and Serpent, from rounds 1 to 31. For technical reasons, Twofish rounds were evaluated in pairs12, namely, the even numbered rounds from 2 to 14. MARS has a heterogeneous structure, so three different partial round versions were defined. First, the 8 preliminary, unkeyed, “forward mixing” rounds were left intact, and the outputs of each of the 16 keyed, “core” rounds were evaluated. Second, the forward mixing was disabled, and the outputs of the 16 core rounds were evaluated. Third, the outputs of the 8 forward mixing rounds were evaluated.
4.2 Empirical Results & Analysis
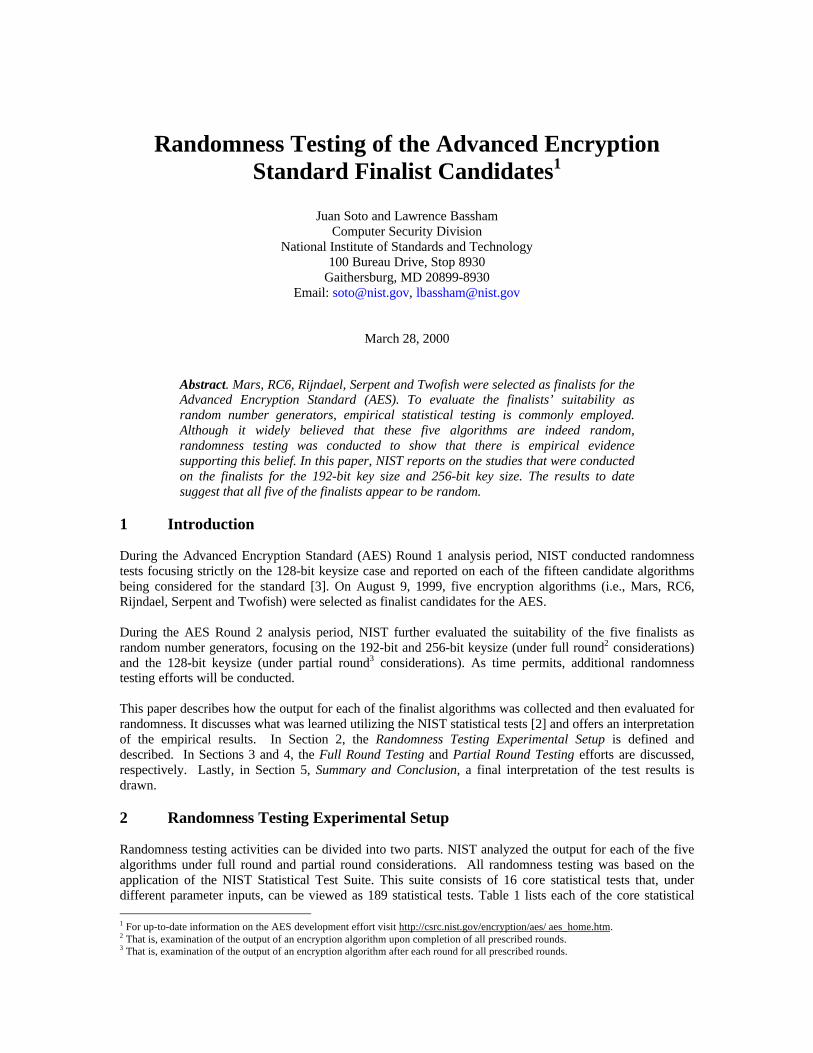
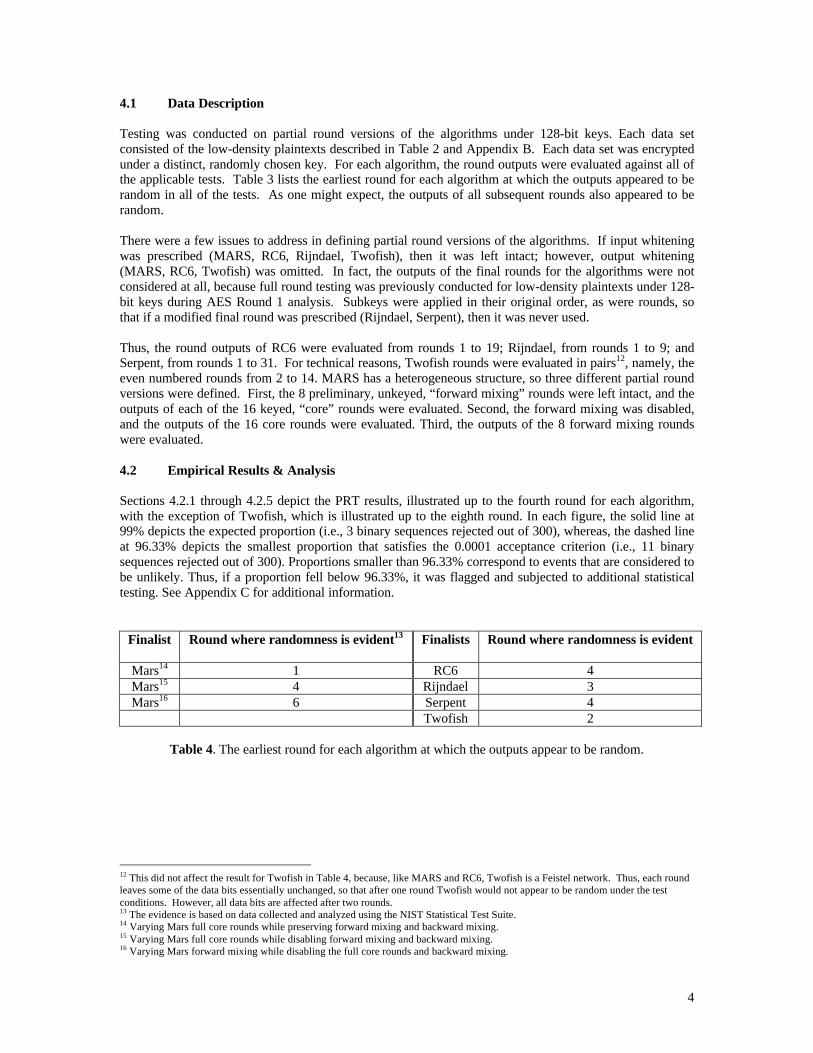
Sections 4.2.1 through 4.2.5 depict the PRT results, illustrated up to the fourth round for each algorithm, with the exception of Twofish, which is illustrated up to the eighth round. In each figure, the solid line at 99% depicts the expected proportion (i.e., 3 binary sequences rejected out of 300), whereas, the dashed line at 96.33% depicts the smallest proportion that satisfies the 0.0001 acceptance criterion (i.e., 11 binary sequences rejected out of 300). Proportions smaller than 96.33% correspond to events that are considered to be unlikely. Thus, if a proportion fell below 96.33%, it was flagged and subjected to additional statistical testing. See Appendix C for additional information.
Finalist Round where randomness is evident13 Finalists Round where randomness is evident
Mars14 1 RC6 4 Mars15 4 Rijndael 3 Mars16 6 Serpent 4
Twofish 2
Table 4. The earliest round for each algorithm at which the outputs appear to be random.
12 This did not affect the result for Twofish in Table 4, because, like MARS and RC6, Twofish is a Feistel network. Thus, each round leaves some of the data bits essentially unchanged, so that after one round Twofish would not appear to be random under the test conditions. However, all data bits are affected after two rounds. 13 The evidence is based on data collected and analyzed using the NIST Statistical Test Suite. 14 Varying Mars full core rounds while preserving forward mixing and backward mixing. 15 Varying Mars full core rounds while disabling forward mixing and backward mixing. 16 Varying Mars forward mixing while disabling the full core rounds and backward mixing.
4

4.2.1 Mars Algorithm17
Comments:
By the end of the first round, it is evident that the output from the algorithm appears to be random for all 189 statistical tests. Subsequent rounds produce similar statistics.
17 Varying Mars full core rounds while preserving forward mixing and backward mixing.
5
4.2.2 RC6 Algorithm
Comments:
At the end of the first round, it is evident that the output from the algorithm is non-random, given that the majority of the 189 statistical tests fall below 96%. At the end of the second and third round, it is still evident that the output is non-random. It isn’t until the end of the fourth round that the results appear to be random. Subsequent rounds produce statistics similar to those obtained at round 4.
6
4.2.3 Rijndael Algorithm
Comments:
At the end of the first round, it is evident that the output from the algorithm is non-random, given that the majority of the 189 statistical tests fall below 96%. At the end of the second round, it is still evident that the output is non-random. It isn’t until the end of the third round that the results appear to be random. Subsequent rounds produce statistics similar to those obtained at round 3.
7
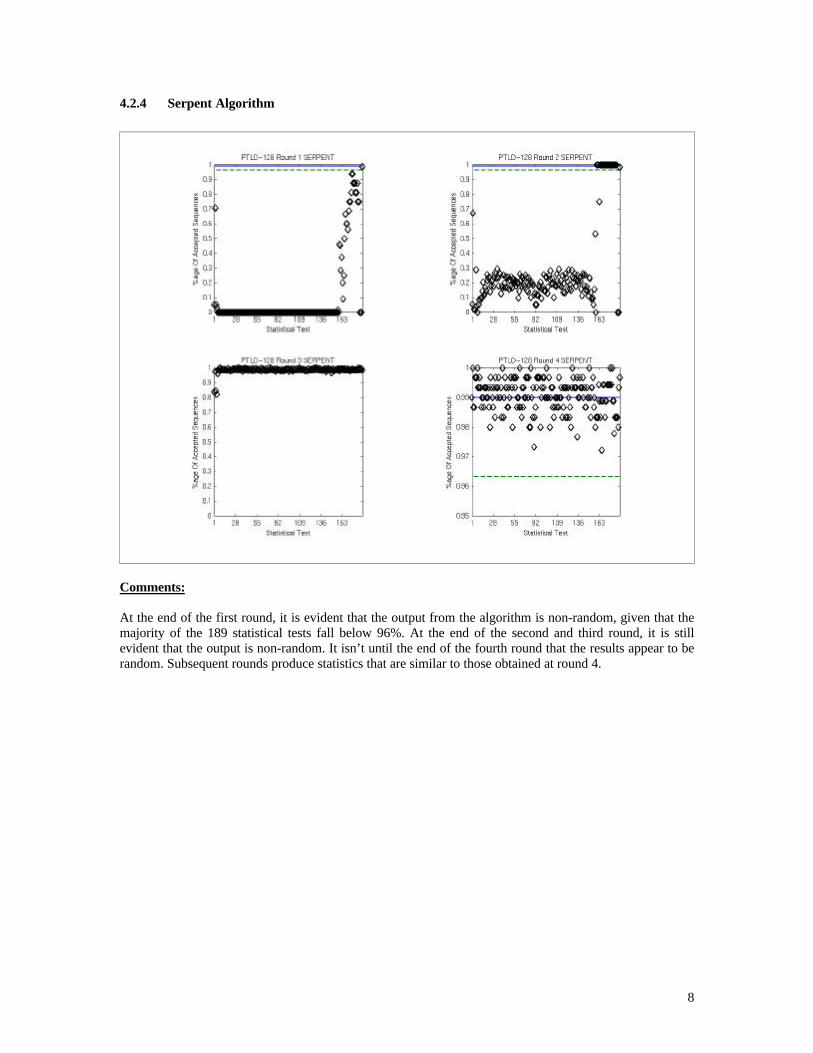
4.2.4 Serpent Algorithm
Comments:
At the end of the first round, it is evident that the output from the algorithm is non-random, given that the majority of the 189 statistical tests fall below 96%. At the end of the second and third round, it is still evident that the output is non-random. It isn’t until the end of the fourth round that the results appear to be random. Subsequent rounds produce statistics that are similar to those obtained at round 4.
8

4.2.5 Twofish Algorithm
Comments:
By the end of the second round (the first round pair), it is evident that the output from the algorithm appears to be random for all 189 statistical tests. Rounds 4 and 6 produce results similar to those produced at round 2. However, at round 8, test identifier 165 (i.e., the random excursions test18) appears to have failed the acceptance criterion rule with 9 rejections out of 183 binary sequences. Upon closer inspection, it was determined that only 183 of the 300 sequences were processed because of a random excursion test constraint. For 183 sequences, the cutoff percentage is 95.08%. With this cutoff point, test 165 passed the test. Subsequent rounds pairs produced statistics that were similar to those obtained for round 2, 4, and 6.
18 Specifically, we concentrate on state x = +2.
9

5 Summary and Conclusion
During the AES Round 2 analysis period, NIST further investigated the randomness of the output for each of the finalists. The range of analyses was extended beyond the 128-bit keysize case conducted during the AES Round 1 analysis period. In this study, empirical statistical testing was performed on the 192-bit and 256-bit key sizes under full round considerations. In addition, partial round testing was conducted for the 128-bit keysize case.
In each of these cases, a total of 189 statistical tests were applied on the different data sets. These tests collectively span many well-known properties that any good cryptographic algorithm should satisfy. These properties include the absence of any detectable correlation between plaintext/ciphertext pairs and the absence of any detectable bias due to single bit changes to a plaintext block, a 192-bit key or a 256-bit key.
In one instance there was a statistical anomaly. Serpent’s plaintext/ciphertext correlation (based on 256-bit keys) yielded 12 rejections out of a sample of 300 binary sequences, using the aperiodic template statistical test. Subsequent experiments were conducted, and no other anomalies were detected.
The results for the partial round testing, based on 128-bit key plaintext low density data, indicate that Mars achieves randomness at round 6, RC6 at round 4, Rijndael at round 3, Serpent at round 4, and Twofish at round 2.
In spite of an isolated statistical anomaly in Serpent, it is fair to state that all of the algorithms appear to have no detectable deviations from randomness.
Acknowledgments
We would like to acknowledge the efforts of Dr. Andrew Rukhin who derived the statistical tests, and Dr. Jim Nechvatal who proposed the types of data to be analyzed. We would like to also thank Dr. Morris Dworkin, Elaine Barker, Sharon Keller, Dr. Mark Levenson and members of the AES3 program committee for providing valuable comments regarding this paper.
References
[1] A. Meneses, P. van Oorschot and S. Vanstone, Handbook of Applied Cryptography, CRC Press, 1997.
[2] A. Rukhin, et. al., A Statistical Test Suite for the Validation of Random and Pseudo Random Number Generators for Cryptographic Applications19, NIST Special Publication (under preparation), Spring 2000.
[3] J. Soto, “Randomness Testing of the Advanced Encryption Standard Candidate Algorithms,” NIST IR 6390, September 1999.
[4] J. Soto, “Statistical Testing of Random Number Generators,” Proceedings of the 22nd National Information Systems Security Conference, Crystal City, Virginia, October 1999.
19 The NIST Special Publication and the accompanying software reference implementation will be released in spring 2000.
10

Appendix A Description of the Statistical Tests20
Monobit Test: The purpose of this test is to determine whether the number of ones and zeros in a sequence are approximately the same as would be expected for a truly random sequence.
Block Frequency Test: The purpose of the block frequency test is to determine whether the number of ones and zeros in each of M non-overlapping blocks created from a sequence appear to have a random distribution.
Cumulative Sums Forward (Reverse) Test: The purpose of the cumulative sums test is to determine whether the sum of the partial sequences occurring in the tested sequence is too large or too small.
Runs Test: The purpose of the runs test is to determine whether the number of runs of ones and zeros of various lengths is as expected for a random sequence. In particular, this test determines whether the oscillation between such substrings is too fast or too slow.
Long Runs of Ones Test: The purpose of this test is to determine whether the longest run of ones within the tested sequence is consistent with the longest run of ones that would be expected in a random sequence.
Rank Test: The purpose of this test is to check for linear dependence among fixed length substrings of the original sequence.
Discrete Fourier Transform (Spectral) Test: The purpose of this test is to detect periodic features (i.e., repetitive patterns that are near each other) in the tested sequence that would indicate a deviation from the assumption of randomness.
Aperiodic Templates Test: The purpose of this test is to reject sequences that exhibit too many occurrences of a given non-periodic (aperiodic) pattern.
Periodic Template Test: The purpose of this test is to reject sequences that show deviations from the expected number of runs of ones of a given length.
Universal Statistical Test: The purpose of the test is to detect whether or not the sequence can be significantly compressed without loss of information. A compressible sequence is considered to be nonrandom.
Approximate Entropy Test: The purpose of the test is to compare the frequency of overlapping blocks of two consecutive/adjacent lengths (m and m+1) against the expected result for a normally distributed sequence.
Random Excursion Test: The purpose of this test is to determine if the number of visits to a state within a random walk exceeds what one would expect for a random sequence.
Random Excursion Variant Test: The purpose of this test is to detect deviations from the distribution of the number of visits of a random walk to a certain state.
Serial Test: The purpose of this test is to determine whether the number of occurrences of m-bit overlapping patterns is approximately the same as would be expected for a random sequence.
Lempel-Ziv Complexity Test: The purpose of the test is to determine how far the tested sequence can be compressed. The sequence is considered to be non-random if it can be significantly compressed
Linear Complexity Test: The purpose of this test is to determine whether or not the sequence is complex enough to be considered random.
20 Detailed descriptions of these statistical tests may be found in [2].
11
Appendix B Description of the Data Types
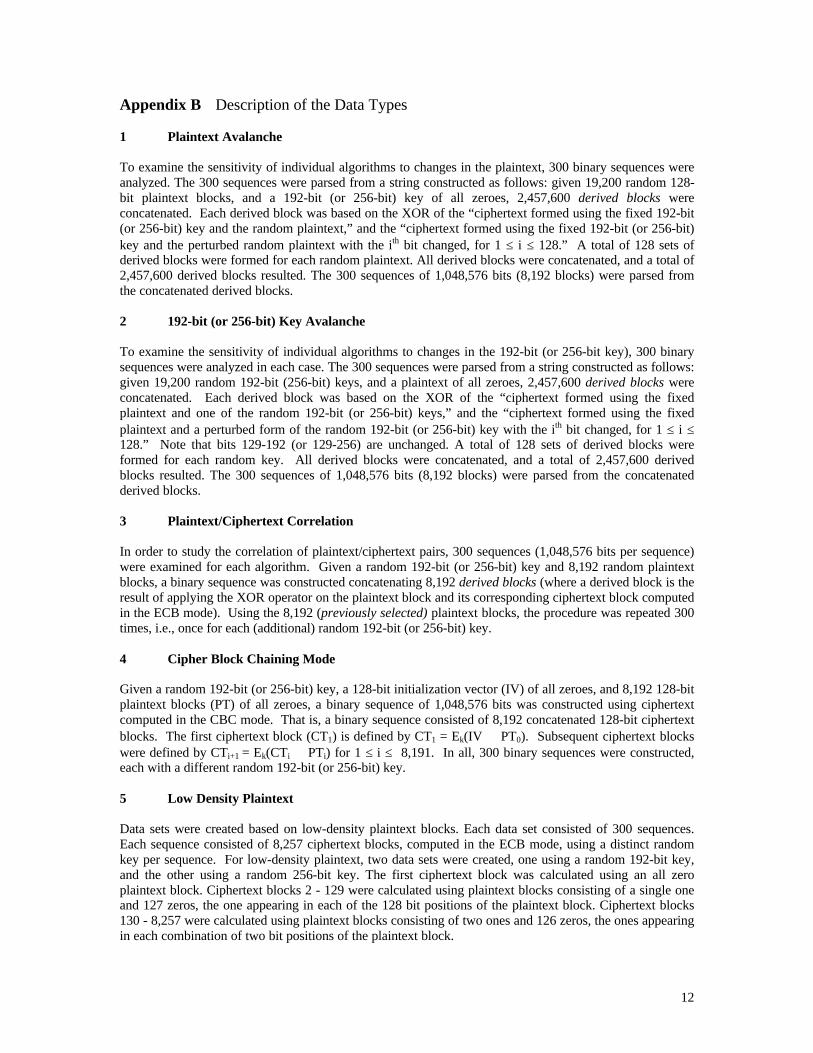
1 Plaintext Avalanche
To examine the sensitivity of individual algorithms to changes in the plaintext, 300 binary sequences were analyzed. The 300 sequences were parsed from a string constructed as follows: given 19,200 random 128bit plaintext blocks, and a 192-bit (or 256-bit) key of all zeroes, 2,457,600 derived blocks were concatenated. Each derived block was based on the XOR of the “ciphertext formed using the fixed 192-bit (or 256-bit) key and the random plaintext,” and the “ciphertext formed using the fixed 192-bit (or 256-bit) key and the perturbed random plaintext with the ith bit changed, for 1 £ i £ 128.” A total of 128 sets of derived blocks were formed for each random plaintext. All derived blocks were concatenated, and a total of 2,457,600 derived blocks resulted. The 300 sequences of 1,048,576 bits (8,192 blocks) were parsed from the concatenated derived blocks.
2 192-bit (or 256-bit) Key Avalanche
To examine the sensitivity of individual algorithms to changes in the 192-bit (or 256-bit key), 300 binary sequences were analyzed in each case. The 300 sequences were parsed from a string constructed as follows: given 19,200 random 192-bit (256-bit) keys, and a plaintext of all zeroes, 2,457,600 derived blocks were concatenated. Each derived block was based on the XOR of the “ciphertext formed using the fixed plaintext and one of the random 192-bit (or 256-bit) keys,” and the “ciphertext formed using the fixed plaintext and a perturbed form of the random 192-bit (or 256-bit) key with the ith bit changed, for 1 £ i £ 128.” Note that bits 129-192 (or 129-256) are unchanged. A total of 128 sets of derived blocks were formed for each random key. All derived blocks were concatenated, and a total of 2,457,600 derived blocks resulted. The 300 sequences of 1,048,576 bits (8,192 blocks) were parsed from the concatenated derived blocks.
3 Plaintext/Ciphertext Correlation
In order to study the correlation of plaintext/ciphertext pairs, 300 sequences (1,048,576 bits per sequence) were examined for each algorithm. Given a random 192-bit (or 256-bit) key and 8,192 random plaintext blocks, a binary sequence was constructed concatenating 8,192 derived blocks (where a derived block is the result of applying the XOR operator on the plaintext block and its corresponding ciphertext block computed in the ECB mode). Using the 8,192 (previously selected) plaintext blocks, the procedure was repeated 300 times, i.e., once for each (additional) random 192-bit (or 256-bit) key.
4 Cipher Block Chaining Mode
Given a random 192-bit (or 256-bit) key, a 128-bit initialization vector (IV) of all zeroes, and 8,192 128-bit plaintext blocks (PT) of all zeroes, a binary sequence of 1,048,576 bits was constructed using ciphertext computed in the CBC mode. That is, a binary sequence consisted of 8,192 concatenated 128-bit ciphertext blocks. The first ciphertext block (CT1) is defined by CT1 = Ek(IV ¯ PT0). Subsequent ciphertext blocks were defined by CTi+1 = Ek(CTi ¯ PTi) for 1 £ i £ 8,191. In all, 300 binary sequences were constructed, each with a different random 192-bit (or 256-bit) key.
5 Low Density Plaintext
Data sets were created based on low-density plaintext blocks. Each data set consisted of 300 sequences. Each sequence consisted of 8,257 ciphertext blocks, computed in the ECB mode, using a distinct random key per sequence. For low-density plaintext, two data sets were created, one using a random 192-bit key, and the other using a random 256-bit key. The first ciphertext block was calculated using an all zero plaintext block. Ciphertext blocks 2 - 129 were calculated using plaintext blocks consisting of a single one and 127 zeros, the one appearing in each of the 128 bit positions of the plaintext block. Ciphertext blocks 130 - 8,257 were calculated using plaintext blocks consisting of two ones and 126 zeros, the ones appearing in each combination of two bit positions of the plaintext block.
12
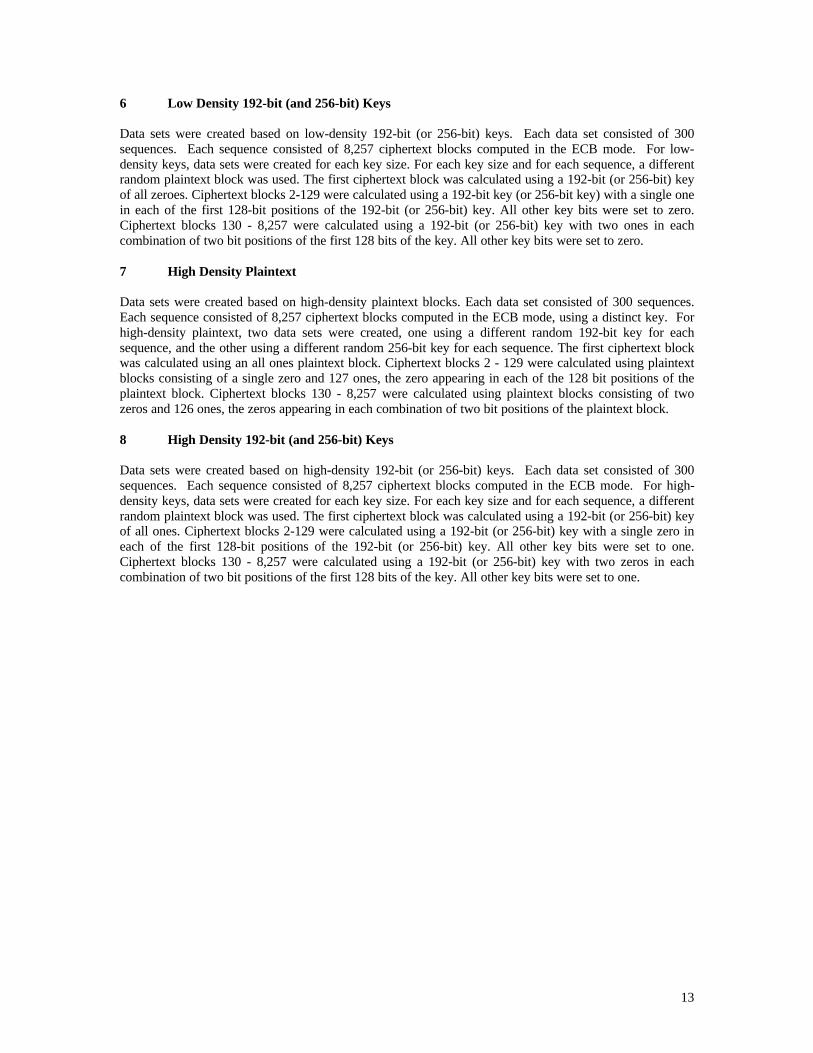
6 Low Density 192-bit (and 256-bit) Keys
Data sets were created based on low-density 192-bit (or 256-bit) keys. Each data set consisted of 300 sequences. Each sequence consisted of 8,257 ciphertext blocks computed in the ECB mode. For low-density keys, data sets were created for each key size. For each key size and for each sequence, a different random plaintext block was used. The first ciphertext block was calculated using a 192-bit (or 256-bit) key of all zeroes. Ciphertext blocks 2-129 were calculated using a 192-bit key (or 256-bit key) with a single one in each of the first 128-bit positions of the 192-bit (or 256-bit) key. All other key bits were set to zero. Ciphertext blocks 130 - 8,257 were calculated using a 192-bit (or 256-bit) key with two ones in each combination of two bit positions of the first 128 bits of the key. All other key bits were set to zero.
7 High Density Plaintext
Data sets were created based on high-density plaintext blocks. Each data set consisted of 300 sequences. Each sequence consisted of 8,257 ciphertext blocks computed in the ECB mode, using a distinct key. For high-density plaintext, two data sets were created, one using a different random 192-bit key for each sequence, and the other using a different random 256-bit key for each sequence. The first ciphertext block was calculated using an all ones plaintext block. Ciphertext blocks 2 - 129 were calculated using plaintext blocks consisting of a single zero and 127 ones, the zero appearing in each of the 128 bit positions of the plaintext block. Ciphertext blocks 130 - 8,257 were calculated using plaintext blocks consisting of two zeros and 126 ones, the zeros appearing in each combination of two bit positions of the plaintext block.
8 High Density 192-bit (and 256-bit) Keys
Data sets were created based on high-density 192-bit (or 256-bit) keys. Each data set consisted of 300 sequences. Each sequence consisted of 8,257 ciphertext blocks computed in the ECB mode. For high-density keys, data sets were created for each key size. For each key size and for each sequence, a different random plaintext block was used. The first ciphertext block was calculated using a 192-bit (or 256-bit) key of all ones. Ciphertext blocks 2-129 were calculated using a 192-bit (or 256-bit) key with a single zero in each of the first 128-bit positions of the 192-bit (or 256-bit) key. All other key bits were set to one. Ciphertext blocks 130 - 8,257 were calculated using a 192-bit (or 256-bit) key with two zeros in each combination of two bit positions of the first 128 bits of the key. All other key bits were set to one.
13
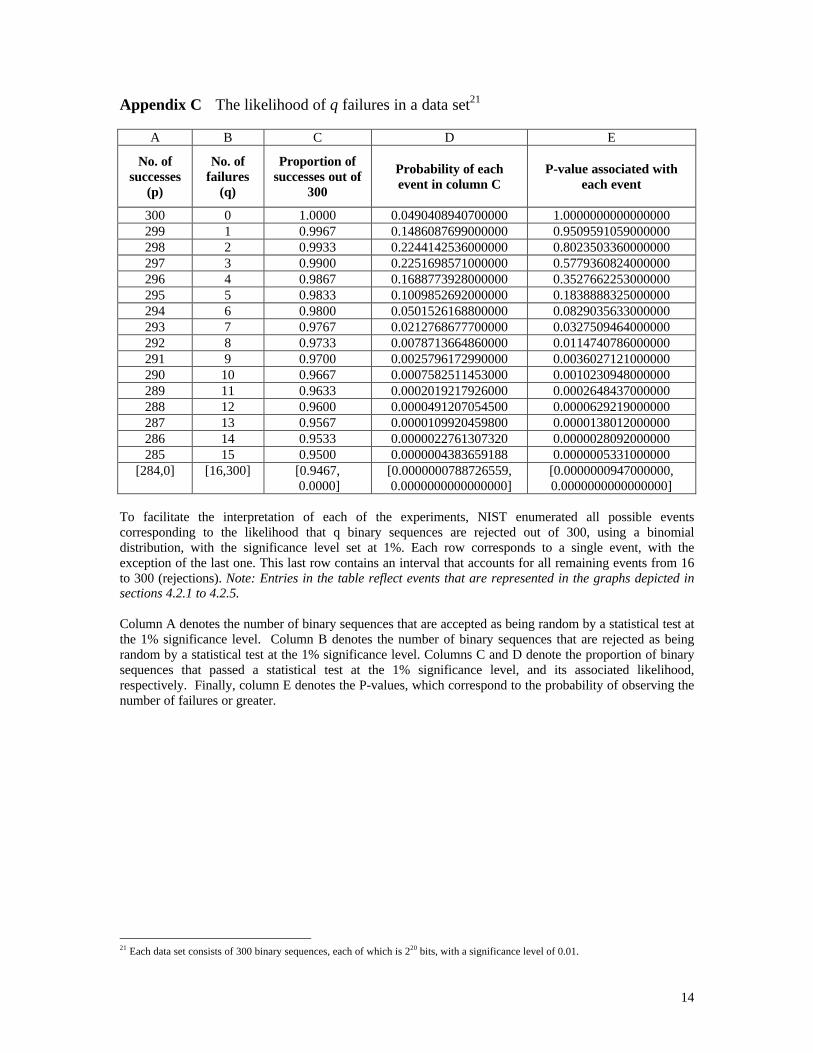
Appendix C The likelihood of q failures in a data set21
A B C D E
No. of successes
(p)
No. of failures
(q)
Proportion of successes out of
300
Probability of each event in column C
P-value associated with each event
300 0 1.0000 0.0490408940700000 1.0000000000000000 299 1 0.9967 0.1486087699000000 0.9509591059000000 298 2 0.9933 0.2244142536000000 0.8023503360000000 297 3 0.9900 0.2251698571000000 0.5779360824000000 296 4 0.9867 0.1688773928000000 0.3527662253000000 295 5 0.9833 0.1009852692000000 0.1838888325000000 294 6 0.9800 0.0501526168800000 0.0829035633000000 293 7 0.9767 0.0212768677700000 0.0327509464000000 292 8 0.9733 0.0078713664860000 0.0114740786000000 291 9 0.9700 0.0025796172990000 0.0036027121000000 290 10 0.9667 0.0007582511453000 0.0010230948000000 289 11 0.9633 0.0002019217926000 0.0002648437000000 288 12 0.9600 0.0000491207054500 0.0000629219000000 287 13 0.9567 0.0000109920459800 0.0000138012000000 286 14 0.9533 0.0000022761307320 0.0000028092000000 285 15 0.9500 0.0000004383659188 0.0000005331000000
[284,0] [16,300] [0.9467, 0.0000]
[0.0000000788726559, 0.0000000000000000]
[0.0000000947000000, 0.0000000000000000]
To facilitate the interpretation of each of the experiments, NIST enumerated all possible events corresponding to the likelihood that q binary sequences are rejected out of 300, using a binomial distribution, with the significance level set at 1%. Each row corresponds to a single event, with the exception of the last one. This last row contains an interval that accounts for all remaining events from 16 to 300 (rejections). Note: Entries in the table reflect events that are represented in the graphs depicted in sections 4.2.1 to 4.2.5.
Column A denotes the number of binary sequences that are accepted as being random by a statistical test at the 1% significance level. Column B denotes the number of binary sequences that are rejected as being random by a statistical test at the 1% significance level. Columns C and D denote the proportion of binary sequences that passed a statistical test at the 1% significance level, and its associated likelihood, respectively. Finally, column E denotes the P-values, which correspond to the probability of observing the number of failures or greater.
21 Each data set consists of 300 binary sequences, each of which is 220 bits, with a significance level of 0.01.
14