nitric oxide production from surface recombination of...
TRANSCRIPT
1
Nitric Oxide Production from Surface Recombination of
Oxygen and Nitrogen Atoms
Dušan A. Pejaković* and Jochen Marschall†
SRI International, Menlo Park, California 94025
Lian Duan‡ and M. Pino Martin§
Princeton University, Princeton, New Jersey 08544
* Research Physicist, Molecular Physics Laboratory; [email protected]. † Senior Research Scientist, Molecular Physics Laboratory; [email protected]. Senior Member AIAA. ‡ Graduate Student, Mechanical and Aerospace Engineering Department; [email protected]. § Assistant Professor, Mechanical and Aerospace Engineering Department; [email protected]. Senior Member AIAA.

2
Abstract
Experimental results are presented that support the surface-catalyzed production
of nitric oxide from the recombination of oxygen and nitrogen atoms on quartz. The
experiments employ two-photon laser induced fluorescence detection of atomic oxygen
and atomic nitrogen to characterize changes in gas-phase atom concentrations as the ratio
of O to N atoms is varied at the opening of a diffusion-tube side-arm reactor. The
measurements verify a correlation between decreased O-atom loss and enhanced N-atom
loss in N2/N/O mixtures. Computational simulations of the side-arm reactor with a multi-
species reaction-diffusion model strengthen the case for NO surface formation,
reproducing observed changes in O- and N-atom concentration profiles with varying O/N
ratios at the side-arm entrance when surface-catalyzed NO production is included in the
boundary conditions.

3
Nomenclature
c concentration or molar density, mole m-3
D diffusion coefficient, m2 s-1
F volumetric flow rate, sccm
rsf , branching fraction of reactant s into product r
j diffusive mass flux, kg m-2 s-1
Bk Boltzmann’s constant 1.381 × 10⁻²³ J K-1
L side-arm length, m
M molar mass, kg mole-1
AvroN Avogadro’s number, 6.022 × 10²³ mol-1
P pressure, Pa
R side-arm radius, m
r radial side-arm coordinate, m
ℜ universal gas constant, 8.314 J mole-1 K-1
T temperature, K
v bulk flow speed, m s-1
v average thermal speed, m s-1
4
υ diffusion velocity, m s-1
w gas-phase production rate, kg m-3 s-1
ww surface production rate, kg m-2 s-1
x mole fraction
z axial side-arm coordinate, m
( )1,1rsΩπ collision integral, m2
sω weighting factor, Eq. 4
ρ mass density, kg m-3
γ loss probability
μ viscosity, Pa-s
Subscripts
O, O2, N, N2, NO species
s species index
r species index or radial direction
w wall
z axial direction

5
I. Introduction
Heterogeneous recombination of dissociated species on the surface of thermal
protection system (TPS) materials is known to contribute to the aerothermal heating of
hypersonic reentry vehicles. In the Earth’s atmosphere, oxygen and nitrogen atoms are
generated in the shock layer ahead of leading edges during hypersonic flight. Modeling
O- and N-atom surface-catalyzed recombination is an important part of computational
fluid dynamics (CFD) simulations that predict aerothermal heating as a function of flight
trajectory.
Traditionally, CFD aerothermal heating computations have treated oxygen and
nitrogen recombination as two uncoupled parallel processes, O + O → O2 and
N + N → N2, neglecting the possibility of NO formation via O + N surface reactions.
This choice is partly a matter of computational convenience and partly due to the lack of
experimental information on the importance of the NO formation pathway. More recent
modeling efforts have introduced finite rate kinetic models to better capture the physics
of surface catalytic reactions.1-7 In at least one case, the inclusion of NO surface
formation in a finite-rate surface chemistry model seems to improve agreement between
aerothermal heating computations and measured flight data.5 Strong support for NO
surface formation is also provided by the in situ laser-induced fluorescence (LIF)
detection of different NO concentrations in front of different materials tested in a plasma
wind tunnel.8
6
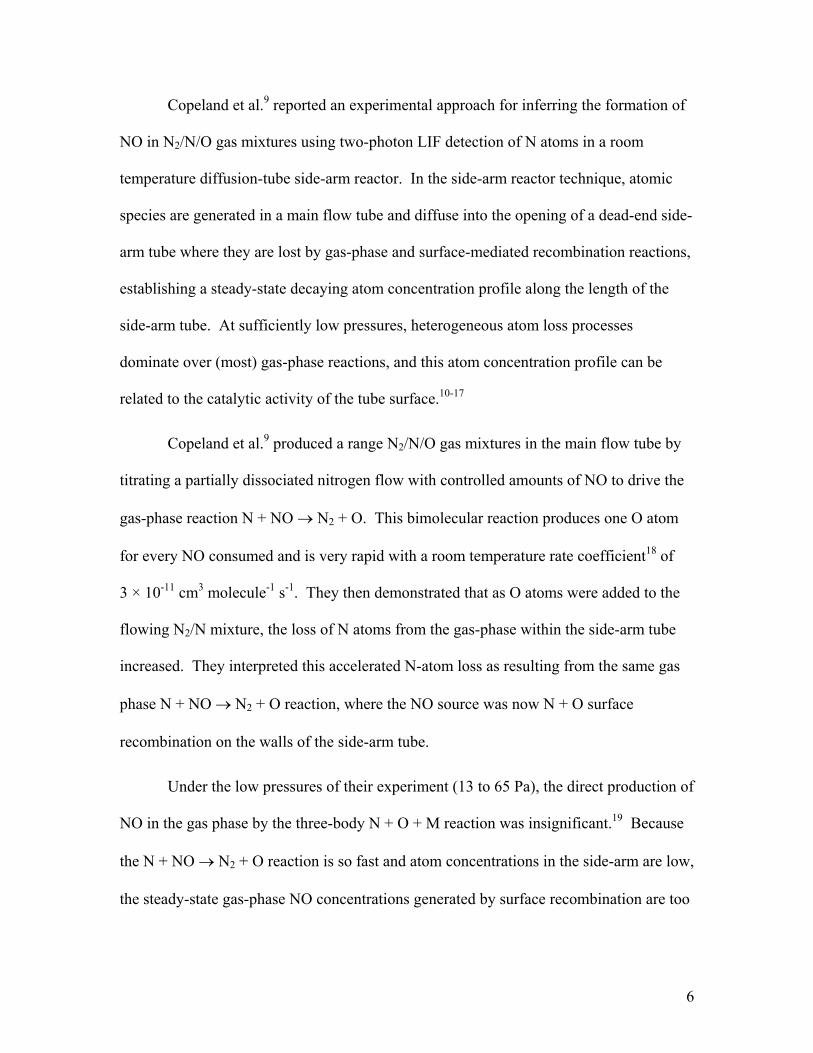
Copeland et al.9 reported an experimental approach for inferring the formation of
NO in N2/N/O gas mixtures using two-photon LIF detection of N atoms in a room
temperature diffusion-tube side-arm reactor. In the side-arm reactor technique, atomic
species are generated in a main flow tube and diffuse into the opening of a dead-end side-
arm tube where they are lost by gas-phase and surface-mediated recombination reactions,
establishing a steady-state decaying atom concentration profile along the length of the
side-arm tube. At sufficiently low pressures, heterogeneous atom loss processes
dominate over (most) gas-phase reactions, and this atom concentration profile can be
related to the catalytic activity of the tube surface.10-17
Copeland et al.9 produced a range N2/N/O gas mixtures in the main flow tube by
titrating a partially dissociated nitrogen flow with controlled amounts of NO to drive the
gas-phase reaction N + NO → N2 + O. This bimolecular reaction produces one O atom
for every NO consumed and is very rapid with a room temperature rate coefficient18 of
3 × 10-11 cm3 molecule-1 s-1. They then demonstrated that as O atoms were added to the
flowing N2/N mixture, the loss of N atoms from the gas-phase within the side-arm tube
increased. They interpreted this accelerated N-atom loss as resulting from the same gas
phase N + NO → N2 + O reaction, where the NO source was now N + O surface
recombination on the walls of the side-arm tube.
Under the low pressures of their experiment (13 to 65 Pa), the direct production of
NO in the gas phase by the three-body N + O + M reaction was insignificant.19 Because
the N + NO → N2 + O reaction is so fast and atom concentrations in the side-arm are low,
the steady-state gas-phase NO concentrations generated by surface recombination are too
7
small for direct LIF detection, and NO surface formation must be inferred indirectly from
observed changes in atom concentrations.
Copeland et al.9 suggested a further check of their interpretation: if surface NO
formation was indeed occurring, O-atom loss from the gas-phase should decrease with
the addition of N atoms, since each reaction event N + NO regenerates a gas-phase O-
atom. However, they did not perform O-atom LIF measurements to confirm this.
We have repeated and extended the measurements of Copeland et al.9 by adding,
i) a more powerful discharge source for N-atom production, ii) the capability for
sequential N-atom and O-atom LIF diagnostics, and iii) simultaneous concentration
measurements at four different side-arm locations. The new experiments confirm the
predicted correlation of decreased O-atom loss with enhanced N-atom loss, thus
strengthening the case for surface production of NO. We investigate the relative
importance of the NO surface production pathway to the O + O and N + N surface
recombination, by simulating the experimental results using a multi-species reaction-
diffusion model.
II. Experiment
The layout of our experiment is shown in Fig.1. A partially-dissociated nitrogen
flow is produced by metering nitrogen through a 6 kW microwave discharge using a 500
standard cubic centimeter per minute (sccm) Tylan mass flow controller. The main tube
is made of glass and the side-arm tube is made of GE214 quartz. With valve 1 open and
valve 2 closed, the partially-dissociated gas flows down the main arm, past the opening of
8
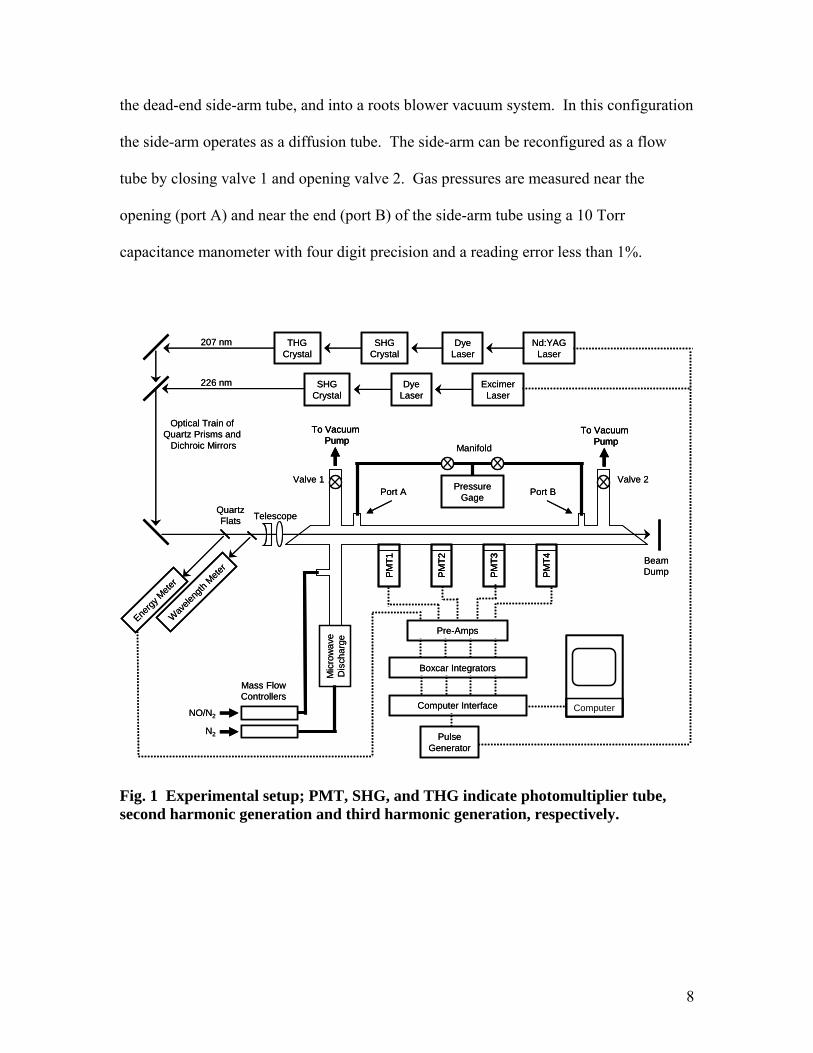
the dead-end side-arm tube, and into a roots blower vacuum system. In this configuration
the side-arm operates as a diffusion tube. The side-arm can be reconfigured as a flow
tube by closing valve 1 and opening valve 2. Gas pressures are measured near the
opening (port A) and near the end (port B) of the side-arm tube using a 10 Torr
capacitance manometer with four digit precision and a reading error less than 1%.
Optical Train of Quartz Prisms and
Dichroic Mirrors
Valve 1Port BPort A
Telescope
PMT3
PMT4
Mic
row
ave
Dis
char
ge
Energy
Mete
r
QuartzFlats
Computer
Mass FlowControllers
N2
NO/N2
PressureGage
To VacuumPump
SHGCrystal
DyeLaser
ExcimerLaser
To VacuumPump
Valve 2
Wav
eleng
th Mete
r
Pre-Amps
Boxcar Integrators
Computer Interface
PulseGenerator
PMT1 Beam
Dump
SHGCrystal
DyeLaser
Nd:YAGLaser
THGCrystal
Manifold
226 nm
207 nm
PMT2
Optical Train of Quartz Prisms and
Dichroic Mirrors
Valve 1Port BPort A
Telescope
PMT3
PMT3
PMT4
PMT4
Mic
row
ave
Dis
char
ge
Energy
Mete
r
QuartzFlats
ComputerComputer
Mass FlowControllers
N2
NO/N2
PressureGage
To VacuumPump
To VacuumPump
SHGCrystal
DyeLaser
ExcimerLaser
To VacuumPump
To VacuumPump
Valve 2
Wav
eleng
th Mete
r
Pre-Amps
Boxcar Integrators
Computer Interface
PulseGenerator
PMT1
PMT1 Beam
Dump
SHGCrystal
DyeLaser
Nd:YAGLaser
THGCrystal
Manifold
226 nm
207 nm
PMT2
PMT2
Fig. 1 Experimental setup; PMT, SHG, and THG indicate photomultiplier tube, second harmonic generation and third harmonic generation, respectively.

9
Species detection was accomplished using well-known 2-photon LIF schemes:
excitation at 226 nm followed by fluorescence at 845 nm for O-atoms20,21 and excitation
at 207 nm followed by fluorescence at 745 nm for N-atoms.22 For O-atom LIF, a
Lambda-Physik ENG 103 XeCl Excimer laser was used to pump a Lambda-Physik FL
3002 dye laser filled with Coumarin 47 laser dye dissolved in methanol. The resulting
tunable blue light near 452 nm was frequency-doubled using a type-B beta barium-borate
(BBO) crystal to produce 226 nm radiation. For N-atom LIF, tunable red light near 621
nm was produced by pumping a Quanta-Ray MC1 dye laser filled with Rhodamine 640
dissolved in methanol, with the second harmonic output of a Quanta-Ray DCR-3
Nd:YAG laser. The red light was frequency-tripled to produce 207 nm radiation using
type-2 and type-C BBO crystals for frequency doubling and frequency mixing,
respectively.
The two ultraviolet laser beams were alternately directed through a quartz
Brewster angle window down the centerline of the side-arm tube using different
combinations of dichroic mirrors, quartz prisms and collimating optics. A Pellin-Broca
prism was used to separate visible from ultraviolet light during the O-atom detection
experiments; dichroic mirrors were sufficient to separate visible from UV light during the
N-atom experiments. Quartz flats were used to direct small fractions of the laser beam
into a Molectron pyroelectric energy meter and into a Coherent wavemeter, to monitor
laser pulse energy and wavelength, respectively. The ultraviolet excitation energy per
laser pulse was ~0.5 mJ for O-atom detection and ~0.1 mJ for N-atom detection.
Fluorescence was collected at right angles to the side-arm tube by four red-
sensitive Hamamatsu photomultiplier tubes (R636) in gated sockets, fitted with 3-nm

10
bandwidth interference filters centered on 845 nm for O-atom detection and 745 nm for
N-atom detection. PMT signals were amplified by a factor of five and averaged over
150 ns wide gates using Stanford Research Systems (SRS) boxcar integrators. Data
acquisition and laser firing were synchronized at 10 Hz using a SRS digital delay
generator. Automation of the experiment and data collection was performed by a
personal computer using LabView software.
The concentration of O atoms in the main gas flow was controlled by adding a
1%NO in N2 gas mixture to the partially-dissociate nitrogen flow upstream of the side-
arm opening. At the N + NO titration endpoint all N atoms are consumed and replaced in
the flow by O atoms. The titration endpoint can be detected by the disappearance of the
N-atom LIF signal and the leveling off of the O-atom LIF signal.
The experiments we report were conducted at 298 K, with a 44.4 sccm flow of N2
into the main arm and the discharge operating at 40% of its maximum capacity
(corresponding to ~2.4 kW.) The pressure at port A before any addition of the NO/N2
gas mixture at the titration port was adjusted to be 60 Pa in both flow tube and diffusion
tube experiments, by throttling the flow with the appropriate valve. The maximum gas
flow added at the titration port was ~6 sccm, which increased the pressure at port A by
about 1.3 Pa in both flow and diffusion tube modes. In flow tube mode, the pressure
difference between ports A and B was approximately 5.3 Pa for all levels of added
titration gas flows, resulting in bulk flow velocities ranging from about 3.6 to 3.85 m/s at
the different PMT locations. Important experimental dimensions are shown in Fig. 2.
The spacing between PMTs is 25.4 cm and the spacing between pressure ports A and B is
120 cm. The inner diameter of the side-arm tube is 2.2 cm.

11
PA PB
PMT1 PMT2 PMT3 PMT4
9.7 7.5 25.4 25.425.4 36.3 6.013.0 11.0
Partially-dissociatedgas flow
V1 V2
24.4
Titrationport
Pt
μW
~180
L = 146.7
R = 1.1PA PB
PMT1 PMT2 PMT3 PMT4
9.7 7.5 25.4 25.425.4 36.3 6.013.0 11.0
Partially-dissociatedgas flow
V1 V2
24.4
Titrationport
Pt
μW
~180
L = 146.7
R = 1.1
Fig. 2 Important side-arm dimensions (in cm); drawing not to scale.
III. Experimental Results
Qualitative Behavior
Figures 3a-d show the variation in relative atom concentration as a function of the
flow rate of NO added at the titration port for both N atoms and O atoms with the side-
arm configured as either a flow tube or a diffusion tube. The raw LIF data collected by
each PMT were corrected for scattered light contributions by subtracting the off-
resonance signals (corrections were always 3% or less of the total signal), normalized by
the square of the laser pulse energy, and averaged over at least 200 laser shots at each
added NO flow setting. The averaged data reflect changes in atom concentration at the
12
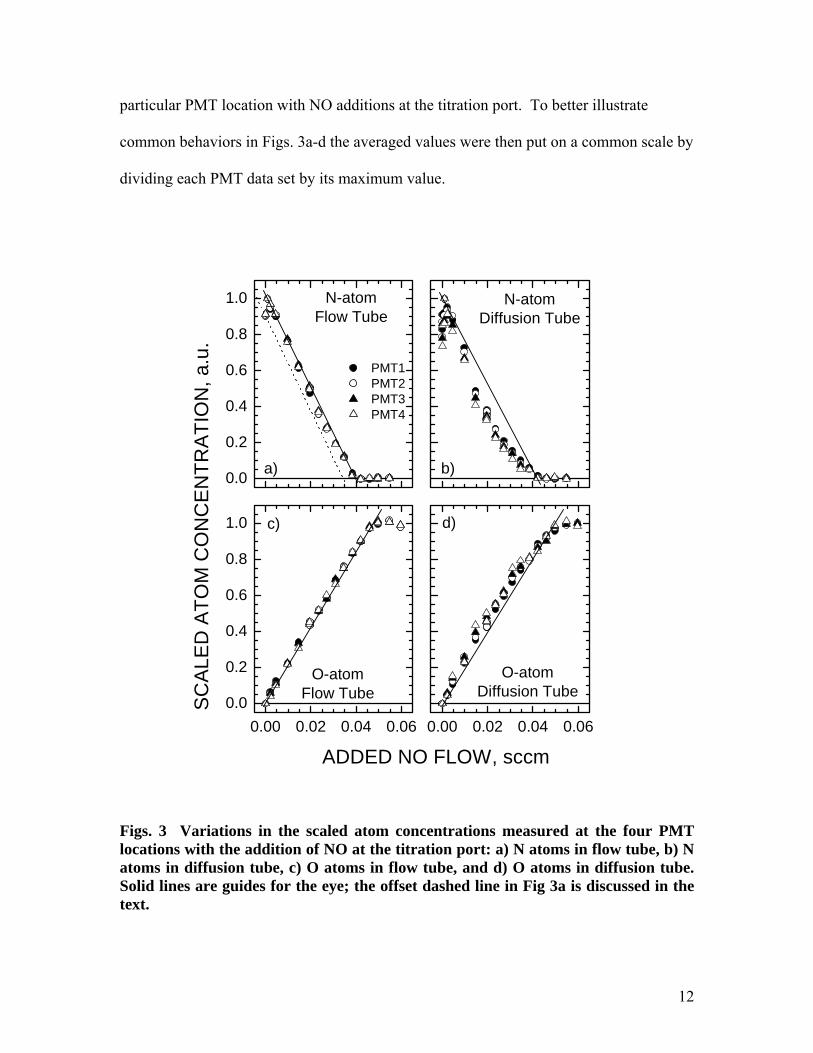
particular PMT location with NO additions at the titration port. To better illustrate
common behaviors in Figs. 3a-d the averaged values were then put on a common scale by
dividing each PMT data set by its maximum value.
0.00 0.02 0.04 0.060.0
0.2
0.4
0.6
0.8
1.0
0.00 0.02 0.04 0.06
0.0
0.2
0.4
0.6
0.8
1.0
c)
O-atomFlow Tube
ADDED NO FLOW, sccm
d)
O-atomDiffusion Tube
b)
N-atomDiffusion Tube
a)
N-atomFlow Tube
PMT1 PMT2 PMT3 PMT4
SC
ALE
D A
TOM
CO
NC
EN
TRA
TIO
N, a
.u.
Figs. 3 Variations in the scaled atom concentrations measured at the four PMT locations with the addition of NO at the titration port: a) N atoms in flow tube, b) N atoms in diffusion tube, c) O atoms in flow tube, and d) O atoms in diffusion tube. Solid lines are guides for the eye; the offset dashed line in Fig 3a is discussed in the text.

13
With the side-arm tube configured as a flow tube, both the N-atom and the
O-atom concentrations vary approximately linearly as NO is added at the titration port
(except in the region near zero added NO in the N-atom figures; this is discussed in the
following subsection.) When the reactor is switched to diffusion tube mode clear
deviations from this linear dependence are evident.
In Fig. 3b the N-atom concentrations decrease faster with added NO, producing a
concave profile, while in Fig. 3d the O-atom profile becomes convex, consistent with a
faster rise in O-atom concentrations with added NO. The result shown in Fig. 3b
reproduces the experimental observations of Copeland et al.9 for N atoms, and the result
shown in Fig. 3d confirms their predictions for O atoms. Copeland et al.9 also found a
trend of increasing deviation from linearity with increasing distance from the side-arm
opening. Despite experimental scatter, similar trends are found in the present
measurements, and especially when comparing PMT1 (solid circles) and PMT4 (open
triangles) data points near the midpoint of the titration curve. Thus, the current
measurements support and strengthen the hypothesis of NO formation by surface
reactions.
In order to compare experimental data with the predictions of a multi-species
reaction-diffusion model, the scaled measurements of Figs. 3b and 3d must corrected for
variations in LIF detection sensitivities at the different PMT locations and the absolute
atom concentrations at the side-arm opening must be determined.
Concentration Estimates
Estimates of the atom concentrations at the side-arm opening can be made from
the titration endpoints under flow tube conditions, however there are two complications:
14
determining the exact endpoint and interpreting the initial rise of the N-atom signal with
the addition of small amounts of NO (Fig 3a.)
The titration endpoints, where the N-atom LIF signal vanishes and the O-atom
LIF signal levels off, are roughly 0.04 sccm NO in Fig. 3a and 0.045 sccm NO in Fig. 3c.
This difference is likely a reflection of day-to-day repeatability (N-atom and O-atom
measurements were conducted on different days), as well as experimental uncertainty
associated with detecting a sharp endpoint.
Below the endpoint, the O-atom concentration rises linearly from zero with NO
addition until the endpoint is reached where all atomic nitrogen has been consumed.
Above the endpoint the O-atom concentration should remain constant. If we choose
0.0425 sccm NO as the average endpoint, the O-atom concentration is computed from the
measured temperature, pressure and gas flows as ~2.11 × 10⁻⁵ mol m-3 with a
1-σ uncertainty of ~25%. It is shown in the following section, that O-atom losses on the
walls between the titration port and side-arm entrance are small and easily absorbed in
this error estimate.
If the N + NO → N2 + O reaction is the dominant reactive process, the O-atom
endpoint concentration should also equal the N-atom number density without added NO.
However, the N-atom concentration profiles in Figs. 3a and 3b show an initial sharp
increase with the addition of small amounts of NO, in contrast to the immediate N-atom
loss anticipated from the fast N + NO reaction. Similar behaviors have been documented
by other researchers working with fast flow and/or high power nitrogen discharge
systems.23-25

15
Two main explanations have been proposed: 1) NO addition causes a reduction in
N-atom surface losses, or 2) NO addition catalyzes additional dissociation of
electronically or vibrationally-excited nitrogen molecules, N2*. It is possible to construct
kinetic models for both mechanisms that can mimic the experimental observations.23
In our system, NO is injected into the flow near the tube centerline and causes a
very rapid rise in the N-atom LIF signal even when the concentration of NO is ~10 times
lower than the N-atom concentration. In order to decrease heterogeneous losses of
N atoms either NO or the O atoms produced by N + NO reaction must reach the surface
and dominate the competition for surface sites. It seems unlikely that NO could dominate
surface coverage under these conditions, since N atoms are both in excess and should
have a much stronger driving force (energy reduction) for chemisorption. Density
functional theory computations by Arasa et al.26, suggest O atoms have a slightly greater
adsorption energy on SiO2 than N atoms, but that both energies are high and initial
sticking coefficients are similar.26 More recent atomistic simulations of Cozmuta27
predict that O-atom adsorption energies are higher than N-atom adsorption energies on
silica surfaces and that O-atom adsorption dominates over N-atom adsorption in gas
mixtures containing both species.
The present experiments were carried out at similar total pressures, temperatures
and flow rates to those of Copeland et al.9 who did not observe an initial rise in N-atom
concentration with added NO. It is possible that Copeland et al. did not collect titration
data with sufficient resolution in added NO flow to observe the initial N-atom signal rise.
However our microwave discharge source also operates at much higher powers (2.4 kW
vs. 100 W) and is expected to generate much higher concentrations of excited nitrogen
16
species. Any reduction of N-atom surface recombination because of NO addition should
be similar in both sets of experiments, however catalytic dissociation of N2* upon NO
addition would be more easily observed in our discharge system.
Within the catalytic dissociation model, the initial rise in the N-atom
concentration is explained by a net reaction NO + N2* → NO + N +N, where the reaction
rate is faster than the N + NO rate. The subsequent N-atom concentration maximum and
a linear decay with added NO is explained by the depletion of N2*, the concentration of
which is presumably lower at the titration port than that of N atoms. Since the slope of
the linear decay then simply reflects removal of N atoms by NO, the endpoint
corresponding to the initial N-atom concentration can be estimated from a parallel line
(the dashed line in Fig. 3a) as approximately 0.035 sccm, or about 12.5% lower than the
observed endpoint. The initial N-atom concentration corresponding to an average
observed endpoint of 0.0425 sccm NO is then ~1.84 × 10⁻⁵ mol m-3.
LIF Signal Corrections
The LIF signal magnitudes collected from each PMT depend on many factors in
addition to the local atom concentration, such as optical alignment, PMT sensitivity, filter
transmission, and excitation volume and laser beam geometry. For a stable species, these
factors can be determined for each PMT by filling the reactor with a uniform static
concentration and comparing collected LIF signals, but this is not possible for reactive
species like O and N atoms that are lost on the reactor walls. The closest approximation
to uniform atom concentrations that can be obtained in our system is under flow tube
conditions. However, the signal ratios collected in flow-tube mode still need to be
adjusted for differences in atomic concentration at the different PMT locations caused by

17
pressure gradients and heterogeneous atom losses, before they can be used to normalize
diffusion tube measurements.
The Hagen-Poiseulli relation28 can be used together with the ideal gas law, the
measured pressures at ports A and B, the measured N2 flow rates and the known reactor
distances to compute the total gas pressure at each PMT location, assuming that
molecular nitrogen dominates the transport properties with a viscosity of 17.77 × 10⁻⁶
Pa-s at 298 K.29 The bulk flow speed, v , can be computed at each location from the
pressure and N2 flow rate, using mass conservation and the ideal gas law.
The atom loss due to heterogeneous recombination between PMT locations are
estimated from a simple one-dimensional first-order model that equates the difference in
the atom flow between z and zz δ+ to the losses incurred on the wall over this distance.
This model is described by the differential equation
( ) cRv
dzvcd
2γ
−= , (1a)
where R is the tube radius, c is the atom concentration, v is the bulk flow speed, v is
the average thermal speed of the atoms MT πℜ8 , andγ is the estimated loss
probability (the fraction of atom-surface collisions which result in permanent removal of
the atom from the gas phase). The value of γ is uncertain, but as a first approximation
can be taken in the range ~1-10 × 10-5 for O and N atoms on quartz.12
18
Defining the representative atom concentration over zδ as avevvcc ≅ allows
integration of Eq. (1a) to give
( )( )
( ) ( )⎟⎟⎠
⎞⎜⎜⎝
⎛ −−=⎟⎟
⎠
⎞⎜⎜⎝
⎛ −−=
aveave Rvzzv
PP
Rvzzv
vv
zczc
2exp
2exp 12
2
112
1
2
2
1 γγ , (1b)
where avev is the average flow velocity between locations 1z and 2z , and the substitution
2112 PPvv = follows from the ideal gas law and mass conservation. Eq. (1b) allows
estimation of the combined effects of pressure difference and wall loss on the local atom
concentrations between two PMT positions along the flow tube.
For N-atom LIF calibration, flow tube measurements were made without added
NO flow. For O-atom LIF calibration, NO was added just below the titration endpoint.
Table 1 lists the pressure ratios for the different PMT locations under our flow
conditions, as well as the estimated ratios of atom concentration for different assumed
values of γ . Pressure variations are small, amounting to only a few percent. However,
wall losses can potentially change the atom concentrations by several 10’s of percent
along the flow tube, depending on the loss probabilities assumed.
We choose the value 5101 −×== NO γγ in our estimates of wall loss and show
later that this produces reasonable agreement between simulations and experiment. Table
2 compares the measured PMT signal ratios in flow tube mode to the pressure and wall
loss corrected PMT signal ratios.
19
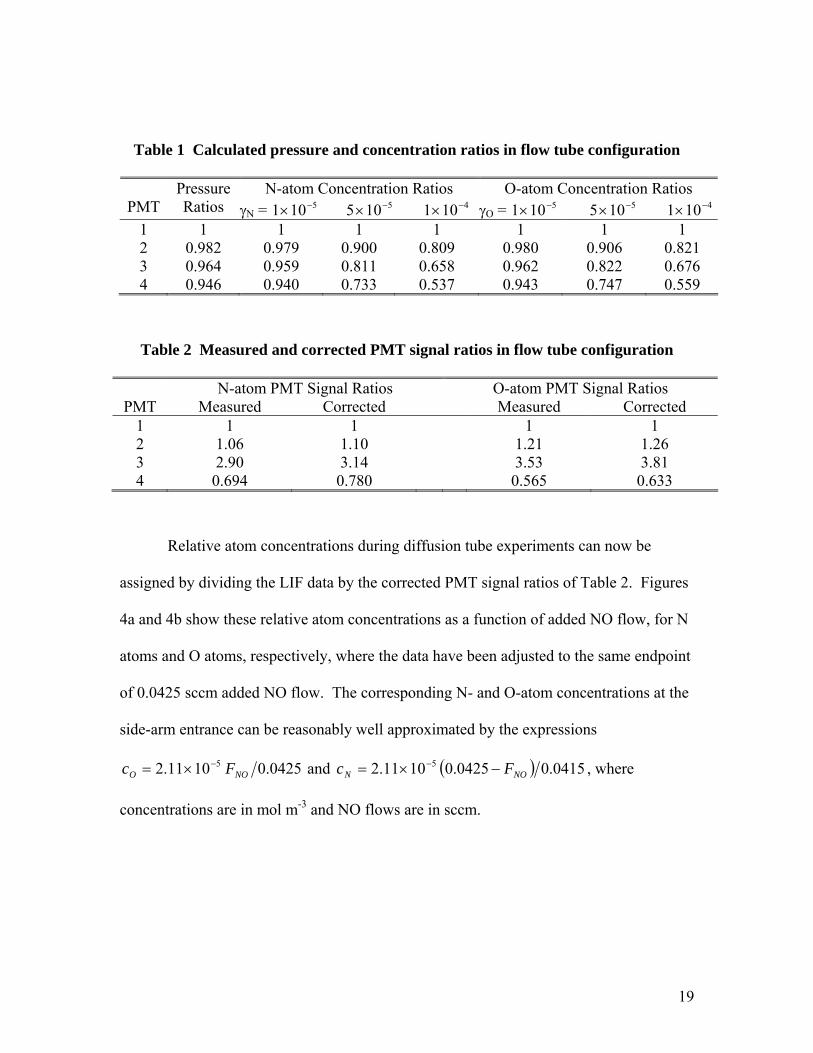
Table 1 Calculated pressure and concentration ratios in flow tube configuration
N-atom Concentration Ratios O-atom Concentration Ratios PMT
Pressure Ratios γN = 5101 −× 5105 −× 4101 −× γO = 5101 −× 5105 −× 4101 −×
1 1 1 1 1 1 1 1 2 0.982 0.979 0.900 0.809 0.980 0.906 0.821 3 0.964 0.959 0.811 0.658 0.962 0.822 0.676 4 0.946 0.940 0.733 0.537 0.943 0.747 0.559
Table 2 Measured and corrected PMT signal ratios in flow tube configuration
N-atom PMT Signal Ratios O-atom PMT Signal Ratios PMT Measured Corrected Measured Corrected
1 1 1 1 1 2 1.06 1.10 1.21 1.26 3 2.90 3.14 3.53 3.81 4 0.694 0.780 0.565 0.633
Relative atom concentrations during diffusion tube experiments can now be
assigned by dividing the LIF data by the corrected PMT signal ratios of Table 2. Figures
4a and 4b show these relative atom concentrations as a function of added NO flow, for N
atoms and O atoms, respectively, where the data have been adjusted to the same endpoint
of 0.0425 sccm added NO flow. The corresponding N- and O-atom concentrations at the
side-arm entrance can be reasonably well approximated by the expressions
0425.01011.2 5NOO Fc −×= and ( ) 0415.00425.01011.2 5
NON Fc −×= − , where
concentrations are in mol m-3 and NO flows are in sccm.

20
0.00 0.01 0.02 0.03 0.04 0.05 0.06
0.0
0.2
0.4
0.6
0.8
1.0
0.0
0.2
0.4
0.6
0.8
1.0
b) O-atoms
PMT1 PMT2 PMT3 PMT4
ADDED NO FLOW, sccm
a)
N-atoms
REL
ATIV
E AT
OM
CO
NC
ENTR
ATIO
N, a
.u.
Fig. 4 Relative atom concentrations at the different PMT locations during diffusion tube experiments: a) N atoms, and b) O atoms. The error bars are the standard deviations of the collected PMT signals.
21
The goal of the numerical reaction-diffusion model described in the next section
is to reproduce the curvatures and relative magnitudes of the experimental N- and O-atom
concentrations plotted in Fig. 4, and the corresponding scaled measurements in Fig. 3,
using the entrance atom concentrations deduced above and various surface reaction
boundary conditions.
IV. Model Formulation
Governing Equation, Transport Model and Chemistry
The side-arm reactor geometry was modeled as tube of length L = 146.7 cm and
uniform radius R = 1.1 cm, closed at one end by a disk normal to the tube axis. The
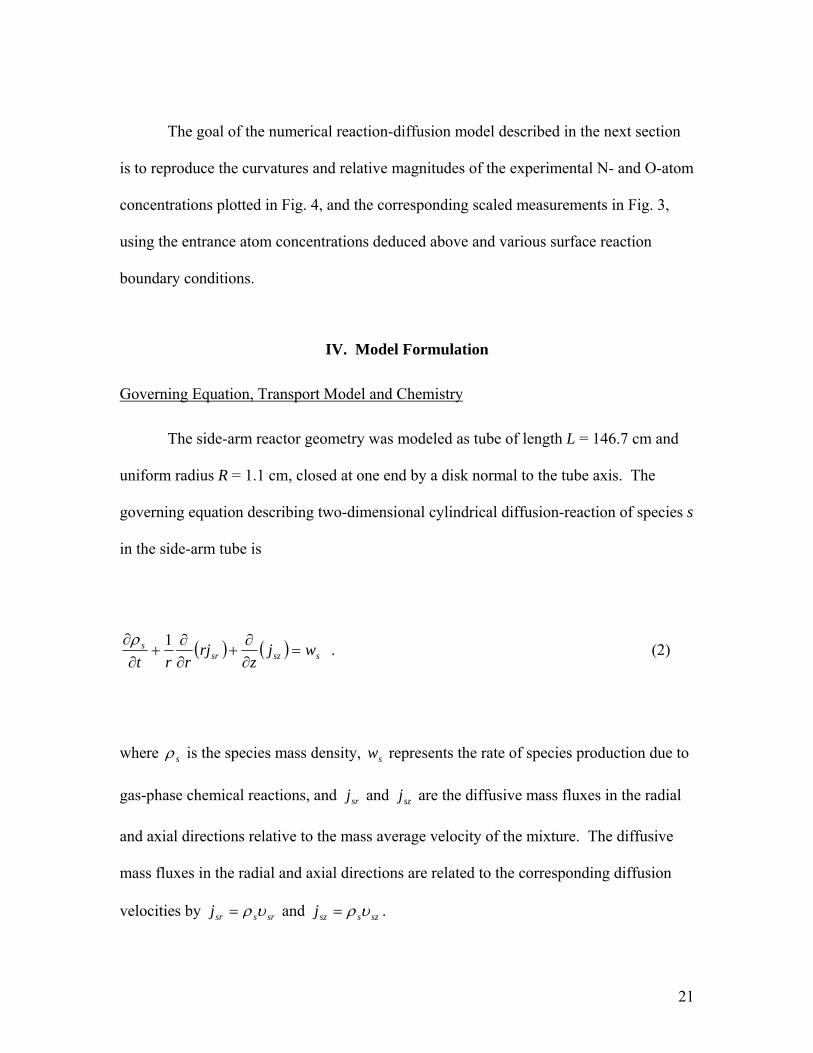
governing equation describing two-dimensional cylindrical diffusion-reaction of species s
in the side-arm tube is
( ) ( ) sszsrs wj
zrj
rrt=
∂∂
+∂∂
+∂
∂ 1ρ . (2)
where sρ is the species mass density, sw represents the rate of species production due to
gas-phase chemical reactions, and srj and szj are the diffusive mass fluxes in the radial
and axial directions relative to the mass average velocity of the mixture. The diffusive
mass fluxes in the radial and axial directions are related to the corresponding diffusion
velocities by srssrj υρ= and szsszj υρ= .
22
Concentration profiles were obtained by the simultaneous solution of the set of 8
species continuity equations (Eq. 2) for N, O, N2, O2, NO, N2O, NO2, and O3. Solution of
the momentum and energy equations is not required to obtain concentration profiles
under the isothermal and isobaric conditions of the dead-end side-arm reactor. The ideal
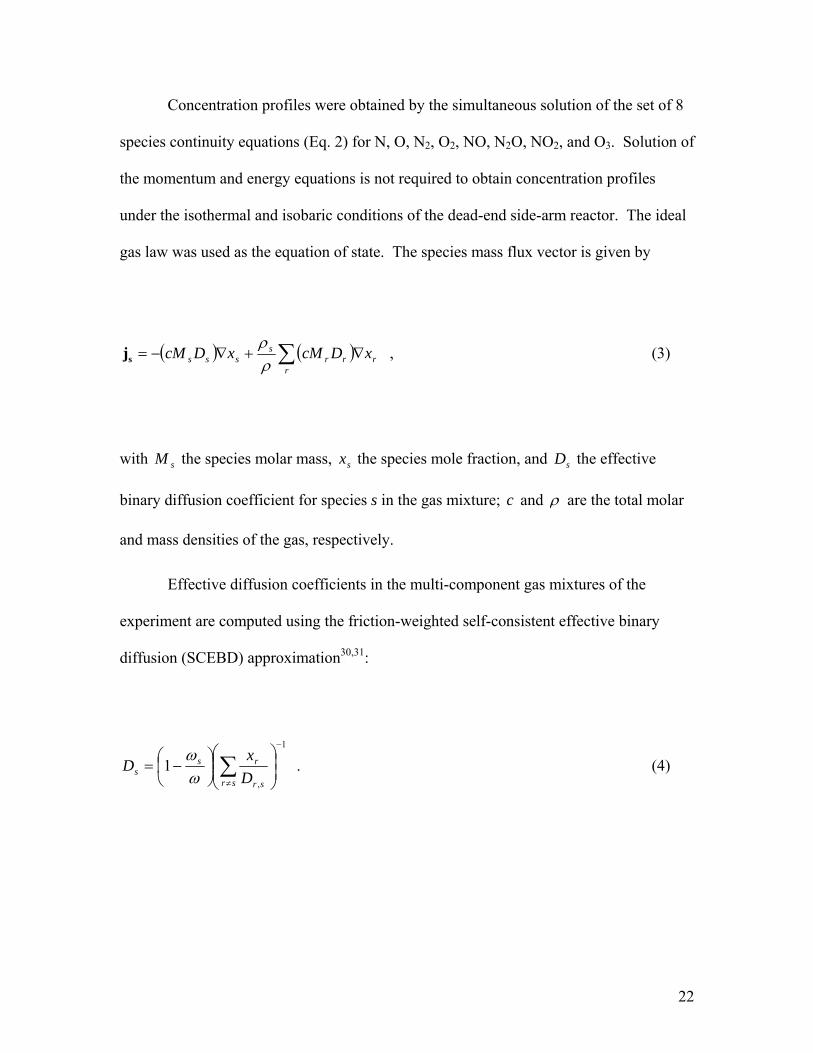
gas law was used as the equation of state. The species mass flux vector is given by
( ) ( )∑ ∇+∇−=r
rrrs
sss xDcMxDcMρρ
sj , (3)
with sM the species molar mass, sx the species mole fraction, and sD the effective
binary diffusion coefficient for species s in the gas mixture; c and ρ are the total molar
and mass densities of the gas, respectively.
Effective diffusion coefficients in the multi-component gas mixtures of the
experiment are computed using the friction-weighted self-consistent effective binary
diffusion (SCEBD) approximation30,31:
1
,
1−
≠⎟⎟⎠
⎞⎜⎜⎝
⎛⎟⎠⎞
⎜⎝⎛ −= ∑
sr sr
rss D
xD
ωω
. (4)
23
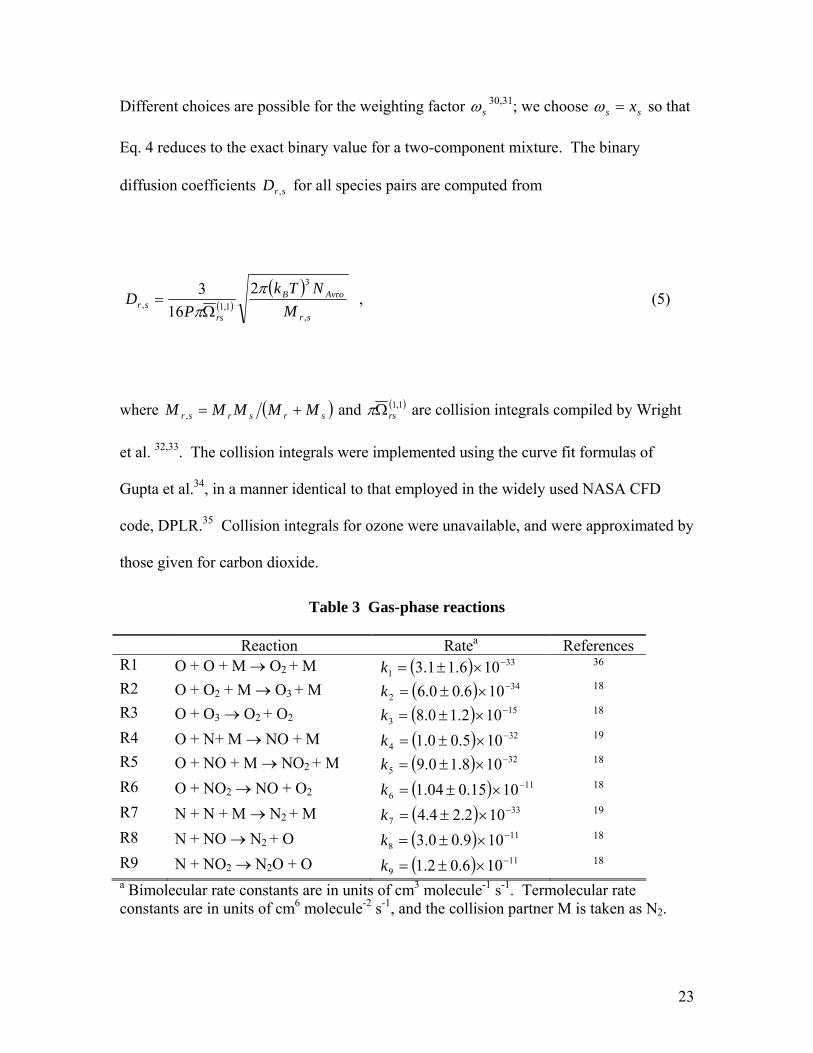
Different choices are possible for the weighting factor sω 30,31; we choose ss x=ω so that
Eq. 4 reduces to the exact binary value for a two-component mixture. The binary
diffusion coefficients srD , for all species pairs are computed from
( )( )
sr
AvroB
rssr M
NTkP
D,
3
1,1,2
163 π
πΩ= , (5)
where ( )srsrsr MMMMM +=, and ( )1,1rsΩπ are collision integrals compiled by Wright
et al. 32,33. The collision integrals were implemented using the curve fit formulas of
Gupta et al.34, in a manner identical to that employed in the widely used NASA CFD
code, DPLR.35 Collision integrals for ozone were unavailable, and were approximated by
those given for carbon dioxide.
Table 3 Gas-phase reactions
Reaction Ratea References R1 O + O + M → O2 + M ( ) 33
1 106.11.3 −×±=k 36 R2 O + O2 + M → O3 + M ( ) 34
2 106.00.6 −×±=k 18 R3 O + O3 → O2 + O2 ( ) 15
3 102.10.8 −×±=k 18 R4 O + N+ M → NO + M ( ) 32
4 105.00.1 −×±=k 19 R5 O + NO + M → ΝO2 + M ( ) 32
5 108.10.9 −×±=k 18 R6 O + NO2 → NO + O2 ( ) 11
6 1015.004.1 −×±=k 18 R7 N + N + M → N2 + M ( ) 33
7 102.24.4 −×±=k 19 R8 N + NO → N2 + O ( ) 11
8 109.00.3 −×±=k 18 R9 N + NO2 → N2O + O ( ) 11
9 106.02.1 −×±=k 18 a Bimolecular rate constants are in units of cm3 molecule-1 s-1. Termolecular rate constants are in units of cm6 molecule-2 s-1, and the collision partner M is taken as N2.

24
Table 3 lists the room-temperature rate coefficients for nine gas phase reactions
included in our model involving dissociated oxygen and nitrogen species. The reverse
reaction rates are negligibly slow under our experimental conditions and were set to zero.
Boundary Conditions and Solution Procedure
The production of species by surface-catalyzed reactions must be balanced by
their diffusive flux at the wall:
wsws wj ,, =− . (6)
For reactant species the production rates at the surface can be expressed as a loss
probability, sγ , times the surface impingement fluxes; for O and N atoms this gives the
production rates (negative for loss)
4,
,OwO
OwO
vw
ργ−= . (7a)
4,
,NwN
NwN
vw
ργ−= . (7a)

25
The loss probability is defined as the fraction of impinging reactant flux removed
permanently from the gas phase. It is not a fundamental chemical quantity, rather, it
reflects the total efficiency of all operating surface reaction pathways that remove species
s on a particular surface under a particular combination of temperature, pressure, and gas
composition. If the reactant species is consumed to produce more than one product
species, branching fractions, rsf , , can be defined as the fraction of impinging reactant
removed permanently from the gas phase that participates in forming product species r.
We avoid the common term “recombination coefficient” for sγ because this term implies
a reaction product that is the parent molecule of the reactant (i.e., O2 for O-atoms), which
is clearly not always the case in multi-reactant mixtures.
The absolute lower and upper bounds on both sγ and rsf , are 0 and 1, but this
range may be reduced by other factors such as the availability of partner reactants. For a
partially dissociated mixture of oxygen and nitrogen interacting with a catalytic surface
via three net steady-state heterogeneous reaction pathways: O + O → O2, N + N → N2,
and O + N → NO, element conservation dictates the constraint:
( ) ( ) NNwNNNNOOwOOOO MvfMvf ,,,, 2211 ργργ −=− . (8)
In the simulations that follow, we demonstrate the effect of NO surface
production on the predicted O- and N-atom concentration profiles along the diffusion
side-arm tube for different fixed N2/N/O compositions at the side-arm opening. To
26
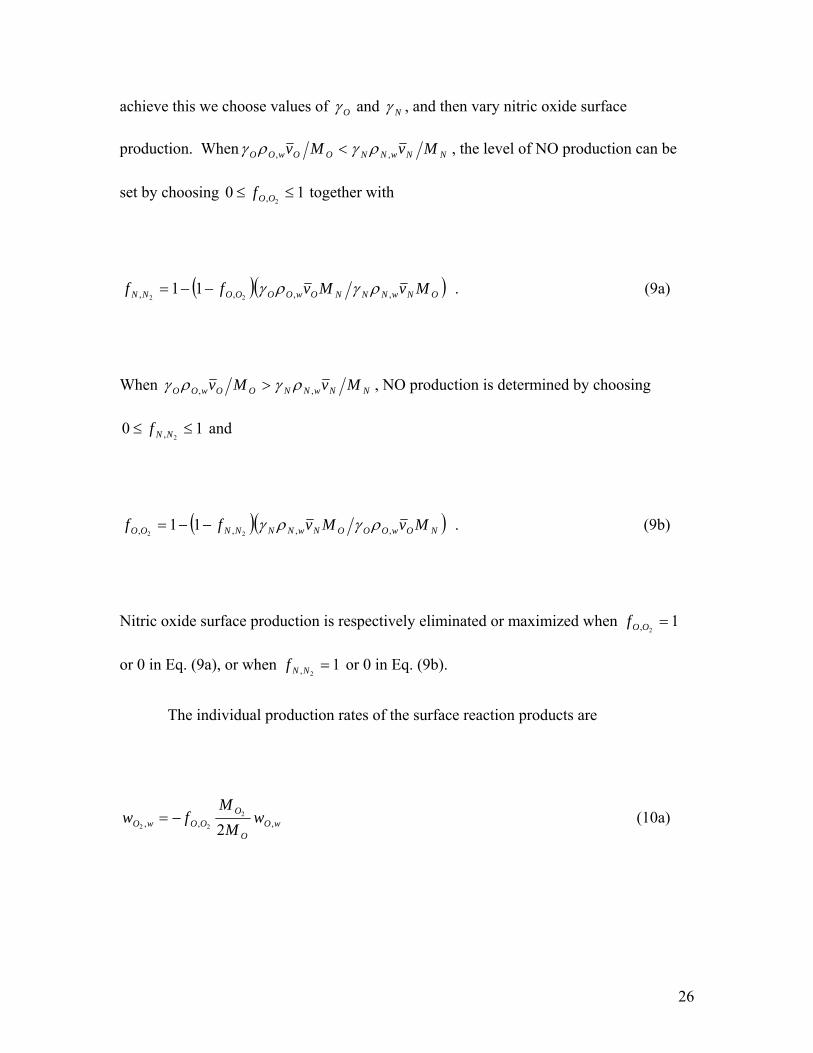
achieve this we choose values of Oγ and Nγ , and then vary nitric oxide surface
production. When NNwNNOOwOO MvMv ,, ργργ < , the level of NO production can be
set by choosing 102, ≤≤ OOf together with
( )( )ONwNNNOwOOOONN MvMvff ,,,, 2211 ργργ−−= . (9a)
When NNwNNOOwOO MvMv ,, ργργ > , NO production is determined by choosing
102, ≤≤ NNf and
( )( )NOwOOONwNNNNOO MvMvff ,,,, 2211 ργργ−−= . (9b)
Nitric oxide surface production is respectively eliminated or maximized when 12, =OOf
or 0 in Eq. (9a), or when 12, =NNf or 0 in Eq. (9b).
The individual production rates of the surface reaction products are
wOO
OOOwO w
MM
fw ,,, 22
22−= (10a)

27
wNN
NNNwN w
MM
fw ,,, 22
22−= (10b)
( ) ( ) wOO
NOOOwN
N
NONNwNO w
MM
fwMM
fw ,,,,, 1122
−=−= . (10c)
Equation (6), together with expressions (7a,b) and (10a-c), provides the species
boundary conditions on all the side-arm surfaces at Rr = for 0=z to L and at Lz = for
0=r to R . A zero-flux boundary condition, 0=srj , was applied along the tube
centerline ( 0=r for 0=z to L). The gas composition at the side-arm entrance was
specified according to the experimental conditions and taken as uniform for 0=z and
0=r to R .
Equation 2 was discretized using a fourth-order accurate finite difference scheme
for the spatial derivatives and iterated to steady-state using a third-order accurate Runge-
Kutta method. Grid convergence was obtained for grids with 60 × 10 grid points in the
axial and radial directions, respectively. Steady-state solutions were achieved using a
CFL (Courant, Freidricks, Levy) number of 1. The CFL number is defined as the ratio of
the simulation time step, tΔ , to the minimum physical diffusion time scale in the flow,
difftΔ , where ( ) μρ 22 rztdiff Δ+Δ=Δ and zΔ and rΔ are the grid spacings in the axial
and radial directions, respectively. The simulations that follow were all computed using
a 60 × 10 grid and a CFL number of 1.

28
V. Simulation Results
Simulations were computed for T = 298 K, P = 60 Pa, and various O-atom and
N-atom concentrations at the side-arm entrance corresponding to NO titration flows in
the range 0.0 to 0.0425 sccm, with the balance assumed to be molecular nitrogen. The
concentrations of all other species were set to zero at the entrance.
0 50 100 15010-2
10-1
100
0.00 0.01 0.02 0.03 0.04
0.0
0.2
0.4
0.6
0.8
1.0a)
1 2 3 4
PMT Locations
N O no NO max NO
REL
ATIV
E AT
OM
CO
NC
ENTR
ATIO
N, a
.u.
DISTANCE, cm
b) N OPMT1 PMT2 PMT3 PMT4
REL
ATIV
E AT
OM
CO
NC
ENTR
ATIO
N, a
.u.
ADDED NO FLOW, sccm
Fig. 5 Model simulations for 5101 −×== NO γγ : a) relative atom concentration profiles along the diffusion tube side-arm at an added NO flow rate of 0.0215 sccm, with or without surface NO production; b) relative atom concentrations at different PMT locations as a function of the flow of added NO, with maximum NO surface production.
29
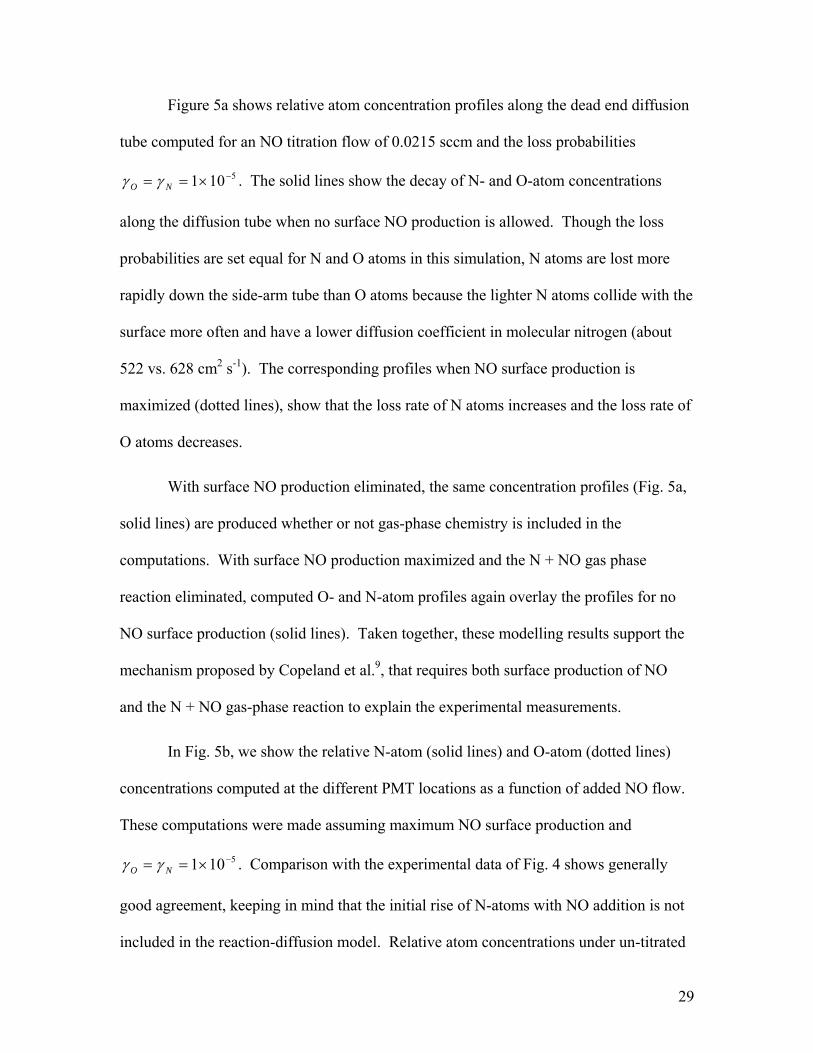
Figure 5a shows relative atom concentration profiles along the dead end diffusion
tube computed for an NO titration flow of 0.0215 sccm and the loss probabilities
5101 −×== NO γγ . The solid lines show the decay of N- and O-atom concentrations
along the diffusion tube when no surface NO production is allowed. Though the loss
probabilities are set equal for N and O atoms in this simulation, N atoms are lost more
rapidly down the side-arm tube than O atoms because the lighter N atoms collide with the
surface more often and have a lower diffusion coefficient in molecular nitrogen (about
522 vs. 628 cm2 s-1). The corresponding profiles when NO surface production is
maximized (dotted lines), show that the loss rate of N atoms increases and the loss rate of
O atoms decreases.
With surface NO production eliminated, the same concentration profiles (Fig. 5a,
solid lines) are produced whether or not gas-phase chemistry is included in the
computations. With surface NO production maximized and the N + NO gas phase
reaction eliminated, computed O- and N-atom profiles again overlay the profiles for no
NO surface production (solid lines). Taken together, these modelling results support the
mechanism proposed by Copeland et al.9, that requires both surface production of NO
and the N + NO gas-phase reaction to explain the experimental measurements.
In Fig. 5b, we show the relative N-atom (solid lines) and O-atom (dotted lines)
concentrations computed at the different PMT locations as a function of added NO flow.
These computations were made assuming maximum NO surface production and
5101 −×== NO γγ . Comparison with the experimental data of Fig. 4 shows generally
good agreement, keeping in mind that the initial rise of N-atoms with NO addition is not
included in the reaction-diffusion model. Relative atom concentrations under un-titrated
30
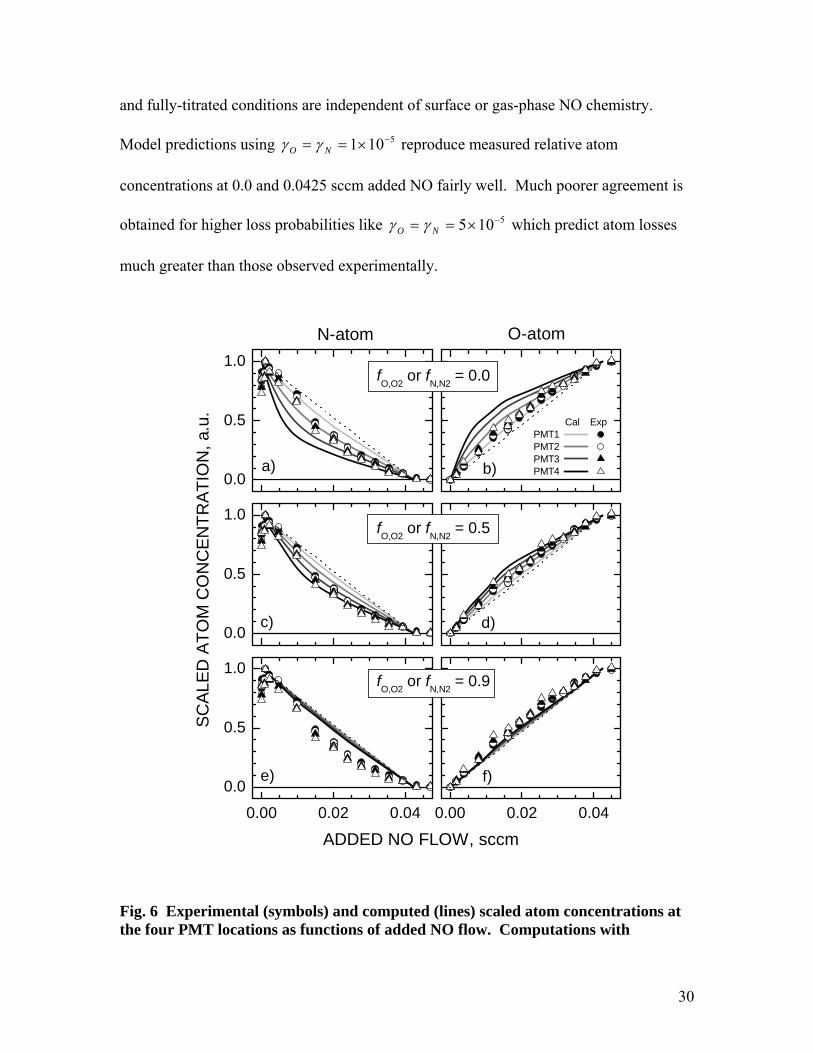
and fully-titrated conditions are independent of surface or gas-phase NO chemistry.
Model predictions using 5101 −×== NO γγ reproduce measured relative atom
concentrations at 0.0 and 0.0425 sccm added NO fairly well. Much poorer agreement is
obtained for higher loss probabilities like 5105 −×== NO γγ which predict atom losses
much greater than those observed experimentally.
0.0
0.5
1.0
0.00 0.02 0.04
0.0
0.5
1.0
0.00 0.02 0.04
0.0
0.5
1.0
fO,O2 or fN,N2 = 0.9
fO,O2 or fN,N2 = 0.5
c)
SCAL
ED A
TOM
CO
NC
ENTR
ATIO
N, a
.u.
d)
e)
ADDED NO FLOW, sccm
f)
b)
O-atom
Cal ExpPMT1 PMT2 PMT3 PMT4
fO,O2 or fN,N2 = 0.0
a)
N-atom
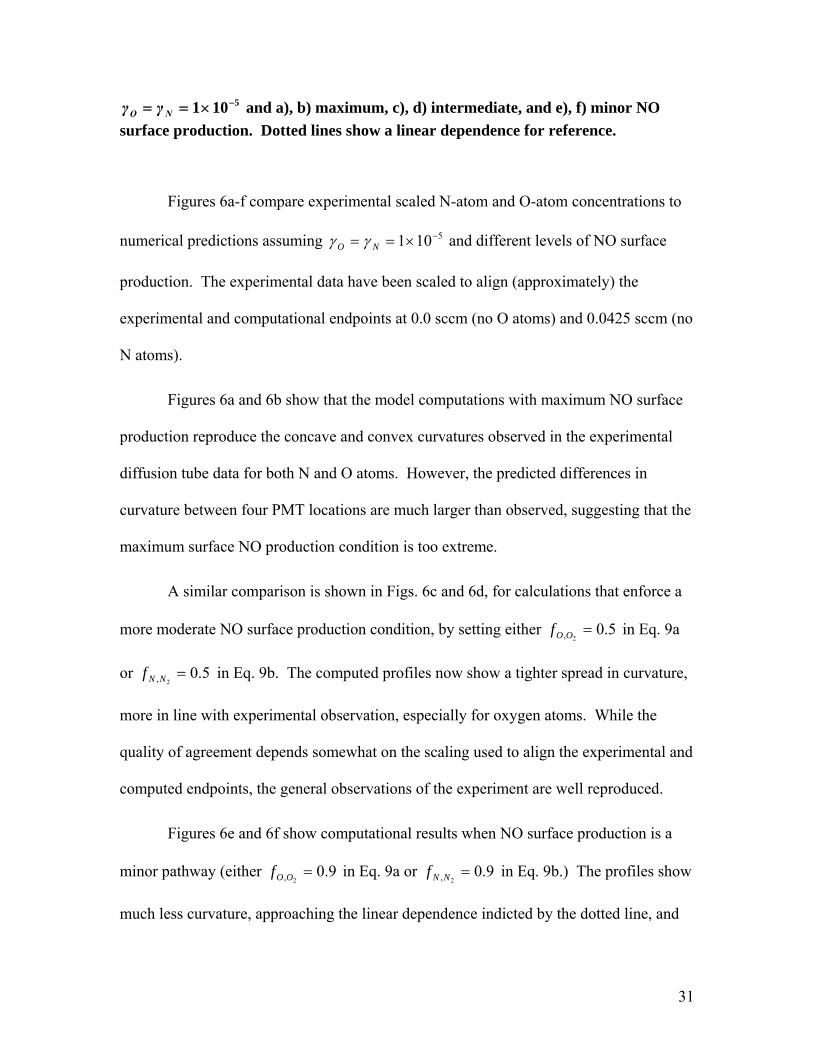
Fig. 6 Experimental (symbols) and computed (lines) scaled atom concentrations at the four PMT locations as functions of added NO flow. Computations with
31
5101 −×== NO γγ and a), b) maximum, c), d) intermediate, and e), f) minor NO surface production. Dotted lines show a linear dependence for reference.
Figures 6a-f compare experimental scaled N-atom and O-atom concentrations to
numerical predictions assuming 5101 −×== NO γγ and different levels of NO surface
production. The experimental data have been scaled to align (approximately) the
experimental and computational endpoints at 0.0 sccm (no O atoms) and 0.0425 sccm (no
N atoms).
Figures 6a and 6b show that the model computations with maximum NO surface
production reproduce the concave and convex curvatures observed in the experimental
diffusion tube data for both N and O atoms. However, the predicted differences in
curvature between four PMT locations are much larger than observed, suggesting that the
maximum surface NO production condition is too extreme.
A similar comparison is shown in Figs. 6c and 6d, for calculations that enforce a
more moderate NO surface production condition, by setting either 5.02, =OOf in Eq. 9a
or 5.02, =NNf in Eq. 9b. The computed profiles now show a tighter spread in curvature,
more in line with experimental observation, especially for oxygen atoms. While the
quality of agreement depends somewhat on the scaling used to align the experimental and
computed endpoints, the general observations of the experiment are well reproduced.
Figures 6e and 6f show computational results when NO surface production is a
minor pathway (either 9.02, =OOf in Eq. 9a or 9.0
2, =NNf in Eq. 9b.) The profiles show
much less curvature, approaching the linear dependence indicted by the dotted line, and

32
compress the differences in curvature between the four PMT locations further. These
simulations do not reproduce the experiment as well as those of Figs 6c and 6d,
indicating that NO surface production is not a minor pathway in our experiment, but
rather comparable in magnitude to the O + O and N + N surface recombination pathways.
The reaction-diffusion model used to simulate the diffusion tube experiments is
only constrained by element conservation and does not include finite rate surface
chemistry. This type of model is often used for parametric studies seeking to bound
catalytic effects37, but lacks physics-based kinetic formulations that describe intermediate
catalytic behavior under transient thermal and flow environments. A more attractive
approach for including the NO surface formation in CFD computations is with a finite-
rate surface chemistry model as implemented by Kurotaki5 and others1-4,6,7; i.e., a model
that incorporates kinetic mechanisms like adsorption, thermal desorption, Eley-Rideal
recombination and Langmuir-Hinschelwood recombination. Unfortunately, these models
contain large numbers of numerical parameters that must be chosen by theory and/or
adjusted to reproduce experiment data. More experimental data are required, at higher
temperatures and over a larger range of gas pressures and compositions, to enable the
construction of a suitable finite-rate chemistry model for our experiments. Such
measurements are currently underway in our laboratory.
VI. Summary
The experimental results presented here support the surface-catalyzed production
of nitric oxide from the recombination of atomic oxygen and atomic nitrogen on quartz.
Computational simulations of the side-arm reactor with a multi-species reaction-diffusion
33
model, incorporating NO surface production and gas phase reaction of NO and N atoms,
qualitatively reproduce the experimental observations, and suggest that NO surface
formation is of comparable magnitude to the O + O and N + N surface recombination
reactions.
Together with the CFD simulations of Kurotaki5 that indicate the importance of
NO surface formation in matching computational and measured heating data for the
OREX flight, and the LIF detection of NO over different material surfaces during plasma
testing by Laux et al.8, the present work strengthens the case for including O + N surface
recombination in CFD simulations of hypersonic flight and plasma testing.
Acknowledgements
This work was supported jointly by the Ceramics and Nonmetallic Materials
Program and the Hypersonics Program of the Air Force Office of Scientific Research
through the prime contract FA9556-05-1-10490. We thank Richard Copeland for helpful
discussions and Michael Wright for providing the collision integrals used in our
computations. Jochen Marschall acknowledges the late Joan Pallix for inspiring this line
of research.

34
References
1 Natsui, F., Barbato, M., and Bruno, C., "Material-Dependent Catalytic
Recombination Modeling for Hypersonic Flows," Journal of Thermophysics and
Heat Transfer, Vol. 10, 1996, pp. 131-136.
2 Daiß, A., Frühauf, H.-H., and Messerschmid, E.W., "Modeling Catalytic
Reactions on Silica Surfaces with Consideration of Slip Effects," Journal of
Thermophysics and Heat Transfer, Vol. 11, 1997, pp. 346-352.
3 Deutschmann, O., Riedel, U., and Warnatz, J., "Modeling of Nitrogen and
Oxygen Recombination on Partial Catalytic Surfaces," Journal of Heat Transfer,
Vol. 117, 1995, pp. 495-501.
4 Kovalev, V.L., Suslov, O.N., and Triskiy, G.A., "Phenomenological Theory for
Heterogeneous Recombination of Partially Dissociated Air on High-Temperature
Surfaces," in Molecular Physics and Hypersonic Flows, edited by M. Capitelli,
(Kluwer Academic, Boston, 1996), p. 193-202.
5 Kurotaki, T., "Catalytic Model on SiO2-Based Surface and Application to Real
Trajectory," Journal of Spacecraft and Rockets, Vol. 38, 2001, pp. 798-800.
6 Armenise, I., Barbato, M., Capitelli, M., and Kustova, E., "State-to-State Catalytic
Models, Kinetics, and Transport in Hypersonic Boundary Layers," Journal of
Thermophysics and Heat Transfer, Vol. 20, 2006, pp. 465-476.
7 Daiß, A., Frühauf, H.-H., and Messerschmid, E.W., "Chemical Reactions and
Thermal Nonequilibrium on Silica Surfaces," in Molecular Physics and
35
Hypersonic Flows, edited by M. Capitelli, (Kluwer Academic, Boston, 1996), p.
203-218.
8 Laux, T., Feigl, M., Stöckle, T., and Auweter-Kurtz, M., “Estimation of the
Surface Catalyticity of PVD-Coatings by Simultaneous Heat Flux and LIF
Measurements in High Enthalpy Air Flows,” AIAA Paper 2000-2364, June 2000.
9 Copeland, R.A., Pallix, J.B., and Stewart, D.A., "Surface Catalyzed Production of
NO from Recombination of N and O Atoms," Journal of Thermophysics and Heat
Transfer, Vol. 12, 1998, pp. 496-499.
10 Smith, W.V., "The Surface Recombination of H Atoms and OH Radicals,"
Journal of Chemical Physics, Vol. 11, 1943, pp. 110-125.
11 Wise, H. and Wood, B.J., "Reactive Collisions Between Gas and Surface Atoms,"
in Advances in Atomic and Molecular Physics; Vol. 3, edited by D. R. Bates and I.
Estermann, (Academic Press, New York, 1967), p. 291-353.
12 Pallix, J.B. and Copeland, R.A., "Measurement of Catalytic Recombination
Coefficients on Quartz Using Laser-Induced Fluorescence," Journal of
Thermophysics and Heat Transfer, Vol. 10, 1996, pp. 224-233.
13 Kim, Y.C. and Boudart, M., "Recombination of O, N, and H Atoms on Silica:
Kinetics and Mechanism," Langmuir, Vol. 7, 1991, pp. 2999-3005.
14 Marschall, J., “Experimental Determination of Oxygen and Nitrogen
Recombination Coefficients at Elevated Temperature Using Laser-Induced
Fluorescence,” AIAA Paper 97-3879, August 1997.
36
15 Marschall, J., Chamberlain, A., Crunkleton, D., and Rogers, B., "Catalytic Atom
Recombination on ZrB2/SiC and HfB2/SiC Ultra-High Temperature Ceramic
Composites," Journal of Spacecraft and Rockets, Vol. 41, 2004, pp. 576-581.
16 Marschall, J., Copeland, R.A., Hwang, H.H., and Wright, M.J., “Surface Catalysis
Experiments on Metal Surfaces in Oxygen and Carbon Monoxide Mixtures,”
AIAA Paper 2006-181, January 2006.
17 Sepka, S., Chen, Y.-K., Marschall, J., and Copeland, R.A., "Experimental
Investigation of Surface Reactions in Carbon Monoxide and Oxygen Mixtures,"
Journal of Thermophysics and Heat Transfer, Vol. 14, 2000, pp. 45-52.
18 Sander, S.P., Friedl, R.R., Golden, D.M., Kurylo, M.J., Moortgat, G.K., Wine,
P.H., Ravishankara, A.R., Kolb, C.E., Molina, M.J., Finlayson-Pitts, B.J., Huie,
R.E., and Orkin, V.L., “Chemical Kinetics and Photochemical Data for Use in
Atmospheric Studies: Evaluation Number 15,” JPL Publication 06-2, July 10,
2006.
19 Baulch, D.L., Drysdale, D.D., and Horne, D.G., Evaluated Kinetic Data for High
Temperature Reactions, Volume 2: Homogeneous Gas Phase Reactions of the H2-
N2-O2 System, Butterworths, London, 1973.
20 Bischel, W.K., Perry, B.E., and Crosley, D.R., "Detection of Fluorescence from O
and N Atoms Induced by Two-Photon Absorption," Applied Optics, Vol. 21,
1982, pp. 1419-1428.
21 Bischel, W.K., Perry, B.E., and Crosley, D.R., "Two-Photon Laser-Induced
Fluorescence in Oxygen and Nitrogen Atoms," Chemical Physics Letters, Vol. 82,
1981, pp. 85-88.

37
22 Adams, S.F. and Miller, T.A., "Two-Photon Absorption Laser Induced
Fluorescence of Atomic Nitrogen by an Alternative Excitation Scheme,"
Chemical Physics Letters, Vol. 295, 1998, pp. 305-311.
23 Repsilber, T. and Uhlenbusch, J., "Absolute Calibration of TALIF of Atomic
Nitrogen by NO Titration - Experimental and Theoretical Analysis," Plasma
Chemistry and Plasma Processing, Vol. 24, 2004, pp. 373-392.
24 Von Weyssenhoff, H. and Patapoff, M., "Validity and Limitations of the Gas
Titration of Atomic Nitrogen with Nitric Oxide," Journal of Physical Chemistry,
Vol. 69, 1965, pp. 1756-1758.
25 Young, R.A., Sharpless, R.L., and Stringham, R., "Catalyzed Dissociation of N2
in Microwave Discharges. I," Journal of Chemical Physics, Vol. 40, 1964, pp.
117-119.
26 Arasa, C., Gamallo, P., and Sayós, R., "Adsorption of Atomic Oxygen and
Nitrogen at β-Crisobalite (100): A Density Functional Theory Study," Journal of
Physical Chemistry B, Vol. 109, 2005, pp. 14954-14964.
27 Cozmuta, I., “Molecular Mechanisms of Gas Surface Interactions in Hypersonic
Flow,” AIAA Paper 2007-4046, June 2007.
28 Schlichting, H., Boundary-Layer Theory, McGraw-Hill, New York, 1979.
29 Touloukian, Y.S., Saxena, S.C., and Hestermans, P., Thermophysical Properties
of Matter. Viscosity, Vol. 11 IFI/Plenum, New York, 1975.
30 Ramshaw, J.D., "Self-Consistent Effective Binary Diffusion in Multicomponent
Gas Mixtures," Journal of Non-Equilibrium Thermodynamics, Vol. 15, 1990, pp.
295-300.
38
31 Ramshaw, J.D. and Chang, C.H., "Friction-Weighted Self-Consistent Effective
Binary Diffusion Approximation," Journal of Non-Equilibrium Thermodynamics,
Vol. 21, 1996, pp. 223-232.
32 Wright, M.J., Bose, D., Palmer, G.E., and Levine, E., "Recommended Collision
Integrals for Transport Property Computations I: Air Species," AIAA Journal,
Vol. 43, 2005, pp. 2558-2564.
33 Wright, M.J., Hwang, H.H., and Schwenke, D.W., "Recommended Collision
Integrals for Transport Property Computations Part 2: Mars and Venus Entries,"
AIAA Journal, Vol. 45, 2007, pp. 281-288.
34 Gupta, R., Yos, J., Thompson, R., and Lee, K., “A Review of Reaction Rates and
Thermodynamic and Transport Properties for an 11-Species Air Model for
Chemical and Thermal Nonequilibrium Calculations to 30000 K,” NASA RP-
1232, August 1990.
35 Wright, M.J., Candler, G.V., and Bose, D., "Data-Parallel Line Relaxation
Method for the Navier-Stokes Equations," AIAA Journal, Vol. 36, 1998, pp. 1603-
1609.
36 Baulch, D.L., Drysdale, D.D., Duxbury, J., and Grant, S.J., Evaluated Kinetic
Data for High Temperature Reactions, Volume 3. Homogeneous Gas Phase
Reactions of the O2-O3 system, the CO-O2-H2 system, and of Sulfur-Containing
Species., Butterworths, London, 1976.
37 Bose, D. and Wright, M., “Uncertainty Analysis of Laminar Aeroheating
Predictions for Mars Entries,” AIAA Paper 2005-4682, June 2005.