nitrogen deposition effects of ammonia ammonia workshop national atmospheric deposition program...
TRANSCRIPT

Nitrogen Deposition Effects of Ammonia
Ammonia WorkshopNational Atmospheric Deposition Program
October 22-24, 2003Washington, DC
USA

Contrasting NOx and NH3
Historical focus on NOx
Growing focus on NH3
Similarities– Both have point and mobile sources– Both, once emitted can be converted to any
other N species Both contribute to all the N-related impacts.

Reactive N vs Unreactive N2
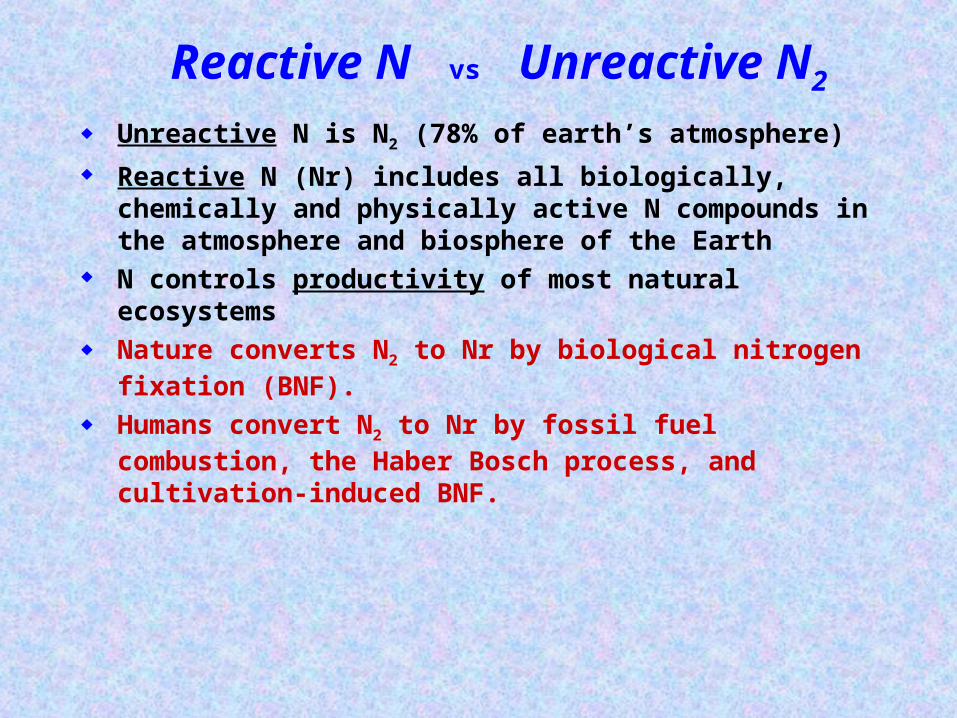
Unreactive N is N2 (78% of earth’s atmosphere)
Reactive N (Nr) includes all biologically, chemically and physically active N compounds in the atmosphere and biosphere of the Earth
N controls productivity of most natural ecosystems
Reactive N vs Unreactive N2
Unreactive N is N2 (78% of earth’s atmosphere)
Reactive N (Nr) includes all biologically, chemically and physically active N compounds in the atmosphere and biosphere of the Earth
N controls productivity of most natural ecosystems Nature converts N2 to Nr by biological nitrogen fixation (BNF).
Humans convert N2 to Nr by fossil fuel combustion, the Haber Bosch process, and cultivation-induced BNF.

Reactive N vs Unreactive N2
Unreactive N is N2 (78% of earth’s atmosphere)
Reactive N (Nr) includes all biologically, chemically and physically active N compounds in the atmosphere and biosphere of the Earth
N controls productivity of most natural ecosystems Nature converts N2 to Nr by biological nitrogen fixation (BNF)
Humans convert N2 to Nr by fossil fuel combustion, the Haber Bosch process, and cultivation-induced BNF.
Primary Conclusions– Humans create more Nr than do natural terrestrial processes.– Nr is accumulating in the environment.– Nr accumulation contributes to most environment issues of the day.
– NHx and its conversion products are key components.
Objectives Contrasting NOx and NH3
Human Alteration of N Cycle– An agrarian to an industrializing world
The Consequences of Anthropogenic Nitrogen (including NH3).– Nitrogen is nutritious
– Nitrogen cascades
Challenges!

The History of Nitrogen --N becomes limiting?--
0
1,000
2,000
3,000
4,000
5,000
6,000
7,000
1750 1800 1850 1900 1950 2000 20500
50
100
150
200
Humans, millions Legumes/Rice, Tg N
Galloway JN and Cowling EB. 2002; Galloway et al., 2003a
N-NutrientN-DiscoveredBNF

The History of Nitrogen --N becomes limiting?--
0
1,000
2,000
3,000
4,000
5,000
6,000
7,000
1750 1800 1850 1900 1950 2000 20500
50
100
150
200
Humans, millions Legumes/Rice, Tg N
Galloway JN and Cowling EB. 2002; Galloway et al., 2003a
N-NutrientN-DiscoveredBNF
World is running out of N*
*1898, Sir William Crookes, president of the British Association for the Advancement of Science

Carl Bosch (1874-1940)The perfect catalyst, 1910Large-scale production, 1913Ammonia to nitrate, 1914Nobel Prize in Chemistry, 1931
-”chemical high pressure methods”
Fritz Haber (1868-1934)Began work on NH3, 1904First patent, 1908Commercial-scale test, 1909Developed Cl2 gas production, 1914Nobel Prize in Chemistry, 1918
-”for the synthesis of ammonia from its elements”
Smil, 2001

The History of Nitrogen --Nr Creation, Haber Bosch process--
0
1,000
2,000
3,000
4,000
5,000
6,000
7,000
1750 1800 1850 1900 1950 2000 20500
50
100
150
200
Humans, millions Haber Bosch Legumes/Rice, Tg N
Galloway JN and Cowling EB. 2002; Galloway et al., 2003a
N-NutrientN-Discovered
N2 + 3H2 --> 2NH3
BNF
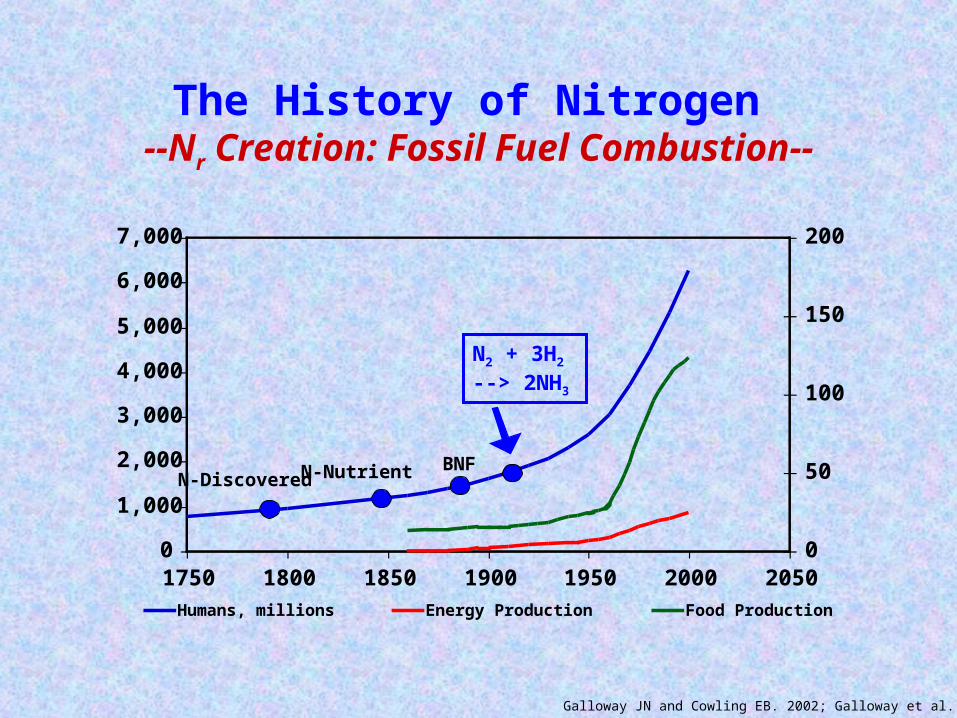
The History of Nitrogen --Nr Creation: Fossil Fuel Combustion--
0
1,000
2,000
3,000
4,000
5,000
6,000
7,000
1750 1800 1850 1900 1950 2000 20500
50
100
150
200
Humans, millions Energy Production Food Production
Galloway JN and Cowling EB. 2002; Galloway et al., 2003a
N-NutrientN-Discovered
N2 + 3H2 --> 2NH3
BNF

The History of Nitrogen --Nr Creation, People and Nature--
0
1,000
2,000
3,000
4,000
5,000
6,000
7,000
1750 1800 1850 1900 1950 2000 20500
50
100
150
200
Humans, millions Total N Fixed, Tg
Galloway JN and Cowling EB. 2002; Galloway et al., 2003a
N-NutrientN-Discovered
N2 + 3H2 --> 2NH3
BNF
Natural Range,terrestrial
{
*
*

Nitrogen Drivers in 1860
Grain Production
Meat Production
EnergyProduction

66 77
88
0.30.3
66 99
1111 881515
2727
NONOyyNN22 NHNHxx
55 66
The Global Nitrogen Budget in 1860 and mid-1990s, TgN/yr18
60
120120
Galloway et al., 2003b

Grain Production
Meat Production
EnergyProduction
Nitrogen Drivers in 1860 & 1995

66 77
88
0.30.3
66 99
1111 881515
2727
NONOyyNN22 NHNHxx
55 66
NONOyyNN22 NHNHxx
2121 2525
1616
2525
55
3333 2323 2626
66
3939
4848
1818
100100
N2 + 3H2
2NH3
The Global Nitrogen Budget in 1860 and mid-1990s, TgN/yr18
60m
id-1
990s
110110
120120
Galloway et al., 2003b

Nitrogen DepositionPast and Present
mg N/m2/yr
1860 1993
500020001000 750 500 250 100 50 25 5
Galloway et al., 2003b

Haber-Bosch has facilitated agricultural intensification
40% of world’s population is alive because of it
An additional 3 billion people by 2050 will be sustained by it
Most N that enters agroecosystems is released to the environment.
Nr and Agricultural Ecosystems

NOx emissions contribute to OH, which defines the oxidizing capacity of the atmosphere
NOx emissions are responsible for tens of thousands of excess-deaths per year in the United States
O3 and N2O contribute to atmospheric warming
N2O emissions contribute to stratospheric O3 depletion
Nr and the Atmosphere

N is the limiting nutrient in most temperate and polar ecosystems
Nr deposition increases and then decreases forest and grassland productivity
Nr additions probably decrease biodiversity across the entire range of deposition
Nr and Terrestrial Ecosystems

Surface water acidification– Tens of thousands of lakes
and streams
– Biodiversity losses
As reductions in SO2 emissions continue, Nr deposition becomes more important.
Nr and Freshwater Ecosystems

Nr and Coastal Ecosystems• Increased algal productivity
• Shifts in community structure
• Harmful algal blooms
• Degradation of seagrass and algal beds
• Formation of nuisance algal mats
• Coral reef destruction
• Increased oxygen demand and hypoxia
• Increased nitrous oxide (greenhouse gas)
Sybil Seitzinger, 2003

There are significant effectsof Nr accumulation within each
reservoir
These effects are linked temporallyand biogeochemically in the
Nitrogen Cascade

Atmosphere
Terrestrial Ecosystems
Aquatic Ecosystems
Human Activities
Agroecosystem EffectsNHx
FoodProduction
Crop Animal
People (Food; Fiber)
Soil
The Nitrogen Cascade
Norg
Galloway et al., 2003a

Atmosphere
Terrestrial Ecosystems
Aquatic Ecosystems
Human Activities Groundwater Effects
Surface waterEffects
CoastalEffects
PM &VisibilityEffects
Agroecosystem EffectsNHx
FoodProduction
Crop Animal
People (Food; Fiber)
Soil
The Nitrogen Cascade
NH3
Norg
Forests &Grassland
Soil
OceanEffects
Galloway et al., 2003a

Atmosphere
Terrestrial Ecosystems
Aquatic Ecosystems
Human Activities Groundwater Effects
Surface waterEffects
CoastalEffects
PM &VisibilityEffects
Agroecosystem EffectsNHx
FoodProduction
Crop Animal
People (Food; Fiber)
Soil
NO3
The Nitrogen Cascade
NH3
Norg
Forests &Grassland
Soil
OceanEffects
Galloway et al., 2003a

Atmosphere
Terrestrial Ecosystems
Aquatic Ecosystems
Human Activities Groundwater Effects
Surface waterEffects
CoastalEffects
EnergyProduction
PM &VisibilityEffects
OzoneEffects
Agroecosystem EffectsNHx
FoodProduction
NOx
NOx
Crop Animal
People (Food; Fiber)
Soil
NO3
The Nitrogen Cascade
NH3
--Indicates denitrification potential
Norg
Forests &Grassland
Soil
OceanEffects

Atmosphere
Terrestrial Ecosystems
Aquatic Ecosystems
Human Activities Groundwater Effects
Surface waterEffects
CoastalEffects
StratosphericEffects
EnergyProduction
PM &VisibilityEffects
OzoneEffects
Agroecosystem EffectsNHx
FoodProduction
NOx
NOx
Crop Animal
People (Food; Fiber)
Soil
NO3
The Nitrogen Cascade
NH3
--Indicates denitrification potential
Norg
Forests &Grassland
Soil
OceanEffects
N2O
GHEffects
N2O

Hog Production in USA(1 dot= 10,000 Hogs and Pigs)

Meat Consumption in North America(kg/capita/year)
0
20
40
60
80
100
120
140
1960 1965 1970 1975 1980 1985 1990 1995 2000
Hogs and Pigs
Conclusions NH3 contributes to every N-related issue
– Directly or indirectly
Nr and NHx are accumulating in environmental reservoirs
The impacts of N accumulation are significant and inter-related
NH3 emissions will increase with time
There is need for an integrated approach to manage N!

0
20
40
60
80
100
120
140
1960 1965 1970 1975 1980 1985 1990 1995 2000
Meat Consumption in North America(kg/capita/year)
Layers & Pullets
(60,000/dot)


Nr Creation Rates by Food and Energy Production in 2050
0
2
4
6
8
10
12
1000 1100 1200 1300 1400 1500 1600 1700 1800 1900 2000 2100
Year
today
2050
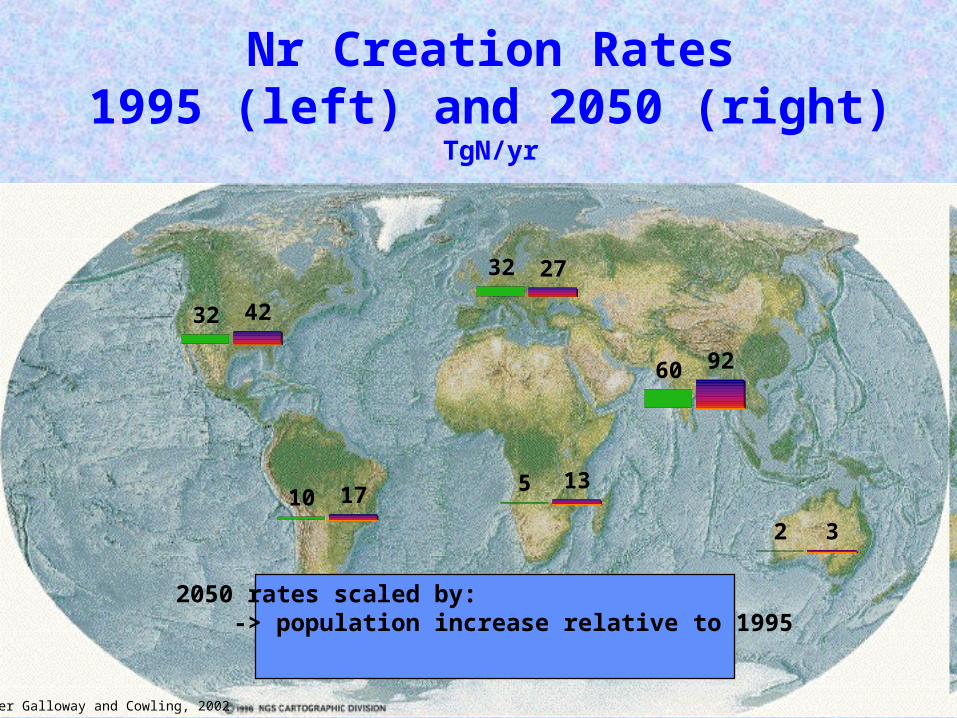
Nr Creation Rates1995 (left) and 2050 (right)
TgN/yr
60 92
5 13
32 27
10 17
32 42
2050 rates scaled by: -> population increase relative to 1995
after Galloway and Cowling, 2002

Nr Creation Rates1995 (left) and 2050 (right)
TgN/yr
60
568
5
190
32 67
1087
32 42
2 5
2050 rates scaled by: -> population increase relative to 1995 -> N. Amer. per capita Nr creation in 1995
after Galloway and Cowling, 2002

N Fertilizer Produced
100
The Fate of Haber-Bosch Nitrogen
Galloway JN and Cowling EB. 2002

N Fertilizer Produced
NConsumed
100 14
The Fate of Haber-Bosch Nitrogen
14% of the N produced in the Haber-Bosch process enters thehuman mouth……….
Galloway JN and Cowling EB. 2002

N Fertilizer Produced
N Fertilizer Consumed
N in Crop
N Harvested
Nin Food
NConsumed
-6 -47 -12
100 144794 2631
-5
The Fate of Haber-Bosch Nitrogen
-16
14% of the N produced in the Haber-Bosch process enters thehuman mouth……….if you are a vegetarian.
Galloway JN and Cowling EB. 2002

N Fertilizer Produced
N Fertilizer Applied
N in Crop
N In Feed
Nin Store
NConsumed
-6 -47 -3
100 44794 731
-24
The Fate of Haber-Bosch Nitrogen
-16
4% of the N produced in the Haber-Bosch process and usedfor animal production enters the human mouth.
Galloway JN and Cowling EB. 2002

Nr Riverine Fluxes1860 (left) and 1990 (right)
TgN/yr
5.7
16.7
-> all regions increase riverine fluxes-> Asia becomes dominant
0.6 0.7
4.58.4
47.2
7 8.25.3 6.6
Galloway et al, 2003b; Boyer et al., in preparation

Nr Formation vs.
Nr Conversion back to N2
N2 Nr160 Tg N/yr

Nr Formation vs.
Nr Conversion back to N2
N2 Nr160 Tg N/yr
??
• Is anthropogenic Nr accumulating in environmental systems?• If so, where relative to point of introduction?• If so, on what time scale?
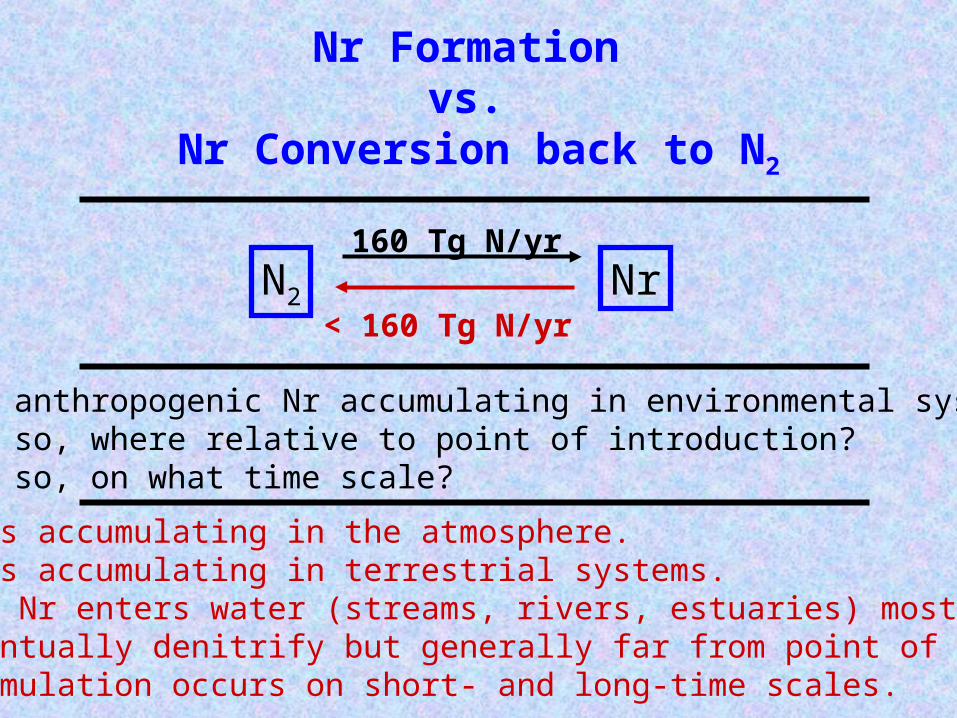
Nr Formation vs.
Nr Conversion back to N2
N2 Nr160 Tg N/yr
< 160 Tg N/yr
• Is anthropogenic Nr accumulating in environmental systems?• If so, where relative to point of introduction?• If so, on what time scale?
• Nr is accumulating in the atmosphere.• Nr is accumulating in terrestrial systems.• Once Nr enters water (streams, rivers, estuaries) most will eventually denitrify but generally far from point of entry.• Accumulation occurs on short- and long-time scales.

International Nitrogen Initiative
Formed in December 2002; SCOPE & IGBP sponsors
Objective
optimize nitrogen’s beneficial role in sustainable food production and minimize nitrogen’s negative effects on human health and the environment resulting from food and energy production.
Preliminary assessment in December 2004.
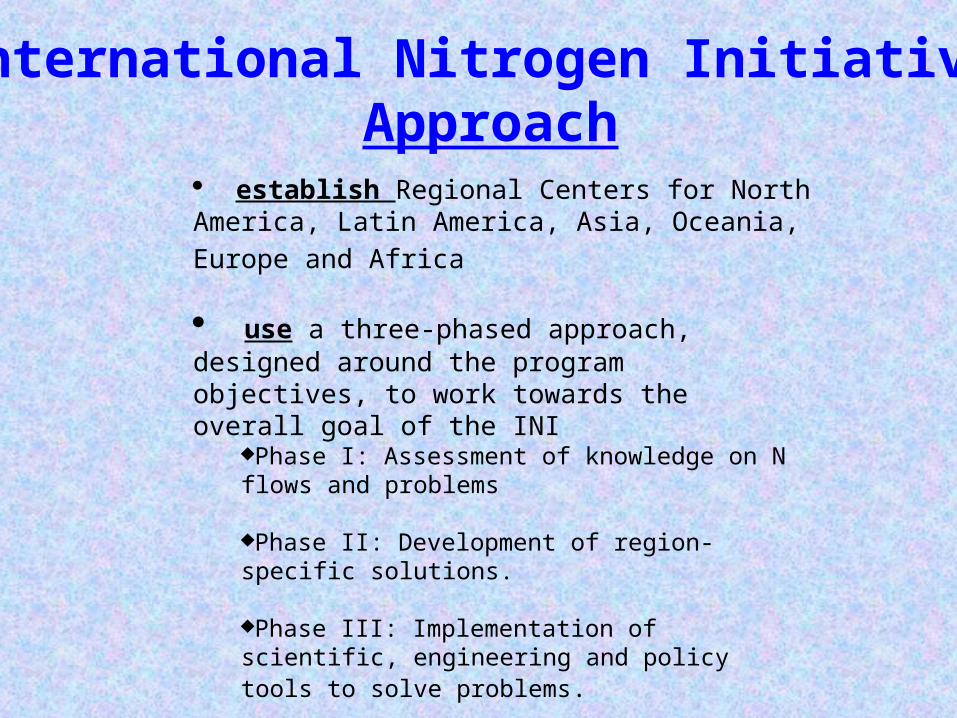
establish Regional Centers for North America, Latin
America, Asia, Oceania, Europe and Africa
use a three-phased approach, designed around the program objectives, to work towards the overall goal of the INI
Phase I: Assessment of knowledge on N flows and problems
Phase II: Development of region-specific solutions.
Phase III: Implementation of scientific, engineering and policy tools to solve problems.
activities for a given Center will depend upon the ‘maturity’ of nitrogen science and policy for that region.
International Nitrogen Initiative Approach

The Components of INI
acid rain
Biodiversity losses
eutrophication
stratospheric ozonemethemoglinemia
smog
haze
human health
forest productivity
fertilizers
agroecosystems
fossil fuel combustion
food production
legumes
North America
Latin America
Europe
Asia
Africa
Oceania
nitrogen fixation
denitrification nitrification
CAFOspolicy
economics
politics
manure
troposphere
forests
grasslands
freshwaters
estuaries
ocean
wetlands
stratosphere
cities
decomposition
assimilation
emissions
deposition
rivers
Imports/exports
Phase I: Assessment of Science andIdentification of Problems
agroecosystems
troposphere
forests
grasslands
freshwatersestuariesocean
wetlands
stratosphere
cities
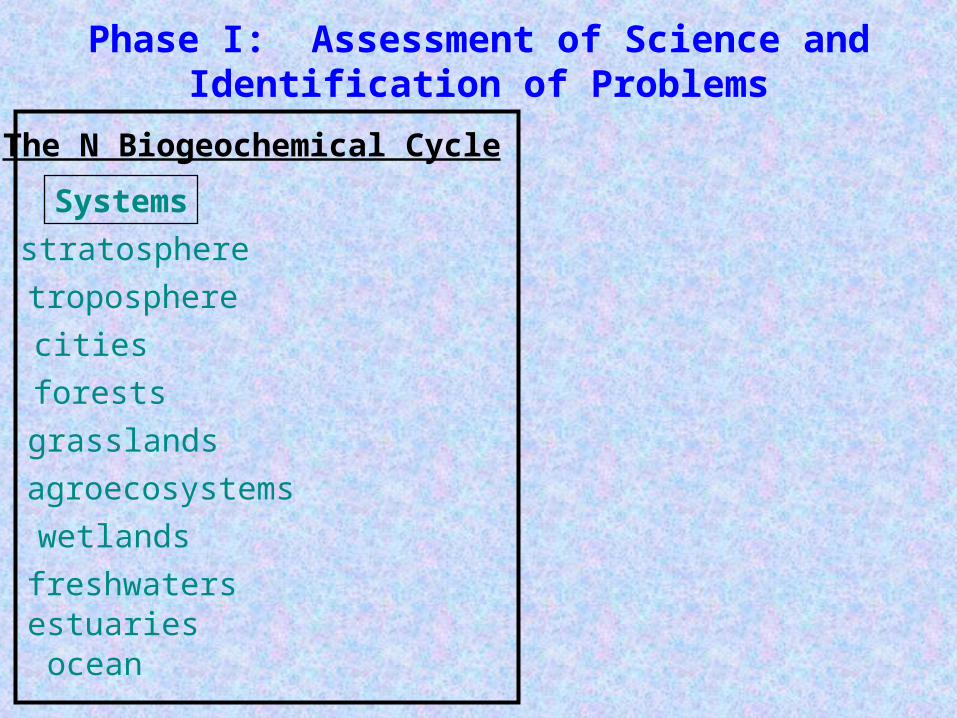
The N Biogeochemical Cycle
Systems
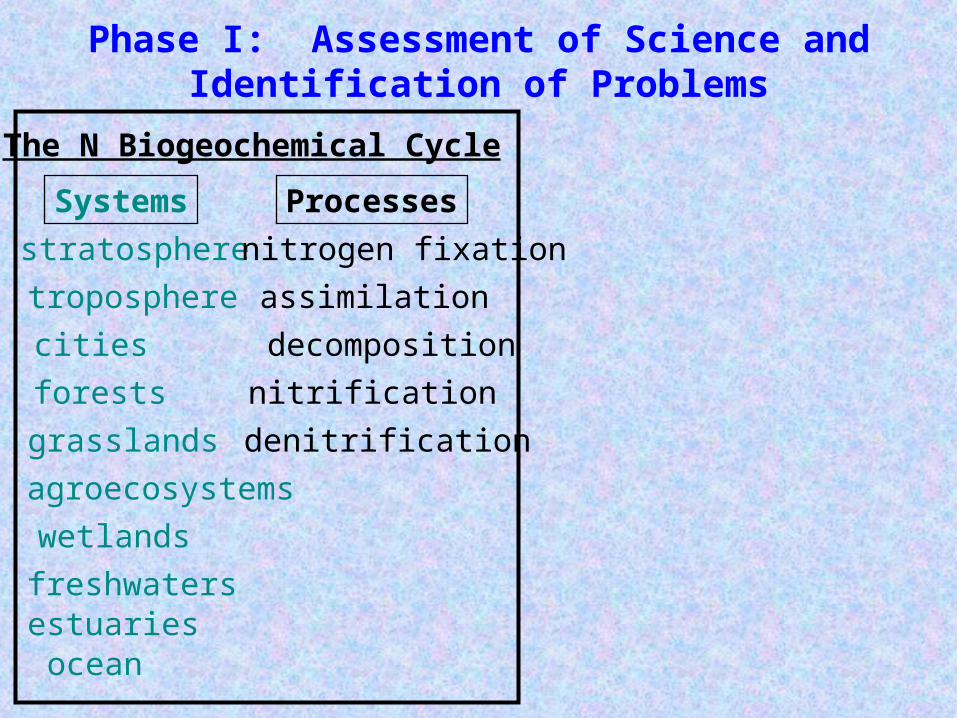
Phase I: Assessment of Science andIdentification of Problems
agroecosystems
troposphere
forests
grasslands
freshwatersestuariesocean
wetlands
stratosphere
cities
nitrogen fixation
denitrification
nitrification
decomposition
assimilation
Processes
The N Biogeochemical Cycle
Systems

Phase I: Assessment of Science andIdentification of Problems
agroecosystems
troposphere
forests
grasslands
freshwatersestuariesocean
wetlands
stratosphere
cities
nitrogen fixation
denitrification
nitrification
decomposition
assimilation
emissions
deposition
riversimports/exports
Exchanges
Processes
The N Biogeochemical Cycle
EnergyFood People
Systems

Phase I: Assessment of Science andIdentification of Problems
agroecosystems
troposphere
forests
grasslands
freshwatersestuariesocean
wetlands
stratosphere
cities
nitrogen fixation
denitrification
nitrification
decomposition
assimilation
emissions
deposition
riversimports/exports
acid rain
biodiversity losses
eutrophication
smog
haze
human health
forest productivity
stratospheric ozone
Exchanges
Processes Impacts
The N Biogeochemical Cycle
EnergyFood People
Systems

Phase II: Development of SolutionsPhase III: Implementation of Solutions
acid rain
biodiversity losses
eutrophication
smog
haze
human health
forest productivity
stratospheric ozone
ImpactsThese impacts can be lessened by reducing the amount of reactive N created and by converting reactive N to N2.
To achieve these goals, while maintaining food and energy production, requires engineers, policy makers, economists, resource managers,etc. working in a regional context.

International Nitrogen Initiative Current Status
Formed in December 2002 Sponsored by SCOPE and IGBP INI has a 15-person Scientific Advisory
Committee members from Brazil, China, France, Netherlands,
Japan, South Africa, Sweden, Thailand,Uganda, United Kingdom, United States
First SAC meeting is hosted by Dutch Government
May 12-14, 2003, The Hague
The Challenge to all Parties
Maximize food and energy production while maintaining environmental and
human health!