nitrogen dynamics in the jordan river and great salt lake...
TRANSCRIPT

Nitrogen Dynamics in the Jordan River and Great Salt Lake Wetlands
Ramesh Goel, Shaikha Abedin
May, 2016
Executive summary: Jordan River receives discharges from various point and nonpoint sources. Due to rising concerns about the presence of nutrients in Jordan River and their transport to receiving wetlands in the Great Salt Lake ecosystem, this study was initiated to estimate the fate of nitrogen at selected sites in Jordan River and selected wetlands. Two sites were sampled in the lower Jordan River, one in the State Canal, and two sites in the Farmington Bay wetlands. Sediment oxygen demand and nutrient flux experiments were conducted twice through the summer of 2015. Sediments were observed as both sink and source for ammonia, whereas they acted as a sink for nitrate—reflecting the combined effects of ammonification, nitrification, and denitrification. Results from potential denitrification experiments supported high denitrification activity in the sediments as well. Variation in nitrification and denitrification rates was supported by molecular analysis of key functional genes. Comparing the potential denitrification and nitrification rates with the in-situ nitrogen flux, SOD, and bio-molecular sediment characteristics provided a useful insight to the nitrogen dynamics in the Jordan River and GSL wetlands, which can serve as essential additions to the continuing efforts of improvising the Jordan River TMDL.

1
From Dr. Ramesh Goel Associate Professor Civil & Environmental Engineering University of Utah To: Dr. Theron Miller Subject: Research status report for the project titled “Nitrogen dynamics in the Jordan River and Great Salt Lake Wetlands.” Dear Dr. Miller, I am pleased to submit this final report on nitrogen dynamics in the Jordan River and at selected sites in
the Farmington Bay wetlands for the titled project. This project had two distinct objectives.
Objective 1: Evaluate nitrogen fluxes and nitrification and denitrification rates using in-situ chambers at
5 sites in the Jordan River (early and late summer)
Objective 2: Evaluate nitrification and denitrification rates (using serum bottles) at the selected critical
sites sampled in Task 1 for late summer samples.
Please note that sediment oxygen demand and fine scale molecular analysis were not a part of this project
but we determined these parameters and are reporting them in this report. We have included detailed
methodology, results, and discussion. In addition, we have conducted a complete analysis of nitrifying
and denitrifying communities for all sites to further strengthen the claim that sampled sites are indeed
active in nitrification and denitrification.
1.0 Introduction
Dissolved oxygen (DO) is an important index to the health of aquatic ecosystems (Chen et al., 2012;
Yogendra & Puttaiah, 2008). Numerous studies have documented the detrimental effects of low DO
concentrations in aquatic ecosystems (Connolly et al., 2004; Dai et al., 2006; Medeiros et al., 2009).
Management decisions that might be responsible for producing low DO concentrations in streams and
wetlands are of particular interest (Wood, 2001). This warrants the need for a comprehensive
understanding of the oxygen budget in streams and wetlands (Chen et al., 2012). Sediment oxygen
demand (SOD) (Miskewitz et al., 2010; Miskewitz & Uchrin, 2013) and nutrient dynamics (Esten &
Wagner, 2010) are both important components of the oxygen budget.
In order to successfully manage healthy dissolved oxygen levels in rivers and wetlands, it is essential for
2
stakeholders to identify the magnitude of sediment oxygen demand (SOD), how this rate varies spatially
and temporally, and whether this demand is influenced by decomposing algal detritus (Chen et al., 2012;
Liu & Chen, 2012; Esten & Wagner, 2010). The SOD operates on a longer timescale than the highly
dynamic processes of algal photosynthesis and respiration, thereby providing a “background” oxygen
demand over the demands of algal respiration and carbonaceous biochemical oxygen demand (CBOD)
(Chen et al., 2012; Wood, 2001). In the absence of primary production, particularly during periods of high
water temperature and low flows, SOD can significantly deplete the dissolved oxygen in the water
column (Wood, 2001).
Regeneration or release of nutrients, such as inorganic nitrogen, is related to organic matter degradation at
the sediment surface, which enhances the oxygen depletion of bottom waters (Lillebø et al., 2007).
Different internal biogeochemical processes controlled by microbial species play a central role in the
change of nitrogen forms in waterbodies (Zhu et al., 2010), and establishes a linkage between the water
column and sediment bed (Mulholland & Webster, 2010).
For a comprehensive surface water quality study, the knowledge of sediment biological activity
and nutrient transformation/dynamics at the sediment–water interface in a waterbody is essential. The
objective of this study was to improve the understanding of nitrogen dynamics in river and wetland. The
following tasks were completed to achieve the goal:
2.0 Methodology
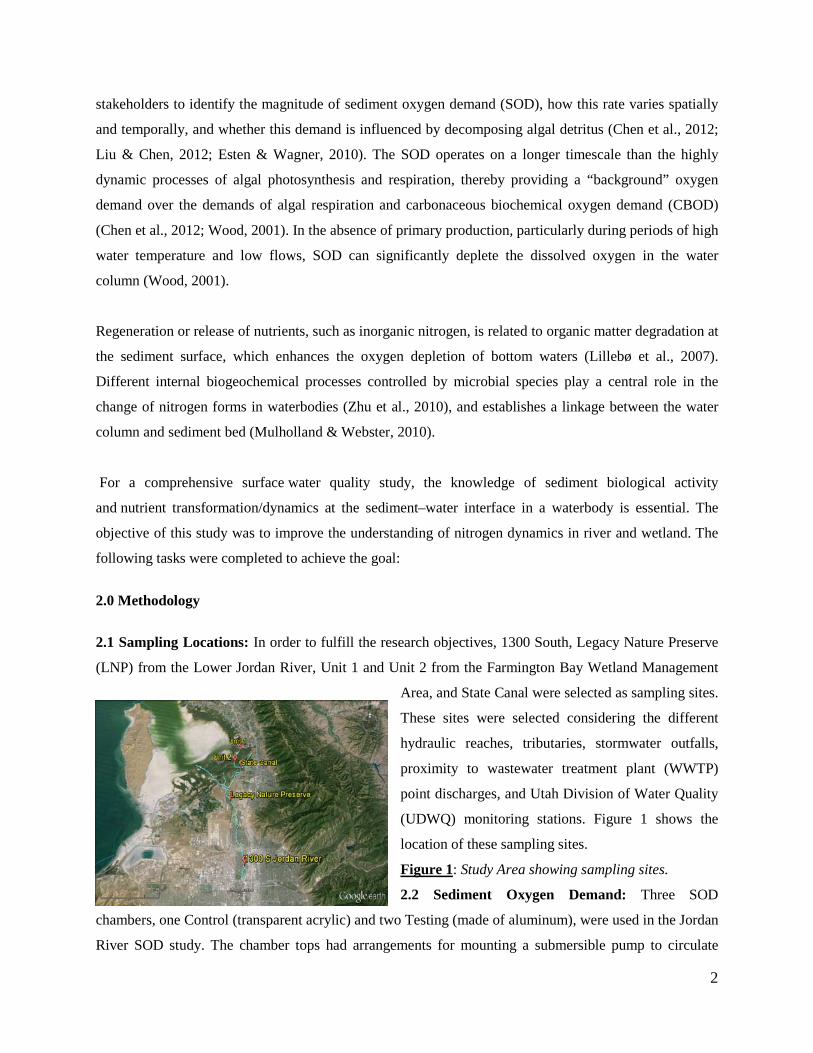
2.1 Sampling Locations: In order to fulfill the research objectives, 1300 South, Legacy Nature Preserve
(LNP) from the Lower Jordan River, Unit 1 and Unit 2 from the Farmington Bay Wetland Management
Area, and State Canal were selected as sampling sites.
These sites were selected considering the different
hydraulic reaches, tributaries, stormwater outfalls,
proximity to wastewater treatment plant (WWTP)
point discharges, and Utah Division of Water Quality
(UDWQ) monitoring stations. Figure 1 shows the
location of these sampling sites.
Figure 1: Study Area showing sampling sites.
2.2 Sediment Oxygen Demand: Three SOD
chambers, one Control (transparent acrylic) and two Testing (made of aluminum), were used in the Jordan
River SOD study. The chamber tops had arrangements for mounting a submersible pump to circulate

3
water inside the chamber. Both the Control chamber and Testing chambers had a working volume of 44
liters. When deployed, the Testing chambers encapsulated a sediment area of 0.16 m2.
Both the Control and Testing SOD chamber configurations were identical in construction and operation
except for the bottom sections. The bottom of the Control chamber was sealed to measure oxygen
consumption associated with the water column only, whereas the bottom of the Testing SOD chamber
was open. Hence, the river water contained in the chamber was in constant contact with the river
sediments during the experimental period which facilitates the measurement of DO consumption
associated with the sediments as well as in the water column. The chambers were tested for water
tightness and the pumps were tested to ensure their circulation functioning before performing the on-site
experiments. Water quality probes (sondes,
In-Situ Inc. model Troll 9500) required to
perform the experiments were provided by the
UDWQ. The deployment of the chambers and
calculations for SOD were completed
following Hogsett (2015). Figure 2 provides a
picture of the SOD chambers deployed at the
sampling location.
Figure 2: SOD chambers deployed at site.
2.3 Nutrient Flux: To conduct the nutrient flux experiments, two sediment chambers and two water
column chambers were deployed at each site to measure the daytime nutrient dynamics at the sediment–
water interface and within the water column, respectively (see Figure 3). The sediment chamber had both
an open top and open bottom that facilitated the measurement of nutrient dynamics in the water column
while interacting with sediments. Meanwhile, the water column chambers had an open top, but a closed
bottom to measure nutrient dynamics in the water column only. The experiments were conducted under
both ambient conditions and nutrient-spiked conditions to investigate the sediment’s reaction to a nutrient
pulse. The first four hours of the study were conducted under ambient conditions, while the last four
hours involved spiking the chambers to a concentration of 0.5 mg/L NH3-N, 0.5 mg/L NO3-N, and 0.1
mg/L PO4-P. The rate of change of dissolved nutrients was calculated using the slope of the concentration
versus time plot.
2.4 Potential Denitrification and Nitrification: To quantify the potential denitrification rate, the rates
of 30N2 production were measured and calculated using a modification of the method of Long et al.
(2013). For nitrification experiments, the top 5 cm sediment subcore was homogenized aseptically with a

4
laboratory-scale spatula. A predetermined amount of the homogenized slurry was placed in a 600 ml
sterile beaker as shown in the left panel in Figure 1. The mixture was aerated with a low airflow rate and
stirred continuously. Ammonia-nitrogen stock solution was added to start the nitrification process to
accomplish a predetermined final ammonium nitrogen
concentration. For each experiment, a sterile pipette
was used to remove 25 ml of the slurry, with duplicates,
and the ammonia nitrogen, nitrate nitrogen, and nitrite
nitrogen concentrations were measured. Total solids
and volatile solids were also measured according to
standard methods.
Figure 3: Nutrient flux chambers deployed at site.
2.5 Bio-molecular Analysis: Both ammonia oxidizers and denitrifiers were targeted in this research.
Table 1 presents details on biomarkers that were employed to profile these bacteria. DNA was extracted
from 0.25–0.40 g sediments using a MO Bio Power Soil extraction kit, and concentrations were measured
in ng/μl using a NanoDrop ND-1000 UV-Vis Spectrophotometer.
Quantitative PCR (q-PCR) was performed to quantify amoA and nirS genes. Each qPCR reaction
contained 10 μL of 2×SYBR green master mix (Life Technologies), 1 μM of forward primer and 1 μM of
reverse primer, 1 μL of BSA (0.1 mg/mL) and 1 μL of cDNA template (10 to 100 ng). The primer
sequences and annealing temperatures used in qPCR are summarized in Table 1
Table 1: q-PCR Primer and Size for Selected Genes
Enzyme Primer Size, bp Reference
Ammonium
monooxygenase (AMO,
α subunit) for ammonia
oxidizers
F:GGGTTTCTACTGGTGGT
R:CCCCTCKGSAAAGCCTTCTTC 491
Rotthauwe et al.,
1997
Heme containing nitrite
reductase (NirS or
cd1NIR) for denitrifiers
Cd3a: AACGYSAAGGARACSGG
R3cd:
GASTTCGGRTGSGTCTTSAYGAA
425 Throbäck et al., 2004
Finally, the Terminal Restriction Fragment Length Polymorphism (TRFLP) technique (Osborn et al.,
2000) was used to analyze the nitrifying bacterial communities present in the sediment.
3.0 Results

5
3.1 Ambient Water Characteristics: Two rounds of sampling were conducted. The first one was
conducted in July and the second in September of 2015 to record nutrient dynamics and sediment oxygen
demand in early and late summer, respectively. Table 2 shows the ambient concentrations of nutrients and
other parameters under consideration at the selected five sites. Nutrient concentrations during some
sampling events were under detection limit (UDL) and thus were not measurable. Detection limits for
phosphate-phosphorous, nitrite-nitrogen/nitrate-nitrogen and ammonia-nitrogen were 0.006 mg/L, 0.006
mg/L, and 0.015 mg/L, respectively. Between the Jordan River sites, the Legacy Nature Preserve (LNP)
site had higher nutrient concentrations when compared to 1300 South. For the wetland sites, Unit 1 had
higher concentrations of phosphate and ammonium than Unit 2. The dissolved oxygen (DO), in general,
was lower in the river sites than wetland sites. Temperatures were lower during late summer.
Table 2: Ambient Nutrient Concentrations in Water Column Measured at Each Site
Parameter Sampling
Event 1300 S LNP State Canal Unit 1 Unit 2
NO3-N
(mg/L)
Early Summer 1.23 4.94 4.07 0.880 0.545
Late Summer 3.76 4.88 3.18 0.089 3.220
NO2-N
(mg/L)
Early Summer 0.027 0.113 UDL UDL UDL
Late Summer 0.093 UDL UDL 0.144 UDL
PO4-P
(mg/L)
Early Summer 0.388 0.611 0.507 0.679 0.57
Late Summer 0.283 0.530 0.698 0.095 UDL
NH4-N
(mg/L)
Early Summer 0.270 0.150 1.17 1.810 0.779
Late Summer 0.408 0.244 1.38 0.947 0.127
DO
(mg/L)
Early Summer 4.20 3.59 3.57 7.20 5.49
Late Summer 5.93 5.44 7.26 7.65 7.30
Temperature
(oC)
Early Summer 23.16 24.35 23.89 22.28 23.74
Late Summer 21.83 23.33 20.06 20.96 19.42
pH Early Summer 7.78 7.79 7.68 9.16 8.96
Late Summer 7.89 7.96 7.92 7.64 8.16
Higher nitrate and phosphate concentrations are perhaps the result of external inputs from various point
and nonpoint sources. Unit 1 was observed to be the most active in terms of nutrient concentrations, pH,
and dissolved oxygen. Nitrite was mostly nondetectable at all but the Unit I (late summer) and 1300 S
sites.

6
3.2 Sediment Oxygen Demand (SOD): Sediment oxygen demand accounts for the depletion of oxygen
due to various biogeochemical activities at the sediment water interface (Chen et al., 2012; Hogsett &
Goel, 2013; Wood, 2001). SOD was measured at five selected sites in the Jordan River, Great Salt Lake
wetlands, and State Canal during both early and late summer. Figure 4 illustrates the dissolved oxygen
depletion profiles measured in the SOD and WCdark chambers at Unit 1 site during late summer.
Figure 4: DO Profiles in three SOD chambers at Unit 1
(late summer).
In this sampling event, the DO profile for the WCdark
chamber is represented as the solid black line showing
DO depletion. The dashed lines correspond to DO
profiles for the two SOD chambers. The DO profile in
both SOD chambers demonstrated a decreasing trend
with time, which indicates that the DO was consumed in
these chambers due to various biogeochemical activities (Hogsett & Goel, 2013). The slopes of the
oxygen depletion profiles in both the SOD chambers were much higher than that of WCdark chamber.
These slopes were used to calculate oxygen consumption rates for each chamber.
Figure 5 shows the sediment oxygen demand (SOD) results for all sampling events in early and late
summer. All SOD results were normalized to temperature at 25oC following Butts and Evans (1978). The
SOD ranged from 2.4 to 2.9 g-DO m-2 day-1 in Jordan River sediments, whereas at wetland sites the SOD
was as high as 11.8 g-DO m-2 day-1. The SOD rates obtained in this study were comparable to the values
reported in Ziadat and Berdanier (2004), Utley et al. (2008), and Hogsett and Goel (2013). Higher SOD
during late summer may be attributed to the fallen leaves adding organic matter loads to the river and
wetlands and the subsequent increase in bacterial metabolism (Hogsett & Goel, 2013). It also emphasizes
that SOD values predicted using temperature correction equations may not reflect actual SOD values and
stream metabolism (Hogsett & Goel, 2013), which is
vital to stream and wetland management decisions.
Figure 5: Sediment Oxygen Demand (SOD) results for
all sampling events.
Butts and Evans (1978) categorized the benthic sediment
condition based on the SODT25C values. Based on Butts

7
and Evans (1978) and Hogsett and Goel (2013), the classification of sediment of selected sites in this
study is provided in Table 3. The least polluted site was 1300 South in the Jordan River, which can be
categorized as ‘moderately polluted.’ The average SOD flux of the Unit 2 wetland characterizes its
deteriorated condition and its classification as ‘heavily polluted.’ The higher percentage of volatile solids
obtained at this site also suggests its high organic matter pollution.
Table 3: Average SOD Results from 5 Sites
The percentage of the ambient DO deficit associated with SOD was calculated for each sampling event.
The range of results were 72–97% for 1300 South, 72–90% for Legacy Nature Preserve, 64–96% for
State Canal, 33–43% for Unit 1, and 79–87% for Unit 2 site. These ranges agree with Hogsett and Goel
(2013) who also calculated the percentage of the ambient DO deficit due to SOD for Jordan River sites.
The majority of the ambient DO deficit was found to be associated with SOD with more than 70% of
ambient DO demand partitioned into sediments. Interestingly, 57–67% of the DO demand at Unit 1 is
associated with the water column, which means oxygen demand in the water column was higher than that
of the sediment.
3.3 Nutrient Flux: Benthic nutrient fluxes determined with flux chambers help understand the combined
effect of bio-chemical reactions like ammonification, nitrification, and denitrification at the sediment
surface (Hantush et al., 2013). Sediment nutrient flux experiments for selected sites in the Jordan River
and the Great Salt Lake wetlands were conducted in July and September considering both ambient
conditions and the nutrient pulsed state. After conducting the first three hours of the experiment at
ambient conditions, the chambers were spiked with 0.5 mg/L ammonia-nitrogen, 0.5 mg/L nitrate-
nitrogen, and 0.1 mg/L phosphate-phosphorous to observe the reactions to the nutrient pulse. The nutrient
spike also made nutrient concentrations become noticeable which were below detection limit previously.
3.3.1 Jordan River Sites: Figures 6 depicts the ammonium, nitrate, and phosphate flux of the Jordan
River sites under unspiked and spiked conditions during early (July) and late (September) summer. A
Site Name SODT25 Benthic Sediment Condition 1300 South 2.64 ± 0.31 Moderately Polluted
Legacy Nature Preserve 2.58 ± 0.52 Moderately Polluted to Polluted
State Canal 2.60 ± 1.54 Moderately Polluted to Polluted
Unit 1 3.14 ± 1.02 Polluted
Unit 2 8.21 ± 3.21 Heavily Polluted to Sewage Like Sludge

8
negative bar in these plots indicates sediment as a sink, while a positive bar represents a source of
nutrients. Under environmental conditions, these positive and negative nutrient fluxes can be the result of
various biogeochemical reactions occurring at the water–sediment interface (Boulton et al., 1998;
Friedrich et al., 2002; Lefebvre et al., 2006). For example, a positive ammonium flux indicates the
possibility of ammonification (Lillebø et al., 2007; Strauss & Lamberti, 2002), while negative ammonium
flux can be explained by nitrification (Schmidt, 1982; Strauss and Lamberti, 2000). However, nitrification
and ammonification may occur simultaneously with nitrate reduction in stream sediments (Wyer & Hill,
1984). For nitrate, a negative flux typically represents denitrification (Bartkow, 2004; Beaulieu et al.,
2011; Holmes et al., 1996). A positive nitrate flux is indicative of ammonia oxidation (Strauss &
Lamberti, 2000).
Figure 6: Nutrient fluxes for Jordan River sites (i.e., 1300S and LNP).
In case of phosphate-phosphorous, a positive flux typically occurs due to decomposition/mineralization of
organic matter and/or its release and resuspension from the sediment bed (Macrae et al., 2003). However,
simultaneous negative fluxes for both nitrogen (ammonia and nitrate) and phosphate may also be caused
by algal uptake (Ho et al., 2003).
For the 1300 South site in the Jordan River, ammonium flux increased during early summer for the
unspiked (ambient) condition, most likely due to ammonification (Strauss & Lamberti, 2002).
Simultaneously, nitrate and phosphate fluxes were negative, which was probably the result of
denitrification (Beaulieu et al., 2011) and algal uptake. After addition of the nutrient pulse, all these fluxes
became negative. Additional bioavailable nutrients perhaps supported higher denitrification (Beaulieu et
al., 2011), causing a greater negative nitrate flux. A negative ammonium flux was the result of the higher
nitrification rate instigated by the nutrient pulse (Starry et al., 2005; Strauss et al., 2002), which
presumably dominated ammonification (Kadlec et al., 2009).

9
Compared to early summer, similar responses were observed for ammonium, nitrate, and phosphate
fluxes in ambient conditions during late summer. During late summer, a greater negative ammonium flux
was observed in when spiked. Interestingly, in this condition, nitrate flux was found to be positive. This
was most likely caused by nitrate production through ammonia oxidation being greater than nitrate
reduction from denitrification due to the presence of the nutrient pulse (Kemp & Dodds, 2002; Levi et al.,
2013).
For the Legacy Nature Preserve site, nitrate flux was negative for both unspiked and spiked conditions
during early and late summer. These fluxes were found to be greater for the spiked condition compared to
the unspiked condition. When the nutrient pulse was introduced, phosphate flux became negative. This
behavior can be explained by higher algal uptake due to the presence of bioavailable nutrients
(Tantanasarit et al., 2013).
In summary, in general, both sites in the Jordan River were found to be sinks of nutrients, especially
nitrate, and the LNP site was more active than the 1300S site in terms of nutrient fluxes.
3.3.2 Wetland sites: Figure 7 depicts the ammonium, nitrate and phosphate flux at Unit 1 and 2 in Farmington Bay wetland
Figure 7: Nutrient fluxes at two wetland sites.
Compared to the Jordan River Sites, nutrient fluxes were observed to be lower at the wetland sites.
Negligible fluxes of ammonia, nitrate, and phosphate were recorded at the Unit 1 site during early
summer under spiked and unspiked conditions. The nitrate flux was negative at Unit 1 under spiked
conditions indicating active loss of nitrate through denitrification. The phosphate flux was positive under
unspiked but negative under spiked condition during the late summer sampling. Unit 2 displayed
negative fluxes under spiked and unspiked conditions, indicating nitrification and denitrifictaion for
nitrogen loss and primary production and other mechanisms (precipitation or binding to suspended

10
particles) for phosphorus loss (Strauss and Lamberti, 2000, 2002).
3.3.3 State Canal: Figure 8 depicts the
ammonium, nitrate, and phosphate flux at the
State Canal location—fluxes were not observed
for ammonium and phosphate. The nitrate flux
followed the typical pattern found for river and
wetland sites.
Figure 8: Nutrient fluxes for the State Canal site.
Overall, the range of fluxes observed in this study for the selected Jordan River sites and the State Canal
location were -3.9 – 0.2 g m-2 day-1 for ammonium, -4.6 – 5.0 g m-2 d-1 for nitrate, and -0.4 – 0.3 g m-2 d-1
for phosphate. The range of fluxes for the wetland sites were -0.9 – 0.0 g m-2 d-1 for ammonium, -2.0 – 0.0
g m-2 day-1 for nitrate, and -0.1 – 0.3 g m-2 day-1 for phosphate.
Ammonification rates found in different studies for lake and river sediments (Reddy, 2008; VanZomeren
et al., 2013) ranged from 0.004 – 0.357 g NH4-N m-2 day-1, which compares favorably with the positive
ammonium flux results of this study. Malecki et al. (2004) also reported an average NH4-N release rate of
0.018 g m−2 day−1 from the anaerobic river sediment.
4.0 Nitrification and denitrification rates
4.1 Nitrification rates: The nitrification rates of river and lake sediments reported in other studies,
ranging from 0.01 – 0.42 g N m-2 d-1 (Pauer and Auer, 2000; deBusk et al., 2001), also compare well to
the negative ammonium flux. Nitrate uptake rates for stream reported in the literature, such as Mulholland
et al. (2004) (0.027 – 0.138 g N m-2 day-1), were lower than the sediment nitrate uptake rate obtained in
this study. Malecki et al. (2004) and Fisher et al. (2005) found sediment flux rates of phosphorus to be
0.015 – 1.1 g PO4-P m-2 day-1, which is fairly close to the results from this study.
Table 4 shows the potential nitrification rates obtained for each site during early and late summer. The
absence of nitrifying activity at the State Canal site, as seen from the potential rate table, also supported
the findings of gel electrophoresis and amoA gene copy number experiments. In comparison, nitrification
rates for the wetland sites, in general, indicated an absence of nitrifying activity, although gel
electrophoresis and gene copy number experiments showed the presence of amoA gene. This suggested

11
that the nitrifying genes present at these sites were most likely inactive. Further evidence to this statement
came from the negative nitrate flux results of the nutrient flux experiments at the wetland sites.
For the Jordan River sites, the nitrification rates varied from 0.008 to 0.07 mg-N g-1 day-1. The decrease of
potential nitrification rate at 1300 South from early to late summer was supported by the results for the
functional gene responsible for nitrification (discussed later) PCR. Results of potential nitrification rates
were, in general, coherent with the gene copy number. However, comparison of these results with nutrient
flux results suggested the dominance of denitrification over nitrification at the river sites. White and
Reddy (2003) and Damashek et al. (2015) reported potential nitrification rates of 0.12 – 0.30 mg-N g-1
day-1 and 0.003 – 0.05 mg-N g-1 day-1 for wetland and river sites, respectively, which are comparable with
the results from this study.
Table 4: Potential Nitrification Rates
Sites
Nitrification rate
(mg-N g-1 dry sediment day-1)
Early Summer Late Summer
1300 South 0.06 0.008
Legacy Nature Preserve 0.04 0.07
State Canal N/A N/A
Unit 1 N/A N/A
Unit 2 0.11 N/A
4.2 Potential Denitrification Rates: The denitrification experiments were conducted using 15N as the
nitrogen source. The 30N2 production from 15NO3 tracer incubations is considered an indication of the
presence of denitrification in the soil samples (Long et al., 2013). The 30N2 production rates from tracer
incubations were used to calculate the potential rates of denitrification. Denitrification potential is
assumed to correspond to the maximum denitrification rate (Holmes et al., 1996). Figure 9 shows the
potential denitrification rates obtained for each sites during early and late summer. The 30N2 production
rates from denitrification varied from 0.01 – 0.16 mg N2-N g-1 day-1 for the river, wetland sites, and State
Canal location.

12
The potential denitrification rates were in general lower during late summer except for the LNP site.
These results are consistent with the results of gene copy number obtained. The only exception is the rate
obtained for Legacy Nature Preserve during late summer. Potential denitrification rates measured using 14NO3 in serum bottle experiments were close
to these results. Literature values of potential
denitrification rates in wetlands range from
0.01 – 0.34 mg-N g-1 day-1 (White & Reddy,
2003), fairly comparable to the results of this
study.
Figure 9: Measured denitrification rates at
selected sites.
5.0 Molecular identification of ammonia oxidizers and denitrifiers
5.1 Presence of Denitrifying Genes: Denitrification is a four step process in which nitrate is reduced to
nitrite in the first step and nitrite is reduced to nitric oxide in the second step; eventually nitrogen gas is
produced through two other intermediate steps. The second step of denitrification (nitrite reduction to
nitric oxide) is mediated by the nitrite reductase gene (nir). Denitrifying bacteria usually contain either the
nirK or nirS enzyme (Bothe et al., 2007). The polymerase chain reaction (PCR) was performed using
biomarkers specific for nirS and nirK genes. To verify the presence of denitrifying genes in the sediment
samples from selected sites, the PCR product was run on gel electrophoresis and the pictures of the gel
are shown in figure 10. As seen from Figure 10, bright bands were found for all the sites, except for State
Canal and Unit 2 (early summer). In case of the nirK gene, only the Legacy Nature Preserve and Unit 2
sites showed a bright band in the late summer samples indicating the presence of the nirK gene.
Figure 10: Gel electrophoresis for a) nirS, b) nirK (1: early summer, 2: late summer)
A polymerase chain reaction using specific biomarkers provides only qualitative information about the
presence or absence of genes. In our next step, we employed quantitative PCR to quantify the number of
functional genes present at each site. From previous studies (Bothe et al., 2007; Henry et al., 2004;
Philippot, 2002), it is known that each denitrifying bacterial genome contains either a nirS or nirK gene

13
copy. Because nirS was present at all sites, this denitrifying functional gene was quantified for all sites.
Figure 11 shows the nirS gene copy number for selected sites during both early and late summer. As seen
from the figure, the nirS gene was found to be abundant at the Jordan River and wetland sites, ranging
from 5.5 x 10⁹ to 4.9 x 10¹⁰ copies per gram dry sediment. In comparison, the State Canal site had fewer
nirS gene copy numbers (2.9 x 10⁶ – 3.8 x 10⁷), supporting the faded band obtained during gel
electrophoresis and the lower denitrification rates.
The gene copy numbers for all sites from both
sampling times were very similar. The slight
decrease in late summer can be attributed to the
decrease in water temperature from July to
September. The gene copy number of nirK was not
detected from the qPCR experiment.
Figure 11: nirS gene copy numbers.
The nirS and nirK gene copy numbers found from
other studies ranged from 107 – 1010 and 104 – 107 per gram sediment, respectively, in rivers (O'Connor,
2006; Veraart et al., 2014), and 104 – 109 copies nirS per gram dry sediment in wetlands and marshes
(Bowen et al., 2011; Chon et al., 2011; Kim et al., 2008), which agrees well with the results of this study.
In comparison, the abundance of nirS genes in wastewater was found to be 104 – 105 copies per gm DNA
(Wang et al., 2014), whereas in this study the range of nirS gene copies per gm DNA was found to be 103
– 106. Interestingly, a municipal WWTP with a similar nirS gene copy number is removing significant
nitrogen (Wang et al., 2014). The similarity of the river and wetland nirS gene copy numbers obtained
from this study to the nirS gene copy numbers of an engineered ecosystem indicates that there is high
potential for nitrogen removal in the river and wetland sites under favorable conditions.
Further analysis was done to compare the potential denitrification rates with in-situ nitrate flux. The
sediment density was calculated following Avnimelech et al. (2001). Avnimelech et al. (2001) tested the
correlation between bulk density and organic matter in six different systems including rivers, lake, sea
floor, and pond sediments. Sediment bulk density was found to be inversely related to the organic carbon
concentration, which followed the regression equation given below.
𝐵𝑢𝑙𝑘 𝐷𝑒𝑛𝑠𝑖𝑡𝑦 𝑔/𝑐𝑚3 = 1.776− 0.363 𝑙𝑜𝑔𝑒 𝑂𝐶 (R 2 = 0.70) (5.1)
Where, OC is the organic carbon concentration (mg/g).
14
The organic carbon (OC) was considered to be 50% of the volatile solids (VS) in the sediment, following
Hogsett and Goel (2013) and Hogsett (2015). The calculated potential denitrification rates (per area),
ranged from 0.84 – 12.45 g-N m-2 day-1. Comparing these rates with the in-situ nitrate flux can provide
more insight into the nutrient flux experiments conducted for this study. For example, the in-situ nitrate
reduction at the Unit 2 wetland site based on flux data was about 7–8% of the potential denitrification rate
calculated using N15 spiked serum bottle tests. This indicates that there is a greater potential for
denitrification at this site depending on favorable environmental conditions. Comparison of the potential
denitrification rates with the in-situ nitrate fluxes supports that conclusion, and also strengthens the
findings from the nutrient flux experiments. On the other hand, at the 1300 South location during early
summer, the potential denitrification rates were found to be smaller than the in-situ nitrate flux. This
indicates that the nitrate decrease was possibly a combined effect of denitrification and algal uptake.
Previous studies reported potential denitrification rates (per area) of roughly 0.003 – 1.02 g-N m-2 day-1 in
wetland sediments (Bastviken et al., 2005; deBusk et al., 2001; Gale et al., 1993; Qiuying et al., 2012;
Risgaard-Petersen, 2003). The results of this study are, in general, higher than the values reported in
literature.
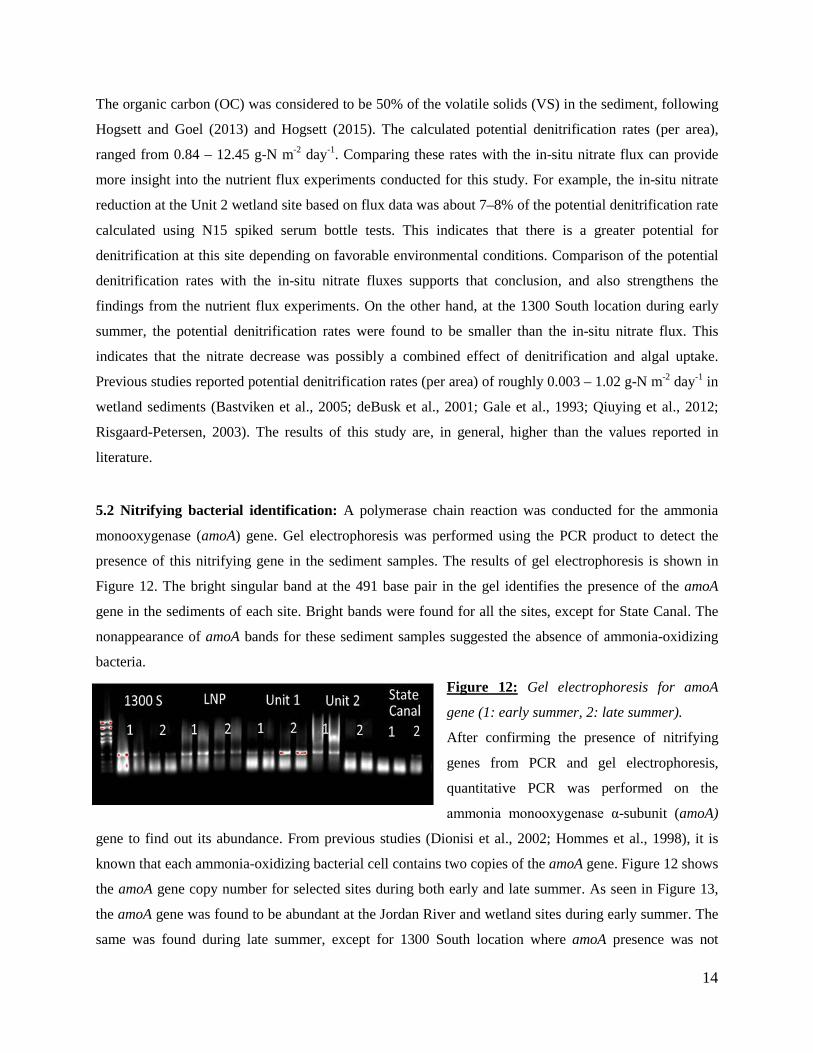
5.2 Nitrifying bacterial identification: A polymerase chain reaction was conducted for the ammonia
monooxygenase (amoA) gene. Gel electrophoresis was performed using the PCR product to detect the
presence of this nitrifying gene in the sediment samples. The results of gel electrophoresis is shown in
Figure 12. The bright singular band at the 491 base pair in the gel identifies the presence of the amoA
gene in the sediments of each site. Bright bands were found for all the sites, except for State Canal. The
nonappearance of amoA bands for these sediment samples suggested the absence of ammonia-oxidizing
bacteria.
Figure 12: Gel electrophoresis for amoA
gene (1: early summer, 2: late summer).
After confirming the presence of nitrifying
genes from PCR and gel electrophoresis,
quantitative PCR was performed on the
ammonia monooxygenase α-subunit (amoA)
gene to find out its abundance. From previous studies (Dionisi et al., 2002; Hommes et al., 1998), it is
known that each ammonia-oxidizing bacterial cell contains two copies of the amoA gene. Figure 12 shows
the amoA gene copy number for selected sites during both early and late summer. As seen in Figure 13,
the amoA gene was found to be abundant at the Jordan River and wetland sites during early summer. The
same was found during late summer, except for 1300 South location where amoA presence was not

15
detected. Gel electrophoresis also indicated lower abundance of the amoA gene at 1300 South for this
sampling event.
Figure 13: amoA gene copy numbers.
Overall, the amoA gene copy number
ranged from 1.9 x 10⁷ to 1.4 x 10¹⁰ copies
per gram dry sediment for the river and
wetland sites. In comparison, amoA gene
was found to be absent at State Canal site,
as suggested from the gel electrophoresis
outcome.
The gene copy numbers from the two sampling time were very similar at different sites. The decrease of
gene copy numbers in late summer at the Legacy Nature Preserve and Unit 2 locations can be attributed to
the decrease in water temperature from July to September. The number of copies of the amoA gene found
in other studies ranged from 103 to 107 copies per gram of dry sediment for rivers and wetlands (Erguder
et al., 2009; Sims et al., 2012), which was comparable to the results from this study.
In industrial and domestic wastewater treatment systems, the abundance of the amoA gene was found to
be 7.2 x 10³ to 3.6 x 10⁹ copies per gm dry solid (activated sludge or biofilm) (Bai et al., 2012). The
similarity of the river and wetland amoA gene copy numbers obtained in this study to the amoA gene copy
numbers of an engineered ecosystem indicates that these natural ecosystems have high potential for
ammonia oxidation under favorable conditions.
To identify the ammonia oxidizing bacteria (AOB) present in the sediments, a TRFLP experiment was
conducted using the amplified amoA gene. Figure 14 illustrates the presence of AOBs found in the
sediments for each site. Samples showed T-RF peaks at 283/206 and 491/488, which corresponds to
Nitrospira-like AOB and the Nitrosomonas europaea/eutropha lineage, respectively (Gilomen, 2008;
Park & Noguera, 2004; Whang et al., 2009). Both Nitrosomonas europaea and Nitrospira-like AOB
dominated at the Jordan River sites, while the wetland sites and State Canal location were dominated by
Nitrosomonas europaea only.
Typically found in the treatment of industrial and sewage waste (Chain et al., 2003), Nitrosomonas
europaea is an ammonia-oxidizing bacterium (Chain et al., 2003) that lives in places rich in ammonia and
inorganic salt (Shrestha et al., 2001). The Nitrospira lineage, on the other hand, is a Nitrosospira-like
amoA Gene Copy Number
1300 S LNP Unit 1 Unit 2
copy
num
ber g
-1
1 e+5
1e+6
1e+7
1e+8
1e+9
1e+10
1e+11
1e+12
1e+13
E arly S um m erLa te S um m er

16
AOB (Gilomen, 2008; Park & Noguera, 2004). These bacteria are considered the dominant nitrifiers in
wastewater treatment plants (Park & Noguera, 2004; Siripong & Rittmann, 2007; Whang et al., 2009).
Therefore, the presence of Nitrosomonas europaea and the Nitrospira lineage in Jordan River and
wetland sediments, as found in this study, point toward the degraded and polluted nature of the sediments
due to the contamination of high levels of nitrogen compounds (Shrestha et al., 2001), particularly
ammonia, as AOBs mostly thrive in areas of high ambient ammonia concentrations (Erguder et al., 2009;
Sims et al., 2012). Moreover, ambient low dissolved oxygen (3.6-7.6 mg/L), ammonia concentration
(0.13-1.38 mg/L), and water temperatures (19.4-23.9 oC) at the selected sites (Table 4.1) also were within
the optimal growth range of the AOBs (Erguder et al., 2009).
Figure 14: Electropherograms of amoA gene TRFLP specific to AOB.
6.0 Conclusions

17
The SOD for the Jordan River sites ranged from 2.4 to 2.9 g-DO m-2 day-1, whereas the wetland sites had
SOD values as high as 11.8 g-DO m-2 day-1, which categorized the river and wetland sediments as
between ‘moderately polluted’ and ‘sewage like sludge.’ The majority of the ambient DO deficit was
found to be related to SOD with more than 70% of ambient DO demand partitioned into sediments. Leaf
shedding in Utah typically starts in September, which loads significant organic matter to the waterbody.
The SOD during late summer was perhaps higher than early summer due to the decomposition of this
additional organic matter load.
Results of the sediment nitrogen flux experiments helped understand the combined effect of biochemical
reactions like ammonification, nitrification, and denitrification at the sediment surface. Results confirmed
the increase in denitrification and nitrification activity upon the availability of bioavailable nutrients.
Characterizing the sediment microbial features using bio-molecular tools confirmed the presence of
denitrifying (nirS and nirK) and nitrifying (amoA) genes. Nitrosomonas europaea and Nitrospira-like
AOB dominated the Jordan River sites, while the wetland and State Canal locations were dominated by
Nitrosomonas europaea only. The similarity of the Jordan River and wetland sites’ nirS and amoA gene
copy numbers to that of an engineered ecosystem indicates that these natural ecosystems have a high
potential for nitrogen removal and ammonia oxidation under favorable conditions.
The potential denitrification and nitrification rates at the Jordan River and Farmington Bay wetland sites
ranged from 0.01 – 0.16 mg N2-N g-1 day-1 and 0.008 to 0.07 mg-N g-1 day-1, respectively. These rates
further supported the findings of the biomolecular experiments for characterizing the sediment
microbiology. Results suggested the dominance of denitrification over nitrification at river sites.
Comparing the potential rates of denitrification and nitrification with the in-situ nitrogen fluxes at the
Jordan River and GSL Wetland sites provided a useful insight to the nitrogen dynamics at these locations.
A good understanding of the nutrient concentration in the inflows and outflows of the Jordan River has
been achieved through the extensive monitoring of UDWQ. However, the findings on the nitrogen
transformation in the river and wetlands due to sediment biological activities can be valuable for the
ongoing Jordan River TMDL study.

18
7.0 References
• Avnimelech, Y., G. Ritvo, L.E. Meijer, and M. Kochba, 2001). Water content, organic carbon and dry
bulk density in flooded sediments. Aquacultural Engineering 25(1): 25-33.
• Bai, Y., Q. Sun, D. Wen, and X. Tang, 2012. Abundance of ammonia-oxidizing bacteria and archaea
in industrial and domestic wastewater treatment systems. FEMS Microbiology Ecology 80(2): 323-
330.
• Beaulieu, J.J., J.L. Tank, S.K. Hamilton, W.M. Wollheim, R.O. Hall, P.J. Mulholland, et al., 2011.
Nitrous oxide emission from denitrification in stream and river networks. Proceedings of the National
Academy of Sciences 108(1): 214-219.
• Bothe, H., S. Ferguson, and W.E. Newton (Eds.), 2007. Biology of the nitrogen cycle. Elsevier. ISBN:
978-0-444-52857-5.
• Butts, T. A., and Evans, R. L. (1978). “Sediment oxygen demand studies of selected northeastern
Illinois streams.” Illinois State Water Survey, Circular 129, NTIS Publication No. PB-285-788.
Springfield, VA: NTIS.
• Cébron, A., J. Garnier and G. Billen, 2005. Nitrous oxide production and nitrification kinetics by
natural bacterial communities of the lower Seine River (France). Aquatic Microbial Ecology 41(1):
25-38.
• Chain, P., J. Lamerdin, F. Larimer, W. Regala, V. Lao, M. Land, et al., 2003. Complete genome
sequence of the ammonia-oxidizing bacterium and obligate chemolithoautotroph Nitrosomonas
europaea. Journal of Bacteriology 185(9): 2759-2773.
• Chen, W.B., W.C. Liu and L.T. Huang, 2012. Measurement of sediment oxygen demand for
modeling the dissolved oxygen distribution in a subalpine lake. International Journal of Physical
Sciences 7(27): 5036-5048.
• Connolly, N.M., M.R. Crossland and R.G. Pearson, 2004. Effect of low dissolved oxygen on survival,
emergence, and drift of tropical stream macroinvertebrates. Journal of the North American
Benthological Society 23(2): 251-270.
• Dai, M., X. Guo, W. Zhai, L. Yuan, B. Wang, L.Wang, P. Cai, T. Tang, and W.J. Cai, 2006. Oxygen
depletion in the upper reach of the Pearl River estuary during a winter drought. Marine
Chemistry 102(1): 159-169.

19
• de Bie, M.J., M. Starink, H.T. Boschker, J.J. Peene and H.J. Laanbroek, 2002. Nitrification in the
Schelde estuary: methodological aspects and factors influencing its activity. FEMS Microbiology
Ecology 42(1): 99-107.
• Esten, M. E., & Wagner, K. J. (2010). “Investigation of benthic phosphorus flux controls in Lake
Waco, Texas.” Lake and Reservoir Management, 26(2), 114-122.
• Garibyan, L. and N. Avashia, 2013. Polymerase chain reaction. Journal of Investigative
Dermatology 133(3), e6.
• Hantush, M. M., Kalin, L., Isik, S., and Yucekaya, A. (2012). “Nutrient dynamics in flooded
wetlands. I: model development.” Journal of Hydrologic Engineering, 18(12), 1709-1723
• Hogsett, M. C. (2015). “Water Quality and Sediment Biogeochemistry in the Urban Jordan River,
UT.” Doctor of Philosophy Thesis, Department of Civil and Environmental Engineering. The
University of Utah.
• Hogsett, M., and Goel, R. (2013). “Dissolved Oxygen Dynamics at the Sediment–Water Column
Interface in an Urbanized Stream.” Environmental Engineering Science, 30(10), 594-605.
• Kadlec, R. H., and Wallace, S. (2009). Treatment wetlands, 2nd edition. CRC press.
• Kemp, M. J., and Dodds, W. K. (2002). “The influence of ammonium, nitrate, and dissolved oxygen
concentrations on uptake, nitrification, and denitrification rates associated with prairie stream
substrata.” Limnology and Oceanography, 47(5), 1380-1393.
• Levi, P.S., J.L. Tank, S.D. Tiegs, D.T. Chaloner and G.A Lamberti, 2013. Biogeochemical
transformation of nutrient subsidy: salmon, streams and nitrification. Biogeochemistry 113(1-3): 643-
655.
• Lillebø, A.I., M. Morais, P. Guilherme, R. Fonseca, A. Serafim and R. Neves, 2007. Nutrient
dynamics in Mediterranean temporary streams: a case study in Pardiela catchment (Degebe River,
Portugal). Limnologica - Ecology and Management of Inland Waters 37(4): 337-348.
• Liu, W. C., & Chen, W. B. (2012). “Monitoring sediment oxygen demand for assessment of dissolved
oxygen distribution in river.” Environmental monitoring and assessment, 184(9), 5589-5599.
• Long, A., J. Heitman, C. Tobias, R. Philips and B. Song, 2013. Co-occurring anammox,
denitrification, and codenitrification in agricultural soils. Applied and environmental
microbiology 79(1): 168-176.
• Macrae, M. L., English, M. C., Schiff, S. L., and Stone, M. A. (2003). “Phosphate retention in an
agricultural stream using experimental additions of phosphate.” Hydrological processes, 17(18),
3649-3663.
20
• Malecki, L. M., White, J. R., and Reddy, K. R. (2004). “Nitrogen and phosphorus flux rates from
sediment in the lower St. Johns River estuary.” Journal of environmental quality, 33(4), 1545-1555.
• Medeiros, A.O., C. Pascoal and M.A.S. Graça, 2009. Diversity and activity of aquatic fungi under
low oxygen conditions. Freshwater Biology 54(1): 142-149.
• Miskewitz, R. J., Francisco, K. L., and Uchrin, C. G. (2010). “Comparison of a novel profile method
to standard chamber methods for measurement of sediment oxygen demand.” Journal of
Environmental Science and Health Part A, 45(7), 795-802.
• Miskewitz, R., & Uchrin, C. (2013). “In-Stream Dissolved Oxygen Impacts and Sediment Oxygen
Demand Resulting from Combined Sewer Overflow Discharges.” Journal of Environmental
Engineering, 139(10), 1307-1313.
• Mulholland, P. J., Valett, H. M., Webster, J. R., Thomas, S. A., Cooper, L. W., Hamilton, S. K., and
Peterson, B. J. (2004). “Stream denitrification and total nitrate uptake rates measured using a field
15N tracer addition approach.” Limnology and Oceanography, 49(3), 809-820.
• Mulholland, P.J. and J.R. Webster, 2010. Nutrient dynamics in streams and the role of J-
NABS. Journal of the North American Benthological Society 29(1): 100-117.
• Osborn, A.M., E.R. Moore and K.N. Timmis, 2000. An evaluation of terminal‐restriction fragment
length polymorphism (T‐RFLP) analysis for the study of microbial community structure and
dynamics. Environmental microbiology 2(1): 39-50.
• Park, H.D. and D.R. Noguera, 2004. Evaluating the effect of dissolved oxygen on ammonia-oxidizing
bacterial communities in activated sludge. Water Research 38(14): 3275-3286.
• Pauer, J. J., and Auer, M. T. (2000). “Nitrification in the water column and sediment of a
hypereutrophic lake and adjoining river system.” Water Research, 34(4), 1247-1254.
• Reddy, K. R., and DeLaune, R. D. (2008). Biogeochemistry of Wetlands. CRC Press.
• Saiki, R.K., S. Scharf, F. Faloona, K.B. Mullis, G.T. Horn, H.A. Erlich and N. Arnheim, 1985.
Enzymatic amplification of beta-globin genomic sequences and restriction site analysis for diagnosis
of sickle cell anemia. Science 230(4732): 1350-1354.
• Shrestha, N.K., S. Hadano, T. Kamachi and I. Okura, 2001. Conversion of ammonia to dinitrogen in
wastewater by Nitrosomonas europaea. Applied biochemistry and biotechnology 90(3): 221-232.
• Starry, O. S., Valett, H. M., and Schreiber, M. E. (2005). “Nitrification rates in a headwater stream:
influences of seasonal variation in C and N supply.” Journal of the North American Benthological
Society, 24(4), 753-768.
• Strauss, E. A., and Lamberti, G. A. (2002). “Effect of dissolved organic carbon quality on microbial
decomposition and nitrification rates in stream sediments.” Freshwater Biology, 47(1), 65-74.

21
• Teeters, D.S., 2015. Nutrients in the Great Salt Lake Wetlands: The Importance of Sediment Fluxes
and Biogeochemistry. Master’s Thesis, The University of Utah.
• Utley, B. C., Vellidis, G., Lowrance, R., and Smith, M. C. (2008). “Factors affecting sediment
oxygen demand dynamics in blackwater streams of Georgia’s coastal plain.” JAWRA Journal of the
American Water Resources Association, 44(3), 742–753.
• VanZomeren, C. M., White, J. R., & DeLaune, R. D. (2013). “Ammonification and denitrification
rates in coastal louisiana bayou sediment and marsh soil: Implications for Mississippi River diversion
management.” Ecological Engineering, 54, 77-81.
• Wang, Z., X.X. Zhang, X. Lu, B. Liu, Y. Li, C. Long and A. Li, 2014. Abundance and diversity of
bacterial nitrifiers and denitrifiers and their functional genes in tannery wastewater treatment plants
revealed by high-throughput sequencing. PloS one 9(11): e113603.
• Wood, T. M., 2001. Sediment oxygen demand in Upper Klamath and Agency Lakes, Oregon, 1999.
U.S. Geological Survey Water-Resources Investigations Report 01–4080, 13 p.
• Yogendra, K. and E.T. Puttaiah, 2008. Determination of Water Quality Index and Suitability of an
Urban Waterbody in Shimoga Town, Karnataka. In Proceedings of Taal 2007: The 12th World Lake
Conference, 342-346. Sengupta, M., and Dalwani, R. (Editors).
• Zhu, G., M.S. Jetten, P. Kuschk, K.F. Ettwig and C. Yin, 2010. Potential roles of anaerobic
ammonium and methane oxidation in the nitrogen cycle of wetland ecosystems. Applied microbiology
and biotechnology
• Ziadat, A. H., and Berdanier, B. W. (2004). “Stream depth significance during in-situ sediment
oxygen demand measurements in shallow streams.” JAWRA Journal of the American Water
Resources Association, 40(3), 631–638.