nitrogen guidelines for field crops in new...
TRANSCRIPT

Nitrogen Guidelines for Field Crops in New York. Second Release. June 22, 2003.
1
NITROGEN GUIDELINES FOR FIELD CROPS IN NEW YORK
Quirine M. Ketterings, Stuart D. Klausner, and Karl J. Czymmek
Department of Crop and Soil Sciences
Cornell University
Department of Crop and Soil Sciences Extension Series E03-16
June 22, 2003.
Quirine M. Ketterings is an Assistant Professor of Nutrient Management in Agricultural Systems, Department of Crop and Soil Sciences, Cornell University. Karl J. Czymmek is a Senior Extension Associate with PRO-DAIRY. Stuart D. Klausner retired from the Department of Crop and Soil Sciences, Cornell University where he worked as a Senior Extension Associate in Nutrient Management. For more information contact Quirine Ketterings at the Department of Crop and Soil Sciences, Cornell University, 817 Bradfield Hall, Ithaca, NY 14583 or e-mail: [email protected].
Nitrogen Guidelines for Field Crops in New York. Second Release. June 22, 2003.
2
Acknowledgments:
The agronomic nitrogen fertilizer guidelines for field crops are based on decades of field research conducted in New York by D.R. Bouldin, S.D. Klausner, D.J. Lathwell, and W.S. Reid, retired faculty members at the Department of Crop and Soil Sciences, Cornell University. The Leaching Index section was taken from the Department of Crop and Soil Sciences Extension Publication E03-2 “The New York Nitrate Leaching Index” by Czymmek, Ketterings, Van Es and DeGloria (2003). This publication is downloadable from the Nutrient Management Spear Program website (http://nmsp.css.cornell.edu/). Several paragraphs of this publication appeared in “Nutrient Management: Crop Production and Water Quality. NRAES-101”, by S.D. Klausner, published by NRAES in 1997. Those sections were re-printed with permission from NRAES.
Correct citation:
Ketterings, Q.M., S.D. Klausner and K.J. Czymmek (2003). Nitrogen guidelines for field crops in New York. Second Release. Department of Crop and Soil Extension Series E03-16. Cornell University, Ithaca, NY. 70 pages.
Originally released as:
Ketterings, Q.M., S.D. Klausner and K.J. Czymmek (2001). Nitrogen recommendations for field crops in New York. Department of Crop and Soil Sciences Extension Series E01-4. Cornell University, Ithaca, NY. 39 pages.
For copies of this document:
This document is downloadable from the Nutrient Management Spear Program at: http://nmsp.css.cornell.edu/. For bound hardcopies contact Pam Kline by e-mail ([email protected]), phone (607-255-2177) or regular mail (234 Emerson Hall, Department of Crop and Soil Sciences, Cornell University, Ithaca, NY 14853).
©2003. All rights reserved.

Nitrogen Guidelines for Field Crops in New York. Second Release. June 22, 2003.
3
TABLE OF CONTENTS 1. INTRODUCTION 5
2. NITROGEN REACTIONS IN SOIL 5
2.1 Fixation 5
2.2 Mineralization 6
2.3 Nitrification 6
2.4 Denitrification 6
2.5 Immobilization 7
2.6 Ammonia Volatilization 7
3. SOURCES OF NITROGEN 8
3.1 Soil organic matter 8
3.2 Legumes and grass sods 8
3.3 Manure 10
4. CALCULATING NITROGEN RECOMMENDATIONS FOR
SPECIFIC FIELD CROPS 12
4.1 Grain corn and corn silage 13
4.2 Grain sorghum, sorghum forage, sudangrass, sorghum sudan
hybrid, and millet 14
4.3 Stands of alfalfa, alfalfa grass, birdsfoot trefoil, birdsfoot
trefoil-clover, and clover-grass 15
4.4 Establishment and topdressing of grass 15
4.5 Wheat, wheat seeded with legume, winter barley, winter barley with
legume, and rye 15
4.6 Oats, oats with legume, spring barley and spring barley with legume 16
4.7 Sunflowers 16
4.8 Christmas trees 17
4.9 Other field crops 17

Nitrogen Guidelines for Field Crops in New York. Second Release. June 22, 2003.
4
5. NITROGEN FERTILIZERS 18 6. PRE-SIDEDRESS NITROGEN TEST (PSNT) 19 7. NITRATE LEACHING INDEX 21 CITED REFERENCES 24 SELECTED BACKGROUND REFERENCES 24 APPENDIX 28
Table 1: Soil management group, hydrologic group, inorganic nitrogen uptake efficiencies, soil N supply and corn yield potential
for undrained and artificially drained New York soils 28 Table 2: Soil management groups for New York State soils 44
Table 3: New York township-based nitrate leaching index for soils with hydrological groups A, B, C and D. 44

Nitrogen Guidelines for Field Crops in New York. Second Release. June 22, 2003.
5
1. INTRODUCTION
Nitrogen (N) is an essential and often growth-limiting plant nutrient. Crops take up N that is released to the soil solution as a result of atmospheric deposition, soil organic matter mineralization, crop residue decomposition and animal manure and inorganic fertilizer addition. Furthermore, N may become available through biological fixation. Only inorganic N, principally nitrate (NO3
-) and ammonium (NH4+) is available
for plant growth. Nitrite (NO2-) can be taken up but this N form is toxic to plants and is
generally present in trace quantities only. A deficiency in nitrogen leads to yield declines or even a complete crop failure. An excess of nitrogen may lead to excessive vegetative growth, lodging, delayed maturity, increased disease susceptibility, low crop quality, and nitrate accumulation. Excesses may contribute to acid rain, destruction of the ozone layer in the stratosphere, the greenhouse effect, eutrophication of surface waters, contamination of ground water, and fish and other marine life kills, as well as blue baby syndrome in infants and amphibian mortality and deformations. The nitrate concentration in ground and surface waters is an important water-quality index. The U.S. Environmental Protection Agency (EPA) has set the Federal Standard for the maximum permitted amount of nitrate N in drinking water at 10 mg N per L or 43 mg NO3
- per L. It is important from both an economic and an environmental standpoint to manage
N optimally. Thus, the two primary objectives of N management are: (1) to have adequate inorganic N available during the growing season; and (2) to minimize the availability of inorganic N during the fall, winter, or early spring, when N may be transported to surface and groundwater.
2. NITROGEN REACTIONS IN SOIL
2.1 Fixation
The atmosphere is about 78% N2 by volume. This gaseous N is chemically stable and unavailable to most biological organisms. However, some species of bacteria can convert N2 to N containing organic compounds. This process is called biological fixation and it is the primary mechanism by which atmospheric N2 is added to the soil. Legumes such as alfalfa and clover have root nodules that contain N-fixing bacteria that convert atmospheric N2 to protein. The legume, upon its death, will increase the amount of organic N in the soil as decomposition proceeds.
N2 à NH3 à R-NH2 (nitrogen gas) (ammonia) (organic nitrogen)

Nitrogen Guidelines for Field Crops in New York. Second Release. June 22, 2003.
6
2.2 Mineralization
Organic N exists in plants, soil organic matter, soil microorganisms, animal manure, etc. When organic N decomposes, it is converted into ammonium. This process, facilitated by microorganisms, is called mineralization. Because ammonium is positively charged, it is generally adsorbed by the negatively charged soil particles that dominate soils. Thus, the ammonium leaching potential is minimal. R-NH2 à NH3 à NH4
+ (organic nitrogen) (ammonia) (ammonium)
2.3 Nitrification
Certain microorganisms in the soil convert ammonium to nitrite and then to nitrate by a process called nitrification. Nitrification occurs rapidly when the soil is moist, warm, and well aerated. These conditions coordinate well with early summer when crop N needs are on the rise. Nitrification will significantly increase soil acidity (decrease pH) by producing H+ ions. Liming materials may be needed to counteract the added acidity. Nitrification is affected by soil temperature: nitrification rates are virtually zero below 41oF and above 122oF. Optimum temperature range for nitrification is 67-86oF. The nitrifying bacteria require oxygen. Thus, soil drainage and aeration stimulate nitrification. Although ammonium is not very prone to leaching losses, fertilizer-ammonium applications may still lead to large leaching losses because of rapid nitrification. NH4
+ à NO2- à NO3
- (ammonium) (nitrite) (nitrate) 2.4 Denitrification
When there is a depletion of oxygen in the soil, anaerobic bacteria can convert nitrate into gaseous forms of N including nitric oxide gas, nitrous oxide gas, and dinitrogen gas. This process, called denitrification, results in a loss of plant available N from the soil and its return to the atmosphere. Denitrification is accelerated in poorly aerated (<10% oxygen), and/or waterlogged soils. The optimum temperature for denitrification is between 77 and 95oF. Denitrification ceases to take place at temperatures <33oF and >122oF. Dinitrogen gas is environmentally harmless. However, NO and N2O can contribute to the formation of nitric acid (an important component of acid rain) and are also contributors to the greenhouse effect. N2O, in addition, contributes to the destruction of ozone. NO3
- à NO2- à NO à N2O à N2
(nitrate) (nitrite) (nitric oxide) (nitrous oxide) (dinitrogen gas)

Nitrogen Guidelines for Field Crops in New York. Second Release. June 22, 2003.
7
=
2.5 Immobilization
Soil microbes compete with plants for ava ilable ammonium and nitrate. Immobilization refers to the process by which inorganic N is bound in the microbial biomass, thus making it unavailable to plants until the microbes die and decompose, in which case the N re-enters the mineralization process. Immobilization and mineralization occur simultaneously in the soil. Whether the net effect is an increase or a decrease in inorganic N depends on which process dominates. A high (>25) carbon to nitrogen ratio of the organic material that is being decomposed may result in a (temporary) net immobilization of N. This may be observed when large amounts of straw or sawdust bedding are included with manure applications. It may also occur when low N containing stubble is tilled into the soil. NH4
+ (ammonium) R-NH2 (organic nitrogen) NO3
- (nitrate) 2.6 Ammonia volatilization
Nitrogen can be lost to the atmosphere by volatilization, a process whereby a substance is converted from a solid or liquid to a gas. Typically, N is lost by volatilization of ammonia when urea-containing fertilizers or manure are applied on the soil surface and not incorporated. Little or no ammonia loss occurs from surface applications of acidic fertilizers such as ammonium nitrate or ammonium sulfate, unless the soil pH is very high. Ammonia volatilization increases with increasing soil pH and decreasing moisture content. High temperatures also stimulate volatilization. As much as 50% of the total amount of manure N may be lost if the manure is not incorporated after application. O H2N-C-NH2 à NH4
+ à NH3 (urea) (ammonium) (ammonia)

Nitrogen Guidelines for Field Crops in New York. Second Release. June 22, 2003.
8
3. SOURCES OF NITROGEN There are four main sources of N: (1) native soil organic matter; (2) organic amendments (animal and green manure, compost, plowed under sods); (3) biologically fixed N; and (4) inorganic fertilizer N. To calculate the inorganic N requirement for optimum economic yield, adjustments need to be made for biologically fixed N and/or N released from one or more of the organic sources. Procedures used to estimate N release from plowed under sods and from manure applications are discussed below. 3.1 Soil organic matter
Soil organic matter consists of plant and animal residues, living soil organisms,
and substances synthesized by these organisms. Organic matter is decomposed by soil microorganisms and results in the release of many essential plant nutrients. Soils in New York can typically supply 40 to 80 pounds of N per acre annually depending on soil type, organic matter content, and previous management. In spite of its variable nature, soil organic matter is an important source of available N and must be accounted for when determining fertilizer requirements. The soil’s nitrogen supplying capacity (SoilN in lbs N/acre) is a function of soil type and artificial drainage class:
SoilN = N_sup_ud + ((N_sup_dr – N_sup_ud) * (ArtificialDrainage/3)) [1]
Where:
N_sup_ud is the amount of N supplied by an undrained soil (lbs N/acre). N_sup_dr is the amount of N supplied by the same soil with excellent rated artificial drainage (lbs N/acre). ArtificialDrainage is a factor to adjust soil N supply for field artificial drainage conditions:
If artificial drainage = “none” then ArtificialDrainage = 0 If artificial drainage = “inadequate” then ArtificialDrainage = 1 If artificial drainage = “adequate” then ArtificialDrainage = 2 If artificial drainage = “excellent” then ArtificialDrainage = 3
Table 1 in the Appendix lists estimates of soil N supply for each New York soil type. 3.2 Legumes and grass sods
Legumes can, through biological N fixation, acquire enough N to meet their
requirements, assuming that proper inoculation and nodulation occur. Grasses, including

Nitrogen Guidelines for Field Crops in New York. Second Release. June 22, 2003.
9
corn, cannot fix atmospheric N and therefore require N addition either supplied by companion legumes, animal or green manures, soil organic matter mineralization, or fertilizer application. Sod crops that are credited for N in the nitrogen recommendations are listed in Table 1. Nitrogen is bound in the roots and above ground biomass of grasses and legumes. When the legume, grass, or legume/grass sod is killed, the organic N will become available to subsequent crop(s) through mineralization. The amount of N available from these crop residues is a function of the sod density and quality, the percent legume, and time since the sod crop was plowed or killed. If a good quality sod is 100% grass, the amount of organic N is estimated to approach 150 lbs/acre. Legumes contribute a greater amount of N because of their greater N content; for good stands with 1-25% legume, the total amount of organic N may reach 200 lbs N/acre. A stand with 26-50% legume will yield approximately 250 lbs N/acre while a >50% legume containing sod is estimated to contain about 300 lbs N/acre (Table 2). Table 1: Cornell crop codes and descriptions of “sod” crops.
Crop Codes*
Crop Description
Crop Codes*
Crop Description
ABE & ABT Alfalfa Trefoil Grass CLE & CLT Clover AGE & AGT Alfalfa Grass CSE & CST Clover Seed Production ALE & ALT Alfalfa CVE & CVT Crownvetch BCE & BCT Birdsfoot Trefoil Clover GIE & GIT Grasses Intensively Managed BGE & BGT Birdsfoot Trefoil Grass GRE & GRT Grasses BSE & BST Birdsfoot Trefoil Seed PGE & PGT Pasture with Improved Grasses BTE & BTT Birdsfoot Trefoil PIT Pasture Intensively Grazed CGE & CGT
Clover Grass
PLE & PLT
Pasture with Legumes
* A crop with a crop code ending with an “E” is in its establishment year while a crop code ending with a “T” implies an established sod. Table 2: Expected N credits from plowed down sods.
Available N
Legume in sod
Total N pool
Year 1*
Year 2
Year 3 % lbs N/acre lbs N/acre lbs N/acre lbs N/acre
0
150
83
18
8 1-25 200 110 24 10 26-50 250 138 30 13
50 or more 300 165 36 15
* First year following plow down.

Nitrogen Guidelines for Field Crops in New York. Second Release. June 22, 2003.
10
The N contribution from sod is discounted depending on the number of years since the sod crop was plowed down. Of the total amount of organic N contained in the sod, 55% is expected to be available to the first crop after plowdown, 12% to the next crop and 5% to the third crop or year. This N contribution reduces the N requirement of subsequent crops accordingly. Thus, 55% or 83 lbs N/acre of an estimated 150 lbs N/acre in a good grass sod is expected to be available to the next crop. No N credits are expected for crops planted more than three years after sod plowdown. 3.3 Manure
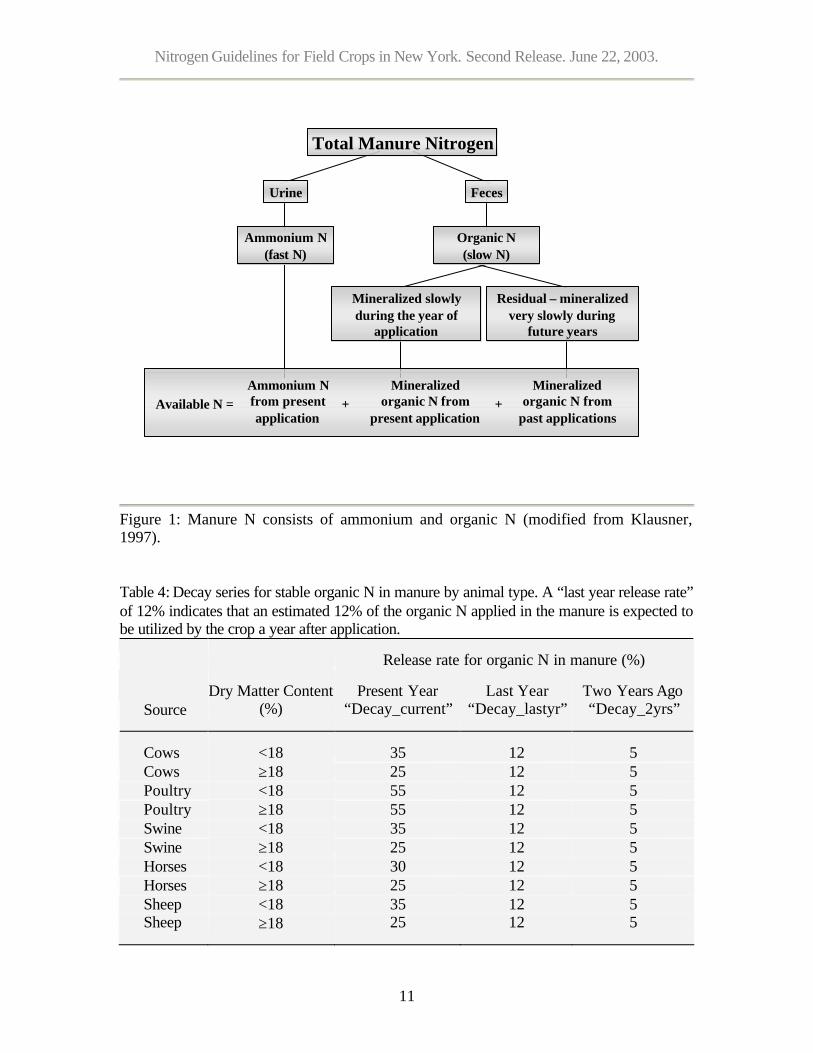
There are primarily two forms of N in manure: inorganic (ammonium) N and
organic N (Figure 1). The ammonium N is initially present in urine as urea and may account for about 50% of the total N. Urea in manure is no different from urea in commercial fertilizer. It hydrolyzes rapidly to ammonium. In principle, all of the ammonium from urea in manure is available for plant growth. However, parts or all of it may be lost because ammonium is rapidly converted to ammonia as the pH increases and the manure begins to dry. Atmospheric exposure of manure on the barn floor, in the feedlot, in storage, or after spreading increases N loss. Thus, an analysis of the manure is useful to determine how much inorganic N may be conserved before spreading. Table 3 shows the fraction of the ammonium N remaining for plant use from various livestock manures given alternative application methods and timing of application.
Table 3: Estimated ammonia-N losses as affected by manure application method.
Manure Application Method
Ammonium N Utilized by the Crop (%)
Injected during growing season 100 Incorporated within 1 day 65 Incorporated within 2 days 53 Incorporated within 3 days 41 Incorporated within 4 days 29 Incorporated within 5 days 17 No conservation/Injected in fall 0
The more stable organic N is present in the feces and is only slowly released. The decomposition of stable organic N to a plant-available inorganic form occurs at different rates. The less resistant organic N decomposes during the year of application, and the more resistant organic N decomposes very slowly in future years. Repeated application to the same field results in an accumulation of a slow release manure N source.
Nitrogen Guidelines for Field Crops in New York. Second Release. June 22, 2003.
11
Figure 1: Manure N consists of ammonium and organic N (modified from Klausner, 1997). Table 4: Decay series for stable organic N in manure by animal type. A “last year release rate” of 12% indicates that an estimated 12% of the organic N applied in the manure is expected to be utilized by the crop a year after application.
Release rate for organic N in manure (%)
Source
Dry Matter Content (%)
Present Year “Decay_current”
Last Year “Decay_lastyr”
Two Years Ago “Decay_2yrs”
Cows
<18 35 12 5 Cows ≥18 25 12 5 Poultry <18 55 12 5 Poultry ≥18 55 12 5 Swine <18 35 12 5 Swine ≥18 25 12 5 Horses <18 30 12 5 Horses ≥18 25 12 5 Sheep <18 35 12 5 Sheep
≥18 25
12
5
Total Manure Nitrogen
Urine Feces
Ammonium N(fast N)
Organic N(slow N)
Available N = + +Ammonium N from present application
Mineralized organic N from
present application
Mineralized organic N from
past applications
Mineralized slowly during the year of
application
Residual – mineralized very slowly during
future years

Nitrogen Guidelines for Field Crops in New York. Second Release. June 22, 2003.
12
A decay or mineralization series is commonly used to estimate the rate of N availability from stable organic N. A decay series of 35, 12, and 5% is used to estimate the rate of decomposition of organic N in liquid (<18% dry matter) dairy manures in New York. This sequence of numbers means that 35% of the organic N is mineralized and potentially taken up by the growing crop during the year the manure was applied, 12% of the initial organic N application is mineralized and taken up during the second year, and 5% is mineralized and taken up in the third year. There is evidence that manure containing large amounts of bedding may mineralize at a slower rate than fresh manure. Therefore, the estimated availability of N during the year applied is reduced from 35 to 25% when the dry matter content of bedded manure exceeds 18%. These decay series and those for other animal manures are listed in Table 4. Fertilizer recommendations from Cornell University are adjusted for the release of N from previous years’ applications. The following calculations are used to determine the residual manure N contribution (ResidualN_manure): ResidualN_manure = ResidN1 + ResidN2 ResidN1 = Decay_lastyr/100 * (Organic N/100) * ManureRate_lastyr ResidN2 = Decay_2yrs/100 * (Organic N/100) * ManureRate_2yrs [2] Where: ResidualN_manure is the total residual N from manure (lbs N/acre). ResidN1 is the residual N from manure applied last year (lbs N/acre). ResidN2 is the residual N from manure applied two years ago (lbs N/acre). Decay_lastyr is the organic N decay last year (%, see Table 4). Decay_2yrs is the organic N decay 2 years ago (%, see Table 4). ManureRate_lastyr is the amount of manure applied last year (lbs/acre). ManureRate_2yrs is the amount of manure applied 2 years ago (lbs/acre). Organic N is the organic N content of the applied manure on an as sampled basis.
4. CALCULATING NITROGEN RECOMMENDATIONS
FOR SPECIFIC FIELD CROPS
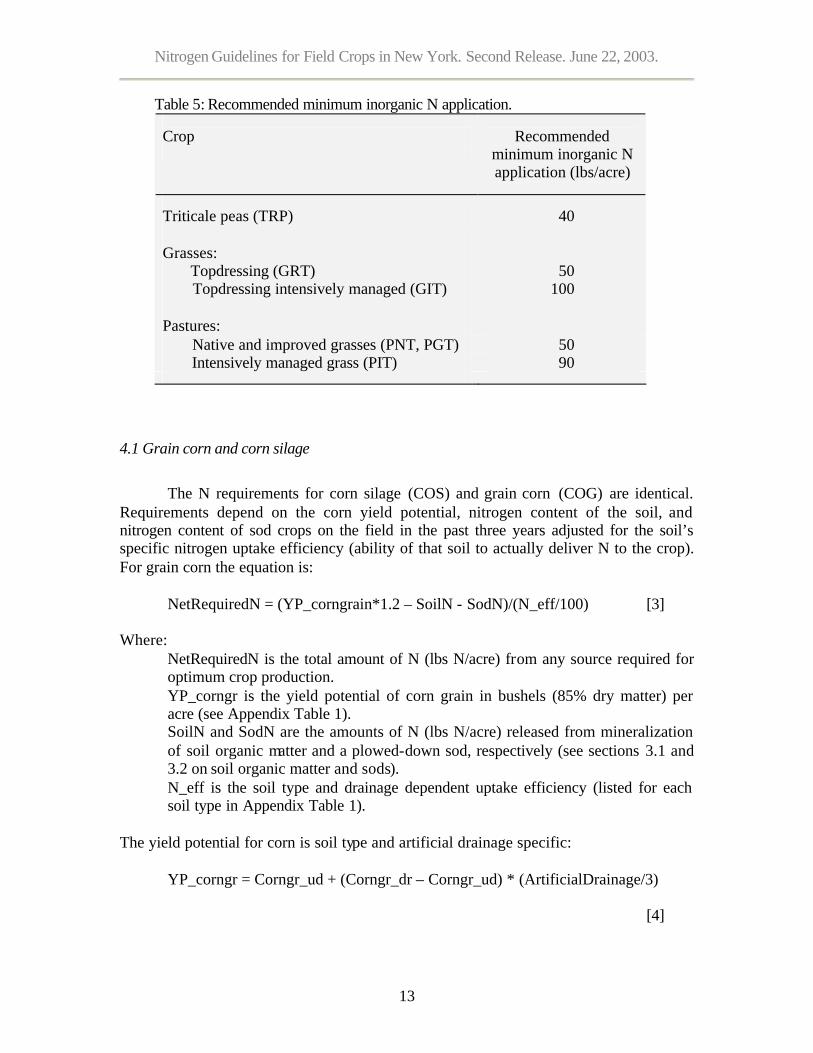
There is currently no reliable soil test for N other than the Pre-Sidedress Nitrogen Test (see section 6). Research efforts in the past have focused on the major agronomic crops in New York State (including corn) leading to more site-specific recommendations for these crops than for minor ones (such as buckwheat). Recommendations can be met by inorganic N application or a combination of inorganic and manure application. Independent of how much of the requirement is satisfied with manure or other organic sources that need to be mineralized, for some crops, a minimum inorganic N requirement is recommended for optimal economic yields (Table 5). In the following section, the approach and specific equations for several agronomic crops are outlined.
Nitrogen Guidelines for Field Crops in New York. Second Release. June 22, 2003.
13
Table 5: Recommended minimum inorganic N application.
Crop
Recommended minimum inorganic N application (lbs/acre)
Triticale peas (TRP) 40 Grasses:
Topdressing (GRT) 50 Topdressing intensively managed (GIT) 100 Pastures:
Native and improved grasses (PNT, PGT) 50 Intensively managed grass (PIT) 90
4.1 Grain corn and corn silage
The N requirements for corn silage (COS) and grain corn (COG) are identical. Requirements depend on the corn yield potential, nitrogen content of the soil, and nitrogen content of sod crops on the field in the past three years adjusted for the soil’s specific nitrogen uptake efficiency (ability of that soil to actually deliver N to the crop). For grain corn the equation is:
NetRequiredN = (YP_corngrain*1.2 – SoilN - SodN)/(N_eff/100) [3]
Where: NetRequiredN is the total amount of N (lbs N/acre) from any source required for optimum crop production. YP_corngr is the yield potential of corn grain in bushels (85% dry matter) per acre (see Appendix Table 1). SoilN and SodN are the amounts of N (lbs N/acre) released from mineralization of soil organic matter and a plowed-down sod, respectively (see sections 3.1 and 3.2 on soil organic matter and sods). N_eff is the soil type and drainage dependent uptake efficiency (listed for each soil type in Appendix Table 1).
The yield potential for corn is soil type and artificial drainage specific:
YP_corngr = Corngr_ud + (Corngr_dr – Corngr_ud) * (ArtificialDrainage/3) [4]
Nitrogen Guidelines for Field Crops in New York. Second Release. June 22, 2003.
14
Where: Corngr_ud is the expected yield of grain corn (an average over a ten year period in bushels of 85% dry matter grain per acre) grown on this undrained soil under excellent management (see Appendix Table 1). Corngr_dr is the expected yield of grain corn (bushel/acre) grown on the same soil that has excellent artificial drainage (see Appendix Table 1). ArtificialDrainage is an adjustment factor for artificial drainage identical to those reported in section 3.1 on soil organic matter. Estimated yields are converted to total N per acre assuming that 100 bushels of
grain (85% dry matter) equals 10,000 lbs of dry matter (5,000 lbs in grain and 5,000 lbs in stover) and that the average N content at optimum yield is 1.2%. For corn silage, the net N requirement is calculated assuming that 17 tons of silage (35% dry matter) equals 100 bushels of grain (85% dry matter). Silage yield potential in tons per acre (35% dry matter) is converted to yield potentia l in bushels of grain per acre by multiplying by 5.9 prior to estimation of N requirements:
1 ton silage (35% dry matter) = 5.9 bushels of corn (85% dry matter) [5] Plants are not able to take up 100% of the inorganic N supplied to the soil,
although 100% efficiency for fertilizer additions and inorganic N from manure can be approached when small quantities are directly delivered to the growing crop (e.g., as sidedress). The percentage of applied fertilizer that does become part of the plant is called the uptake efficiency. The estimates for New York State soils range from 50 to 75 percent (Appendix Table 1). In general, N uptake efficiencies (N_eff in percentage, see Appendix Table 1) are soil type and artificial drainage class specific:
N_eff = N_eff_ud + (N_eff_dr – N_eff_ud) * (ArtificialDrainage/3) [6] Where:
N_eff_ud is the estimated percentage of inorganic fertilizer N that is taken up by the corn crop when the soil is left in its original, undrained state. N_eff_dr is the expected percentage of applied N that is taken up by the plant when the soil is artificially drained. The amount of N required to obtain the desired yield potential (NetRequiredN in
lbs N/acre) can be supplied in the form of inorganic N or a combination of inorganic and manure N. The N requirement is increased by 20 lbs/acre for a no-till crop production system due to slower soil warming in the spring. The N requirement of corn grain and corn silage on soil management group 6 soils (mucks) is 95 lbs/acre.
4.2 Grain sorghum, sorghum forage, sudangrass, sorghum sudan hybrid, and millet The N requirement s for grain sorghum (SOG), sorghum forage (SOF), sudangrass (SUD), sorghum sudan hybrid (SSH), and millet (MIL) are equal to or a fraction of the N requirement for a grain corn crop:

Nitrogen Guidelines for Field Crops in New York. Second Release. June 22, 2003.
15
NetRequiredN = (YP_corngr*1.2 – SodN – SoilN)/(N_eff/100) If NetRequiredN > 50 lbs N/acre then NetRequiredN = NetRequiredN * 0.8
[7] The latter equation indicates that if the net N requirement calculated using the corn yield potential is >50 lbs/acre, it is adjusted to 80% of the corn requirement. The N requirement is increased by 20 lbs/acre for a no-till crop production system.
4.3 Stands of alfalfa, alfalfa grass, birdsfoot trefoil, birdsfoot trefoil-clover, and clover-grass
To establish a legume or legume-grass sod, no N is required. Thus, the N recommendation for establishment of alfalfa (ALE), alfalfa grass (AGE), birdsfoot trefoil (BTE), birdsfoot trefoil-clover (BCE), and clover-grass (CGE) is zero. Nitrogen requirements for topdressing of legume stands (ALT, BTT, BST, CLT, CST, and CVT) are also zero. Nitrogen requirements for topdressing of legume-grass stands (AGT, ABT, BCT, BGT, and CGT) depend on the percentage of legume in the sod: If the stand is 100% grass: NetRequiredN = 75 lbs/acre 1 to 25 % legume: NetRequiredN = 40 lbs/acre If the stand is more than 25% legume: NetRequiredN = 0 lbs/acre [8] In the current recommendations, these requirements are not adjusted for N releases from previous sods or soil organic matter.
4.4 Establishment and topdressing of grass
To establish a grass stand (GIE and GRE), 50 lbs N/acre is recommended. For topdressing, the recommendation depends on the intensity of management of the grass. Recommended N rate for topdressing of intensively managed grass is 225 lbs N/acre. For grass that is not managed intensively (1-2 cut system) this recommendation is reduced to 75 lbs N/acre.
Establishment of a grass sod (GIE< GRE): 50 lbs N/acre Topdressing of an intensively managed grass (GIT): 225 lbs N/acre Topdressing of grass in a 1-2 cut system (GRT): 75 lbs N/acre [9]
4.5 Wheat, wheat seeded with legume, winter barley, and winter barley with legume
The nitrogen recommendations for wheat (WHT), wheat seeded with legume (WHS), winter barley (BWI), and winter barley seeded with legume (BWS) depend on the number of years since sod was grown on this field and the soil management group. If it is less than 1 year ago that a sod was plowed under, the recommended N rate is 20 lbs/acre independent of soil management group because N residual from sod is built into

Nitrogen Guidelines for Field Crops in New York. Second Release. June 22, 2003.
16
these recommendations. If it was two years or more ago that a sod was plowed down, the recommendations increase (see Table 6). Unlike corn, the recommendations for these crops do not consider the % legume or soil N contributions. Soil_group is the soil management group determined by clay content, the soil rooting depth and the soil structure (Appendix Table 2). Clayey soils tend to fall in group 1, while sandy soils tend to be in group 5. Most of the silt loam soils of the central plains are group 2’s and the silt loam soils of the southern tier are group 3’s. Soils in management group 6 are muck soils. Table 6: N recommendations for wheat, wheat seeded with legume, winter barley, and winter barley with legume following sods.
Soil_group
Sod plowed under <1 year ago
Sod plowed under 1-2 year ago
Sod plowed under >2 years ago
1-4 20 50 60 5 20 60 70 6 20 70 80
4.6 Oats, oats with legume, barley-spring, barley-spring with legume and rye seed production
Similar to wheat and wheat/barley crops described above, the nitrogen recommendations for oats (OAT), oats with legume(OAS), barley-spring (BSP), barley-spring with legume (BSS) and Rye Seed Production (RYS) depend on the number of years since sod was grown on this field and the soil management group (see Table 7). Unlike corn, the recommendations for these crops do not consider the % legume or soil N contributions. Table 7: N recommendations for oats, oats with legume, barley-spring, barley-spring with legume and rye seed production following sods.
Soil_group
Sod plowed under <1 year ago
Sod plowed under 1-2 year ago
Sod plowed under >2 years ago
1-4 20 40 60 5 20 50 70 6 20 60 80
4.7 Sunflowers
The N requirement for sunflowers is estimated as 66% of the corn N requirement, given an average corn yield potential of 120 bushels (85% dry matter) per acre. The N requirement increases by 20 pounds per acre for a no-till crop production system. The minimum nitrogen requirement for sunflowers is 20 lbs N/acre.
Nitrogen Guidelines for Field Crops in New York. Second Release. June 22, 2003.
17
NetRequiredN = {(YP_corngr * 1.2 – SodN – SoilN) / (N_eff/100)} * 0.66
[10]
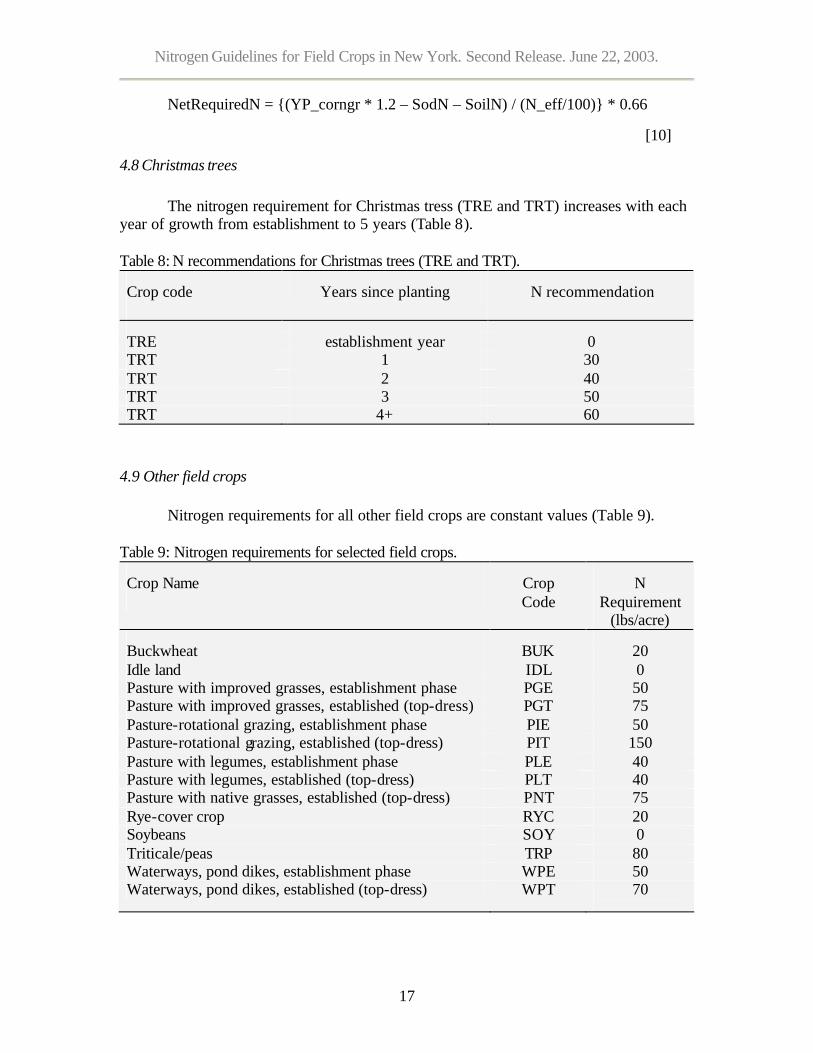
4.8 Christmas trees The nitrogen requirement for Christmas tress (TRE and TRT) increases with each year of growth from establishment to 5 years (Table 8). Table 8: N recommendations for Christmas trees (TRE and TRT).
Crop code
Years since planting
N recommendation
TRE establishment year 0 TRT 1 30 TRT 2 40 TRT 3 50 TRT 4+ 60
4.9 Other field crops
Nitrogen requirements for all other field crops are constant values (Table 9). Table 9: Nitrogen requirements for selected field crops.
Crop Name
Crop Code
N Requirement
(lbs/acre)
Buckwheat BUK 20 Idle land IDL 0 Pasture with improved grasses, establishment phase PGE 50 Pasture with improved grasses, established (top-dress) PGT 75 Pasture-rotational grazing, establishment phase PIE 50 Pasture-rotational grazing, established (top-dress) PIT 150 Pasture with legumes, establishment phase PLE 40 Pasture with legumes, established (top-dress) PLT 40 Pasture with native grasses, established (top-dress) PNT 75 Rye-cover crop RYC 20 Soybeans SOY 0 Triticale/peas TRP 80 Waterways, pond dikes, establishment phase WPE 50 Waterways, pond dikes, established (top-dress) WPT 70

Nitrogen Guidelines for Field Crops in New York. Second Release. June 22, 2003.
18
5. NITROGEN FERTILIZERS
Inorganic N requirements can be met using a variety of N containing fertilizers. Table 10 lists common fertilizer materials and their N, P2O5, K2O, S, Ca, and Mg contents as well as their salt hazards, acid-forming tendency, and additional notes. Table 10: N, P2O5, K2O, S, Ca, and Mg contents as well as the salt hazard and acid forming tendency of commonly used N containing fertilizers (adapted from Brady and Weil, 1996; Jokela et al., 1999; Beegle, 1996; Cornell Field Crops and Soils Handbook, 1987).
N
P2O5
K2O
S
Ca
Mg
Salt
hazard
CCE*
Additional notes
Ammonium nitrate (NH4 NO3)
33-34
0
0
0
0
0
high
-59
Dry material. Can be left on surface or incorporated into soil. Absorbs moisture from the air. It can be blended but not with urea. High risk of fire or explosions if mixed with oxidizable forms of C (e.g., fuel oil).
Ammonium sulfate ([NH4]2S04)
20-21
0 0 24 0 0 high -110 Dry material. Used for direct application and blended fertilizers. Can be left on surface or in-corporated into soil. Rapidly lowers the soil pH.
Urea -ammonium nitrate (UAN)
28-32
0 0 0 0 0 medium -52 Liquid fertilizer. Urea N comprises about 50% of the N. Once applied, UAN behaves as dry urea and NH4NO3. To minimize N loss, incorporate into soil. May cause leaf burn. UAN weighs 11-12 lbs per gallon.
Potassium nitrate (KNO3)
13 0 36 0.2 0.4 0.3 very high
+26 Dry crystalline material. A specialty fertilizer used for direct application or as blended fertilizer.
Anhydrous ammonia (NH3)
82 0 0 0 0 0 low -148 A high-pressure liquid. It turns into a gas when released. The gas is toxic. Needs pressurized equipment. Must be injected 6-8 inches deep on friable, moist soil to avoid N losses. Weighs about 5 lbs per gallon. Rapidly lowers the soil pH.

Nitrogen Guidelines for Field Crops in New York. Second Release. June 22, 2003.
19
N
P2O5
K2O
S
Ca
Mg
Salt
hazard
CCE*
Additional notes
Urea (NH2-CO-NH2)
45-46
0 0 0 0 0 medium -84 Dry material that should be incorporated. Urea-N rapidly hydrolyzes to NH4
+. Used for direct application, in mixed fertilizers, and in liquid nitrogen. Not recommended as a starter.
Sulfur coated urea
30-40
0 0 13-16
0 0 low -110 Dry material. Variable slow rate of release. Rapidly lowers soil pH.
Mono-ammonium phosphate (MAP) (NH4H2PO4)
11-13
48-52 0 1-2 low -65 A dry material. Used for direct application and in blended fertilizers. Makes an excellent starter fertilizer, either alone or with a small amount of potash although the N:P ratio may be to low for high P soils.
Di-ammonium phosphate (DAP) ([NH4]2HP04)
18-21
46-53 0 0-1 medium -70 A dry material. Used for direct application and in blended fertilizers. Produces free ammonia and is hence not a good starter fertilizer.
* Acid forming tendency expressed as kg CaCO3/100 kg of fertilizer. A positive number indicates an increase in pH upon application. A negative number implies a fertilizer induced decrease in pH.
6. PRE-SIDEDRESS NITROGEN TEST (PSNT)
The pre-sidedress nitrogen test (PSNT) provides a way to determine if there will be enough available nitrogen in the soil from organic sources for maximum economic yield of corn. Thus, in certain circumstances, PSNT results can help a producer decide whether or not to add extra N at sidedress time. The PSNT result is a measure of the nitrate level in the top 12 inches of soil based on a sample taken when corn is 6 to 12 inches tall (measured from the soil surface to the whorl). The test is calibrated for corn fields (second year or more) assuming the following:
§ Fertilizer N at planting is limited to 40 lbs N/acre in the band. § Pre-plant or early post-plant broadcast N is NOT used. § Sampling is done no earlier than 2-3 days after significant rainfall.
On the other hand, the PSNT is not relevant when:
§ Fields are in continuous corn and manure or other organic amendments are not used.
§ PSNT samples are collected when corn is less than 6” or more than 12” tall at the whorl.

Nitrogen Guidelines for Field Crops in New York. Second Release. June 22, 2003.
20
§ Soil samples are taken from less than 12 inch depth. § More than 40 lbs of N is band applied at planting. § Pre-plant or early post plant broadcast N is applied. § Sampling took place too soon after rainfall. The PSNT is a great tool to use when there is uncertainty as to the actual amount
of manure applied or when there is uncertainty as to whether enough manure was actually applied to meet expected corn crop N requirements. The PSNT provides an indication of the pool of readily mineralizable organic N in the soil. This is why the presence of broadcast N can cause the PSNT to overestimate the readiliy mineralizable organic N pool, rending the test useless. To obtain a representative soil sample for the PSNT, 10 to 20 soil cores per field should be taken to a depth of 12 inches when the corn is 6-12 inches tall. Samples should be taken between rows to avoid sampling the starter fertilizer band. The samples should be mixed thoroughly and a subsample dried immediately following sampling to stop further nitrification. Drying can be done in an oven at about 200oF or in a microwave. Samples can also be air dried if spread out thinly. It will reduce drying time if a fan is used to enhance air circulation above the thinly spread sample. It is important not to put wet samples on top of absorbent materials as those materials will absorb nitrate.
Samples should be sent to the Cornell Nutrient Analysis Laboratory along with the information sheet that is supplied with the purchase of the sample bag. Soil test bags can be obtained from the laboratory (804 Bradfield Hall, Ithaca, NY 14853, phone: (607) 255-4540, fax: (607) 255-7656, or e-mail: [email protected]). Information sheets can also be downloaded from the laboratory’s website (http://www.css.cornell.edu/soiltest/). The interpretations of the PSNT in New York are based on 115 field experiments conducted between 1986 and 1995 (Klausner, 1996). These experiments showed with an 80% accuracy that fields with a PSNT value of 25 ppm nitrate or greater did not need additional N. Fields testing below 21 ppm needed additional N for maximum economic yield and PSNT values between 21 and 24 ppm were borderline. A disadvantage of the PSNT is its inability to estimate how much fertilizer N needs to be applied for optimum economic yield if the test results indicate a response to additional N can be expected. This is due to the large amount of variation in relative yield for any given PSNT value below the critical level of 25 ppm. However, for fields with PSNT values of 21-24 ppm, there is a reasonable probability of a response to some N, and the recommendation for these fields is to add 25-50 lbs N per acre as a sidedress application. For fields with PSNT values less than 21 ppm, the standard N recommendations as outlined in section 4.1 should be used to determine how much N to apply (Table 11). Table 11: Interpretation of the pre-sidedress nitrogen test (PSNT) for New York.
PSNT (ppm)
Probability of an economic response
N recommendation
<21
High
Follow Cornell N recommendations for corn 21-24 About 10% Consider sidedressing 25-50 lbs N/acre 25 or more Very low No extra N needed

Nitrogen Guidelines for Field Crops in New York. Second Release. June 22, 2003.
21
7. NITRATE LEACHING INDEX1 The Nitrate Leaching Index (LI) is an indicator of the potential for nitrate to reach groundwater. Nitrate, because it is water soluble, moves downward as water percolates through the soil. The extent of percolation depends on permeability, pore-size distribution, soil depth to a restrictive layer, artificial drainage, and precipitation amount and distribution over the year. For a given precipitation pattern, excessively well drained soils such as Howard, Adams, Hoosic and Tunkhannock, or even well drained soils such as Madrid, Palmyra, Honeoye and Ontario have a significantly greater leaching potential than less well drained soils such as Vergennes, Swanton, Rhinebeck, Lordstown or Volusia. The current LI rates leaching potential based on soil hydrologic group (Table 12) and 10 year average precipitation data from weather stations around NY. Until recently, rainfall data were county-based. The latest version of the LI uses township-based precipitation data, which more accurately reflects precipitation patterns than the previously used county-based data. The effect of township-based data on LI score varies: some areas have significantly higher scores, some significantly lower, while other areas are essentially unchanged. Table 12: Soil hydrologic groups. See Appendix Table 1 for the hydrologic groups of New York State soils.
Soil hydrologic
group
Type Infiltration capacity/
permeability
Leaching potential
Runoff potential
A Deep, well-drained sands and gravels.
High High Low
B Moderately drained, moderately fine to moderately coarse texture.
Moderate Moderate Moderate
C Impeding layer, or moderately fine to fine texture.
Low Low High
D Clay soils, soils with high water table. Very low Very low Very high
The Nitrate Leaching Index is the product of the Percolation Index and the Seasonal Index (Williams and Kissel, 1991): LI=Percolation Index*Seasonal Index. The Percolation Index (PI) is a function of the annual average precipitation (PA) and soil
1 The Leaching Index section was taken from the Department of Crop and Soil Sciences Extension Publication E03-2 “The New York Nitrate Leaching Index” by Czymmek, Ketterings, Van Es and DeGloria (2003).

Nitrogen Guidelines for Field Crops in New York. Second Release. June 22, 2003.
22
hydrologic group. The hydrologic group for each New York soil series can be found in Appendix Table 1. Under identical precipitation levels, soils with a hydrologic group “A” have the greatest percolation potential while soils of hydrologic group “D” have the least percolation and therefore are least conducive to leaching. Equations are shown below for users who wish to build these into their own software applications:
Hydrologic Group A: PI = (PA – 10.28)2 / (PA + 15.43) Hydrologic Group B: PI = (PA – 15.05)2 / (PA + 22.57) Hydrologic Group C: PI = (PA – 19.53)2 / (PA + 29.29) Hydrologic Group D: PI = (PA – 22.67)2 / (PA + 34.00)
These equations were derived from Williams and Kissel (1991) and reported by Pierce et al. (1991). Precipitation data can be found in Appendix Table 3. For soils with a
hydrologic group that consists of more than one letter (e.g., “A/D”, “A/C”, “C/D”), its hydrologic group is determined by the presence or absence of adequate artificial drainage. If the field is artificially drained (“adequate” or “excellent”), the hydrologic group moves to the first of the two classes. If the field is inadequately drained or not drained at all (“none” or “inadequate”), the second of the two classes is assigned. For example, a Halcott soil has a hydrologic class of “C/D”. If this soil has adequate or excellent artificial drainage, the hydrologic group used is “C”. If the soil is not drained or inadequately artificially drained, the hydrologic group “D” is assigned. For soils with a single hydrologic group, artificial drainage does not
influence the hydrologic group used. The Seasonal Index (SI) is determined by the annual precipitation (PA in inches) and the sum of the fall and winter precipitation (PW, from October through March in inches): SI = (2 * PW / PA)1/3. Average township-based precipitation as well as the N Leaching Index values for soils with hydrologic groups A, B, C, or D can be found in Appendix Table 3. An example of
Box 1: What is the leaching index for a corn field near Auburn NY that is classified as a Lima soil type? o Step 1: Task: Look up the hydrologic group (Appendix A). Answer: Lima has a hydrologic group B. o Step 2: Task: Look up the annual precipitation (PA) for Auburn in Cayuga County (Appendix B). Answer: PA = 36.4 inches. o Step 3: Task: Look up the formula for the Percolation Index (PI) for a hydrologic group B soil. Answer: PI = (PA - 15.05)2 / (PA + 22.57) o Step 4: Task: Calculate the PI. Answer: PI = (36.4-15.05)2 / (36.4 + 22.57) = 7.73. o Step 5: Task: Look up the winter precipitation (PW) for Auburn. Answer: PW = 16.0 inches. o Step 6: Task: Calculate the seasonal index (SI). Answer: SI = (2 * PW/PA)1/3=(2 * 16.0/36.4) 1/3= 0.96 o Step 7: Task: Multiply the PI and the SI to obtain the LI. Answer: LI = PI * SI = 7.73 * 0.96 = 7.4.

Nitrogen Guidelines for Field Crops in New York. Second Release. June 22, 2003.
23
an N Leaching Index calculation is given in Box 1. Fortunately, no manual calculations are necessary: LI scores for each hydrologic group in each New York State township are reported in Appendix Table 3. Use Appendix Table 1 to identify soil hydrologic group and Appendix Table 3 to look up LI scores. An LI below 2 indicates that the potential for nitrate leaching below the root zone is low. An LI greater than 10 inches indicates that the potential for soluble nutrient leaching below the root zone is large while LI’s between 2 and 10 are considered intermediate. In order to meet the N leaching requirements of the NRCS nutrient management standard (590), producers are expected to implement best management practices if the LI score for a field is high (>10). Producers are expected to consider the same practices on a case-by-case basis if the LI score for a field is intermediate (2-10). Best management practices recommended for soils with medium to high N leaching indices include those listed below. These recommendations are based on research done, among others, by Sogbedji and coworkers (2000) and Van Es and coworkers (2002). o Unless the New York Phosphorus Index identifies the need for P based fertility
management, manure and fertilizer application rates should be based on Cornell guidelines for meeting crop N needs.
o For corn, pre-plant (other than starter fertilizer) and early post plant broadcast applications of commercial nitrogen without the use of nitrification inhibitors are not recommended.
o Sidedress applications should be made after the corn has at least four true leaves. o If starter N must be broadcast (e.g., for small grains or new seedings of grass), apply
fertilizer as close to expected planting date as possible (ideally within 3 days or less). o For row and cereal crops, including corn, maintain starter fertilizer N rates below 50
lbs/acre actual N under normal conditions. o Manure and fertilizer applications should be adjusted based on information provided
in this document. o Evaluate the need for sidedress N applications based on PSNT or other soil nitrate-
nitrogen tests. o Sod crops should not be incorporated in the fall. Chemical sod killing may be carried
out when the soil temperature at four- inch depth is approaching 45oF. Depending on location, this will not likely take place until early October.
o Minimize fall and/or winter manure application on good grass and/or legume sod fields that are to be rotated the following spring.
o Appropriate ammonia conservation is encouraged. Losses can either be reduced by immediately incorporating manure or eliminated by directly injecting manure as a sidedress application to growing crops.
o Plant winter hardy cover crops whenever possible, especially when fall manure is applied (e.g., rye, winter wheat, or interseed ryegrass in summer).
o Manure may be applied in the fall where there is a growing crop. Judicious amounts of manure can be applied to or in conjunction with perennial crops or winter hardy cover crops. Applications should generally not exceed the greater of 50 lbs/acre of first year available N or 50% of the expected N requirement of next year’s crop.
Nitrogen Guidelines for Field Crops in New York. Second Release. June 22, 2003.
24
o Frost incorporation/injection is acceptable when soil conditions are suitable, but winter applications should be made in accordance with the New York Phosphorus Index.
o Manure N application on legumes is acceptable to satisfy agronomic requirements when legumes represent less than 50% of the stand. When legumes represent more than 50% of the stand, manure may be applied at a rate not exceeding 150 lbs of available N/acre.
CITED REFERENCES
• Beegle, D.B. 1996. Soil Fertility Management. Pages 17-40. In: The Agronomy Guide, 1997-1998. The Pennsylvania State University, University Park, PA.
• Brady, N.C. and R.R. Weil. 1996. The Nature and Properties of Soils. Prentice Hall Inc., NJ.
• Cornell Cooperative Extension. 1987. Cornell Field Crops and Soils Handbook. • Cornell Cooperative Extension. 2001. Cornell Guide for Integrated Field Crop
Management. • Jokela, B., F. Magdoff, R. Bartlett, S. Bosworth, and D. Ross. 1999. Nutrient
Recommendations for Field Crops in Vermont. • Klausner, S. 1997. Nutrient Management: Crop Production and Water Quality.
Natural Resource, Agriculture, and Engineering Service, Cooperative Extension, Cornell University, Ithaca, NY.
• Pierce, F.J., M.J. Shaffer, and A.D. Halvorson (1991). Screening procedure for estimating potentially leachable nitrate-nitrogen below the root zone. In: R.F. Follet, D.R. Keeney, and R.M. Cruse (Eds.). Managing nitrogen for groundwater quality and farm profitability. Soil Science Society of America, Inc. Madison, Wisconsin. pp 259-283.
• Sogbedji, J.M., H.M. van Es, C.L. Yang, L.D. Geohring, and F.R. Magdoff (2000). Nitrate leaching and N budget as affected by maize N fertilizer rate and soil type. J. Environm. Qual. 29:1813-1820.
• Van Es, H.M., K.J. Czymmek, and Q.M. Ketterings (2002). Management Effects on N leaching and Guidelines for an N Leaching Index in New York. J. Soil Water Conserv. 57(6): 499-504.
• Williams, J.R., and D.E. Kissel (1991). Water percolation: an indicator of nitrogen-leaching potential. In: R.F. Follet, D.R. Keeney, and R.M. Cruse (Eds.). Managing nitrogen for groundwater quality and farm profitability. Soil Science Society of America, Inc. Madison, Wisconsin. pp 59-83.
SELECTED BACKGROUND REFERENCES
• Bouldin, D.R., S.D. Klausner, and W.S. Reid. 1984. Use of nitrogen from manure. In: Nitrogen in crop production. Ed. R. Hauck. Am. Soc. Agronomy. Madison, WI. pp. 221-245.
Nitrogen Guidelines for Field Crops in New York. Second Release. June 22, 2003.
25
• Ferguson, G.A., S.D. Klausner, and W.S. Reid. 1988. Synchronizing nitrogen additions with crop demand to protect groundwater. In: New York’s Food and Life Sciences Quarterly. Vol. 18. Cornell Univ., Ithaca, NY.
• Kanneganti, V.R., and S.D. Klausner. 1994. Nitrogen recovery by orchard grass from dairy manure applied with or without fertilizer nitrogen. Commun. Soil Sci. Plant Anal. 25:2771-2783.
• Ketterings, Q.M., S.D. Klausner, and K.J. Czymmek (2001). Nitrogen recommendations for field crops in New York. Department of Crop and Soil Sciences Extension Series EO1-4. Cornell University, Ithaca, NY. 45 pages.
• Klausner, S.D. 1988. The effect of tillage on the fertilizer N equivalence of manure. Agron. Mimeo 88-3. Cornell Univ., Ithaca, NY.
• Klausner, S.D. 1989. Managing the land application of animal manures: Agronomic considerations. Proceedings from the Dairy Manure Management Symposium. NE Regional Agric. Eng. Serv., Cornell Univ., Ithaca, NY. 14853. pp. 79-88.
• Klausner, S.D. 1990. It pays to use the right amount of fertilizer. County Agric. News Service. Agron. Dept., Cornell Univ., Ithaca, NY. March.
• Klausner, S. 1991. A pre-sidedress nitrogen soil test for corn: An update. In: What’s Cropping Up? Vol. 1, No 1. Dept. of Soil, Crop, and Atmospheric, Sci. Cornell Univ., Ithaca, NY.
• Klausner, S. 1991. Using organic nitrogen to reduce fertilizer input. In: What’s Cropping Up? Vol. 1, No. 3. Dept. of Soil, Cop, and Atm. Sci. Cornell Univ., Ithaca, NY.
• Klausner, S.D. 1992. A pre-sidedress nitrogen soil test for corn. In: What’s Cropping Up? Vol 2, No. 1. Dep Soil, Crop, and Atmospheric Sci. Cornell Univ, Ithaca, NY.
• Klausner, S.D. 1992. A pre-sidedress nitrogen soil test for corn. In: What’s Cropping Up? Vol. 3, No. 2. Dep. Soil, Crop, and Atmospheric Sci. Cornell Univ., Ithaca, NY.
• Klausner, S.D. 1992. Fertilize alfalfa according to soil test. In: What’s Cropping Up? Vol. 2, No. 3. Dep. Soil, Crop, and Atmospheric Sci. Cornell Univ., Ithaca, NY.
• Klausner, S.D. 1995. Fine-tune your fertilizer program for corn. In: What’s Cropping Up? Vol. 5, No. 1. Dep. Soil, Crop, and Atmospheric Sci. Cornell Univ., Ithaca, NY.
• Klausner, S.D. 1995. Nutrient management: Crop production and water quality. NRAES-101. Northeast Agric. Eng. Serv. Riley Robb Hall, Cornell Univ., Ithaca, NY.
• Klausner, S.D. 1996. Nitrogen soil test for corn: Update. In: What’s Cropping Up? Vol. 6., No. 2. Dep. Soil, Crop, and Atmospheric Sci. Cornell Univ., Ithaca, NY.
• Klausner, S.D. 1997. Getting the most out of your nitrogen. In: What’s Cropping Up Vol. 7, No. 1. Dept’s Soil, Crop, and Atmospheric Sci. Cornell Univ., Ithaca, NY.
• Klausner, S.D. and D.R. Bouldin. 1983. Managing animal manure as a resource. Part I: Basic principles. Agronomy Fact Sheet series. Ph. 100.00. Cornell Univ., Ithaca, NY.
• Klausner, S.D. and D.R. Bouldin. 1983. Managing animal manure as a resource. Part II: Field management. Agronomy Fact Sheet series. Ph. 101.00. Cornell Univ., Ithaca, NY.

Nitrogen Guidelines for Field Crops in New York. Second Release. June 22, 2003.
26
• Klausner, S.D., J. Cherney, R. Lucey, and S. Reid. 1998. Nitrogen fertilization of grasses. Research Series R 98-1. Dep. Soil, Crop, and Atmospheric Science. Cornell Univ, Ithaca, NY. 14853.
• Klausner, S.D., J. Duxbury and E. Goyette. 1991. Agricultural nonpoint source control of phosphorus in the New York State Lake Ontario basin. Vol 2: Fertilizer trials on organic soils in the Lake Ontario drainage basin. U.S. Env. Proc. Agency, Great Lakes Nat. Prog. Office. 230 S. Dearborn St., Chicago, IL 60604. 53 pgs.
• Klausner, S.D., and E.A. Goyette. 1992. Soil fertility research: Alfalfa 1991. Dep. Soil, Crop, and Atmospheric Sci., Research Series R92-2. Cornell Univ., Ithaca, NY. 14853.
• Klausner, S.D., and E.A. Goyette, 1992. Soil fertility research: Corn 1991. Dep. Soil, Crop, and Atmospheric Sci., Research Series R92-1. Cornell Univ., Ithaca, NY. 14853.
• Klausner, S.D., and E.A. Goyette. 1992. Soil fertility research: Corn 1991. Dep. Soil, Crop, and Atmospheric Sci., Research Series R92-2. Cornell Univ., Ithaca, NY. 14853.
• Klausner, S.D., and E.A. Goyette. 1993. Soil fertility research: 1992. Dep. Soil, Crop, and Atmospheric Sci., Research Series R93-2. Cornell Univ., Ithaca, NY. 14853.
• Klausner, S.D. and R.W. Guest. 1981. Influence of NH3 conservation from dairy manure on the yield of corn. Agron. J. 73: 720-723.
• Klausner, S.D., V.R. Kanneganti, and D. R. Bouldin. 1994. An approach for estimating a decay series for organic N in animal manure. Agron. J. 86:897-903.
• Klausner, S.D., A.C. Mathers, and A.L. Sutton. 1983. Managing animal manure as a source of plant nutrients. In: National Corn Production Handbook. Purdue Univ., W. Lafayette, IN.
• Klausner, S.D., and W.S. Reid. 1990. Soil fertility research: Corn 1990. Dept. Soil, Crop, and Atm. Sci. Research Series No. R91-1. Cornell Univ., Ithaca, NY. 14853.
• Klausner, S.D., and W.S Reid. 1990. Soil fertility research for alfalfa, 1989. Agron. Mimeo 90-2. Cornell Univ., Ithaca, NY.
• Klausner, S.D., and W.S. Reid. 1990. Soil fertility research for corn, 1989. Agron. Mimeo 90-1. Cornell Univ., Ithaca, NY.
• Klausner, S.D., W.S. Reid, and D.R. Bouldin. 1993. Relationship between late spring soil nitrate concentrations and corn yields in New York. J. Prod. Agric. 6:350-354.
• Klausner, S.D., S. Reid, G. Ferguson, and E. Goyette. 1989. Calibrating a fertilizer and plant analysis program for corn. 1988 Agron. Mimeo 89-3. Agron. Dept., Cornell Univ., Ithaca, NY.
• Klausner, S.D., W.S. Reid, and E.A. Goyette. 1991. Soil fertility research: Alfalfa 1990. Dept. Soil, Crop, and Atm. Sci. Research Series No. R91-1. Cornell Univ., Ithaca, NY. 14853.
• Klausner, S.D., W.S. Reid, and E.A. Goyette. 1991. Soil fertility research: Corn 1990. Dept. Soil, Crop, and Atm. Sci. Research Series No. R91-1. Cornell Univ., Ithaca, NY. 14853.
• Klausner, S.D., P.J. Zwerman, and D.R. Coote. 1976. Design parameters for the land application of dairy manure. Env. Proc. Tech. Series EPA-600/2-76-187. Office of Research and Development. US Environ. Prot. Agency. Athens, GA.

Nitrogen Guidelines for Field Crops in New York. Second Release. June 22, 2003.
27
• Lauer, D.A., D.R. Bouldin, and S.D. Klausner. 1976. Ammonia volatilization from dairy manure spread on the soil surface. J. Environ. Qual. 5:47-49.
• Magdoff, F.R., W.E. Jokela, G.F. Griffin, and S.D. Klausner, 1993. Predicting N fertilizer needs for corn in humid regions. Bul. Y-226. National Fertilizer and Environmental Research Center, Tennessee Valley Authority, Muscle Shoals, Al., 35660.

Nitrogen Guidelines for Field Crops in New York. Second Release. June 22, 2003.
28
APPENDIX
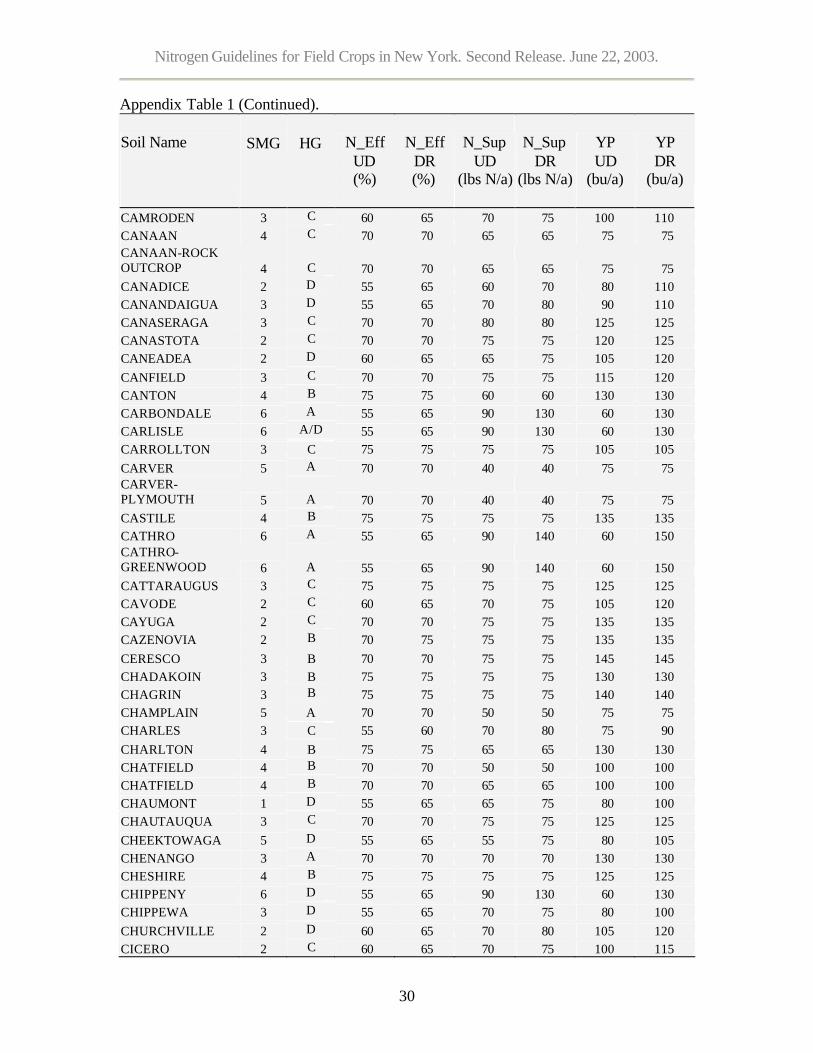
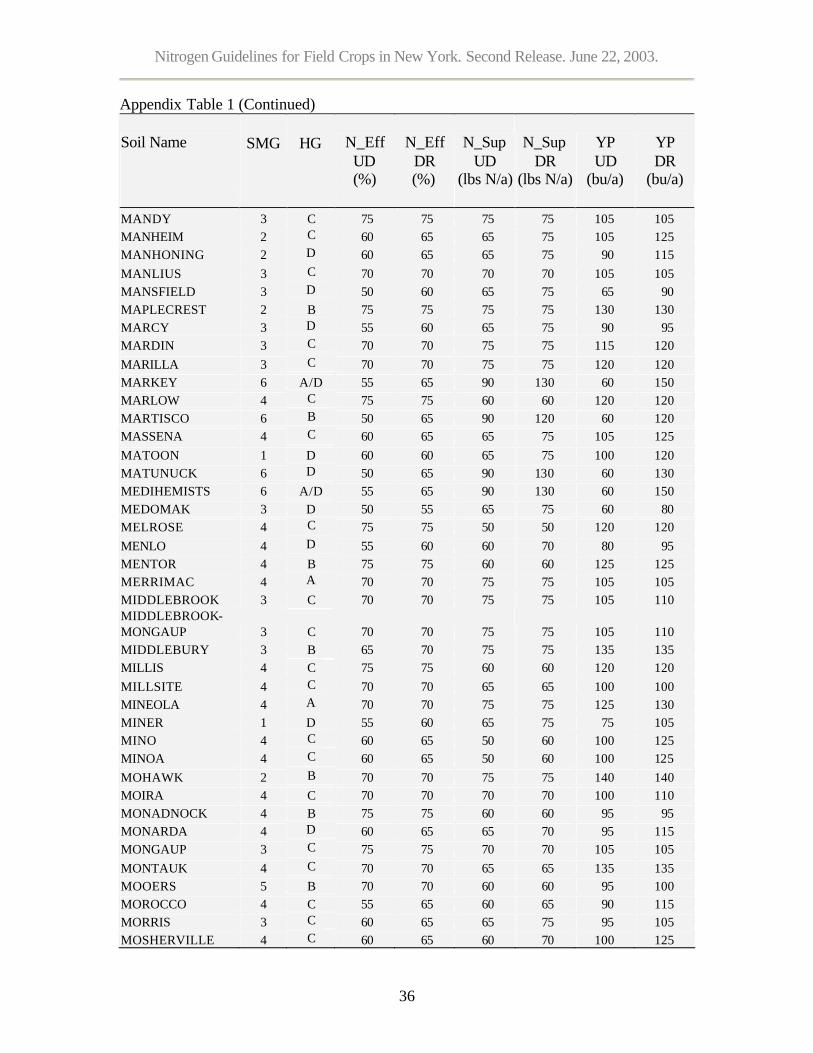
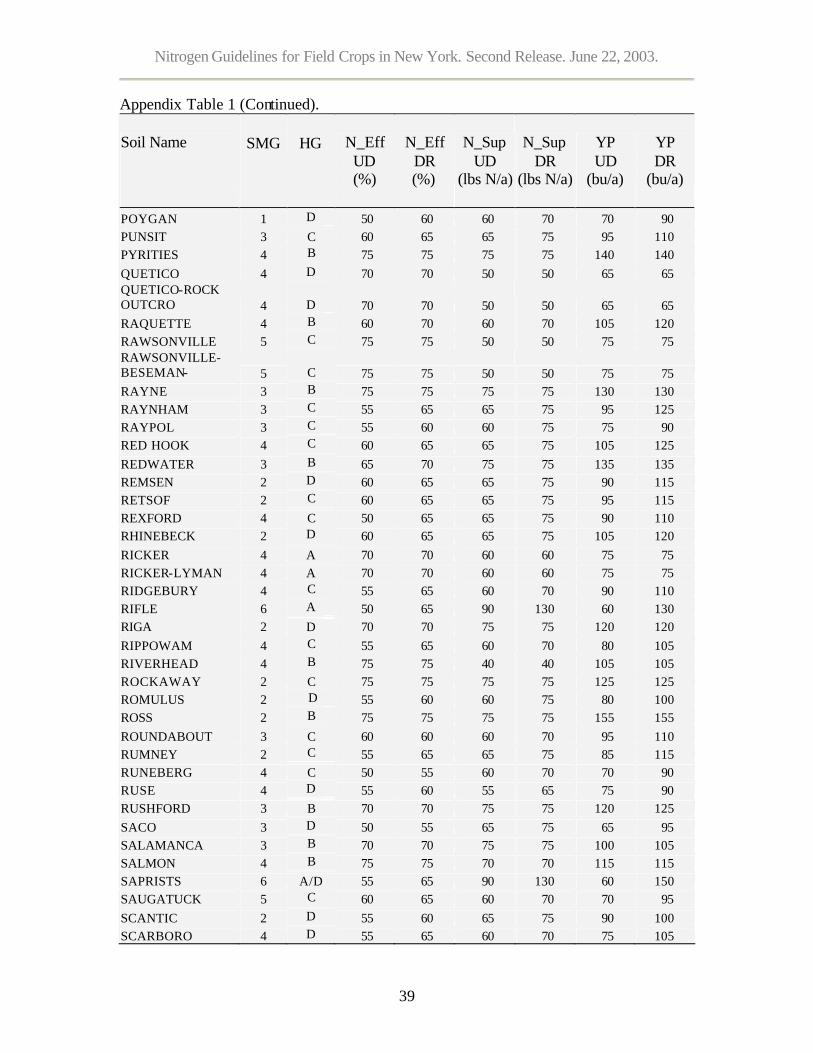
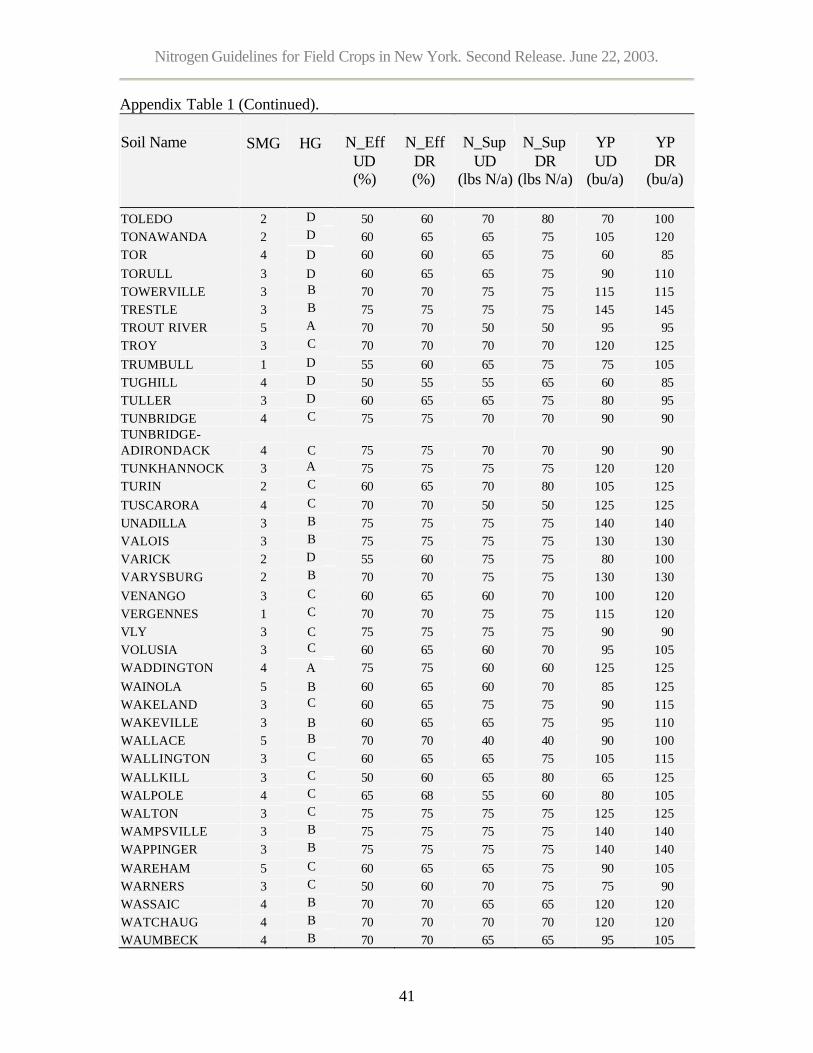
TABLE 1: SOIL MANAGEMENT GROUP (SMG), HYDROLOGIC GROUP (HG), INORGANIC NITROGEN UPTAKE EFFICIENCIES (N-EFF IN %), SOIL N SUPPLY (N-SUP, IN LBS N/ACRE) AND CORN YIELD POTENTIAL (YP IN BUSHELS/ACRE) FOR UNDRAINED (UD) AND ARTIFICIALLY DRAINED (DR) NEW YORK STATE SOILS.
Soil Name
SMG
HG N_Eff
UD (%)
N_Eff DR
(%)
N_Sup UD
(lbs N/a)
N_Sup DR
(lbs N/a)
YP UD
(bu/a)
YP DR
(bu/a)
ACTON 4 C 65 70 65 65 120 125 ADAMS 5 A 70 70 40 40 95 95 ADIRONDACK 4 D 75 75 70 70 75 75 ADJIDAUMO 1 D 55 60 65 75 75 105 ADRIAN 6 A/D 55 65 90 120 60 120 AGAWAM 4 B 75 75 65 65 140 140 ALBIA 3 C 60 65 60 70 100 120 ALBRIGHTS 2 C 70 70 75 75 110 120 ALDEN 3 D 50 60 65 80 65 90 ALLAGASH 5 B 75 75 65 65 105 105 ALLARD 3 B 75 75 70 70 135 135 ALLENDALE 3 D 55 60 60 70 80 100 ALLIS 3 D 60 65 65 75 80 100 ALLUVIAL LAND 3 C 60 65 70 75 75 100 ALMOND 3 C 60 65 65 75 90 95 ALPS 3 C 70 70 75 75 110 115 ALTMAR 5 B 65 70 50 60 100 115 ALTON 5 A 75 75 65 65 125 125 AMBOY 4 C 75 75 60 60 140 140 AMENIA 4 B 70 70 65 65 135 140 ANGOLA 2 C 60 65 70 80 95 110 APPLETON 2 C 60 65 65 75 105 125 ARKPORT 4 B 75 75 50 50 125 125 ARMAGH 2 D 55 60 70 80 80 100 ARNOT 3 C/D 70 70 70 70 90 100 ASHVILLE 3 D 50 55 65 75 75 95 ATHERTON 3 B 55 60 55 75 90 105 ATKINS 3 D 50 60 65 75 70 105 ATSION 5 C 60 65 60 70 70 95 AU GRES 5 B 55 65 60 65 90 100 AURELIE 3 D 55 60 70 80 75 95 AURORA 2 C 70 70 70 70 110 115 BARBOUR 3 B 75 75 75 75 140 140 BARCELONA 3 C 60 65 65 75 90 115 BARRE 1 D 55 65 70 80 80 105

Nitrogen Guidelines for Field Crops in New York. Second Release. June 22, 2003.
29
Appendix Table 1 (Continued).
Soil Name
SMG
HG N_Eff
UD (%)
N_Eff DR
(%)
N_Sup UD
(lbs N/a)
N_Sup DR
(lbs N/a)
YP UD
(bu/a)
YP DR
(bu/a)
BASH 3 C 60 65 65 75 105 130 BASHER 3 B 70 70 70 70 140 140 BATH 3 C 75 75 75 75 125 125 BECKET 4 C 75 75 60 60 100 100 BECRAFT 3 B 70 70 75 75 150 150 BELGRADE 3 B 70 70 80 80 140 145 BENSON 4 D 70 70 65 65 80 80 BERKSHIRE 5 B 75 75 65 65 125 125 BERNARDSTON 4 C 75 75 65 65 135 135 BERRIEN 5 C 70 70 55 55 120 120 BERRYLAND 5 B 50 60 70 75 60 90 BESEMAN 6 A 50 65 90 130 60 130 BICE 5 B 75 75 65 65 130 130 BIDDEFORD 2 D 50 60 70 75 65 95 BIRDSALL 3 D 50 55 70 75 70 90 BLASDELL 3 A 75 75 70 70 125 125 BOMBAY 4 B 70 70 65 65 135 135 BONAPARTE 4 A 70 70 50 50 100 100 BONO 1 D 50 60 70 80 60 100 BOOTS 6 A 55 65 90 130 60 130 BOROSAPRISTS 6 A/D 55 65 90 140 60 150 BOYNTON 3 D 55 65 70 75 80 100 BRACEVILLE 4 C 70 70 75 75 115 120 BRAYTON 4 C 60 65 70 70 90 105 BRIDGEHAMPTON 3 B 70 70 70 70 150 150 BRIDPORT 2 D 60 65 65 75 105 120 BRIGGS 4 A 75 75 60 60 100 100 BRINKERTON 2 D 55 65 70 80 80 100 BROADALBIN 4 C 75 75 65 65 130 130 BROCKPORT 1 D 60 65 70 80 95 120 BROOKFIELD 3 B 75 75 75 75 130 130 BUCKLAND 3 C 70 70 70 70 90 90 BUCKSPORT 6 D 55 65 90 140 60 150 BUDD 4 B 75 75 40 40 105 105 BURDETT 2 C 60 65 70 80 100 120 BURNHAM 3 D 60 65 70 80 70 95 BUSTI 3 C 60 65 60 70 100 120 BUXTON 2 C 70 70 70 70 120 120 CAMBRIA 2 D 55 60 65 75 80 105 CAMBRIDGE 3 C 70 70 70 70 120 125 CAMILLUS 3 B 70 70 75 75 120 125
Nitrogen Guidelines for Field Crops in New York. Second Release. June 22, 2003.
30
Appendix Table 1 (Continued).
Soil Name
SMG
HG N_Eff
UD (%)
N_Eff DR
(%)
N_Sup UD
(lbs N/a)
N_Sup DR
(lbs N/a)
YP UD
(bu/a)
YP DR
(bu/a)
CAMRODEN 3 C 60 65 70 75 100 110 CANAAN 4 C 70 70 65 65 75 75 CANAAN-ROCK OUTCROP 4
C 70 70 65 65 75 75
CANADICE 2 D 55 65 60 70 80 110 CANANDAIGUA 3 D 55 65 70 80 90 110 CANASERAGA 3 C 70 70 80 80 125 125 CANASTOTA 2 C 70 70 75 75 120 125 CANEADEA 2 D 60 65 65 75 105 120 CANFIELD 3 C 70 70 75 75 115 120 CANTON 4 B 75 75 60 60 130 130 CARBONDALE 6 A 55 65 90 130 60 130 CARLISLE 6 A/D 55 65 90 130 60 130 CARROLLTON 3 C 75 75 75 75 105 105 CARVER 5 A 70 70 40 40 75 75 CARVER-PLYMOUTH 5
A 70 70 40 40 75 75
CASTILE 4 B 75 75 75 75 135 135 CATHRO 6 A 55 65 90 140 60 150 CATHRO-GREENWOOD 6
A 55 65 90 140 60 150
CATTARAUGUS 3 C 75 75 75 75 125 125 CAVODE 2 C 60 65 70 75 105 120 CAYUGA 2 C 70 70 75 75 135 135 CAZENOVIA 2 B 70 75 75 75 135 135 CERESCO 3 B 70 70 75 75 145 145 CHADAKOIN 3 B 75 75 75 75 130 130 CHAGRIN 3 B 75 75 75 75 140 140 CHAMPLAIN 5 A 70 70 50 50 75 75 CHARLES 3 C 55 60 70 80 75 90 CHARLTON 4 B 75 75 65 65 130 130 CHATFIELD 4 B 70 70 50 50 100 100 CHATFIELD 4 B 70 70 65 65 100 100 CHAUMONT 1 D 55 65 65 75 80 100 CHAUTAUQUA 3 C 70 70 75 75 125 125 CHEEKTOWAGA 5 D 55 65 55 75 80 105 CHENANGO 3 A 70 70 70 70 130 130 CHESHIRE 4 B 75 75 75 75 125 125 CHIPPENY 6 D 55 65 90 130 60 130 CHIPPEWA 3 D 55 65 70 75 80 100 CHURCHVILLE 2 D 60 65 70 80 105 120 CICERO 2 C 60 65 70 75 100 115

Nitrogen Guidelines for Field Crops in New York. Second Release. June 22, 2003.
31
Appendix Table 1 (Continued).
Soil Name
SMG
HG N_Eff
UD (%)
N_Eff DR
(%)
N_Sup UD
(lbs N/a)
N_Sup DR
(lbs N/a)
YP UD
(bu/a)
YP DR
(bu/a)
CLARKSON 2 B 70 70 75 75 135 140 CLAVERACK 4 C 70 70 70 70 120 120 CLYMER 4 B 75 75 70 70 110 120 COHOCTAH 4 B 55 65 70 80 80 100 COLLAMER 3 C 70 70 75 75 140 140 COLONIE 5 A 70 70 50 50 105 105 COLOSSE 4 A 70 70 50 50 70 70 COLRAIN 4 A 75 75 65 65 130 130 COLTON 5 A 70 70 50 50 85 85 COLWOOD 3 D 55 65 70 80 90 110 CONESUS 2 B 70 70 75 75 135 140 CONOTTON 3 A 75 75 70 70 125 125 CONSTABLE 5 A 70 70 50 50 75 75 COOK 5 D 50 60 70 80 70 90 COPAKE 4 B 75 75 65 65 135 135 CORNISH 3 C 60 65 65 75 95 110 COSAD 4 C 60 70 60 70 105 120 COSSAYUNA 4 C 75 75 65 65 135 135 COVERT 4 A 70 70 60 60 115 120 COVEYTOWN 4 C 65 70 65 75 90 110 COVINGTON 1 D 55 60 70 75 75 95 CRARY 4 C 65 70 60 70 110 120 CROGHAN 5 B 70 70 50 50 100 100 CULVERS 3 C 70 70 75 75 115 125 DALBO 3 C 70 70 75 75 95 115 DALTON 3 C 60 65 70 75 95 105 DANLEY 2 C 70 70 75 75 120 125 DANNEMORA 4 D 55 65 65 75 75 90 DARIEN 2 C 60 65 70 75 100 115 DAWSON 6 A 55 65 90 140 60 150 DEERFIELD 5 B 70 70 60 65 105 110 DEFORD 4 A 55 60 65 75 75 100 DEKALB 4 A 75 75 70 70 100 100 DEPEYSTER 3 C 70 70 75 75 140 140 DEPOSIT 3 B 70 70 75 75 125 130 DERB 3 C 60 65 70 75 95 115 DIXMONT 5 C 70 70 65 65 115 120 DORVAL 6 A 55 65 90 140 60 150 DOVER 4 B 75 75 70 70 125 125 DUANE 4 B 70 70 60 60 95 95 DUNKIRK 3 B 75 75 75 75 140 140

Nitrogen Guidelines for Field Crops in New York. Second Release. June 22, 2003.
32
Appendix Table 1 (Continued).
Soil Name
SMG
HG N_Eff UD (%)
N_Eff DR
(%)
N_Sup UD
(lbs N/a)
N_Sup DR
(lbs N/a)
YP UD
(bu/a)
YP DR
(bu/a)
DUTCHESS 4 B 75 75 65 65 135 135 DUXBURY 4 A 75 75 65 65 95 95 EDWARDS 6 B 55 65 90 130 60 130 EEL 2 B 65 70 75 75 140 140 EELWEIR 4 C 70 70 50 50 130 135 ELKA 4 C 75 75 70 70 115 115 ELLERY 3 D 55 65 70 75 80 100 ELMRIDGE 5 C 70 70 60 60 135 135 ELMWOOD 4 C 70 70 60 60 130 130 ELNORA 5 B 70 70 50 50 110 110 EMPEYVILLE 4 C 70 70 60 60 100 105 ENFIELD 3 B 75 75 75 75 150 150 ENSLEY 3 B 55 60 65 75 75 95 ERIE 3 C 60 65 65 75 95 115 ERNEST 3 C 75 75 75 75 75 75 ESSEX 5 C 75 75 70 70 95 95 FAHEY 5 B 70 70 55 65 100 100 FARMINGTON 3 C 75 75 65 65 90 90 FARNHAM 4 C 70 70 70 70 120 125 FERNLAKE 4 A 70 70 60 60 75 75 FONDA 2 D 50 60 70 80 70 100 FREDON 4 C 55 65 70 75 90 115 FREETOWN 6 D 50 65 90 130 60 130 FREMONT 2 C 60 65 65 75 100 110 FRENCHTOWN 3 D 55 60 65 75 70 105 FREWSBURG 3 C 60 65 65 75 80 95 FRYEBURG 3 B 75 75 70 70 95 95 GAGE 3 D 55 60 65 75 90 95 GALEN 4 B 70 70 60 60 130 130 GALESTOWN 5 A 70 70 40 40 90 90 GALOO 4 C 70 70 50 50 75 75 GALOO-ROCK OUTCROP 4
C 70 70 50 50 75 75
GALWAY 4 B 75 75 70 70 130 130 GENESEE 2 B 75 75 80 80 155 155 GEORGIA 4 C 70 70 75 75 135 140 GETZVILLE 3 D 55 60 65 75 75 90 GILPEN 3 C 75 75 75 75 120 120 GILPIN 3 C 75 75 70 70 110 110 GLEBE 4 C 70 70 70 70 75 75 GLEBE-SADDLEBACK 4 C 70 70 70 70 75 75

Nitrogen Guidelines for Field Crops in New York. Second Release. June 22, 2003.
33
Appendix Table 1 (Continued).
Soil Name
SMG
HG N_Eff
UD (%)
N_Eff DR
(%)
N_Sup UD
(lbs N/a)
N_Sup DR
(lbs N/a)
YP UD
(bu/a)
YP DR
(bu/a)
GLENDORA 4 A/D 75 75 70 70 75 75 GLENFIELD 3 B 50 60 65 75 90 110 GLOUCESTER 4 A 70 70 50 50 120 120 GLOVER 4 D 70 70 60 60 90 90 GOUGEVILLE 5 A 50 60 65 75 75 100 GRANBY 5 A/D 55 60 60 65 75 100 GRATTAN 5 A 70 70 50 50 105 105 GREENE 3 C 60 65 65 75 90 110 GREENWOOD 6 A 50 65 90 140 60 150 GRENVILLE 4 B 75 75 75 75 140 140 GRETOR 3 C 60 65 65 75 75 90 GROTON 4 A 70 70 70 70 105 110 GROVETON 4 A 70 70 65 65 95 95 GUFF 1 D 50 55 60 75 75 90 GUFFIN 1 D 50 60 60 65 60 75 GULF 4 B 55 60 65 75 75 90 HADLEY 3 B 75 75 70 70 140 140 HAIGHTS 3 B 60 70 50 60 95 100 HAIGHTS-GULF 3 B 60 70 50 60 95 100 HAILESBORO 3 C 60 65 65 75 110 125 HALCOTT 2 C/D 70 70 75 75 75 80 HALSEY 4 C/D 50 60 70 75 90 100 HAMLIN 2 B 75 75 80 80 155 155 HAMPLAIN 2 B 75 75 80 80 150 150 HANNAWA 4 D 55 60 60 70 85 100 HARTLAND 4 B 75 75 75 75 155 155 HAVEN 4 B 75 75 65 65 150 150 HAWKSNEST 3 C/D 70 70 75 75 75 80 HEMPSTEAD 4 B 75 75 65 65 150 150 HENRIETTA 6 B 55 65 90 130 60 150 HERKIMER 3 B 70 70 75 75 130 130 HERMON 4 A 70 70 50 50 105 105 HERO 4 B 70 70 70 70 130 135 HEUVELTON 2 C 70 70 75 75 115 135 HILTON 2 B 70 70 75 75 135 140 HINCKLEY 5 A 70 70 50 50 95 95 HINESBURG 4 C 75 75 60 60 105 105 HOGANSBURG 4 B 70 70 75 75 135 140 HOGBACK 5 C 75 75 50 50 75 75 HOGBACK-RICKER 5 C 75 75 50 50 75 75

Nitrogen Guidelines for Field Crops in New York. Second Release. June 22, 2003.
34
Appendix Table 1(Continued).
Soil Name
SMG
HG N_Eff
UD (%)
N_Eff DR
(%)
N_Sup UD
(lbs N/a)
N_Sup DR
(lbs N/a)
YP UD
(bu/a)
YP DR
(bu/a)
HOLDERTON 3 B 60 65 65 75 105 115 HOLLIS 4 C 60 65 50 60 75 95 HOLLY 2 C/D 55 60 60 75 70 95 HOLYOKE 3 C 70 70 70 70 75 75 HOLYOKE-ROCK OUTCR 3 C 70 70 70 70 75 75 HOMER 2 B 60 65 65 75 105 125 HONEOYE 2 B 75 75 75 75 140 140 HOOSIC 4 A 75 75 60 60 105 105 HORNELL 2 D 65 70 70 75 95 105 HORNELLSVILLE 3 D 60 65 65 75 85 95 HOUGHTONVILLE 5 C 75 75 65 65 105 105 HOUGHTONVILLE-RAWSON 5 C 75 75 65 65 105 105 HOUSATONIC 3 55 65 70 75 80 115 HOUSEVILLE 2 C 60 65 65 75 105 125 HOWARD 3 A 75 75 70 70 135 135 HUDSON 2 C 70 70 80 80 135 135 HULBERTON 2 C 60 65 70 80 105 125 ILION 2 D 60 65 70 80 90 105 INSULA 4 B 75 75 60 65 90 90 IPSWICH 6 D 50 65 90 99 60 130 IRA 4 C 70 70 65 65 115 120 ISCHUA 3 B 70 70 75 75 100 105 IVORY 2 C 60 65 65 75 90 100 JEBAVY 5 A 55 60 60 70 75 95 JOLIET 4 D 55 65 65 75 60 100 JUNIUS 5 C 55 65 50 60 80 100 KALURAH 4 B 70 70 75 75 135 140 KANONA 2 D 55 65 60 70 77 95 KARS 4 A 70 70 65 65 125 125 KEARSARGE 3 B 70 70 70 70 90 90 KENDAIA 2 C 60 65 65 75 105 125 KIBBIE 3 B 60 65 65 75 110 125 KINGSBURY 1 D 60 65 65 75 95 110 KINZUA 3 B 75 75 75 75 130 130 KNICKERBOCKER 5 A 70 70 65 65 105 105 LACKAWANNA 3 C 75 75 75 75 125 125 LAGROSS 3 A 75 75 75 75 115 115 LAGROSS-HAIGHTS 3
A 75 75 75 75 115 115

Nitrogen Guidelines for Field Crops in New York. Second Release. June 22, 2003.
35
Appendix Table 1 (Continued).
Soil Name
SMG
HG N_Eff
UD (%)
N_Eff DR
(%)
N_Sup UD
(lbs N/a)
N_Sup DR
(lbs N/a)
YP UD
(bu/a)
YP DR
(bu/a)
LAIRDSVILLE 2 D 70 70 75 75 120 120 LAKEMONT 1 D 55 60 65 75 80 105 LAKEWOOD 5 A 70 70 40 40 75 75 LAMSON 4 B/D 55 65 65 75 75 110 LANESBORO 3 C 70 70 75 75 75 75 LANGFORD 3 C 70 70 75 75 120 120 LANSING 2 B 75 75 75 75 140 140 LECK KILL 3 B 75 75 75 75 115 115 LEICESTER 4 C 55 65 65 75 75 105 LEON 5 C 60 65 60 70 70 95 LEWBATH 3 C 75 75 75 75 95 95 LEWBEACH 3 C 75 75 75 75 125 125 LEYDEN 2 C 70 70 75 75 120 125 LIMA 2 B 70 70 75 75 135 140 LIMERICK 3 C 55 65 70 75 80 115 LINDEN 4 B 75 75 75 75 135 135 LINLITHGO 3 B 65 65 70 75 105 115 LIVINGSTON 1 D 50 55 65 75 65 85 LOBDELL 3 B 65 70 75 75 135 135 LOCKPORT 2 D 60 65 70 80 95 120 LORDSTOWN 3 C 75 75 70 70 105 105 LOVEWELL 2 B 70 70 75 75 130 140 LOWVILLE 4 B 75 75 75 75 135 135 LOXLEY 6 A 50 65 90 130 60 130 LUCAS 2 C 70 70 80 80 135 135 LUDLOW 4 C 70 70 75 75 115 120 LUPTON 6 A 55 65 90 140 60 150 LYMAN 4 C 70 70 60 60 75 75 LYMAN-BECKET -BERKSHI 4 C 70 70 60 60 75 75 LYME 5 C 55 65 60 70 75 100 LYONS 2 D 55 60 65 75 80 105 MACHIAS 4 B 70 70 70 70 115 115 MACOMBER 4 C 75 75 75 75 85 85 MACOMBER-TACONIC 4
C 75 75 75 75 85 85
MADALIN 1 D 55 60 65 75 75 105 MADAWASKA 5 B 70 70 60 60 115 115 MADRID 4 B 75 75 65 65 135 135 MALONE 4 C 60 65 65 75 105 125 MANAHAWKIN 6 D 55 65 90 130 60 130
Nitrogen Guidelines for Field Crops in New York. Second Release. June 22, 2003.
36
Appendix Table 1 (Continued)
Soil Name
SMG
HG N_Eff
UD (%)
N_Eff DR
(%)
N_Sup UD
(lbs N/a)
N_Sup DR
(lbs N/a)
YP UD
(bu/a)
YP DR
(bu/a)
MANDY 3 C 75 75 75 75 105 105 MANHEIM 2 C 60 65 65 75 105 125 MANHONING 2 D 60 65 65 75 90 115 MANLIUS 3 C 70 70 70 70 105 105 MANSFIELD 3 D 50 60 65 75 65 90 MAPLECREST 2 B 75 75 75 75 130 130 MARCY 3 D 55 60 65 75 90 95 MARDIN 3 C 70 70 75 75 115 120 MARILLA 3 C 70 70 75 75 120 120 MARKEY 6 A/D 55 65 90 130 60 150 MARLOW 4 C 75 75 60 60 120 120 MARTISCO 6 B 50 65 90 120 60 120 MASSENA 4 C 60 65 65 75 105 125 MATOON 1 D 60 60 65 75 100 120 MATUNUCK 6 D 50 65 90 130 60 130 MEDIHEMISTS 6 A/D 55 65 90 130 60 150 MEDOMAK 3 D 50 55 65 75 60 80 MELROSE 4 C 75 75 50 50 120 120 MENLO 4 D 55 60 60 70 80 95 MENTOR 4 B 75 75 60 60 125 125 MERRIMAC 4 A 70 70 75 75 105 105 MIDDLEBROOK 3 C 70 70 75 75 105 110 MIDDLEBROOK-MONGAUP 3 C 70 70 75 75 105 110 MIDDLEBURY 3 B 65 70 75 75 135 135 MILLIS 4 C 75 75 60 60 120 120 MILLSITE 4 C 70 70 65 65 100 100 MINEOLA 4 A 70 70 75 75 125 130 MINER 1 D 55 60 65 75 75 105 MINO 4 C 60 65 50 60 100 125 MINOA 4 C 60 65 50 60 100 125 MOHAWK 2 B 70 70 75 75 140 140 MOIRA 4 C 70 70 70 70 100 110 MONADNOCK 4 B 75 75 60 60 95 95 MONARDA 4 D 60 65 65 70 95 115 MONGAUP 3 C 75 75 70 70 105 105 MONTAUK 4 C 70 70 65 65 135 135 MOOERS 5 B 70 70 60 60 95 100 MOROCCO 4 C 55 65 60 65 90 115 MORRIS 3 C 60 65 65 75 95 105 MOSHERVILLE 4 C 60 65 60 70 100 125

Nitrogen Guidelines for Field Crops in New York. Second Release. June 22, 2003.
37
Appendix Table 1 (Continued).
Soil Name
SMG
HG N_Eff
UD (%)
N_Eff DR
(%)
N_Sup UD
(lbs N/a)
N_Sup DR
(lbs N/a)
YP UD
(bu/a)
YP DR
(bu/a)
MUCK 6 D 55 65 90 130 60 150 MUCK-PEAT 6 D 55 65 90 130 60 150 MUNDAL 4 C 75 75 60 60 65 65 MUNDALITE 3 C 75 75 70 70 105 105 MUNDALITE-RAWSONVILL 3
C 75 75 70 70 105 105
MUNSON 2 D 60 65 65 75 105 120 MUNUSCONG 4 B 55 65 60 65 60 95 MUSKEGO 6 A/C 55 65 90 130 60 150 MUSKELLUNGE 3 D 60 65 65 75 90 115 NAPOLEON 6 A 55 65 90 130 60 150 NAPOLI 3 C 60 65 65 75 80 90 NASSAU 4 C 70 70 50 50 85 85 NAUMBURG 5 C 55 65 60 65 90 100 NEHASNE 4 B 75 75 70 70 130 130 NELLIS 4 B 75 75 70 70 140 140 NEVERSINK 4 D 55 60 60 70 75 90 NEWFANE 4 B 75 75 50 50 125 125 NEWSTEAD 4 C 55 65 60 70 95 115 NEWTON 5 A/D 50 60 50 60 80 90 NIAGARA 3 C 60 65 65 75 110 125 NICHOLVILLE 4 C 70 70 70 70 105 110 NINIGRET 4 B 70 70 70 70 130 135 NORCHIP 3 D 55 60 70 80 60 80 NORWELL 5 C 60 65 60 70 100 120 NORWICH 3 D 55 60 60 70 70 90 NUNDA 2 C 70 70 75 75 125 130 OAKVILLE 5 A 70 70 50 50 90 100 OCCUM 4 B 75 75 75 75 140 140 ODESSA 2 D 60 65 75 75 105 115 OGDENSBURG 4 C 55 65 60 70 95 115 OLEAN 2 B 70 70 75 80 125 130 ONDAWA 4 B 75 75 75 75 135 135 ONEIDA 4 C 60 65 65 75 105 125 ONOVILLE 3 C 70 70 70 75 105 115 ONTARIO 2 B 75 75 75 75 140 140 ONTEORA 3 C 60 65 65 75 90 115 ONTUSIA 3 C 60 65 60 70 95 105 OQUAGA 3 C 70 70 65 65 100 100 ORAMEL 2 C 70 70 75 75 130 130 ORGANIC 6 A/D 50 65 90 130 60 130

Nitrogen Guidelines for Field Crops in New York. Second Release. June 22, 2003.
38
Appendix Table 1 (Continued).
Soil Name
SMG
HG N_Eff
UD (%)
N_Eff DR
(%)
N_Sup UD
(lbs N/a)
N_Sup DR
(lbs N/a)
YP UD
(bu/a)
YP DR
(bu/a)
ORPARK 2 C 60 65 65 75 100 110 ORWELL 2 D 55 60 65 75 90 100 OSSIPEE 6 D 55 65 90 130 60 150 OTEGO 2 B 70 70 70 75 140 150 OTISVILLE 4 A 70 70 50 50 95 95 OTSEGO 3 70 70 75 75 115 120 OTTAWA 5 A 70 70 50 50 115 115 OVID 2 C 65 70 70 75 105 125 PALATINE 2 B 65 70 65 70 100 100 PALMS 6 A/D 50 65 90 140 60 150 PALMYRA 3 B 75 75 70 70 140 140 PANTON 1 D 55 65 65 75 90 105 PAPAKATING 2 D 55 60 60 75 70 95 PARISHVILLE 4 C 70 70 70 70 100 110 PARSIPPANY 1 D 50 60 60 75 80 105 PATCHIN 3 D 55 60 65 75 65 85 PAWCATUCK 6 D 50 65 90 130 60 130 PAWLING 4 B 70 70 75 75 140 140 PAXTON 4 C 75 75 65 65 125 125 PEACHAM 3 D 55 60 70 80 60 75 PEAT 6 A/D 55 65 90 130 60 150 PEAT-MUCK 6 A/D 55 65 90 130 60 150 PERU 4 C 70 70 60 60 115 120 PETOSKEY 4 A 75 75 50 50 125 125 PHELPS 3 B 70 70 70 70 140 140 PHILO 3 B 70 70 75 75 135 135 PILLSBURY 4 C 60 65 65 75 70 100 PINCKNEY 3 C 70 70 75 75 115 120 PIPESTONE 5 B 60 65 55 65 70 100 PITTSFIELD 4 B 75 75 75 75 140 140 PITTSTOWN 4 C 65 70 70 70 125 135 PLAINBO 5 A 70 70 50 50 80 80 PLAINFIELD 5 A 70 70 30 30 90 90 PLESSIS 3 D 60 65 65 75 80 95 PLYMOUTH 4 A 70 70 50 50 75 75 PODUNK 4 B 70 70 75 75 130 130 POLAND 2 B 75 75 75 75 140 140 POMPTON 4 B 70 70 50 50 115 115 POOTATUCK 4 B 70 70 65 65 130 130 POPE 4 B 75 75 75 75 140 140 POTSDAM 4 C 70 70 70 70 120 120
Nitrogen Guidelines for Field Crops in New York. Second Release. June 22, 2003.
39
Appendix Table 1 (Continued).
Soil Name
SMG
HG N_Eff
UD (%)
N_Eff DR
(%)
N_Sup UD
(lbs N/a)
N_Sup DR
(lbs N/a)
YP UD
(bu/a)
YP DR
(bu/a)
POYGAN 1 D 50 60 60 70 70 90 PUNSIT 3 C 60 65 65 75 95 110 PYRITIES 4 B 75 75 75 75 140 140 QUETICO 4 D 70 70 50 50 65 65 QUETICO-ROCK OUTCRO 4
D 70 70 50 50 65 65
RAQUETTE 4 B 60 70 60 70 105 120 RAWSONVILLE 5 C 75 75 50 50 75 75 RAWSONVILLE-BESEMAN- 5
C 75 75 50 50 75 75
RAYNE 3 B 75 75 75 75 130 130 RAYNHAM 3 C 55 65 65 75 95 125 RAYPOL 3 C 55 60 60 75 75 90 RED HOOK 4 C 60 65 65 75 105 125 REDWATER 3 B 65 70 75 75 135 135 REMSEN 2 D 60 65 65 75 90 115 RETSOF 2 C 60 65 65 75 95 115 REXFORD 4 C 50 65 65 75 90 110 RHINEBECK 2 D 60 65 65 75 105 120 RICKER 4 A 70 70 60 60 75 75 RICKER-LYMAN 4 A 70 70 60 60 75 75 RIDGEBURY 4 C 55 65 60 70 90 110 RIFLE 6 A 50 65 90 130 60 130 RIGA 2 D 70 70 75 75 120 120 RIPPOWAM 4 C 55 65 60 70 80 105 RIVERHEAD 4 B 75 75 40 40 105 105 ROCKAWAY 2 C 75 75 75 75 125 125 ROMULUS 2 D 55 60 60 75 80 100 ROSS 2 B 75 75 75 75 155 155 ROUNDABOUT 3 C 60 60 60 70 95 110 RUMNEY 2 C 55 65 65 75 85 115 RUNEBERG 4 C 50 55 60 70 70 90 RUSE 4 D 55 60 55 65 75 90 RUSHFORD 3 B 70 70 75 75 120 125 SACO 3 D 50 55 65 75 65 95 SALAMANCA 3 B 70 70 75 75 100 105 SALMON 4 B 75 75 70 70 115 115 SAPRISTS 6 A/D 55 65 90 130 60 150 SAUGATUCK 5 C 60 65 60 70 70 95 SCANTIC 2 D 55 60 65 75 90 100 SCARBORO 4 D 55 65 60 70 75 105

Nitrogen Guidelines for Field Crops in New York. Second Release. June 22, 2003.
40
Appendix Table 1 (Continued).
Soil Name
SMG
HG N_Eff
UD (%)
N_Eff DR
(%)
N_Sup UD
(lbs N/a)
N_Sup DR
(lbs N/a)
YP UD
(bu/a)
YP DR
(bu/a)
SCHOHARIE 1 C 70 70 75 75 135 135 SCHROON 5 B 70 70 50 50 130 130 SCHUYLER 3 B 70 70 75 75 115 115 SCIO 3 B 70 70 75 75 135 140 SCITUATE 4 B 70 70 75 75 115 115 SCRIBA 4 C 60 65 65 75 94 105 SEARSPORT 4 D 55 65 60 70 75 105 SHAKER 2 C 60 65 65 75 105 125 SHOREHAM 2 D 50 60 70 70 65 95 SISK 4 C 55 60 65 75 60 85 SKERRY 5 C 60 65 65 75 95 100 SLOAN 3 B 50 55 65 75 70 90 SODUS 4 C 75 75 75 75 120 120 SOMERSET 5 C 60 65 65 75 90 105 ST JOHNS 4 D 55 65 60 70 75 105 STAATSBURG 3 C 75 75 70 70 90 90 STAFFORD 4 C 60 65 50 60 95 110 STEAMBURG 3 B 70 70 75 75 100 105 STETSON 5 B 75 75 70 70 110 110 STISSING 4 C 60 65 60 70 90 115 STOCKBRIDGE 3 C 75 75 75 75 140 140 STOCKHOLM 5 C 60 60 60 70 90 100 STOWE 4 B 75 75 65 65 110 110 SUDBURY 4 B 60 65 65 65 105 110 SUFFIELD 2 B 70 70 80 80 135 135 SUMMERVILLE 4 D 70 70 50 50 80 80 SUN 4 D 55 60 60 70 75 100 SUNAPEE 4 B 70 70 65 65 95 110 SUNCOOK 5 A 70 70 40 40 90 90 SUNY 4 D 50 55 60 70 70 110 SURPLUS 4 C 55 60 65 75 60 90 SURPLUS-SISK 4 C 55 60 65 75 60 90 SUTTON 4 B 70 70 70 70 130 130 SWANTON 4 C 60 65 50 60 95 125 SWARTSWOOD 4 C 75 75 70 70 120 120 SWORMVILLE 1 C 60 65 65 75 90 115 TACONIC 3 C 75 75 75 75 75 90 TACONIC-MACOMBER 3 C 75 75 75 75 75 90 TAWAS 6 A 50 65 90 130 60 130 TEEL 2 B 65 70 75 75 140 140
Nitrogen Guidelines for Field Crops in New York. Second Release. June 22, 2003.
41
Appendix Table 1 (Continued).
Soil Name
SMG
HG N_Eff
UD (%)
N_Eff DR
(%)
N_Sup UD
(lbs N/a)
N_Sup DR
(lbs N/a)
YP UD
(bu/a)
YP DR
(bu/a)
TOLEDO 2 D 50 60 70 80 70 100 TONAWANDA 2 D 60 65 65 75 105 120 TOR 4 D 60 60 65 75 60 85 TORULL 3 D 60 65 65 75 90 110 TOWERVILLE 3 B 70 70 75 75 115 115 TRESTLE 3 B 75 75 75 75 145 145 TROUT RIVER 5 A 70 70 50 50 95 95 TROY 3 C 70 70 70 70 120 125 TRUMBULL 1 D 55 60 65 75 75 105 TUGHILL 4 D 50 55 55 65 60 85 TULLER 3 D 60 65 65 75 80 95 TUNBRIDGE 4 C 75 75 70 70 90 90 TUNBRIDGE-ADIRONDACK 4
C 75 75 70 70 90 90
TUNKHANNOCK 3 A 75 75 75 75 120 120 TURIN 2 C 60 65 70 80 105 125 TUSCARORA 4 C 70 70 50 50 125 125 UNADILLA 3 B 75 75 75 75 140 140 VALOIS 3 B 75 75 75 75 130 130 VARICK 2 D 55 60 75 75 80 100 VARYSBURG 2 B 70 70 75 75 130 130 VENANGO 3 C 60 65 60 70 100 120 VERGENNES 1 C 70 70 75 75 115 120 VLY 3 C 75 75 75 75 90 90 VOLUSIA 3 C 60 65 60 70 95 105 WADDINGTON 4 A 75 75 60 60 125 125 WAINOLA 5 B 60 65 60 70 85 125 WAKELAND 3 C 60 65 75 75 90 115 WAKEVILLE 3 B 60 65 65 75 95 110 WALLACE 5 B 70 70 40 40 90 100 WALLINGTON 3 C 60 65 65 75 105 115 WALLKILL 3 C 50 60 65 80 65 125 WALPOLE 4 C 65 68 55 60 80 105 WALTON 3 C 75 75 75 75 125 125 WAMPSVILLE 3 B 75 75 75 75 140 140 WAPPINGER 3 B 75 75 75 75 140 140 WAREHAM 5 C 60 65 65 75 90 105 WARNERS 3 C 50 60 70 75 75 90 WASSAIC 4 B 70 70 65 65 120 120 WATCHAUG 4 B 70 70 70 70 120 120 WAUMBECK 4 B 70 70 65 65 95 105
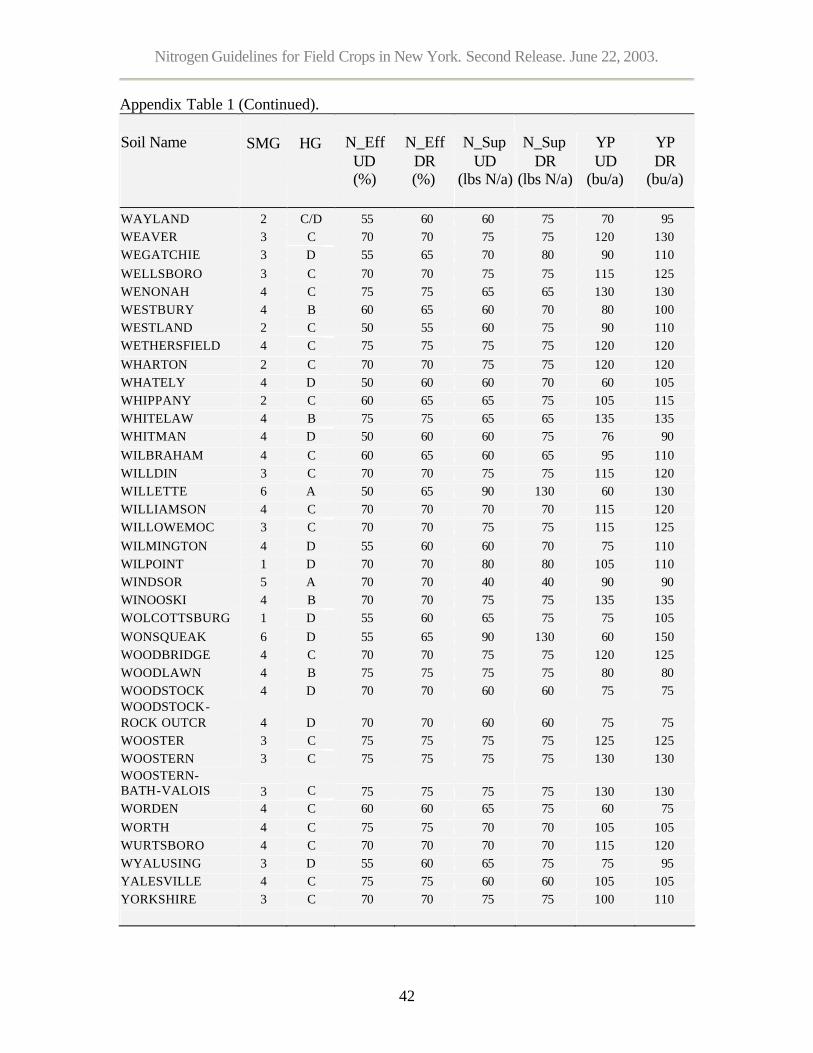
Nitrogen Guidelines for Field Crops in New York. Second Release. June 22, 2003.
42
Appendix Table 1 (Continued).
Soil Name
SMG
HG
N_Eff UD (%)
N_Eff DR
(%)
N_Sup UD
(lbs N/a)
N_Sup DR
(lbs N/a)
YP UD
(bu/a)
YP DR
(bu/a)
WAYLAND 2 C/D 55 60 60 75 70 95 WEAVER 3 C 70 70 75 75 120 130 WEGATCHIE 3 D 55 65 70 80 90 110 WELLSBORO 3 C 70 70 75 75 115 125 WENONAH 4 C 75 75 65 65 130 130 WESTBURY 4 B 60 65 60 70 80 100 WESTLAND 2 C 50 55 60 75 90 110 WETHERSFIELD 4 C 75 75 75 75 120 120 WHARTON 2 C 70 70 75 75 120 120 WHATELY 4 D 50 60 60 70 60 105 WHIPPANY 2 C 60 65 65 75 105 115 WHITELAW 4 B 75 75 65 65 135 135 WHITMAN 4 D 50 60 60 75 76 90 WILBRAHAM 4 C 60 65 60 65 95 110 WILLDIN 3 C 70 70 75 75 115 120 WILLETTE 6 A 50 65 90 130 60 130 WILLIAMSON 4 C 70 70 70 70 115 120 WILLOWEMOC 3 C 70 70 75 75 115 125 WILMINGTON 4 D 55 60 60 70 75 110 WILPOINT 1 D 70 70 80 80 105 110 WINDSOR 5 A 70 70 40 40 90 90 WINOOSKI 4 B 70 70 75 75 135 135 WOLCOTTSBURG 1 D 55 60 65 75 75 105 WONSQUEAK 6 D 55 65 90 130 60 150 WOODBRIDGE 4 C 70 70 75 75 120 125 WOODLAWN 4 B 75 75 75 75 80 80 WOODSTOCK 4 D 70 70 60 60 75 75 WOODSTOCK-ROCK OUTCR 4
D 70 70 60 60 75 75
WOOSTER 3 C 75 75 75 75 125 125 WOOSTERN 3 C 75 75 75 75 130 130 WOOSTERN-BATH-VALOIS 3
C 75 75 75 75 130 130
WORDEN 4 C 60 60 65 75 60 75 WORTH 4 C 75 75 70 70 105 105 WURTSBORO 4 C 70 70 70 70 115 120 WYALUSING 3 D 55 60 65 75 75 95 YALESVILLE 4 C 75 75 60 60 105 105 YORKSHIRE 3 C 70 70 75 75 100 110

Nitrogen Guidelines for Field Crops in New York. Second Release. June 22, 2003.
43
APPENDIX TABLE 2: SOIL MANAGEMENT GROUPS FOR NEW YORK STATE.
Soil Management
Group
General Description
I (1) Fine-textured soils developed from clayey lake sediments and medium-
to fine-textured soils developed from lake sediments.
II (2) Medium- to fine-textured soils developed from calcareous glacial till and medium-textured to moderately fine-textured soils developed from slightly calcareous glacial till mixed with shale and medium-textured soils developed in recent alluvium.
III (3) Moderately coarse textured soil developed from glacial outwash and recent alluvium and medium-textured acid soil developed on glacial till.
IV (4) Coarse- to medium-textured soils formed from glacial till or glacial outwash.
V (5) Coarse- to very coarse-textured soils formed from gravelly or sandy glacial outwash or glacial lake beach ridges or deltas.
VI (6) Organic or muck lands.

Nitrogen Guidelines for Field Crops in New York. Second Release. June 22, 2003.
44
APPENDIX TABLE 3: NEW YORK TOWNSHIP-BASED NITRATE LEACHING INDEX FOR SOILS WITH HYDROLOGICAL GROUPS A, B, C AND D.
County
Township
Precipitation
N Leaching Index
PA
PW
Soil Hydrologic Group
------Inches------
A
B
C
D
Albany Berne 39.4 18.1 15.0 9.3 5.6 3.7 Albany Bethlehem 36.4 16.0 12.6 7.4 4.1 2.6 Albany Coeymans 37.7 16.4 13.5 8.1 4.7 3.0 Albany Colonie 36.8 15.9 12.9 7.6 4.3 2.7 Albany Guilderland 37.5 16.5 13.4 8.0 4.6 3.0 Albany Knox 40.6 18.5 15.9 10.0 6.2 4.2 Albany New Scotland 37.8 16.5 13.6 8.2 4.8 3.1 Albany Rensselaerville 38.2 17.0 14.0 8.5 5.0 3.2 Albany Westerlo 39.0 17.4 14.6 9.0 5.3 3.5 Allegany Alfred 37.0 16.3 13.1 7.8 4.4 2.8 Allegany Allen 36.9 15.3 12.7 7.5 4.3 2.7 Allegany Alma 38.8 16.5 14.2 8.7 5.2 3.4 Allegany Almond 35.3 14.5 11.6 6.6 3.6 2.2 Allegany Amity 35.5 14.3 11.6 6.7 3.7 2.2 Allegany Andover 37.4 16.4 13.3 8.0 4.6 2.9 Allegany Angelica 36.0 14.8 12.1 7.0 3.9 2.4 Allegany Belfast 35.7 14.5 11.8 6.8 3.8 2.3 Allegany Birdsall 36.9 15.6 12.8 7.6 4.3 2.7 Allegany Bolivar 38.9 16.4 14.3 8.8 5.2 3.4 Allegany Burns 34.2 13.8 10.7 6.0 3.2 1.8 Allegany Caneadea 35.0 14.8 11.5 6.6 3.5 2.1 Allegany Centerville 38.4 15.9 13.8 8.4 4.9 3.2 Allegany Clarksville 39.0 16.5 14.3 8.8 5.3 3.5 Allegany Cuba 38.4 16.2 13.9 8.5 5.0 3.2 Allegany Friendship 36.9 15.1 12.7 7.5 4.3 2.7 Allegany Genesee 39.0 16.5 14.3 8.8 5.2 3.5 Allegany Granger 36.7 15.5 12.6 7.5 4.2 2.6 Allegany Grove 36.4 15.3 12.4 7.3 4.1 2.5 Allegany Hume 35.5 14.8 11.7 6.8 3.7 2.2 Allegany Independence 37.0 15.6 12.9 7.7 4.4 2.7 Allegany New Hudson 37.8 15.4 13.3 8.0 4.6 3.0 Allegany Rushford 36.4 15.0 12.4 7.3 4.1 2.5 Allegany Scio 36.9 15.1 12.7 7.5 4.3 2.7 Allegany Ward 37.3 16.3 13.2 7.9 4.5 2.9 Allegany Wellsville 36.2 14.8 12.2 7.1 4.0 2.4

Nitrogen Guidelines for Field Crops in New York. Second Release. June 22, 2003.
45
Appendix Table 3 (Continued). County
Township
Precipitation
N Leaching Index
PA
PW
Soil Hydrologic Group
------Inches------
A
B
C
D
Allegany West Almond 37.2 16.2 13.1 7.8 4.5 2.8 Allegany Willing 36.7 15.2 12.6 7.4 4.2 2.6 Allegany Wirt 38.9 16.5 14.2 8.7 5.2 3.4 Broome Barker 37.0 16.1 13.0 7.7 4.4 2.7 Broome Binghamton 38.8 17.5 14.5 8.9 5.3 3.4 Broome Chenango 37.0 16.0 13.0 7.7 4.4 2.8 Broome Colesville 40.0 18.0 15.4 9.6 5.9 3.9 Broome Conklin 38.4 16.7 14.0 8.5 5.0 3.3 Broome Dickinson 36.7 16.0 12.8 7.5 4.3 2.6 Broome Fenton 37.8 16.6 13.6 8.2 4.8 3.1 Broome Kirkwood 38.3 16.6 13.9 8.4 5.0 3.2 Broome Lisle 37.2 16.6 13.3 7.9 4.5 2.9 Broome Maine 36.3 16.0 12.5 7.3 4.1 2.5 Broome Nanticoke 37.0 16.1 13.0 7.7 4.4 2.8 Broome Sanford 44.2 20.5 18.8 12.4 8.1 5.8 Broome Triangle 37.5 16.6 13.4 8.0 4.6 2.9 Broome Union 35.4 15.9 12.0 6.9 3.8 2.3 Broome Vestal 37.0 16.2 13.1 7.8 4.4 2.8 Broome Windsor 40.9 18.6 16.1 10.2 6.3 4.3 Cattaraugus Allegany 42.8 18.5 17.3 11.2 7.1 5.0 Cattaraugus Ashford 43.6 19.8 18.2 11.9 7.7 5.5 Cattaraugus Carrollton 43.0 18.6 17.5 11.4 7.3 5.1 Cattaraugus Cold Spring 44.2 19.8 18.6 12.3 8.0 5.7 Cattaraugus Conewango 43.5 19.7 18.1 11.9 7.6 5.4 Cattaraugus Dayton 42.9 19.8 17.7 11.5 7.4 5.2 Cattaraugus East Otto 43.9 20.1 18.5 12.2 7.9 5.6 Cattaraugus Ellicottville 46.3 21.2 20.4 13.8 9.2 6.7 Cattaraugus Farmersville 40.6 17.5 15.6 9.8 6.0 4.1 Cattaraugus Franklinville 42.6 18.7 17.2 11.1 7.1 5.0 Cattaraugus Freedom 42.0 18.3 16.7 10.7 6.7 4.7 Cattaraugus Great Valley 45.1 20.2 19.3 12.9 8.5 6.1 Cattaraugus Hinsdale 40.5 17.4 15.5 9.8 6.0 4.0 Cattaraugus Humphrey 43.6 19.1 18.0 11.8 7.6 5.4 Cattaraugus Ischua 41.0 17.7 15.9 10.1 6.3 4.3 Cattaraugus Leon 43.6 19.8 18.2 11.9 7.7 5.4 Cattaraugus Little Valley 48.5 22.9 22.4 15.4 10.6 7.9

Nitrogen Guidelines for Field Crops in New York. Second Release. June 22, 2003.
46
Appendix Table 3 (Continued). County
Township
Precipitation
N Leaching Index
PA
PW
Soil Hydrologic Group
------Inches------
A
B
C
D
Cattaraugus Lyndon 40.1 17.5 15.3 9.6 5.9 3.9 Cattaraugus Machias 42.9 18.8 17.5 11.3 7.2 5.1 Cattaraugus Mansfield 47.1 22.0 21.2 14.4 9.8 7.2 Cattaraugus Napoli 47.3 22.0 21.3 14.5 9.8 7.3 Cattaraugus New Albion 45.7 20.8 19.9 13.4 8.9 6.5 Cattaraugus Olean 40.8 17.4 15.7 9.9 6.1 4.2 Cattaraugus Otto 43.0 19.4 17.7 11.5 7.3 5.2 Cattaraugus Perrysburg 40.1 18.3 15.5 9.7 5.9 4.0 Cattaraugus Persia 42.3 19.2 17.2 11.1 7.0 4.9 Cattaraugus Portville 39.6 16.9 14.8 9.2 5.6 3.7 Cattaraugus Randolph 44.4 20.4 18.9 12.5 8.2 5.9 Cattaraugus Red House 45.0 20.2 19.2 12.8 8.4 6.1 Cattaraugus Salamanca 44.7 20.2 19.0 12.6 8.3 5.9 Cattaraugus South Valley 44.3 20.1 18.8 12.4 8.1 5.8 Cattaraugus Yorkshire 42.5 18.9 17.2 11.1 7.1 5.0 Cayuga Auburn 36.4 16.0 12.6 7.4 4.2 2.6 Cayuga Aurelius 34.9 15.1 11.4 6.5 3.5 2.1 Cayuga Brutus 37.0 17.0 13.2 7.9 4.5 2.8 Cayuga Cato 37.6 17.3 13.7 8.2 4.7 3.0 Cayuga Conquest 36.8 16.9 13.1 7.8 4.4 2.8 Cayuga Fleming 36.8 15.9 12.9 7.6 4.3 2.7 Cayuga Genoa 35.9 14.9 12.0 7.0 3.9 2.3 Cayuga Ira 39.0 18.0 14.7 9.1 5.4 3.5 Cayuga Ledyard 34.0 14.3 10.8 6.0 3.1 1.8 Cayuga Locke 37.9 16.2 13.6 8.2 4.8 3.0 Cayuga Mentz 35.4 15.9 12.0 6.9 3.8 2.3 Cayuga Montezuma 35.0 15.3 11.6 6.6 3.6 2.1 Cayuga Moravia 37.8 15.9 13.5 8.1 4.7 3.0 Cayuga Niles 38.6 17.3 14.3 8.7 5.2 3.4 Cayuga Owasco 37.7 17.0 13.6 8.2 4.7 3.0 Cayuga Scipio 37.0 15.5 12.8 7.6 4.3 2.7 Cayuga Sempronius 40.1 18.0 15.4 9.6 5.9 3.9 Cayuga Sennett 37.3 17.0 13.4 8.0 4.6 2.9 Cayuga Springport 34.4 14.8 11.1 6.2 3.3 1.9 Cayuga Sterling 39.5 19.5 15.4 9.6 5.8 3.8 Cayuga Summerhill 40.4 17.9 15.6 9.8 6.0 4.1 Cayuga Throop 35.0 15.5 11.7 6.7 3.6 2.1

Nitrogen Guidelines for Field Crops in New York. Second Release. June 22, 2003.
47
Appendix Table 3 (Continued). County
Township
Precipitation
N Leaching Index
PA
PW
Soil Hydrologic Group
------Inches------
A
B
C
D
Cayuga Venice 37.3 15.3 13.0 7.7 4.4 2.8 Cayuga Victory 37.9 17.2 13.9 8.4 4.9 3.1 Chautauqua Arkwright 46.2 21.9 20.5 13.8 9.2 6.8 Chautauqua Busti 45.2 20.8 19.5 13.0 8.6 6.2 Chautauqua Carroll 44.6 20.3 19.0 12.6 8.2 5.9 Chautauqua Charlotte 47.5 22.9 21.7 14.8 10.1 7.5 Chautauqua Chautauqua 46.8 21.9 21.0 14.2 9.6 7.1 Chautauqua Cherry Creek 45.9 21.7 20.3 13.6 9.1 6.6 Chautauqua Clymer 47.2 22.3 21.4 14.5 9.8 7.3 Chautauqua Dunkirk 39.0 18.3 14.8 9.1 5.4 3.6 Chautauqua Ellery 46.4 22.1 20.8 14.0 9.4 6.9 Chautauqua Ellicott 45.5 21.4 19.9 13.3 8.8 6.4 Chautauqua Ellington 45.9 21.6 20.3 13.6 9.1 6.6 Chautauqua French Creek 47.1 21.9 21.1 14.4 9.7 7.2 Chautauqua Gerry 46.8 22.3 21.1 14.3 9.6 7.1 Chautauqua Hanover 41.3 19.0 16.5 10.5 6.5 4.5 Chautauqua Harmony 47.0 21.7 21.0 14.3 9.6 7.1 Chautauqua Kiantone 44.3 20.0 18.7 12.3 8.0 5.8 Chautauqua Mina 47.0 21.9 21.1 14.3 9.7 7.1 Chautauqua North Harmony 46.4 21.9 20.7 14.0 9.4 6.9 Chautauqua Poland 44.2 20.3 18.8 12.4 8.1 5.8 Chautauqua Pomfret 43.0 19.9 17.9 11.6 7.4 5.2 Chautauqua Portland 43.2 19.6 17.9 11.7 7.5 5.3 Chautauqua Ripley 45.6 20.7 19.8 13.2 8.8 6.4 Chautauqua Sheridan 40.9 18.7 16.2 10.2 6.3 4.3 Chautauqua Sherman 47.1 22.1 21.2 14.4 9.8 7.2 Chautauqua Stockton 46.4 22.0 20.7 14.0 9.4 6.9 Chautauqua Villenova 45.3 21.5 19.8 13.2 8.7 6.3 Chautauqua Westfield 45.6 20.7 19.8 13.2 8.8 6.4 Chemung Ashland 34.8 15.0 11.4 6.5 3.5 2.0 Chemung Baldwin 35.5 15.4 11.9 6.9 3.8 2.3 Chemung Big Flats 33.1 13.7 10.1 5.5 2.8 1.5 Chemung Catlin 34.4 14.0 10.9 6.1 3.2 1.9 Chemung Chemung 35.4 15.6 11.9 6.9 3.8 2.3 Chemung Elmira 33.5 14.2 10.4 5.8 2.9 1.7 Chemung Erin 36.4 16.1 12.6 7.4 4.1 2.6 Chemung Horseheads 33.8 14.1 10.6 5.9 3.0 1.7

Nitrogen Guidelines for Field Crops in New York. Second Release. June 22, 2003.
48
Appendix Table 3 (Continued). County
Township
Precipitation
N Leaching Index
PA
PW
Soil Hydrologic Group
------Inches------
A
B
C
D
Chemung Southport 34.0 14.4 10.8 6.0 3.1 1.8 Chemung Van Etten 37.7 16.8 13.6 8.2 4.7 3.0 Chemung Veteran 34.4 14.6 11.0 6.2 3.3 1.9 Chenango Afton 40.7 18.1 15.9 10.0 6.2 4.2 Chenango Bainbridge 40.8 17.5 15.8 10.0 6.2 4.2 Chenango Columbus 39.0 17.5 14.6 9.0 5.4 3.5 Chenango Coventry 40.3 17.5 15.4 9.7 5.9 4.0 Chenango German 42.3 19.0 17.2 11.1 7.0 4.9 Chenango Greene 38.8 17.0 14.3 8.8 5.2 3.4 Chenango Guilford 39.9 17.3 15.1 9.4 5.7 3.8 Chenango Lincklaen 41.0 18.4 16.1 10.2 6.3 4.3 Chenango Mcdonough 41.4 18.4 16.4 10.4 6.5 4.5 Chenango New Berlin 39.2 17.5 14.7 9.1 5.4 3.6 Chenango North Norwich 38.1 16.9 13.9 8.4 4.9 3.2 Chenango Norwich 39.6 17.5 15.0 9.3 5.6 3.7 Chenango Otselic 41.1 18.1 16.1 10.2 6.3 4.3 Chenango Oxford 39.4 17.5 14.9 9.2 5.5 3.7 Chenango Pharsalia 42.8 19.6 17.7 11.5 7.3 5.1 Chenango Pitcher 41.9 18.6 16.8 10.8 6.8 4.7 Chenango Plymouth 40.1 17.5 15.3 9.6 5.8 3.9 Chenango Preston 40.2 17.6 15.4 9.7 5.9 4.0 Chenango Sherburne 37.7 16.6 13.6 8.2 4.7 3.0 Chenango Smithville 39.5 17.5 14.9 9.2 5.6 3.7 Chenango Smyrna 39.3 17.3 14.8 9.1 5.5 3.6 Clinton Altona 32.9 13.6 9.9 5.4 2.7 1.5 Clinton Ausable 31.8 13.2 9.2 4.8 2.3 1.2 Clinton Beekmantown 32.7 13.5 9.8 5.3 2.6 1.4 Clinton Black Brook 35.8 15.2 12.0 7.0 3.8 2.3 Clinton Champlain 32.6 13.0 9.6 5.2 2.5 1.4 Clinton Chazy 32.4 13.0 9.5 5.1 2.5 1.3 Clinton Clinton 34.9 14.7 11.4 6.5 3.5 2.1 Clinton Dannemora 37.8 16.6 13.6 8.2 4.8 3.1 Clinton Ellenburg 36.9 15.9 12.9 7.7 4.4 2.7 Clinton Mooers 32.1 13.0 9.3 4.9 2.4 1.2 Clinton Peru 32.2 13.5 9.5 5.1 2.5 1.3 Clinton Plattsburgh 32.4 13.6 9.6 5.2 2.5 1.3 Clinton Saranac 36.4 15.5 12.5 7.3 4.1 2.5

Nitrogen Guidelines for Field Crops in New York. Second Release. June 22, 2003.
49
Appendix Table 3 (Continued). County
Township
Precipitation
N Leaching Index
PA
PW
Soil Hydrologic Group
------Inches------
A
B
C
D
Clinton Schuyler Falls 32.3 13.3 9.6 5.1 2.5 1.3 Columbia Ancram 43.8 19.7 18.3 12.0 7.8 5.6 Columbia Austerlitz 46.0 21.2 20.2 13.6 9.0 6.6 Columbia Canaan 45.3 20.5 19.5 13.0 8.6 6.2 Columbia Chatham 41.3 18.5 16.4 10.4 6.5 4.5 Columbia Claverack 41.3 18.5 16.4 10.4 6.5 4.5 Columbia Clermont 41.4 19.1 16.6 10.6 6.6 4.5 Columbia Copake 44.4 20.1 18.8 12.5 8.1 5.8 Columbia Gallatin 42.3 19.0 17.2 11.1 7.0 4.9 Columbia Germantown 41.0 18.8 16.2 10.3 6.4 4.4 Columbia Ghent 41.0 18.4 16.1 10.2 6.3 4.3 Columbia Greenport 39.5 17.5 14.9 9.2 5.6 3.7 Columbia Hillsdale 45.2 20.8 19.6 13.1 8.6 6.3 Columbia Kinderhook 39.2 17.5 14.7 9.1 5.4 3.6 Columbia Livingston 41.0 18.5 16.2 10.2 6.3 4.3 Columbia New Lebanon 42.3 18.9 17.1 11.0 7.0 4.9 Columbia Stockport 39.0 17.5 14.6 9.0 5.4 3.5 Columbia Stuyvesant 38.4 17.0 14.1 8.6 5.1 3.3 Columbia Taghkanic 42.4 19.0 17.2 11.1 7.0 4.9 Cortland Cincinnatus 42.1 18.8 16.9 10.9 6.9 4.8 Cortland Cortlandville 39.5 18.5 15.2 9.4 5.7 3.8 Cortland Cuyler 41.1 18.3 16.1 10.2 6.3 4.3 Cortland Freetown 41.2 18.0 16.2 10.3 6.4 4.4 Cortland Harford 39.0 17.4 14.6 9.0 5.3 3.5 Cortland Homer 40.7 18.8 16.0 10.1 6.2 4.2 Cortland Lapeer 39.0 17.5 14.6 9.0 5.4 3.5 Cortland Marathon 39.1 17.3 14.7 9.0 5.4 3.6 Cortland Preble 40.9 18.6 16.1 10.2 6.3 4.3 Cortland Scott 41.0 18.8 16.3 10.3 6.4 4.4 Cortland Solon 41.3 18.8 16.5 10.5 6.5 4.5 Cortland Taylor 42.1 18.9 17.0 10.9 6.9 4.8 Cortland Truxton 41.0 18.0 16.0 10.1 6.3 4.3 Cortland Virgl 39.7 17.8 15.1 9.4 5.7 3.8 Cortland Willet 40.4 17.7 15.6 9.8 6.0 4.1 Delaware Andes 41.3 17.9 16.1 10.3 6.4 4.4 Delaware Bovina 40.1 17.0 15.2 9.5 5.8 3.9 Delaware Colchester 44.3 19.9 18.7 12.4 8.1 5.8

Nitrogen Guidelines for Field Crops in New York. Second Release. June 22, 2003.
50
Appendix Table 3 (Continued). County
Township
Precipitation
N Leaching Index
PA
PW
Soil Hydrologic Group
------Inches------
A
B
C
D
Delaware Davenport 39.5 16.9 14.8 9.1 5.5 3.7 Delaware Delhi 41.3 18.1 16.2 10.3 6.4 4.4 Delaware Deposit 43.4 19.8 18.1 11.8 7.6 5.4 Delaware Franklin 42.2 18.8 17.0 10.9 6.9 4.8 Delaware Hamden 43.1 19.2 17.7 11.5 7.4 5.2 Delaware Hancock 43.7 20.1 18.4 12.1 7.8 5.5 Delaware Harpersfield 39.0 16.9 14.5 8.9 5.3 3.5 Delaware Kortright 39.4 17.0 14.7 9.1 5.5 3.6 Delaware Masonville 43.3 19.4 17.9 11.7 7.5 5.3 Delaware Meredith 41.3 18.3 16.3 10.4 6.4 4.4 Delaware Middletown 39.1 16.9 14.5 8.9 5.3 3.5 Delaware Roxbury 41.1 18.1 16.1 10.2 6.3 4.3 Delaware Sidney 41.0 18.1 16.0 10.1 6.3 4.3 Delaware Stamford 40.7 17.8 15.8 9.9 6.1 4.2 Delaware Tompkins 43.7 20.1 18.3 12.0 7.8 5.5 Delaware Walton 45.2 20.6 19.5 13.0 8.6 6.2 Dutchess Amenia 42.0 18.7 16.9 10.8 6.8 4.7 Dutchess Beekman 45.2 21.2 19.7 13.1 8.7 6.3 Dutchess Clinton 43.1 19.4 17.8 11.6 7.4 5.2 Dutchess Dover 44.7 21.0 19.3 12.8 8.4 6.0 Dutchess East Fishkill 44.5 20.5 19.0 12.6 8.2 5.9 Dutchess Fishkill 44.5 20.4 19.0 12.5 8.2 5.9 Dutchess Hyde Park 43.7 20.1 18.4 12.0 7.8 5.5 Dutchess La Grange 42.9 19.1 17.5 11.4 7.3 5.1 Dutchess Milan 42.4 19.1 17.2 11.1 7.0 4.9 Dutchess Northeast 43.9 19.8 18.4 12.1 7.8 5.6 Dutchess Pawling 46.1 22.0 20.5 13.8 9.2 6.7 Dutchess Pine Plains 41.8 18.9 16.8 10.8 6.8 4.7 Dutchess Pleasant Val'y 43.0 19.0 17.6 11.4 7.3 5.1 Dutchess Poughkeepsie 41.7 19.0 16.7 10.7 6.7 4.6 Dutchess Red Hook 42.6 19.6 17.5 11.4 7.2 5.1 Dutchess Rhinebeck 44.1 20.6 18.8 12.4 8.0 5.8 Dutchess Stanford 41.0 18.2 16.1 10.2 6.3 4.3 Dutchess Union Vale 44.2 19.7 18.6 12.2 8.0 5.7 Dutchess Wappinger 41.9 19.0 16.9 10.8 6.8 4.7 Dutchess Washington 41.9 18.7 16.8 10.8 6.8 4.7 Erie Alden 37.9 17.5 14.0 8.4 4.9 3.2

Nitrogen Guidelines for Field Crops in New York. Second Release. June 22, 2003.
51
Appendix Table 3 (Continued). County
Township
Precipitation
N Leaching Index
PA
PW
Soil Hydrologic Group
------Inches------
A
B
C
D
Erie Amherst 37.9 18.0 14.1 8.5 4.9 3.2 Erie Aurora 42.8 20.5 17.9 11.6 7.4 5.2 Erie Boston 45.1 21.9 19.8 13.2 8.7 6.3 Erie Brant 38.2 17.1 14.0 8.5 5.0 3.2 Erie Cheektowaga 39.0 18.5 14.9 9.2 5.5 3.6 Erie Clarence 37.4 17.3 13.6 8.1 4.7 3.0 Erie Colden 47.1 22.8 21.5 14.6 9.9 7.3 Erie Collins 39.9 18.4 15.5 9.6 5.9 3.9 Erie Concord 44.8 21.2 19.4 12.9 8.4 6.1 Erie Eden 40.7 18.7 16.0 10.1 6.2 4.2 Erie Elma 39.6 18.6 15.3 9.5 5.7 3.8 Erie Evans 37.9 17.0 13.8 8.3 4.8 3.1 Erie Hamburg 38.5 17.7 14.3 8.7 5.1 3.4 Erie Holland 43.7 20.4 18.5 12.1 7.8 5.6 Erie Lackawana 37.1 17.6 13.5 8.0 4.6 2.9 Erie Lancaster 39.0 18.5 14.9 9.2 5.5 3.6 Erie Marilla 39.8 18.4 15.4 9.6 5.8 3.9 Erie Newstead 36.4 15.9 12.6 7.4 4.1 2.6 Erie North Collins 42.2 20.0 17.4 11.2 7.1 4.9 Erie Orchard Park 41.3 19.5 16.7 10.6 6.6 4.5 Erie Sardinia 43.9 20.1 18.5 12.2 7.9 5.6 Erie Tonawanda 37.6 18.3 13.9 8.4 4.8 3.1 Erie Wales 42.5 20.1 17.6 11.4 7.2 5.1 Erie West Seneca 39.0 18.5 14.9 9.2 5.5 3.6 Essex Chesterfield 34.7 14.6 11.2 6.4 3.4 2.0 Essex Crown Point 37.6 16.5 13.5 8.1 4.7 3.0 Essex Elizabethtown 37.6 16.6 13.5 8.1 4.7 3.0 Essex Essex 34.4 14.3 11.0 6.2 3.3 1.9 Essex Jay 35.8 15.5 12.1 7.0 3.9 2.3 Essex Keene 42.2 18.1 16.8 10.8 6.8 4.7 Essex Lewis 36.6 15.9 12.7 7.5 4.2 2.6 Essex Minerva 42.5 19.2 17.3 11.2 7.1 5.0 Essex Moriah 37.5 16.4 13.4 8.0 4.6 2.9 Essex Newcomb 43.4 19.2 17.9 11.7 7.5 5.3 Essex North Elba 41.4 18.1 16.3 10.3 6.4 4.4 Essex North Hudson 41.3 18.3 16.3 10.4 6.5 4.4 Essex Schroon 40.6 18.2 15.8 10.0 6.1 4.2

Nitrogen Guidelines for Field Crops in New York. Second Release. June 22, 2003.
52
Appendix Table 3 (Continued). County
Township
Precipitation
N Leaching Index
PA
PW
Soil Hydrologic Group
------Inches------
A
B
C
D
Essex St. Armand 39.5 17.4 14.9 9.2 5.5 3.7 Essex Ticonderoga 38.2 16.8 13.9 8.5 5.0 3.2 Essex Westport 35.7 15.2 12.0 6.9 3.8 2.3 Essex Willsboro 33.2 13.8 10.1 5.5 2.8 1.5 Essex Wilmington 38.8 16.7 14.2 8.7 5.2 3.4 Franklin Altamont 41.7 18.1 16.5 10.5 6.6 4.6 Franklin Bangor 36.4 15.6 12.5 7.3 4.1 2.5 Franklin Bellmont 43.0 18.7 17.5 11.4 7.3 5.1 Franklin Bombay 35.0 14.8 11.5 6.5 3.5 2.1 Franklin Brandon 40.9 17.7 15.9 10.0 6.2 4.2 Franklin Brighton 40.0 17.5 15.2 9.5 5.8 3.9 Franklin Burke 36.6 15.6 12.6 7.4 4.2 2.6 Franklin Chateaugay 37.3 16.0 13.2 7.9 4.5 2.9 Franklin Constable 35.1 14.9 11.5 6.6 3.6 2.1 Franklin Dickinson 37.9 16.1 13.5 8.2 4.7 3.0 Franklin Duane 41.6 17.9 16.4 10.4 6.5 4.5 Franklin Fort Covington 35.0 14.5 11.4 6.5 3.5 2.1 Franklin Franklin 39.5 17.2 14.8 9.2 5.5 3.7 Franklin Harrietstown 40.8 17.9 15.9 10.0 6.2 4.2 Franklin Malone 40.3 17.5 15.5 9.7 5.9 4.0 Franklin Moira 35.1 15.0 11.6 6.6 3.6 2.1 Franklin Santa Clara 41.0 17.7 15.9 10.1 6.2 4.3 Franklin Waverly 40.9 17.8 15.9 10.1 6.2 4.3 Franklin Westville 35.0 14.7 11.4 6.5 3.5 2.1 Fulton Bleeker 50.3 24.7 24.2 17.0 11.8 9.0 Fulton Broadalbin 43.0 20.4 18.0 11.7 7.5 5.3 Fulton Caroga 50.6 24.5 24.4 17.1 11.9 9.1 Fulton Ephratah 45.0 20.7 19.4 12.9 8.5 6.1 Fulton Johnstown 44.2 20.6 18.8 12.4 8.1 5.8 Fulton Mayfield 45.6 21.7 20.1 13.5 8.9 6.5 Fulton Northampton 43.6 20.6 18.5 12.1 7.8 5.5 Fulton Oppenheim 44.6 20.3 19.0 12.6 8.2 5.9 Fulton Perth 42.3 19.6 17.3 11.2 7.1 4.9 Fulton Stratford 49.8 23.3 23.4 16.3 11.3 8.6 Genesee Alabama 35.0 14.6 11.4 6.5 3.5 2.1 Genesee Alexander 36.0 15.0 12.1 7.0 3.9 2.4 Genesee Batavia 35.0 14.5 11.4 6.5 3.5 2.1

Nitrogen Guidelines for Field Crops in New York. Second Release. June 22, 2003.
53
Appendix Table 3 (Continued). County
Township
Precipitation
N Leaching Index
PA
PW
Soil Hydrologic Group
------Inches------
A
B
C
D
Genesee Bergen 32.1 13.9 9.6 5.1 2.5 1.3 Genesee Bethany 35.9 15.0 12.0 7.0 3.9 2.4 Genesee Byron 33.0 14.4 10.2 5.5 2.8 1.5 Genesee Darien 36.9 16.1 13.0 7.7 4.4 2.7 Genesee Elba 33.5 14.5 10.5 5.8 3.0 1.7 Genesee Le Roy 33.7 14.4 10.6 5.8 3.0 1.7 Genesee Oakfield 34.7 14.5 11.2 6.3 3.4 2.0 Genesee Pavilion 35.6 15.2 11.9 6.9 3.8 2.3 Genesee Pembroke 35.4 14.7 11.6 6.7 3.6 2.2 Genesee Stafford 34.8 14.5 11.3 6.4 3.4 2.0 Greene Ashland 38.9 17.6 14.6 9.0 5.3 3.5 Greene Athens 39.2 17.8 14.8 9.1 5.5 3.6 Greene Cairo 38.6 17.6 14.4 8.8 5.2 3.4 Greene Catskill 40.8 18.8 16.1 10.2 6.3 4.3 Greene Coxsackie 38.8 16.9 14.3 8.8 5.2 3.4 Greene Durham 37.9 17.1 13.8 8.3 4.9 3.1 Greene Greenville 38.7 17.0 14.3 8.7 5.2 3.4 Greene Halcott 45.2 21.0 19.7 13.1 8.7 6.3 Greene Hunter 45.9 21.4 20.2 13.6 9.0 6.6 Greene Jewett 41.8 19.2 16.9 10.8 6.8 4.7 Greene Lexington 46.0 21.9 20.4 13.7 9.2 6.7 Greene New Baltimore 37.7 16.3 13.5 8.1 4.7 3.0 Greene Prattsville 37.0 16.3 13.0 7.7 4.4 2.8 Greene Windham 41.6 19.2 16.8 10.7 6.7 4.6 Hamilton Arietta 55.3 27.4 28.5 20.7 15.0 11.9 Hamilton Benson 51.6 25.7 25.5 18.0 12.7 9.8 Hamilton Hope 47.2 22.9 21.5 14.7 9.9 7.3 Hamilton Indian Lake 43.7 20.3 18.4 12.1 7.8 5.6 Hamilton Inlet 50.1 24.1 23.9 16.7 11.6 8.9 Hamilton Lake Pleasant 52.4 25.8 26.0 18.5 13.2 10.2 Hamilton Long Lake 46.1 21.1 20.2 13.6 9.1 6.6 Hamilton Morehouse 54.7 27.1 28.0 20.3 14.7 11.5 Hamilton Wells 48.7 23.7 22.8 15.7 10.8 8.1 Herkimer Columbia 42.9 18.7 17.5 11.3 7.2 5.1 Herkimer Danube 41.3 18.7 16.4 10.5 6.5 4.5 Herkimer Fairfield 44.0 19.7 18.4 12.1 7.9 5.6 Herkimer Frankfort 43.0 18.8 17.5 11.4 7.3 5.1

Nitrogen Guidelines for Field Crops in New York. Second Release. June 22, 2003.
54
Appendix Table 3 (Continued). County
Township
Precipitation
N Leaching Index
PA
PW
Soil Hydrologic Group
------Inches------
A
B
C
D
Herkimer German Flatts 42.5 19.0 17.2 11.1 7.1 4.9 Herkimer Herkimer 42.4 19.1 17.2 11.1 7.0 4.9 Herkimer Litchfield 42.8 18.9 17.4 11.3 7.2 5.0 Herkimer Little Falls 42.0 19.0 17.0 10.9 6.9 4.8 Herkimer Manheim 42.5 19.5 17.4 11.2 7.1 5.0 Herkimer Newport 46.3 21.3 20.4 13.8 9.2 6.8 Herkimer Norway 49.8 23.1 23.3 16.3 11.3 8.6 Herkimer Ohio 53.0 25.9 26.5 18.9 13.5 10.5 Herkimer Russia 51.5 24.5 24.9 17.6 12.4 9.5 Herkimer Salisbury 49.5 22.9 23.1 16.1 11.1 8.4 Herkimer Schuyler 44.7 20.1 19.0 12.6 8.2 5.9 Herkimer Stark 42.6 19.0 17.3 11.2 7.1 5.0 Herkimer Warren 43.0 19.0 17.6 11.4 7.3 5.1 Herkimer Webb 48.4 22.9 22.3 15.4 10.5 7.9 Herkimer Winfield 41.4 18.5 16.4 10.5 6.5 4.5 Jefferson Adams 38.2 19.0 14.5 8.8 5.2 3.3 Jefferson Alexandria 37.0 17.3 13.3 7.9 4.5 2.8 Jefferson Antwerp 37.5 17.1 13.6 8.1 4.7 3.0 Jefferson Brownville 33.3 16.3 10.8 5.9 3.0 1.7 Jefferson Cape Vincent 35.0 17.4 12.1 6.9 3.7 2.2 Jefferson Champion 43.9 21.9 19.0 12.5 8.1 5.8 Jefferson Clayton 35.3 17.3 12.3 7.1 3.8 2.3 Jefferson Ellisburg 39.9 20.3 16.0 10.0 6.0 4.0 Jefferson Henderson 36.3 17.9 13.0 7.6 4.2 2.6 Jefferson Hounsfield 33.4 16.5 10.9 6.0 3.1 1.7 Jefferson Le Ray 38.6 19.0 14.8 9.0 5.3 3.5 Jefferson Lorraine 48.0 24.8 22.7 15.6 10.6 7.9 Jefferson Lyme 34.1 16.9 11.4 6.4 3.3 1.9 Jefferson Orleans 36.2 17.5 12.8 7.5 4.2 2.6 Jefferson Pamelia 36.0 17.7 12.8 7.5 4.1 2.5 Jefferson Philadelphia 38.8 18.4 14.7 9.0 5.4 3.5 Jefferson Rodman 46.6 23.8 21.4 14.5 9.7 7.1 Jefferson Rutland 45.4 23.0 20.4 13.6 9.0 6.6 Jefferson Theresa 37.9 17.8 14.0 8.5 4.9 3.2 Jefferson Watertown 40.7 20.3 16.5 10.4 6.4 4.4 Jefferson Wilna 39.1 18.3 14.9 9.2 5.5 3.6 Jefferson Worth 54.6 29.0 28.6 20.7 15.0 11.8

Nitrogen Guidelines for Field Crops in New York. Second Release. June 22, 2003.
55
Appendix Table 3 (Continued). County
Township
Precipitation
N Leaching Index
PA
PW
Soil Hydrologic Group
------Inches------
A
B
C
D
Lewis Croghan 40.8 19.1 16.2 10.2 6.3 4.3 Lewis Denmark 43.4 21.3 18.6 12.1 7.8 5.5 Lewis Diana 39.7 18.4 15.3 9.5 5.8 3.8 Lewis Greig 47.4 22.9 21.6 14.8 10.0 7.4 Lewis Harrisburg 53.9 28.1 27.9 20.0 14.4 11.3 Lewis Lewis 55.7 28.2 29.1 21.2 15.5 12.2 Lewis Leyden 53.2 26.8 26.9 19.3 13.8 10.7 Lewis Lowville 43.4 21.4 18.6 12.1 7.8 5.5 Lewis Lyonsdale 49.4 24.2 23.5 16.3 11.3 8.5 Lewis Martinsburg 53.9 27.6 27.7 19.9 14.3 11.2 Lewis Montague 59.5 32.1 33.2 24.7 18.5 14.9 Lewis New Bremen 40.4 19.1 15.9 10.0 6.1 4.1 Lewis Osceola 55.7 28.7 29.3 21.3 15.5 12.3 Lewis Pickney 53.8 28.3 27.8 20.0 14.4 11.2 Lewis Turin 50.0 24.4 23.9 16.7 11.6 8.8 Lewis Watson 44.7 21.3 19.4 12.9 8.4 6.1 Lewis West Turin 55.2 27.0 28.4 20.6 15.0 11.8 Livingston Avon 31.1 12.5 8.7 4.5 2.1 1.0 Livingston Caledonia 31.6 13.2 9.1 4.8 2.3 1.1 Livingston Conesus 34.2 13.8 10.7 6.0 3.2 1.8 Livingston Geneseo 31.5 12.8 9.0 4.7 2.2 1.1 Livingston Groveland 31.4 12.6 8.8 4.6 2.2 1.1 Livingston Leicester 30.4 12.3 8.3 4.2 1.9 0.9 Livingston Lima 32.3 13.1 9.5 5.0 2.5 1.3 Livingston Livonia 33.1 13.4 10.0 5.5 2.8 1.5 Livingston Mount Morris 31.2 12.7 8.8 4.5 2.1 1.0 Livingston N. Dansville 32.5 12.8 9.5 5.1 2.5 1.3 Livingston Nunda 35.0 14.5 11.4 6.5 3.5 2.1 Livingston Ossian 34.4 14.0 10.9 6.2 3.3 1.9 Livingston Portage 34.7 14.5 11.2 6.4 3.4 2.0 Livingston Sparta 33.3 13.3 10.1 5.5 2.8 1.5 Livingston Springwater 34.9 13.6 11.1 6.3 3.4 2.0 Livingston West Sparta 32.6 13.1 9.6 5.2 2.6 1.4 Livingston York 32.2 13.5 9.5 5.1 2.5 1.3 Madison Brookfield 40.6 17.8 15.7 9.9 6.1 4.1 Madison Cazenovia 41.7 19.0 16.7 10.7 6.7 4.6 Madison De Ruyter 41.0 17.8 15.9 10.1 6.3 4.3

Nitrogen Guidelines for Field Crops in New York. Second Release. June 22, 2003.
56
Appendix Table 3 (Continued). County
Township
Precipitation
N Leaching Index
PA
PW
Soil Hydrologic Group
------Inches------
A
B
C
D
Madison Eaton 39.4 17.6 14.9 9.2 5.6 3.7 Madison Fenner 43.2 19.6 17.9 11.6 7.5 5.3 Madison Georgetown 41.0 18.1 16.0 10.2 6.3 4.3 Madison Hamilton 39.1 17.4 14.6 9.0 5.4 3.5 Madison Lebanon 39.6 17.5 15.0 9.3 5.6 3.7 Madison Lenox 41.0 18.1 16.0 10.2 6.3 4.3 Madison Lincoln 41.8 19.3 16.9 10.8 6.8 4.7 Madison Madison 40.4 17.7 15.6 9.8 6.0 4.1 Madison Nelson 41.4 18.6 16.4 10.5 6.5 4.5 Madison Oneida 41.3 19.0 16.5 10.5 6.5 4.5 Madison Smithfield 41.5 18.6 16.5 10.5 6.6 4.5 Madison Stockbridge 40.7 18.2 15.9 10.0 6.2 4.2 Madison Sullivan 41.0 18.4 16.1 10.2 6.3 4.3 Monroe Brighton 32.9 15.0 10.3 5.6 2.8 1.5 Monroe Chili 31.1 14.0 9.0 4.6 2.1 1.0 Monroe Clarkson 30.2 12.4 8.2 4.1 1.8 0.8 Monroe E.Rochester 33.0 14.5 10.2 5.6 2.8 1.5 Monroe Gates 31.1 14.4 9.1 4.7 2.2 1.1 Monroe Greece 32.0 14.5 9.6 5.1 2.5 1.3 Monroe Hamlin 31.0 13.8 8.9 4.6 2.1 1.0 Monroe Henrietta 32.1 14.1 9.6 5.1 2.5 1.3 Monroe Irondequoit 33.0 15.5 10.4 5.7 2.9 1.6 Monroe Mendon 31.7 13.7 9.3 4.9 2.3 1.2 Monroe Ogden 31.0 13.6 8.9 4.5 2.1 1.0 Monroe Parma 31.1 13.8 8.9 4.6 2.1 1.0 Monroe Penfield 33.3 15.1 10.5 5.8 2.9 1.6 Monroe Perinton 33.0 14.5 10.2 5.6 2.8 1.5 Monroe Pittsford 33.0 14.5 10.2 5.6 2.8 1.5 Monroe Riga 31.3 13.6 9.0 4.7 2.2 1.1 Monroe Rush 31.0 13.1 8.8 4.5 2.1 1.0 Monroe Sweden 30.9 13.1 8.7 4.4 2.0 1.0 Monroe Webster 34.5 16.1 11.5 6.5 3.4 2.0 Monroe Wheatland 31.5 13.5 9.1 4.8 2.2 1.1 Montgomery Amsterdam 40.0 18.7 15.6 9.7 5.9 4.0 Montgomery Canajoharie 41.0 18.4 16.1 10.2 6.3 4.3 Montgomery Charleston 43.1 19.7 17.8 11.6 7.4 5.2 Montgomery Florida 40.1 18.7 15.7 9.8 6.0 4.0

Nitrogen Guidelines for Field Crops in New York. Second Release. June 22, 2003.
57
Appendix Table 3 (Continued). County
Township
Precipitation
N Leaching Index
PA
PW
Soil Hydrologic Group
------Inches------
A
B
C
D
Montgomery Glen 40.0 18.6 15.5 9.7 5.9 4.0 Montgomery Minden 41.1 18.5 16.2 10.3 6.4 4.4 Montgomery Mohawk 39.8 18.5 15.4 9.6 5.8 3.9 Montgomery Palatine 41.3 18.8 16.5 10.5 6.5 4.5 Montgomery Root 40.9 18.7 16.1 10.2 6.3 4.3 Montgomery St Johnsville 42.5 19.5 17.4 11.3 7.2 5.0 Nassau Glen Cove 45.4 21.7 20.0 13.4 8.8 6.4 Nassau Hempstead 44.2 21.3 19.0 12.5 8.2 5.8 Nassau Long Beach 43.0 21.0 18.2 11.8 7.6 5.3 Nassau N Hempstead 45.0 21.7 19.7 13.1 8.6 6.2 Nassau Oyster Bay 45.1 21.8 19.8 13.2 8.7 6.3 Niagara Cambria 35.4 16.1 12.0 6.9 3.8 2.3 Niagara Hartland 34.8 15.8 11.6 6.6 3.5 2.1 Niagara Lewiston 34.4 15.4 11.2 6.3 3.3 1.9 Niagara Lockport 36.7 16.9 13.0 7.7 4.4 2.7 Niagara Newfane 33.3 14.9 10.5 5.7 2.9 1.6 Niagara Niagara 37.0 16.9 13.2 7.8 4.5 2.8 Niagara Pendleton 37.0 17.0 13.2 7.9 4.5 2.8 Niagara Porter 32.1 14.4 9.7 5.1 2.5 1.3 Niagara Royalton 36.5 16.3 12.8 7.5 4.2 2.6 Niagara Somerset 33.2 14.6 10.3 5.6 2.9 1.6 Niagara Wheatfield 37.0 17.0 13.2 7.9 4.5 2.8 Niagara Wilson 31.6 13.9 9.3 4.9 2.3 1.2 Oneida Annsville 49.7 24.4 23.7 16.5 11.4 8.7 Oneida Augusta 42.0 18.8 16.9 10.8 6.8 4.7 Oneida Ava 57.7 29.9 31.1 22.9 16.9 13.5 Oneida Boonville 56.0 28.9 29.6 21.6 15.7 12.5 Oneida Bridgewater 42.2 18.5 16.9 10.9 6.9 4.8 Oneida Camden 48.7 24.0 22.9 15.8 10.9 8.2 Oneida Deerfield 47.4 22.2 21.5 14.6 9.9 7.3 Oneida Florence 52.9 27.2 26.8 19.2 13.7 10.6 Oneida Floyd 46.8 22.4 21.1 14.3 9.6 7.1 Oneida Forestport 53.8 26.9 27.3 19.6 14.1 11.0 Oneida Kirkland 43.1 20.2 18.0 11.7 7.5 5.3 Oneida Lee 49.0 23.9 23.1 16.0 11.0 8.3 Oneida Marcy 45.3 21.2 19.7 13.2 8.7 6.3 Oneida Marshall 42.7 19.3 17.5 11.3 7.2 5.1

Nitrogen Guidelines for Field Crops in New York. Second Release. June 22, 2003.
58
Appendix Table 3 (Continued). County
Township
Precipitation
N Leaching Index
PA
PW
Soil Hydrologic Group
------Inches------
A
B
C
D
Oneida New Hartford 43.0 20.0 17.9 11.6 7.4 5.2 Oneida Paris 43.0 19.5 17.7 11.5 7.4 5.2 Oneida Remsen 52.9 25.6 26.3 18.8 13.4 10.4 Oneida Rome 44.5 21.1 19.2 12.7 8.3 6.0 Oneida Sangerfield 41.9 18.4 16.7 10.7 6.7 4.7 Oneida Steuben 54.7 27.3 28.1 20.3 14.7 11.5 Oneida Trenton 47.7 22.4 21.7 14.9 10.1 7.5 Oneida Utica 43.0 19.4 17.7 11.5 7.4 5.2 Oneida Vernon 43.1 20.2 18.0 11.7 7.5 5.3 Oneida Verona 42.5 19.4 17.4 11.2 7.1 5.0 Oneida Vienna 43.7 20.4 18.5 12.1 7.8 5.6 Oneida Western 51.9 25.9 25.7 18.2 12.9 10.0 Oneida Westmoreland 44.7 20.8 19.2 12.8 8.4 6.0 Oneida Whitestown 43.8 20.7 18.6 12.2 7.9 5.6 Onondaga Camillus 39.0 17.9 14.7 9.1 5.4 3.5 Onondaga Cicero 40.9 18.5 16.1 10.2 6.3 4.3 Onondaga Clay 41.2 19.5 16.6 10.5 6.5 4.5 Onondaga Dewitt 40.4 17.8 15.6 9.8 6.0 4.1 Onondaga Elbridge 38.4 17.4 14.2 8.6 5.1 3.3 Onondaga Fabius 41.0 17.8 15.9 10.1 6.3 4.3 Onondaga Geddes 39.3 18.1 15.0 9.2 5.5 3.7 Onondaga Lafayette 40.0 17.6 15.3 9.5 5.8 3.9 Onondaga Lysander 40.2 19.0 15.8 9.9 6.0 4.1 Onondaga Manilus 41.0 18.3 16.1 10.2 6.3 4.3 Onondaga Marcellus 39.0 17.9 14.7 9.0 5.4 3.5 Onondaga Onondaga 39.6 17.7 15.1 9.4 5.6 3.8 Onondaga Otisco 39.1 17.6 14.7 9.1 5.4 3.6 Onondaga Pompey 41.0 18.2 16.1 10.2 6.3 4.3 Onondaga Salina 39.4 17.8 15.0 9.3 5.6 3.7 Onondaga Skaneateles 39.0 17.8 14.7 9.0 5.4 3.5 Onondaga Spafford 39.3 17.9 14.9 9.2 5.5 3.7 Onondaga Tully 40.0 17.5 15.3 9.5 5.8 3.9 Onondaga Van Buren 39.7 18.5 15.3 9.5 5.8 3.8 Ontario Bristol 34.3 14.3 10.9 6.1 3.2 1.9 Ontario Canadice 34.7 13.9 11.0 6.3 3.3 2.0 Ontario Canandaigua 33.1 13.7 10.1 5.5 2.8 1.5 Ontario E. Bloomfield 33.0 13.5 10.0 5.4 2.7 1.5

Nitrogen Guidelines for Field Crops in New York. Second Release. June 22, 2003.
59
Appendix Table 3 (Continued). County
Township
Precipitation
N Leaching Index
PA
PW
Soil Hydrologic Group
------Inches------
A
B
C
D
Ontario Farmington 33.0 14.3 10.2 5.5 2.8 1.5 Ontario Geneva 33.0 13.9 10.1 5.5 2.8 1.5 Ontario Gorham 33.0 13.9 10.1 5.5 2.8 1.5 Ontario Hopewell 33.0 14.1 10.1 5.5 2.8 1.5 Ontario Manchester 33.3 14.8 10.5 5.7 2.9 1.6 Ontario Naples 33.5 13.1 10.2 5.6 2.9 1.6 Ontario Phelps 33.2 14.6 10.3 5.7 2.9 1.6 Ontario Richmond 33.3 13.5 10.1 5.6 2.8 1.6 Ontario Seneca 33.0 14.4 10.2 5.5 2.8 1.5 Ontario South Bristol 34.5 14.0 11.0 6.2 3.3 1.9 Ontario Victor 33.0 14.1 10.1 5.5 2.8 1.5 Ontario W. Bloomfield 32.8 13.5 9.8 5.3 2.7 1.4 Orange Blooming Grove 45.6 21.1 19.9 13.3 8.8 6.4 Orange Chester 45.6 20.8 19.8 13.3 8.8 6.4 Orange Cornwall 47.1 22.1 21.3 14.5 9.8 7.2 Orange Crawford 43.3 19.6 18.0 11.7 7.5 5.3 Orange Deerpark 44.4 20.1 18.8 12.5 8.1 5.8 Orange Goshen 43.1 19.2 17.7 11.5 7.4 5.2 Orange Greenville 43.5 19.6 18.1 11.8 7.6 5.4 Orange Hamptonburgh 43.1 19.3 17.8 11.6 7.4 5.2 Orange Highlands 48.6 22.7 22.4 15.5 10.6 8.0 Orange Minisink 43.0 19.4 17.7 11.5 7.4 5.2 Orange Monroe 47.9 22.2 21.8 15.0 10.2 7.6 Orange Montgomery 43.1 19.7 17.9 11.7 7.5 5.3 Orange Mount Hope 43.0 19.1 17.6 11.5 7.3 5.2 Orange New Windsor 44.5 20.5 19.0 12.6 8.2 5.9 Orange Newburgh 44.1 20.0 18.6 12.2 7.9 5.7 Orange Tuxedo 49.6 23.3 23.3 16.2 11.2 8.5 Orange Wallkill 43.0 19.0 17.6 11.4 7.3 5.2 Orange Warwick 46.8 21.6 20.9 14.2 9.5 7.0 Orange Wawayanda 43.0 19.0 17.6 11.4 7.3 5.2 Orange Woodbury 48.6 22.6 22.4 15.5 10.6 8.0 Orleans Albion 32.8 14.5 10.1 5.5 2.7 1.5 Orleans Barre 33.3 14.5 10.4 5.7 2.9 1.6 Orleans Carlton 32.5 14.5 9.9 5.3 2.6 1.4 Orleans Clarendon 31.5 13.7 9.2 4.8 2.3 1.1 Orleans Gaines 32.3 14.5 9.8 5.2 2.6 1.3

Nitrogen Guidelines for Field Crops in New York. Second Release. June 22, 2003.
60
Appendix Table 3 (Continued). County
Township
Precipitation
N Leaching Index
PA
PW
Soil Hydrologic Group
------Inches------
A
B
C
D
Orleans Kendall 31.0 14.2 9.0 4.6 2.1 1.0 Orleans Murray 31.0 13.2 8.8 4.5 2.1 1.0 Orleans Ridgeway 34.4 15.2 11.2 6.3 3.3 1.9 Orleans Shelby 35.0 15.3 11.6 6.6 3.6 2.1 Orleans Yates 33.1 14.6 10.3 5.6 2.8 1.6 Oswego Albion 46.0 23.4 20.9 14.1 9.4 6.9 Oswego Amboy 47.8 23.9 22.2 15.2 10.4 7.7 Oswego Boylston 52.7 27.9 26.9 19.2 13.7 10.6 Oswego Constantia 43.4 20.9 18.4 12.0 7.7 5.5 Oswego Granby 40.7 19.8 16.4 10.3 6.4 4.3 Oswego Hannibal 39.6 19.6 15.5 9.6 5.8 3.9 Oswego Hastings 43.3 21.2 18.4 12.0 7.7 5.5 Oswego Mexico 42.4 20.8 17.8 11.5 7.3 5.1 Oswego Minetto 41.0 20.6 16.7 10.6 6.6 4.5 Oswego New Haven 41.2 20.6 16.9 10.7 6.7 4.6 Oswego Orwell 51.1 27.0 25.5 18.0 12.6 9.7 Oswego Oswego 41.0 20.6 16.8 10.6 6.6 4.5 Oswego Palermo 43.0 20.8 18.1 11.8 7.5 5.3 Oswego Parish 45.7 22.9 20.5 13.8 9.1 6.7 Oswego Redfield 53.2 27.9 27.3 19.5 14.0 10.8 Oswego Richland 41.8 20.8 17.3 11.1 6.9 4.8 Oswego Sandy Creek 41.8 21.2 17.5 11.2 7.0 4.9 Oswego Schroeppel 42.2 20.4 17.5 11.2 7.1 4.9 Oswego Scriba 41.0 20.9 16.8 10.7 6.6 4.5 Oswego Volney 41.2 20.5 16.8 10.7 6.6 4.5 Oswego West Monroe 43.6 21.3 18.6 12.2 7.9 5.6 Oswego Williamstown 49.6 25.5 24.0 16.7 11.6 8.7 Otsego Burlington 41.0 18.0 16.0 10.1 6.3 4.3 Otsego Butternuts 39.5 17.4 14.9 9.2 5.5 3.7 Otsego Cherry Valley 43.5 19.8 18.2 11.9 7.7 5.4 Otsego Decatur 43.0 19.4 17.7 11.5 7.4 5.2 Otsego Edmeston 39.7 17.6 15.1 9.4 5.7 3.8 Otsego Exeter 41.9 18.5 16.7 10.7 6.7 4.7 Otsego Hartwick 40.0 17.8 15.3 9.6 5.8 3.9 Otsego Laurens 39.8 17.5 15.1 9.4 5.7 3.8 Otsego Maryland 39.6 17.2 14.9 9.2 5.6 3.7 Otsego Middlefield 40.9 18.2 16.0 10.1 6.3 4.3

Nitrogen Guidelines for Field Crops in New York. Second Release. June 22, 2003.
61
Appendix Table 3 (Continued). County
Township
Precipitation
N Leaching Index
PA
PW
Soil Hydrologic Group
------Inches------
A
B
C
D
Otsego Milford 39.2 17.3 14.7 9.1 5.4 3.6 Otsego Morris 39.8 17.5 15.1 9.4 5.7 3.8 Otsego New Lisbon 40.8 17.8 15.8 10.0 6.2 4.2 Otsego Oneonta 39.3 17.3 14.8 9.1 5.5 3.6 Otsego Otego 40.2 17.5 15.3 9.6 5.9 3.9 Otsego Otsego 40.8 18.2 15.9 10.1 6.2 4.2 Otsego Pittsield 40.2 17.7 15.4 9.6 5.9 4.0 Otsego Plainfield 41.6 18.3 16.5 10.5 6.6 4.5 Otsego Richfield 42.7 18.7 17.3 11.2 7.1 5.0 Otsego Roseboom 43.5 19.6 18.1 11.8 7.6 5.4 Otsego Springfield 42.5 18.7 17.2 11.1 7.0 4.9 Otsego Unadilla 39.3 17.3 14.8 9.1 5.5 3.6 Otsego Westford 41.7 18.5 16.6 10.6 6.6 4.6 Otsego Worcester 40.2 17.6 15.4 9.6 5.9 4.0 Putnam Carmel 48.8 23.3 22.8 15.7 10.8 8.1 Putnam Kent 47.3 22.1 21.3 14.5 9.8 7.3 Putnam Patterson 47.3 22.1 21.3 14.5 9.8 7.3 Putnam Philipstown 47.8 22.1 21.7 14.9 10.1 7.5 Putnam Putnam Valley 48.7 23.2 22.7 15.6 10.7 8.1 Putnam Southeast 48.9 23.3 22.8 15.8 10.9 8.2 Rensselaer Berlin 45.3 20.1 19.4 13.0 8.6 6.2 Rensselaer Brunswick 38.8 16.6 14.2 8.7 5.2 3.4 Rensselaer East Greenbush 37.3 16.2 13.2 7.9 4.5 2.9 Rensselaer Grafton 45.0 19.3 19.0 12.6 8.3 6.0 Rensselaer Hoosick 37.5 16.0 13.3 8.0 4.6 2.9 Rensselaer Nassau 40.7 18.0 15.9 10.0 6.2 4.2 Rensselaer No. Greenbush 37.5 16.2 13.3 8.0 4.6 2.9 Rensselaer Petersburg 42.4 18.3 17.0 11.0 7.0 4.9 Rensselaer Pittstown 37.1 15.9 13.0 7.7 4.4 2.8 Rensselaer Poestenkill 42.5 18.3 17.0 11.0 7.0 4.9 Rensselaer Sand Lake 41.2 18.0 16.2 10.3 6.4 4.4 Rensselaer Schaghticoke 37.0 15.9 12.9 7.7 4.4 2.7 Rensselaer Schodack 38.1 16.3 13.7 8.3 4.9 3.1 Rensselaer Stephentown 42.3 18.7 17.1 11.0 7.0 4.9 Rockland Clarkstown 47.3 22.0 21.3 14.5 9.8 7.3 Rockland Haverstraw 48.9 22.7 22.6 15.6 10.8 8.1 Rockland Orangetown 47.8 22.5 21.9 15.0 10.2 7.6

Nitrogen Guidelines for Field Crops in New York. Second Release. June 22, 2003.
62
Appendix Table 3 (Continued). County
Township
Precipitation
N Leaching Index
PA
PW
Soil Hydrologic Group
------Inches------
A
B
C
D
Rockland Ramapo 49.3 22.4 22.8 15.8 10.9 8.2 Rockland Stoney Point 48.3 22.4 22.1 15.2 10.4 7.8 Saratoga Ballston 39.6 18.4 15.2 9.4 5.7 3.8 Saratoga Charlton 41.4 19.1 16.6 10.6 6.6 4.5 Saratoga Clifton Park 36.8 16.2 12.9 7.6 4.3 2.7 Saratoga Corinth 44.4 21.1 19.1 12.6 8.2 5.9 Saratoga Day 46.3 22.6 20.8 14.1 9.4 6.9 Saratoga Edinburg 46.1 22.5 20.7 13.9 9.3 6.8 Saratoga Galway 43.1 20.3 18.0 11.7 7.5 5.3 Saratoga Greenfield 43.1 20.1 18.0 11.7 7.5 5.3 Saratoga Hadley 43.3 20.7 18.3 11.9 7.7 5.4 Saratoga Halfmoon 37.0 16.0 12.9 7.7 4.4 2.7 Saratoga Malta 39.5 18.4 15.2 9.4 5.6 3.8 Saratoga Milton 41.3 19.0 16.5 10.5 6.5 4.5 Saratoga Moreau 38.0 17.3 14.0 8.4 4.9 3.2 Saratoga Northumberland 37.9 17.3 13.9 8.4 4.9 3.1 Saratoga Providence 45.6 21.9 20.2 13.5 8.9 6.5 Saratoga Saratoga 38.6 17.9 14.5 8.8 5.2 3.4 Saratoga Saratoga Sprgs 40.6 18.7 16.0 10.1 6.2 4.2 Saratoga Stillwater 38.4 17.5 14.3 8.7 5.1 3.3 Saratoga Waterford 37.0 15.5 12.8 7.6 4.3 2.7 Saratoga Wilton 39.6 18.5 15.3 9.5 5.7 3.8 Schenectady Duanesburg 42.3 19.5 17.3 11.2 7.1 4.9 Schenectady Glenville 39.5 18.2 15.1 9.4 5.6 3.8 Schenectady Niskayuna 36.9 16.1 12.9 7.6 4.3 2.7 Schenectady Princetown 41.7 19.4 16.9 10.8 6.8 4.7 Schenectady Rotterdam 38.9 17.7 14.6 9.0 5.3 3.5 Schenectady Schenectady 37.0 16.1 13.0 7.7 4.4 2.8 Schoharie Blenheim 37.5 16.4 13.4 8.0 4.6 2.9 Schoharie Broome 38.4 16.9 14.1 8.6 5.1 3.3 Schoharie Carlisle 41.0 18.5 16.2 10.2 6.3 4.3 Schoharie Cobleskill 40.7 18.4 15.9 10.0 6.2 4.2 Schoharie Conesville 37.3 16.3 13.2 7.9 4.5 2.9 Schoharie Esperance 40.4 18.5 15.8 9.9 6.1 4.1 Schoharie Fulton 38.0 16.9 13.9 8.4 4.9 3.1 Schoharie Gilboa 37.2 16.2 13.1 7.8 4.5 2.8 Schoharie Jefferson 39.0 17.1 14.5 8.9 5.3 3.5

Nitrogen Guidelines for Field Crops in New York. Second Release. June 22, 2003.
63
Appendix Table 3 (Continued). County
Township
Precipitation
N Leaching Index
PA
PW
Soil Hydrologic Group
------Inches------
A
B
C
D
Schoharie Middleburg 38.8 17.5 14.5 8.9 5.3 3.5 Schoharie Richmondville 39.9 18.0 15.3 9.5 5.8 3.9 Schoharie Schoharie 39.5 18.1 15.1 9.3 5.6 3.7 Schoharie Seward 41.6 18.5 16.6 10.6 6.6 4.6 Schoharie Sharon 42.4 18.6 17.1 11.0 7.0 4.9 Schoharie Summit 39.8 17.7 15.2 9.5 5.7 3.8 Schoharie Wright 39.9 18.3 15.4 9.6 5.8 3.9 Schuyler Catherine 37.2 16.4 13.2 7.8 4.5 2.8 Schuyler Cayuta 37.3 16.6 13.3 7.9 4.6 2.9 Schuyler Dix 33.9 13.8 10.6 5.9 3.1 1.7 Schuyler Hector 35.9 15.1 12.1 7.0 3.9 2.4 Schuyler Montour 33.5 13.9 10.4 5.7 2.9 1.6 Schuyler Orange 33.8 13.8 10.5 5.8 3.0 1.7 Schuyler Reading 33.9 13.6 10.5 5.9 3.0 1.7 Schuyler Tyrone 33.6 13.7 10.4 5.7 2.9 1.7 Seneca Covert 34.7 14.5 11.2 6.4 3.4 2.0 Seneca Fayette 33.0 13.9 10.1 5.5 2.8 1.5 Seneca Junius 33.9 14.8 10.8 6.0 3.1 1.8 Seneca Lodi 34.4 14.2 11.0 6.2 3.3 1.9 Seneca Ovid 33.9 14.3 10.7 6.0 3.1 1.8 Seneca Romulus 33.1 14.0 10.1 5.5 2.8 1.5 Seneca Seneca Falls 33.1 14.4 10.2 5.6 2.8 1.5 Seneca Tyre 34.7 15.1 11.3 6.4 3.4 2.0 Seneca Varick 33.0 14.0 10.1 5.5 2.8 1.5 Seneca Waterloo 33.0 13.6 10.0 5.4 2.7 1.5 St Lawrence Brasher 35.0 15.1 11.5 6.6 3.5 2.1 St Lawrence Canton 35.8 15.2 12.1 7.0 3.9 2.4 St Lawrence Clare 40.6 17.9 15.7 9.9 6.1 4.1 St Lawrence Clifton 43.2 18.7 17.6 11.5 7.4 5.2 St Lawrence Colton 42.0 18.6 16.8 10.8 6.8 4.7 St Lawrence De Peyster 35.7 16.0 12.2 7.0 3.9 2.3 St Lawrence Dekalb 36.8 16.5 13.0 7.7 4.4 2.7 St Lawrence Edwards 39.0 17.1 14.5 8.9 5.3 3.5 St Lawrence Fine 42.5 19.1 17.3 11.2 7.1 5.0 St Lawrence Fowler 37.8 17.0 13.7 8.3 4.8 3.1 St Lawrence Gouverneur 37.0 17.0 13.2 7.9 4.5 2.8 St Lawrence Hammond 37.0 17.0 13.2 7.9 4.5 2.8

Nitrogen Guidelines for Field Crops in New York. Second Release. June 22, 2003.
64
Appendix Table 3 (Continued). County
Township
Precipitation
N Leaching Index
PA
PW
Soil Hydrologic Group
------Inches------
A
B
C
D
St Lawrence Hermon 37.2 17.0 13.3 8.0 4.5 2.9 St Lawrence Hopkinton 40.2 17.4 15.3 9.6 5.9 3.9 St Lawrence Lawrence 35.4 15.0 11.7 6.8 3.7 2.2 St Lawrence Lisbon 33.9 14.7 10.8 6.0 3.1 1.8 St Lawrence Louisville 35.0 15.2 11.6 6.6 3.6 2.1 St Lawrence Macomb 37.0 16.9 13.2 7.8 4.5 2.8 St Lawrence Madrid 35.3 15.0 11.7 6.7 3.6 2.2 St Lawrence Massena 35.0 15.6 11.7 6.7 3.6 2.1 St Lawrence Morristown 35.9 16.3 12.4 7.2 4.0 2.4 St Lawrence Norfolk 35.4 15.2 11.8 6.8 3.7 2.2 St Lawrence Ogdensburg 33.0 14.0 10.1 5.5 2.8 1.5 St Lawrence Oswegathcie 34.5 15.3 11.3 6.4 3.4 2.0 St Lawrence Parishville 40.2 17.7 15.5 9.7 5.9 4.0 St Lawrence Piercefield 41.9 18.2 16.6 10.7 6.7 4.6 St Lawrence Pierrepont 38.9 17.2 14.5 8.9 5.3 3.5 St Lawrence Pitcairn 39.5 18.0 15.1 9.3 5.6 3.7 St Lawrence Potsdam 37.0 15.8 12.9 7.7 4.4 2.7 St Lawrence Rossie 37.0 17.0 13.2 7.9 4.5 2.8 St Lawrence Russell 38.2 16.9 14.0 8.5 5.0 3.2 St Lawrence Stockholm 36.1 15.6 12.3 7.2 4.0 2.5 St Lawrence Waddington 35.0 15.0 11.5 6.6 3.5 2.1 Steuben Addison 31.9 13.5 9.3 4.9 2.4 1.2 Steuben Avoca 32.6 13.3 9.7 5.2 2.6 1.4 Steuben Bath 31.2 13.3 8.9 4.6 2.1 1.1 Steuben Bradford 32.8 13.4 9.8 5.3 2.6 1.4 Steuben Cameron 32.3 13.5 9.5 5.1 2.5 1.3 Steuben Campbell 31.6 13.5 9.2 4.8 2.3 1.2 Steuben Canisteo 33.7 13.6 10.4 5.8 3.0 1.7 Steuben Caton 32.9 13.6 9.9 5.4 2.7 1.5 Steuben Cohocton 33.7 13.2 10.3 5.7 2.9 1.6 Steuben Corning 32.5 13.5 9.7 5.2 2.6 1.4 Steuben Dansville 33.7 13.5 10.4 5.8 3.0 1.7 Steuben Erwin 31.0 13.5 8.8 4.5 2.1 1.0 Steuben Fremont 34.1 13.7 10.6 6.0 3.1 1.8 Steuben Greenwood 37.4 15.9 13.2 7.9 4.5 2.9 Steuben Hartsville 36.1 15.2 12.2 7.2 4.0 2.4 Steuben Hornby 33.3 13.8 10.2 5.6 2.8 1.6

Nitrogen Guidelines for Field Crops in New York. Second Release. June 22, 2003.
65
Appendix Table 3 (Continued). County
Township
Precipitation
N Leaching Index
PA
PW
Soil Hydrologic Group
------Inches------
A
B
C
D
Steuben Hornellsville 33.3 13.6 10.2 5.6 2.8 1.6 Steuben Howard 33.7 13.5 10.3 5.7 2.9 1.7 Steuben Jasper 34.0 14.1 10.7 5.9 3.1 1.8 Steuben Lindley 31.3 13.5 9.0 4.7 2.2 1.1 Steuben Prattsburg 34.7 13.5 10.9 6.2 3.3 1.9 Steuben Pulteney 32.7 13.1 9.7 5.2 2.6 1.4 Steuben Rathbone 31.0 13.5 8.9 4.6 2.1 1.0 Steuben Thurston 31.9 13.5 9.3 4.9 2.4 1.2 Steuben Troupsburg 33.4 14.0 10.3 5.7 2.9 1.6 Steuben Tuscarora 32.5 13.5 9.7 5.2 2.6 1.4 Steuben Urbana 31.3 13.0 8.9 4.6 2.2 1.1 Steuben Wayland 34.0 13.6 10.6 5.9 3.1 1.8 Steuben Wayne 32.0 13.0 9.3 4.9 2.4 1.2 Steuben West Union 37.3 16.0 13.1 7.9 4.5 2.8 Steuben Wheeler 33.0 13.2 9.9 5.4 2.7 1.5 Steuben Woodhull 31.7 13.5 9.2 4.8 2.3 1.2 Suffolk Babylon 45.0 22.0 19.8 13.2 8.7 6.3 Suffolk Brookhaven 46.1 23.8 21.1 14.2 9.4 6.9 Suffolk East Hampton 44.7 23.4 20.0 13.3 8.7 6.3 Suffolk Huntington 45.2 22.7 20.2 13.5 8.9 6.4 Suffolk Islip 46.2 23.4 21.1 14.2 9.5 7.0 Suffolk Riverhead 45.0 23.5 20.2 13.5 8.9 6.4 Suffolk Shelter Island 45.0 23.2 20.2 13.4 8.8 6.4 Suffolk Smithtown 45.2 23.5 20.3 13.6 8.9 6.5 Suffolk Southampton 45.0 23.6 20.3 13.5 8.9 6.4 Suffolk Southold 45.2 23.5 20.3 13.6 8.9 6.5 Sullivan Bethel 44.1 19.9 18.5 12.2 7.9 5.7 Sullivan Callicoon 46.0 21.1 20.2 13.6 9.1 6.6 Sullivan Cochecton 42.1 19.0 17.0 10.9 6.9 4.8 Sullivan Delaware 42.6 19.0 17.3 11.2 7.1 5.0 Sullivan Fallsburg 47.0 21.8 21.1 14.3 9.6 7.1 Sullivan Forestburgh 46.1 21.2 20.3 13.7 9.1 6.7 Sullivan Fremont 44.2 20.3 18.7 12.4 8.0 5.8 Sullivan Highland 42.6 19.1 17.3 11.2 7.1 5.0 Sullivan Liberty 47.9 22.0 21.7 14.9 10.1 7.5 Sullivan Lumberland 43.8 19.7 18.3 12.0 7.8 5.5 Sullivan Mamakating 45.2 20.8 19.6 13.0 8.6 6.2

Nitrogen Guidelines for Field Crops in New York. Second Release. June 22, 2003.
66
Appendix Table 3 (Continued). County
Township
Precipitation
N Leaching Index
PA
PW
Soil Hydrologic Group
------Inches------
A
B
C
D
Sullivan Neversink 48.5 22.2 22.2 15.3 10.5 7.9 Sullivan Rockland 46.3 21.0 20.3 13.7 9.2 6.7 Sullivan Thompson 46.5 21.4 20.6 13.9 9.3 6.9 Sullivan Tusten 41.4 19.0 16.6 10.6 6.6 4.5 Tioga Barton 36.3 16.1 12.6 7.4 4.1 2.5 Tioga Berkshire 37.1 16.5 13.1 7.8 4.5 2.8 Tioga Candor 37.1 16.5 13.2 7.9 4.5 2.8 Tioga Newark Valley 37.0 16.4 13.1 7.8 4.4 2.8 Tioga Nichols 35.0 15.0 11.5 6.6 3.5 2.1 Tioga Owego 36.2 15.9 12.5 7.3 4.1 2.5 Tioga Richford 38.8 17.3 14.4 8.8 5.2 3.4 Tioga Spencer 37.2 16.5 13.2 7.9 4.5 2.8 Tioga Tioga 36.0 15.9 12.3 7.2 4.0 2.4 Tompkins Caroline 38.2 16.9 14.0 8.5 5.0 3.2 Tompkins Danby 37.7 16.6 13.6 8.2 4.7 3.0 Tompkins Dryden 37.6 16.0 13.3 8.0 4.6 2.9 Tompkins Enfield 37.8 16.4 13.6 8.2 4.8 3.1 Tompkins Groton 38.0 16.5 13.7 8.3 4.8 3.1 Tompkins Ithaca 34.9 15.0 11.5 6.5 3.5 2.1 Tompkins Lansing 34.8 14.7 11.3 6.4 3.4 2.0 Tompkins Newfield 38.5 17.2 14.2 8.7 5.1 3.3 Tompkins Ulysses 34.9 14.7 11.4 6.5 3.5 2.0 Ulster Denning 53.1 25.3 26.3 18.8 13.4 10.4 Ulster Esopus 45.4 21.6 19.9 13.3 8.8 6.4 Ulster Gardiner 45.3 21.2 19.8 13.2 8.7 6.3 Ulster Hardenburgh 46.9 21.6 20.9 14.2 9.6 7.0 Ulster Hurley 47.0 22.1 21.1 14.4 9.7 7.1 Ulster Kingston 46.1 21.9 20.5 13.8 9.2 6.7 Ulster Lloyd 45.0 20.9 19.5 13.0 8.5 6.2 Ulster Marbletown 46.7 21.9 20.9 14.2 9.5 7.0 Ulster Marlborough 43.7 20.0 18.3 12.0 7.8 5.5 Ulster New Paltz 45.5 21.5 20.0 13.4 8.9 6.4 Ulster Olive 49.3 23.1 23.0 16.0 11.0 8.3 Ulster Plattekill 45.8 21.3 20.2 13.5 9.0 6.6 Ulster Rochester 46.9 21.8 21.0 14.2 9.6 7.1 Ulster Rosendale 45.2 21.5 19.8 13.2 8.7 6.3 Ulster Saugerties 43.6 20.3 18.3 12.0 7.7 5.5

Nitrogen Guidelines for Field Crops in New York. Second Release. June 22, 2003.
67
Appendix Table 3 (Continued). County
Township
Precipitation
N Leaching Index
PA
PW
Soil Hydrologic Group
------Inches------
A
B
C
D
Ulster Shandaken 49.1 23.8 23.1 16.0 11.0 8.3 Ulster Shawangunk 44.8 21.0 19.3 12.8 8.4 6.1 Ulster Ulster 44.8 21.4 19.5 13.0 8.5 6.1 Ulster Wawarsing 46.3 21.6 20.6 13.9 9.3 6.8 Ulster Woodstock 48.4 22.5 22.2 15.3 10.5 7.9 Warren Bolton 40.7 18.7 16.0 10.1 6.2 4.2 Warren Chester 41.1 19.0 16.4 10.4 6.5 4.4 Warren Hague 40.6 18.5 15.9 10.0 6.2 4.2 Warren Horicon 41.0 19.0 16.3 10.3 6.4 4.4 Warren Johnsburg 44.1 20.5 18.7 12.3 8.0 5.7 Warren Lake George 43.0 19.9 17.9 11.6 7.5 5.3 Warren Lake Luzerne 42.9 20.0 17.8 11.6 7.4 5.2 Warren Queensbury 39.9 18.3 15.4 9.6 5.8 3.9 Warren Stony Creek 46.5 22.7 21.0 14.2 9.5 7.0 Warren Thurman 45.4 21.5 19.9 13.3 8.8 6.4 Warren Warrensburg 43.0 20.1 17.9 11.6 7.4 5.2 Washington Argyle 38.5 17.0 14.2 8.6 5.1 3.3 Washington Cambridge 37.3 16.0 13.2 7.9 4.5 2.9 Washington Dresden 42.3 19.4 17.2 11.1 7.0 4.9 Washington Easton 37.3 16.2 13.2 7.9 4.5 2.9 Washington Fort Ann 40.8 18.6 16.1 10.2 6.3 4.3 Washington Fort Edward 37.0 16.4 13.1 7.8 4.4 2.8 Washington Granville 39.3 17.5 14.8 9.1 5.5 3.6 Washington Greenwich 37.5 16.1 13.3 8.0 4.6 2.9 Washington Hampton 39.2 17.2 14.6 9.0 5.4 3.6 Washington Hartford 39.7 18.0 15.2 9.4 5.7 3.8 Washington Hebron 38.9 17.0 14.4 8.9 5.3 3.5 Washington Jackson 38.3 16.5 13.9 8.5 5.0 3.2 Washington Kingsbury 38.0 17.3 13.9 8.4 4.9 3.1 Washington Putnam 37.6 16.5 13.5 8.1 4.7 3.0 Washington Salem 37.7 16.4 13.5 8.1 4.7 3.0 Washington White Creek 39.6 17.3 14.9 9.2 5.6 3.7 Washington Whitehall 38.0 17.0 13.8 8.4 4.9 3.1 Wayne Arcadia 35.2 15.8 11.8 6.8 3.7 2.2 Wayne Butler 37.3 17.1 13.5 8.0 4.6 2.9 Wayne Galen 36.2 16.5 12.6 7.4 4.1 2.5 Wayne Huron 38.8 18.2 14.7 9.0 5.3 3.5

Nitrogen Guidelines for Field Crops in New York. Second Release. June 22, 2003.
68
Appendix Table 3 (Continued). County
Township
Precipitation
N Leaching Index
PA
PW
Soil Hydrologic Group
------Inches------
A
B
C
D
Wayne Lyons 35.6 16.0 12.1 7.0 3.8 2.3 Wayne Macedon 33.7 15.0 10.8 6.0 3.1 1.7 Wayne Marion 35.9 16.4 12.4 7.2 4.0 2.4 Wayne Ontario 36.4 16.7 12.8 7.5 4.2 2.6 Wayne Palmyra 35.0 15.6 11.7 6.6 3.6 2.1 Wayne Rose 37.1 17.3 13.4 8.0 4.5 2.9 Wayne Savannah 36.2 16.4 12.6 7.3 4.1 2.5 Wayne Sodus 37.0 17.6 13.4 8.0 4.5 2.8 Wayne Walworth 35.1 16.2 11.9 6.8 3.7 2.2 Wayne Williamson 37.0 17.3 13.3 7.9 4.5 2.8 Wayne Wolcott 39.0 18.6 14.9 9.2 5.5 3.6 Westchester Bedford 49.0 23.9 23.1 16.0 11.0 8.3 Westchester Cortlandt 47.0 22.1 21.2 14.4 9.7 7.2 Westchester Eastchester 47.0 22.1 21.2 14.4 9.7 7.2 Westchester Greenburgh 48.8 23.5 22.8 15.7 10.8 8.1 Westchester Harrison 47.8 23.2 22.0 15.1 10.2 7.6 Westchester Lewisboro 49.4 24.2 23.4 16.3 11.2 8.5 Westchester Mamaroneck 47.0 22.0 21.1 14.4 9.7 7.1 Westchester Mount Pleasant 48.6 23.4 22.6 15.6 10.7 8.0 Westchester Mount Vernon 47.0 22.0 21.1 14.4 9.7 7.1 Westchester New Castle 48.9 23.9 23.0 15.9 10.9 8.2 Westchester New Rochelle 47.0 22.0 21.1 14.4 9.7 7.1 Westchester North Castle 49.0 24.0 23.1 16.0 11.0 8.3 Westchester North Salem 48.9 23.8 23.0 15.9 10.9 8.2 Westchester Ossining 47.3 22.8 21.6 14.7 9.9 7.4 Westchester Pelham 47.0 22.0 21.1 14.4 9.7 7.1 Westchester Pound Ridge 49.0 24.3 23.2 16.1 11.1 8.3 Westchester Rye 47.6 23.2 21.9 14.9 10.1 7.5 Westchester Scarsdale 47.0 22.4 21.2 14.4 9.7 7.2 Westchester Somers 48.9 23.6 22.9 15.9 10.9 8.2 Westchester White Plains 47.2 23.0 21.5 14.7 9.9 7.3 Westchester Yonkers 47.3 22.4 21.4 14.6 9.9 7.3 Westchester Yorktown 48.6 23.0 22.5 15.5 10.7 8.0 Wyoming Arcade 42.2 18.4 16.9 10.9 6.9 4.8 Wyoming Attica 38.4 17.0 14.1 8.6 5.0 3.3 Wyoming Bennington 39.2 17.5 14.7 9.1 5.4 3.6 Wyoming Castile 35.5 15.1 11.8 6.8 3.7 2.2
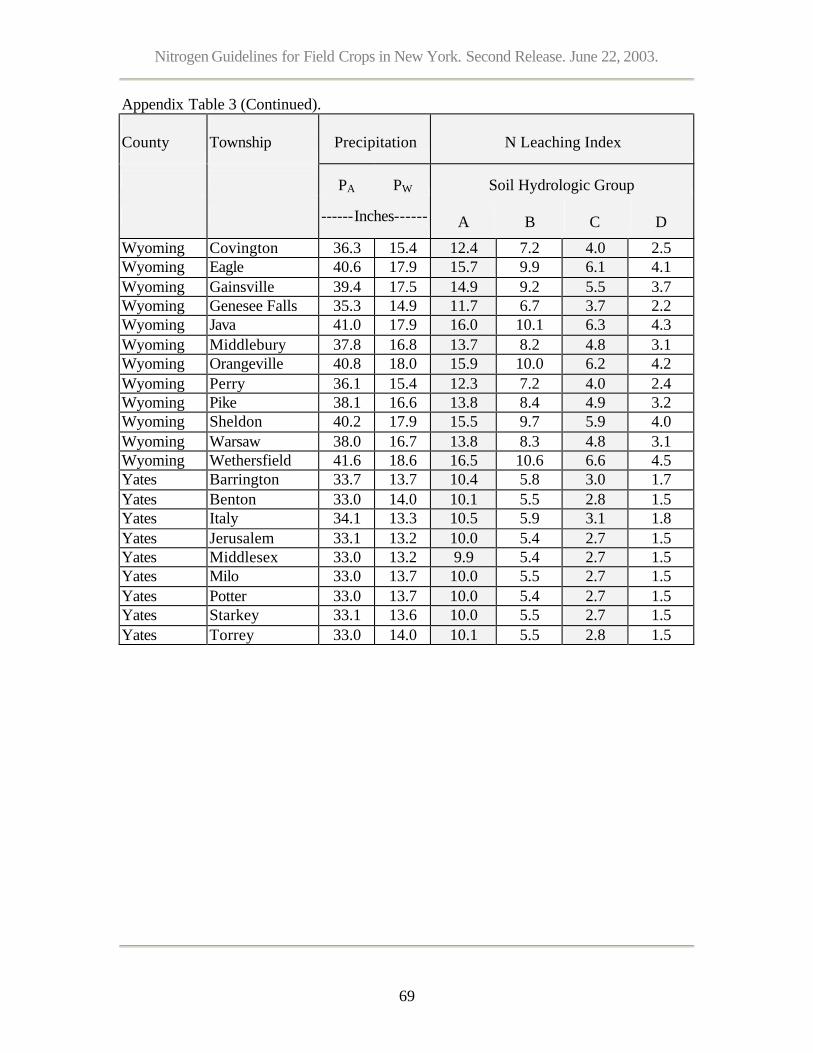
Nitrogen Guidelines for Field Crops in New York. Second Release. June 22, 2003.
69
Appendix Table 3 (Continued). County
Township
Precipitation
N Leaching Index
PA
PW
Soil Hydrologic Group
------Inches------
A
B
C
D
Wyoming Covington 36.3 15.4 12.4 7.2 4.0 2.5 Wyoming Eagle 40.6 17.9 15.7 9.9 6.1 4.1 Wyoming Gainsville 39.4 17.5 14.9 9.2 5.5 3.7 Wyoming Genesee Falls 35.3 14.9 11.7 6.7 3.7 2.2 Wyoming Java 41.0 17.9 16.0 10.1 6.3 4.3 Wyoming Middlebury 37.8 16.8 13.7 8.2 4.8 3.1 Wyoming Orangeville 40.8 18.0 15.9 10.0 6.2 4.2 Wyoming Perry 36.1 15.4 12.3 7.2 4.0 2.4 Wyoming Pike 38.1 16.6 13.8 8.4 4.9 3.2 Wyoming Sheldon 40.2 17.9 15.5 9.7 5.9 4.0 Wyoming Warsaw 38.0 16.7 13.8 8.3 4.8 3.1 Wyoming Wethersfield 41.6 18.6 16.5 10.6 6.6 4.5 Yates Barrington 33.7 13.7 10.4 5.8 3.0 1.7 Yates Benton 33.0 14.0 10.1 5.5 2.8 1.5 Yates Italy 34.1 13.3 10.5 5.9 3.1 1.8 Yates Jerusalem 33.1 13.2 10.0 5.4 2.7 1.5 Yates Middlesex 33.0 13.2 9.9 5.4 2.7 1.5 Yates Milo 33.0 13.7 10.0 5.5 2.7 1.5 Yates Potter 33.0 13.7 10.0 5.4 2.7 1.5 Yates Starkey 33.1 13.6 10.0 5.5 2.7 1.5 Yates Torrey 33.0 14.0 10.1 5.5 2.8 1.5

Nitrogen Guidelines for Field Crops in New York. Second Release. June 22, 2003.
70
Q.M. Ketterings, S.D. Klausner, and K.J. Czymmek (2003). Nitrogen Guidelines for Field Crops in New York. Second Release. Department of Crop and Soil Sciences Extension Series EO3-16. 70 pages.