nitrogen pools and soil characteristics of a temperate estuarine wetland in eastern australia
TRANSCRIPT

Aquatic Botany, 23 (1985) 275--290 275 Elsevier Science Publishers B.V., Amsterdam - - Printed in The Netherlands
NITROGEN POOLS AND SOIL CHARACTERISTICS OF A TEMPERATE ESTUARINE WETLAND IN EASTERN AUSTRALIA
P.J. CLARKE*
School o f Life Sciences, New South Wales Institute o f Technology, Sydney, N.S. W. 2007 (Australia)
(Accepted for publ icat ion 4 September 1985)
ABSTRACT
Clarke, P.J., 1985. Nitrogen pools and soil characteristics of a tempera te estuarine wet- land in eastern Australia. Aquat. Bot., 23: 275--290.
The nitrogen status of the soil and plant components of an estuarine wet land near Sydney were investigated over 6 months to de tec t seasonal and spatial changes in ni trogen content . Organic carbon, organic nitrogen and inorganic nitrogen concentra t ions were measured in the soil at various depths in six vegetat ion zones across the wetland. Carbon and nitrogen content of the plant biomass were also determined in each o f the zones. Soil redox potentials and pH were measured in situ and both were found to vary with depth and inundat ion frequency. Organic carbon, organic nitrogen and inorganic nitro- gen in the soil decreased significantly from the fringe Casuarina forest (1391 g N m -2) through to the Avicennia mangrove zone (133 g N m-2). Exchangeable NH +, NO~ and NO~ concentrat ions form less than 1% of the soil nitrogen pool and vary seasonally. The distinctive feature of the mangrove zone is tha t the plant componen t o f the total nitrogen pool is large (55%). This contrasts with the saltmarsh and fringe communit ies , where the plant pools are small (15%) in comparison with the soil. These findings are consis tent with the hypothesis that mangroves expor t organic nutrients whereas the saltmarsh and fringe communit ies act as nutr ient sinks.
INTRODUCTION
The importance of nitrogen as a limiting nutrient in marine ecosystems has been recognized for some time and recent studies have extended the range of marine and estuarine autotrophs known to be limited by nitrogen. These include phytoplankton (Boynton et al., 1982), macroalgae (Mann, 1979) seagrasses (Orth, 1977; Bulthuis and Woelkering, 1981), saltmarsh plants (Buresh et al., 1980) and mangroves (Onuf et al., 1977; Boto and Wellington, 1983). The influence that nitrogen has on the productivity of saltmarsh communit ies has resulted in numerous studies of the nitrogen
*Present address: School of Biological Sciences, The University of Sydney, Sydney, N.S.W. 2006, Australia.
0304-3770/85/$03.30 © 1985 Elsevier Science Publishers B.V.
276
cycle along the east coast of North America, but only in a few instances are nitrogen budgets available (e.g., Valiela and Teal, 1979; Smith et al., 1982).
Comparative examples of the nitrogen status and cycles for southern hemisphere estuaries are lacking. In particular, the nitrogen status and soft characteristics of the emergent communities in eastern Australia are virtually unknown. This paper describes the nitrogen status of the soft and plant corn: ponents through a temperate estuarine wetland in south~eastern Australia.
MATERIALS AND METHODS
The study site
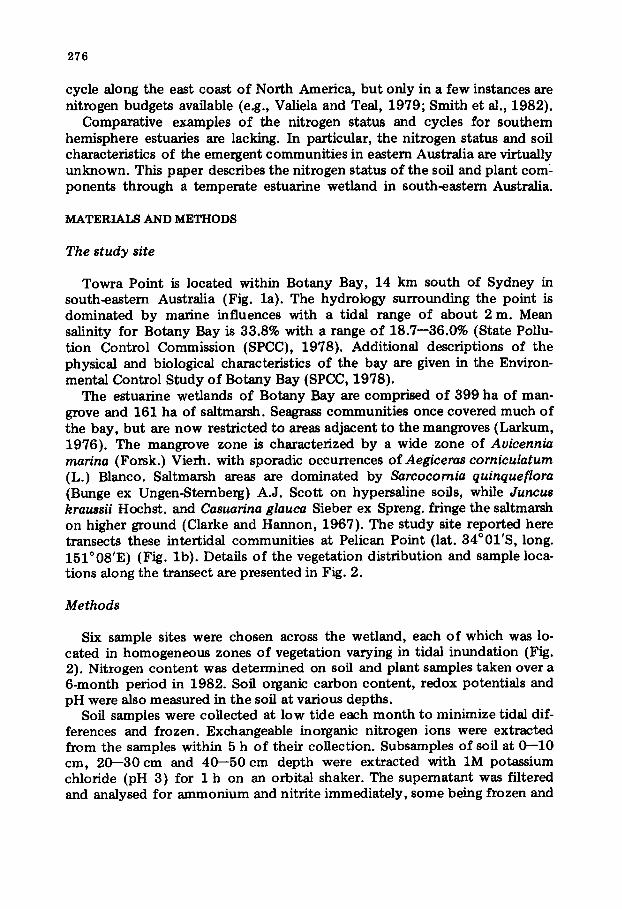
Towra Point is located within Botany Bay, 14 km south of Sydney in south~eastern Australia (Fig. la). The hydrology surrounding the point is dominated by marine influences with a tidal range of about 2 m. Mean salinity for Botany Bay is 33.8% with a range of 18.7--36.0% (State Pollu- tion Control Commission (SPCC), 1978). Additional descriptions of the physical and biological characteristics of the bay are given in the Environ- mental Control Study of Botany Bay {SPCC, 1978).
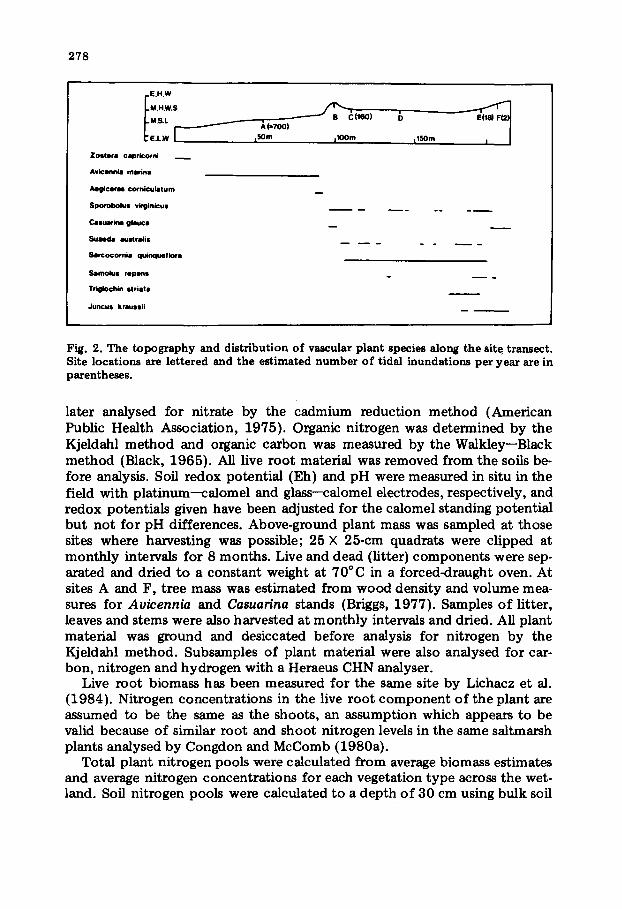
The estuarine wetlands of Botany Bay are comprised of 399 ha of man- grove and 161 ha of saltmarah. Seagrass communities once covered much of the bay, but are now restricted to areas adjacent to the mangroves (Larkum, 1976). The mangrove zone is characterized by a wide zone of Avicennia marina (Forsk.) Vierh. with sporadic occurrences of Aegiceras eorniculatum (L.) Blanco. Saltmarsh areas are dominated by Sarcocornia quinqueflora {Bunge ex Ungen-Sternberg) A.J. Scott on hypersaline soils, while Juncus kraussii Hochst. and Casuarina glauea Sieber ex Spreng. fringe the saltmarsh on higher ground (Clarke and Hannon, 1967). The study site reported here transects these intertidal communities at Pelican Point (lat. 34°01'S, long. 151°08'E) (Fig. lb) . Details of the vegetation distribution and sample loca- tions along the transect are presented in Fig. 2.
Methods
Six sample sites were chosen across the wetland, each of which was lo- cated in homogeneous zones of vegetation varying in tidal inundation (Fig. 2). Nitrogen content was determined on soil and plant samples taken over a 6-month period in 1982. Soil organic carbon content, redox potentials and pH were also measured in the soil at various depths.
Soil samples were collected at low tide each month to minimize tidal dif- ferences and frozen. Exchangeable inorganic nitrogen ions were extracted from the samples within 5 h of their collection. Subsamples of soil at 0--10 cm, 20--30 cm and 40--50 cm depth were extracted with 1M potassium chloride (pH 3) for 1 h on an orbital shaker. The supernatant was filtered and analysed for ammonium and nitrite immediately, some being frozen and

277
,Towra Point
(b)
Urban areas
Natural vegetation
10 km
11510101
Pel
.34010 '
Fig. 1. (a) The location of Towra Point in Botany Bay on the east coast o f Australia. (b) The location o f the site transect and the distribution o f mangrove and saltmarsh communities .
278
MS.L ~ ~ ' ~ - - - - ~ - ~ ' - " ' ~ ' ~ A ~ ) B C1160)
E.LW L 150m 1100m
Zostera caprlcorni
Avicennia marina
Aegiceras cocnlculatum
Sporobolus vifljinicus
Caaua*ina glauca
Sua4Kla ~ t r a l i s
Sarcocorn~a qt~ctquefiofa
Samo~s ¢epens
Triglochin atriat a
Juncus k raussii
L150m
Fig. 2. The topography and distribution of vascular plant species along the site transect. Site locations are lettered and the estimated number o f tidal inundations per year are in parentheses.
later analysed for nitrate by the cadmium reduction method (American Public Health Association, 1975). Organic nitrogen was determined by the Kjeldahl method and organic carbon was measured by the Walkley--Black method (Black, 1965). All live root material was removed from the soils be- fore analysis. Soil redox potential (Eh) and pH were measured in situ in the field with platinum--calomel and glass--calomel electrodes, respectively, and redox potentials given have been adjusted for the calomel standing potential but not for pH differences. Above-ground plant mass was sampled at those sites where harvesting was possible; 25 × 25-cm quadrats were clipped at monthly intervals for 8 months. Live and dead (litter) components were sep- arated and dried to a constant weight at 70°C in a forced<lraught oven. At sites A and F, tree mass was estimated from wood density and volume mea- sures for Avicennia and Casuarina stands (Briggs, 1977). Samples of litter, leaves and stems were also harvested at monthly intervals and dried. All plant material was ground and desiccated before analysis for nitrogen by the Kjeldahl method. Subsamples of plant material were also analysed for car- bon, nitrogen and hydrogen with a Heraeus CHN analyser.
Live root biomass has been measured for the same site by Lichacz et al. (1984). Nitrogen concentrations in the live root component of the plant are assumed to be the same as the shoots, an assumption which appears to be valid because of similar root and shoot nitrogen levels in the same saltmarsh plants analysed by Congdon and McComb (1980a).
Total plant nitrogen pools were calculated from average biomass estimates and average nitrogen concentrations for each vegetation type across the wet- land. Soil nitrogen pools were calculated to a depth of 30 cm using bulk soil

279
density measures by Clarke and Hannon (1967) for the same location. Live root mass was subtracted from the soil mass so that the soil organic nitrogen content reflected the true detrital pool of nitrogen in the soft.
RESULTS AND DISCUSSION
Vegetation b iomass and nitrogen content
Mean biomass and nitrogen concentrations of samples for the dominant species in the vegetation zones examined are given in Table I. Both tree spe- cies have similar above-ground standing crops on an area basis (2--3 kg dry wt. m-2). Total tree mass for A. marina is less than that found by Attiwill and Clough (1974), Briggs (1977) and Goulter and Allaway (1979), who re- port values of 22--29 kg dry wt. m -2. The low density of trees (0.18 m -2) and height o f the stand (6 m) may account for the difference. Estimates of the total biomass for Casuarina glauca were not possible as the root mass consisted of roots of several species, which technically could not be sepa- rated.
Standing crop values for saltmarsh plants are mean values for harvests taken each month for 8 months. Sarcocornia quinqueflora was the most widespread species observed with a total biomass of 1--2 kg dry wt. m -2. The largest standing crops measured were for Juncus hraussii which are similar to those obtained in Western Australia by Congdon and McComb (1980b). No seasonal growth trends were observed for the saltmarsh plants and it appears that the standing crop does not represent annual productivity (Congdon and McComb, 1980b).
Concentrations of nitrogen in the leaves of A. marina vary from 0.9 to 1.5% N dry wt., which falls within the range previously reported (Bunt, 1982). Nitrogen levels for saltmarsh plants are higher than those recorded by Congdon and McComb (1980a) and Van der Valk and AttiwiU (1983a). These concentrations were later checked by CHN analysis on random sam- ples for each species and found to be similar to the preceding analysis. Sub- samples were also taken from a month's harvest o f J . hraussii to check varia- tion within samples. The coefficient o f variation for the subsamples was small (6%) compared with month-to-month variation (31%). The large coeffi- cients of variation should, therefore, reflect the seasonal variation in the ni- trogen status of the saltmarsh plants. Large variations in the nitrogen concen- tration of J. hraussii have been measured elsewhere, although no clear sea- sonal trends in nutrient content were observed (Congdon and McComb, 1980a).
Carbon--nitrogen ratios were obtained by CHN analysis on single samples of each species. These ratios indicate nitrogen depletion in the dead standing crop of saltmarsh plants. However, the average nitrogen concentrations for dead stems of J. hraussii and S. quinqueflora were similar to those of the live stems; this may indicate an increase in microbial biomass on dead stems

b~
CO
TA
BL
E I
Pla
nt
biom
ass,
pla
nt
nit
rog
en c
on
cen
trat
ion
s an
d c
arb
on
--n
itro
gen
rat
ios.
Fro
m C
lark
e (1
98
3)
Spe
cies
S
ite
Co
mp
on
ent
Bio
mas
s N
itro
gen
(k
g m
-' +
1 S
.E.M
.)
con
cen
trat
ion
(K
jeld
ahl
Met
ho
d)
((%
N)
± 1
S.E
.M.)
(n
=5)
Nit
rog
en
con
cen
trat
ion
(H
erae
us
CH
N
anal
yse
r)
(% N
)
Car
bo
n--
N
itro
gen
n
itro
gen
co
nte
nt
rati
o
(g N
m -
s)
Avi
cenn
ia m
arin
a
Cas
uari
na g
lauc
a
Spom
bolu
s vi
rgin
icus
Mix
ed r
oo
ts
Sarc
ocor
nia
quin
quef
lora
C
A
Ste
ms
2.2
--
1.5
0
(0.0
6)
Lea
ves
0.2
--
0
.91
(0
.25
) B
elo
w g
rou
nd
li
ve t
o 3
0 cm
10
.2
--
1.2
0
--
B
Ste
ms
3.4
--
0.9
0
(0.2
2)
Bra
nch
lets
0.
3 --
1
.01
(0
.24
) B
L
ive
culm
s 0
.43
(0
.05
) 1
.57
(0
.38
) D
ead
cu
lms
0.5
5
(0.0
6)
1.4
2
(0.2
0)
B
To
tal
bel
ow
gro
un
d
live
to
30
cm
3.4
0
--
1.2
2
--
Liv
e st
ems
0.6
8
(0.0
6)
1.90
(0
.53
) D
ead
ste
ms
0.3
0
(0.0
5)
1.67
(0
.39
) B
elo
w g
rou
nd
liv
e to
30
cm
1
.30
--
1.
78
--
1.4
2
1.86
1.5
8
0.8
5
1.17
1.
33
1.71
1.
44
35.1
33.0
21.5
1.8
--
122.4
157.2
--
30.6
--
3.0
36.2
6.7
36.0
7.8
--
41.5
89.6
20.5
32
.1
12.9
5.
0
23.1
41
.0

Sarc
ocor
nia
quin
quef
lora
D
Junc
us k
raus
sii
E
Junc
us k
raus
sii
F
Cas
auri
na g
lauc
a F
Mix
ed r
oo
ts
F
Liv
e st
ems
0.5
0
(0.0
5)
1.1
9
(0.4
1)
Dea
d s
tem
s 0
.21
(0
.05
) 1
.23
(0
.37
) B
elo
w g
rou
nd
liv
e to
30
cm
1
.30
--
1
.21
--
Liv
e eu
lms
0.7
3
(0.1
7)
1.2
5
(0.6
4)
Dea
d c
ulm
s 1
.06
(0
.13
) 1
.42
(0
.43
) B
elo
w g
rou
nd
liv
e to
30
cm
1
.60
--
1
.82
--
Liv
e cu
lms
0.2
7
(0.0
5)
1.3
2
(0.4
1)
Dea
d c
ulm
s 0
.77
(0
.21
) S
tem
s 2.
4 --
B
ran
chle
ts
0.2
--
T
ota
l b
elo
w g
rou
nd
li
ve t
o 3
0 c
m
7.8
--
1.3
4
(0.2
8)
o.9
0
(0.2
1)
--
(0.2
4)
1.1
4
--
1.43
0.9
7
1.1
4
0.8
3
1.3
5
(0.0
8)
n =
5 1
.55
1
.58
0
.85
23
.3
43
.1
38
.9
41
.5
35
.1
44
.5
42
.5
5.9
2.6
21
.8
30
.3
9.1
15
.0
21
.1
45
.2
3.5
10
.3
21
.6
2.0
88
.9
12
6.3
['0
O3

282
(Rice and Tenore, 1981). The apparent conflict between high C : N ratios and increased litter nitrogen levels requires further study.
Soil characteristics
pH and redox potential Soil pH decreases significantly at those sites which fringe the saltmarsh
(see Fig. 3a). This may be a result o f the accumulation o f organic matter in the zones of Juncus and Casuarina which release organic acids. The coeffi- cients o f variation are large for these sites as irregular tidal inundations can cause a rapid increase in pH. An apparent decrease in pH with depth at all
(a) T ~ | ~ ! . . T T
1-" "--l-I "-",, \!!
' ! ! ! !
o.~th(c,.) ~ 2'5 ;5 is ~ 2'5,~ ~ 2's,'s 5 2s,'s s 2's s is S i t e A B C D E F
(b)
5 0 0
4 0 0
A > E 3 0 0
2 0 0
100
i% %,
!
% .l.%
x-o f s ~ 's , ; ' 65
A
T
T
1
I J.
Depth{cm) 5 215 415 5 215 415 5 25 45 5 25 5 25 S i t e B C D E F
Fig. 3. (a) Soil pH and (b) soil redox potential at various depths for each site. ±1 S.E.M., n = 6 .

283
locations may indicate the product ion of organic acids and carbon d ioxide by actively metabolizing roots. In general, the surface softs remain neutral to slightly acid due to the influence of alkaline estuary water.
Redox potentials (Eh) were measured in situ and found to decrease with depth and f requency o f tidal inundation {Fig. 3b). Mangrove softs are strongly reducing, especially at depth, while the lower saltmarsh soils remain anaerobic bu t less reduced. Higher saltmarsh and fringe zone softs are aerobic (Eh > 350 mV), although the Eh decreases below the water table. Soil Eh and pH both strongly influence the concentrat ions o f dissolved nutrients in the sedi- ments (Patrick and DeLaune, 1977). The effects o f Eh and pH on the nitro- gen status o f the soft are discussed below.
Inorganic nitrogen A summary of soft inorganic nitrogen concentrat ions is presented for com-
parison with other sediments in Table II. Exchangeable NH4 + concentrat ions are lower than those previously recorded for anaerobic sediments in man- groves and saltmarshes, although nitrate levels are similar to those of Haines et al. (1977). Both spatial (Fig. 4) and seasonal (Fig. 5) variations in inorganic nitrogen concentrat ions are evident for this site, although the large coeffi- cients o f variation limit detailed interpretation.
T A B L E II
Inorganic n i t rogen c o n c e n t r a t i o n s for es tuarine s e d i m e n t s . Ranges given wi th m e a n values in parentheses
Sediment type NH4 + (~M) NO~ (uM) NO~ (uM)
Mangrove 7--39 (18) 0--3 (2) 3--20 (12) (330) - - - -
2 2 2 - - 1 3 8 8 - - - -
Saltmarsh 4--67 (20) 0--5 (2) 3--42 (17) 36--95 (58) 2--3 2--18 (10) 105--1630 -- 30--1200
Fringe 8--111 (33) 0--5 (2> 5--37 (21) 1170--42430 --
Benthic 80--1313 (110) -- 0--20 (10) 200--1700 -- --
This s t u d y Boto and Wellington (1983) Van der Valk and Attiwill (1983a)
This study Haines et al. (1977) Beeftink (1977)
This study B e e f t i n k (1977) H o p k i n s o n and Wetze l (1982) Bulthuis and Woelkering (1981)
Nitrate and to a lesser extent ammonium concentrat ions decrease from the fringe forest to the mangroves while nitrite levels remain constant . A possible explanation for the rapid decrease in nitrate is the low redox poten- tials in the mangrove zone. Alternatively, regular tidal incursions m a y re- move nitrate which is more soluble than ammonium from the soft. Amino-

2 8 4
nium may also be lost from these soils as it is more soluble under low redox potentials (DeLaune et al., 1981).
The presence o f nitrate and nitrite in anaerobic soils can be accounted for by nitrification in the aerobic rhizospheres near the roots o f wetland plants (Haines et al., 1977). Nitrite and ammonium concentrations increase with depth in the anaerobic soil, indicating denitrification beyond the rhizo- spheres. In general, however, the surface layers of the sediments have the highest levels of inorganic nitrogen. This is related to the faster rates of de- composition found on the surface of the sediments than at depth (Van der Valk and Attiwill, 1984).
2.0
1.5
"o
v
1.0 Z
._o
0.5
0.4
0.3
0.2
0.1
Depth (cm)
Site
T ! L ]" !,'i /I \r * I I ~/,. ~! I.
# ...'~ ~, ~.-4" ~---l'"
A B C D
!
1
] .... i---I
E F
Fig . 4 . S o i l i n o r g a n i c n i t r o g e n c o n c e n t r a t i o n s at v a r i o u s d e p t h s for e a c h s i t e . -+ 1 S , E . M . , n ffi 6 , N H + ffi =, NO~" = * , NO~- = e .

285
1.4 . 0.,
~ 1 . 0 ~ . ~ 0 . 3
-~ o.a. -~o.2
0.4 - 0.1
O - 0
T T A ===,====-=-,==- A
2o°c
15
10
5
0
Fig. 5. Seasonal concentrations for ammonium • and nitrate • for the saltmarsh. ± I S.E.M.,
n = 6. Mean annual temperature denoted by e.
Organic carbon and organic nitrogen Organic carbon concentrat ions increase from the mangrove zone (2% dry
wt.) through to the fringe forest where they attain the highest levels (23% dry wt.) (Fig. 6a). Organic carbon levels in the saltmarsh and fringe zones are higher at the surface than at depth while the mangrove soils show no stratification in organic carbon.
Soil organic nitrogen concentrat ions range from 0.4 mg N g- 1 dry wt. in the mangrove zone through to 3.7 mg N g-1 dry wt. in the fringe forest (Fig. 6b). High levels of nitrogen in the fringe forest can be at tr ibuted to the fixa- t ion of nitrogen in the roots o f Casuarina glauca and the large accumulat ion of litter for the site. High nitrogen levels were also expected for the levee bank site (B) which has a similar stand density to that of the fringe forest. The root zone at the levee did have increased nitrogen concentrat ion com- pared to the surface, however, the overall level of nitrogen in the soil was much lower than the fringe forest. Saltmarsh soil had a higher surface con- centration of nitrogen than at depth, while the mangrove sediments have uniformly low levels o f nitrogen. A similar increase in soil nitrogen concen- tration from open-water to fringe forest has been described by Congdon and McComb (1980a) for a wetland where mangroves are absent.
Removal of both organic C and N in the mangrove zone and lower salt- marsh zones by tidal action would explain the low levels o f nutrients ob- served in these sites. Nitrogen appears to be retained relative to carbon as the C : N ratio for the soil is lower than litter fall. Low C : N ratios may also be maintained by nitrogen fixation, which has been observed in A. ma- rina (Van der Valk and Attiwill, 1983b). In contrast , the fringe zones have high C : N ratios indicating an accumulat ion o f carbon relative to nitrogen; this carbon probably originates from debris washed on to strand lines.

~°
o
9 ~ 0
I+ E. ~
. "
0
It
O
~.~
"
.~.~
Q
U)
0 o
= =T
A t'1
>;]
:;]
o;]
o 2]
1,414
I 14
14
Org
anic
N
itro
gen
( °/
o dr
y w
t)
P P
9
w
! u
I
,j'~
"\
I •
!
A O"
Org
anic
C
arbo
n (
%
dry
wt)
i i
1o
/ •
-] ~.
.,-
,. 0
M
/ (~
n I-i
, •
/
I
A
~] I I
I I
I I
I I
o!;e
a w
o;v
N:3

2 8 7
Nitrogen pools
Soil nitrogen pools decrease substantially from the fringe Casuarina forest (1391 g N m -2) through to the mangrove Avicennia zone (133 g N m -2) (Fig. 7) (Table III). This gradient is consistent with decreasing levels o f or- ganic matter found in each zone. Most of the soil nitrogen is in the organic form and is not readily available for plant uptake unless mineralized. Inor- ganic forms of nitrogen contribute less than 0.2% of the total pool of nitro-
[ ~r
~i te A B
[ l l / l l l l l l l t
- --.::.-:.:: !-/.'.':
; . . - . . . . . y....::.-'. (g N / m 2) 2 4 6 261 217 .t 2 4 2 502 911
°°2" 2 o g # e c
C D E F
I I I I N I H I I I I
.:::o(: : °° ~" °°
02°0: : o ° . ~ o o
"::...':: : ° ° 0 ° o
0 ) ' : : :o°oOoo ":) ' : : ; o ° . ~ o o ;:J;i'.::
7 3 3
/ oo #:-
/ ,
]ttt l t ~ , ~ 1 0 0 %
[ ] Shoot pool i .~2o ; ,2 =
~= : °0 - ~80 p_o ° ° ! ~ E ° - : 2 ° L - - J Root p o o l e o : ~ o :
"°o : °°°° , __ 6 0 L i t t e r pool . oo . ==
. . . . [ ] S
o o ° , : ~ o : 2 o . . . . - - 4 0 oi l pool
_0 o_o . o ° . ° o
.0 ° . o , : ° o : ° o
-o= 0=- o"
'=- - ° " - - , , ~ 0 501
_ _ 2 0
Fig. 7. The proportion of nitrogen in differing components of the total pool through the wetland. Total content of nitrogen is given for each site for a 30-cm depth o f soil.
TABLE IH
Nitrogen pools in the various zones of the estuarine wetland (g N m-2)
Components Sites
A B C D E F
Plant live above ground 34.8 40.3 23.1 21.8 21.1 2.1 Plant live below ground 122.4 41.5 12.9 5.9 9.1 88.9 Litter - - 7.8 5.0 2.6 15.0 10.3 Soft organic-N (30 cm) 132.6 194.4 213.2 263.7 621.6 1391.4 Soil inorganic-N ( 30 cm) 0.1 0.4 0.2 0.3 0.6 0.5
Total 289.9 284.4 254.4 294.3 667.4 1581.2

288
gen in the wetland, which is similar to that found along the east coast o f North America (Haines et al., 1977).
The total pool o f nitrogen is greatest in the fringe marsh and forest com- munities where the plant pools are small (15--20%) in comparison with the soil (Fig. 7). These areas accumulate decay-resistant organic mat te r which acts as a nutr ient sink unless recycled by detritivores. Similar accumulations of soil nutrients have been found in a Western Australian marsh (Congdon and McComb, 1980a) and in North America (Haines et al., 1977).
The distinctive feature o f the mangrove zone is that the plant componen t of the nitrogen pool comprises 55% of the total pool. This contrasts with most terrestrial forests where the major i ty of the nitrogen pool is in the soil (Baker and Attiwill, 1981). The cont inuous removal o f li t ter f rom the man- grove zone by the t ide would prevent the accumulat ion of organic mat ter and account for the depleted pool o f nitrogen in the mangrove sediments. Most o f the lit ter appears to be expor ted to the estuary, as mangrove litter does not accumulate on strand lines or in the mangrove zone. Quantitative estimates of detrital expor t from wetlands are difficult to obtain as there is considerable spatial and seasonal variation. Estimates for tidal expor t o f lit- ter in Australian mangroves range from 40 to 100% of all l i t ter fall (Boto and Bunt, 1981; Van der Valk and Attiwill, 1984). Lit ter fall for mangroves in the Sydney region has been measured at 520 g m -2 year -~ (Goulter and Allaway, 1979) which if total ly expor ted would represent a loss of 4 g N m -~ year -~. If product ivi ty is to be maintained, inputs of nitrogen via nitro- gen fixation, rainfall and the water column are needed (Boto, 1982). A pos- sible source of nutrients for mangroves, no t previously considered, is the salt- marsh and fringe zone soils which have large stocks of nitrogen. These may be mobil ized in the dissolved form and moved into the mangrove zone via the water table.
ACKNOWLEDGEMENTS
I would like to thank Rod Buckney for his supervision and assistance through the study. Bill Allaway, Mark Curran, Audrey Graham, Sean Hardiman, Wieslav Lichacz and Peter Myerscough are also thanked for their comments , discussion and technical help.
REFERENCES
American Public Health Association, 1975. Standard Methods for the Examinat ion o f Water and Wastewater, 13th edn., 874 pp.
Attiwill , P.M. and Clough, B.F., 1974. The role of the mangrove and seagrass communit ies in nutrient cycling in Westernport Bay. Repor t to Westernport Bay Environmental Study, Ministry for Conservation, Victoria, 120 pp.
Baker, T.G. and Attiwill , P.M., 1981. Nitrogen in Australian eucalypt forests. In: Pro- ductivi ty in Perpetui ty . Proc. Australian Forest Nutr i t ion Workshop, CSIRO Division of Fores t Research, Canberra, pp. 159--170.

289
Beeftink, W.G., 1977. The coastal salt marshes of Western and Northern Europe. An ecological and phytosociological approach. In: V.J. Chapman (Editor) , Wet Coastal Ecosystems. Elsevier, Amsterdam, pp. 109--155.
Black, C.A., 1965. Methods of Soil Analysis, Vol. 2. American Society of Agronomy, pp. 772--1571.
Boto, K.G., 1982. Nutr ient and organic fluxes in mangroves. In: B.F. Clough (Editor) , Structure, Func t ion and Management of Mangrove Ecosystems in Australia. ANU Press, Canberra, pp. 239--258.
Boto, K.G. and Bunt, J.S., 1981. Tidal expor t of part iculate organic mat ter from a northern Australian mangrove system. Estuarine Coastal Mar. Sci., 13: 247--255.
Boto, K.G. and Wellington, J.T., 1983. Phosphorus and nitrogen nutr i t ional status of a northern Australian mangrove forest. Mar. Ecol. Prog. Ser., 11: 63--69.
Boynton, W.R., Kemp, W.M. and Keefe, C.W., 1982. A comparative analysis o f nutrients and other factors influencing estuarine pby top lank ton product ion. In: V.S. Kennedy (Editor) , Estuarine Comparisons. Academic Press, New York, pp. 69--90.
Briggs, S.V., 1977. Estimates o f biomass in a tempera te mangrove communi ty . Aust. J. Ecol., 2: 369--373.
Bulthuis, D.A. and Woelkering, Wm.J., 1981. Effects o f in situ nitrogen and phosphorus enrichment of the sediment on the seagrass Heterozostera tasmanica (Martens ex Aschers) den Hartog in Westernport, Victoria, Australia. J. Exp. Mar. Biol. Ecol., 53 : 193--207.
Bunt, J.S., 1982. Studies of mangrove litterfall in tropical Australia. In: B.F. Clough (Editor), Structure, Func t ion and Management of Mangrove Ecosystems in Australia. ANU Press, Canberra, pp. 223--238.
Buresh, R.J., DeLaune, R.D. and Patrick, W.H., Jr. , 1980. Nitrogen and phosphorus util- ization by Spartina alterniflora in a Louisiana Gulf coast marsh. Estuaries, 3: 111-- 121.
Clarke, P.J., 1983. Nitrogen pools in a mangrove--saltmarsh system. Wetlands (Australia), 3: 85--93.
Clarke, L.D. and Hannon, N.J., 1967. The mangrove swamp and saltmarsh communit ies of the Sydney District. I. Vegetation, soils and climate. J. Ecol., 55: 753--771.
Congdon, R.A. and McComb, A.J., 1980a. Nutr ient pools of an estuarine ecosystem - - the Blackwood River Estuary in south-western Australia. J. Ecol., 68: 287--313.
Congdon, R.A. and McComb, A.J., 1980b. Productivi ty and nutrient content of Juncus kraussii in an estuarine marsh in south-western Australia. Aust. J. Ecol., 5: 221--234.
DeLaune, R.D., Reddy, C.N. and Patrick, W.H., Jr., 1981. Effect of pH and redox poten- tials on concentrat ion of dissolved nutrients in an estuarine sediment. J. Environ. Qual., 10: 276--279.
Goulter, P.F.E. and Allaway, W.G., 1979. Lit ter fall and decomposi t ion in a mangrove stand (Avicennia marina Forsk. [Vierh. ] ) in Middle Harbour, Sydney. Aust. J. Mar. Freshwater Res., 30: 542--546.
Haines, E., Chalmers, A., Hanson, R. and Sherr, B., 1977. Nitrogen pools and fluxes in a Georgia saltmarsh. In: M. Wiley (Editor) , Estuarine Processes. Vol. H. Circulation, Sediments and Transfer of Materials in the Estuary. Academic Press, New York, pp. 241--254.
Hopkinson, C.S. and Wetzel, R.L., 1982. In situ measurements of nutrient and oxygen fluxes in a coastal marine benthic communi ty . Mar. Ecol. Prog. Ser., 10: 29--35.
Larkum, A.W.D., 1976. Ecology of Botany Bay. I. Growth o f Posidonia australis (Brown) Hook. f. in Botany Bay and other bays o f the Sydney Basin. Aust. J. Mar. Freshwater Res., 27: 117--127.
Lichacz, W., Hardiman, S. and Buckney, R.T., 1984. Below-ground biomass in some in- tert idal wetlands in New South Wales. Wetlands (Australia), 4: 56--62.
Mann, K.H., 1979. Nitrogen l imitat ions on the product iv i ty o f Spartina marshes, Lami- naria kelp beds and higher t rophic levels. In: R.L. Jeffries and A.J. Davey (Editors),

290
Ecological Processes in Coastal Environments. Blackwell, Oxford, pp. 363--372. Onuf, C.P., Teal, J.M. and Valiela, I., 1977. Interaction of nutrients, plant growth and
herbivory in a mangrove ecosystem. Ecology, 58: 514--526. Orth, R.J., 1977. Effect of nutrient enrichment on growth of the eelgrass Zostera marina
in the Chesapeake Bay, Virginia, U.S.A. Mar. Biol., 44: 187--194. Patrick, W.H., Jr. and DeLaune, R.D., 1977. Chemical and biological redox systems
affecting nutrient availability in the coastal wetlands. Geosci. Man, 28: 131--137. Rice, D.L. and Tenore, K.R., 1981. Dynamics of carbon and nitrogen during the decom-
position of detritus derived from estuarine macrophytes. Estuarine Coastal Mar. Sci., 13: 681--690.
Smith, C.J., DeLaune, R.D. and Patrick, W.H., Jr., 1982. Carbon and nitrogen cycling in a Spartina alterniflora saltmarsh. In: J.E. Calbally and I.E.J.R. Freney (Editors), The Cycling of Carbon, Nitrogen and Phosphorus in Terrestrial and Aquatic Ecosystems. Australian Academy of Science, Canberra, pp. 97--104.
State Pollution Control Commission of New South Wales, 1978. Environmental Control Study of Botany Bay. The Study and the Region. S.P.C.C. Report B.B.S.I., Sydney, 44 pp.
Valiela, I. and Teal, J.M., 1979. The nitrogen budget of a saltmarsh ecosystem. Nature (London), 280: 652--656.
Van der Valk, A.G. and Attiwill, P.M., 1983a. Above- and below-ground litter decom- position in an Australian saltmarsh. Aust. J. Ecol., 18: 441--447.
Van der Valk, A.G. and Attiwill, P.M., 1983b. Acetylene reduction in an Avicennia marina community in southern Australia. Aust. J. Bot., 18: 157--164.
Van der Valk, A.G. and Attiwill, P.M., 1984. Decomposition of leaf and root litter of Avicennia marina at Westernport Bay, Victoria, Australia. Aquat. Bot., 18: 205--221.