nitrogen situation & outlook - firt · nitrogen . situation & outlook . glen buckley –...
TRANSCRIPT

Nitrogen Situation & Outlook
Glen Buckley – Chief Economist/Partner NPK Fertilizer Advisory Service
www.npkfas.com November 15, 2011
TFI Fertilizer Outlook Conference St. Petersburg, Florida
Presentation Outline
2
Review of FY11 Nitrogen Outlook Demand S/D Balances Urea UAN Ammonia

U.S. Nitrogen Fertilizer Demand (MM Tons of N)
0.0
2.0
4.0
6.0
8.0
10.0
12.0
14.0
FY06 FY07 FY08 FY09 FY10 FY11
Other
UAN
Urea
Ammonia

U.S. Annual Average Nitrogen Prices ($/Ton – Weighted by Volume)
0
100
200
300
400
500
600
700
02 03 04 05 06 07 08 09 10 11
AmmoniaUreaUAN
Fertilizer Year Basis

0
50
100
150
200
250
300
350
J06 J07 J08 J09 J10 J11
UANUreaAmmoniaCorn Prices
Index of MW Fertilizer Prices
Source: USDA, CBOT
vs. Nearby Corn Futures (Avg. CY ’06=100)
“Strong year driven by primarily by record crop prices”

Nitrogen Outlook

Source: Source: USDA, NPKFAS
U.S. Corn Supply/Demand Scenarios (Million Bushels)
7
Marketing Years (Yr. Beg. - Sept. 1)
USDA NPKFAS Proj. Fct.
2010/11 2011/12 2012/13
Planted Area 88.2 91.9 94.0 Harvested Area 81.4 83.9 87.0 Yield 152.8 146.7 161.5
Beginning Stocks 1,708 1,128 843 Production 12,447 12,310 14,051 Imports 28 15 30
Total Supply 14,183 13,453 14,923
Feed use 4,792 4,600 5,150 Food/Seed/Ind. 6,428 6,410 6,560
Ethanol 5,021 5,000 5,150 Domestic Use 11,220 11,010 11,710 Exports 1,835 1,600 1,950
Total Usage 13,055 12,610 13,660
Ending Stocks 1,128 843 1,263 Stocks/Use 8.6% 6.7% 9.2% Farm Price $5.18 $6.70 $5.25

Source: USDA, NPKFAS
2012 Crop Budgets Clearly Favor Corn ($/Acre)
8
Corn Soybeans Wheat Cotton Revenue Yield (bu/acre) 161.5 43.7 44.7 830.0 Avg. Season Price $5.25 $11.50 $6.00 $0.90 Crop Revenue (per acre) $848 $503 $268 $747 Total Revenue $850 $503 $276 $881 Variable Costs / Acre Fertilizers $135 $24 $48 $85 Seed Costs $92 $62 $14 $85 Crop Protection Chemicals $29 $18 $10 $70 Other (Fuel, Interest, Ins., Etc.) $68 $40 $45 $248 Total Variable Costs $324 $144 $117 $488 Return Over Variable Cost $525 $358 $159 $393

Source: USDA, NPKFAS
Returns Vary Significantly by Location ($/Acre)
9
Corn Heartland Southern Seaboard
Northern Crescent
Revenue Yield (bu/acre) 164.0 117.0 126.0 Avg. Season Price 5.25 6.00 5.30 Crop Revenue (per acre) $862 $702 $669 Total Revenue $862 $702 $674 Variable Costs / Acre Fertilizers $142 $144 $154 Seed Costs $94 $83 $94 Crop Protection Chemicals $32 $28 $26 Other (Fuel, Interest, Ins., Etc.) $56 $64 $69 Total Variable Costs $324 $319 $343 Return Over Variable Cost $539 $383 $330

Source: Census
Percent of Farmland Rented/Leased
11
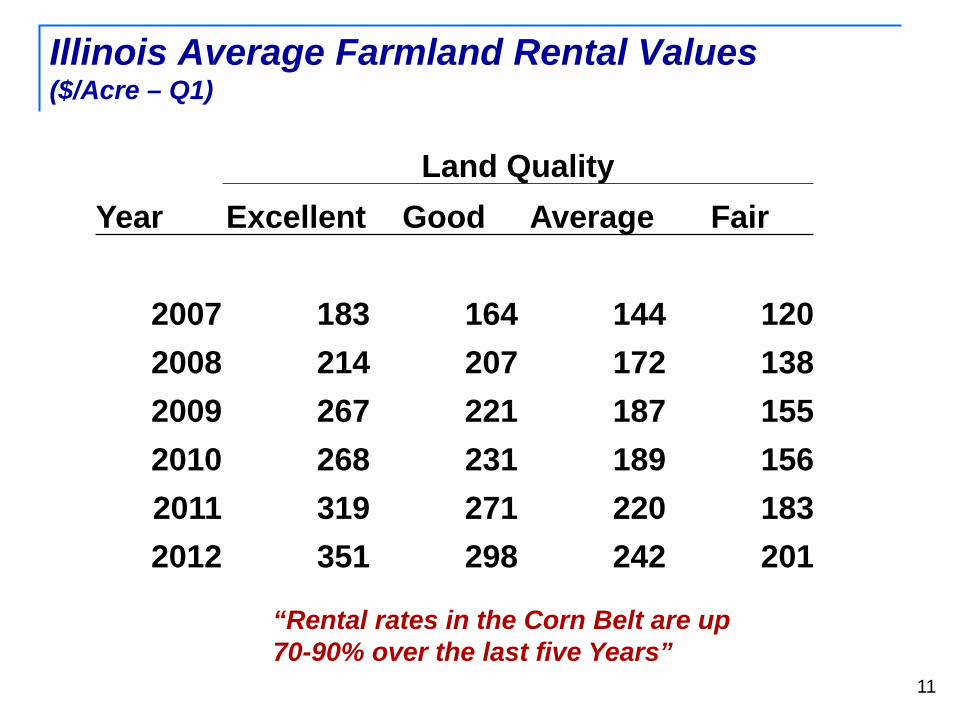
Land Quality Year Excellent Good Average Fair
2007 183 164 144 120 2008 214 207 172 138 2009 267 221 187 155 2010 268 231 189 156 2011 319 271 220 183 2012 351 298 242 201
Illinois Average Farmland Rental Values ($/Acre – Q1)
“Rental rates in the Corn Belt are up 70-90% over the last five Years”

Source: USDA, NPKFAS
Returns Vary Significantly by Location ($/Acre)
12
Corn Heartland Southern Seaboard
Northern Crescent
Revenue Yield (bu/acre) 164 117 126 Avg. Season Price 5.25 6 5.3 Crop Revenue (per acre) $862 $702 $669 Total Revenue $862 $702 $674 Variable Costs / Acre Fertilizers $142 $144 $154 Seed Costs $94 $83 $94 Crop Protection $32 $28 $26 Other (Fuel, Interest, Ins., Etc.) $56 $64 $69
Total Variable Costs $324 $319 $343
Return Over Variable Cost $539 $383 $330
Rental Value $250 $175 $210 Cash Returns Incl. Land $289 $208 $120

Source: USDA, NPKFAS
Corn/Corn vs. Corn/Bean Rotation Decision Not Quite as Clear ($/Acre)
13
Heartland Corn/Bean Corn/Corn Revenue Yield (bu/acre) 163.3 145.3 Avg. Season Price $5.14 $5.14 Crop Revenue (per acre) $838 $746 Total Revenue $840 $748 Variable Costs / Acre Fertilizers $131 $139 Seed Costs $29 $29 Crop Protection Chemicals $88 $93 Other (Fuel, Interest, Ins., Etc.) $71 $71 Total Variable Costs $319 $332 Return Over Variable Cost $521 $416

U.S. Planted Acreage Summary (MM Acres)
Change 2009 2010 2011 2012 2011-12
Corn 86.4 88.2 91.9 94.0 2.1
Soybeans 77.5 77.4 75.0 76.5 1.5
Wheat 59.2 53.6 54.4 59.0 5.6
Cotton 9.2 11.0 14.7 12.0 -2.7
4 Major Crops 232.3 230.2 236.0 241.5 5.5
Other Crops 87.3 91.0 90.0 90.0 0.0 Total Principal Crops 319.6 321.2 326.0 331.5 5.5
Source: USDA, NPKFAS 14

0.0
2.0
4.0
6.0
8.0
10.0
12.0
14.0
95 96 97 98 99 00 01 02 03 04 05 06 07 08 09 10 11 12
U.S. Nitrogen Fertilizer Demand (MM Tons N)
“Demand expected to increase 4.4% to a record 13.3 MM tons”

Source: TFI, AAPFCO, NPKFAS
U.S. Fertilizer Demand by Product (000 Nutrient Tons)
16
Est. Fct. % Change
2010 2011 2012 2011-12
Nitrogen 12,601 12,701 13,262 4.4%
Ammonia 3,571 3,420 3,760 6.4%
Urea 3,389 3,466 3,592 5.0%
UAN 3,519 4,073 3,958 -2.8%

NOAA Long-Term Drought Indicator
Source: NOAA

Above Normal Temp – Below Average Moisture Expected for Much of the South
Source: National Weather Service
Temperature Moisture
Dec-Feb
Mar-May

Non-Commercial Net Long Positions vs. Nearby Corn Contract
0.00
1.00
2.00
3.00
4.00
5.00
6.00
7.00
8.00
9.00
-100-50
050
100150200250300350400
J-06 J-07 J-08 J-09 J-10 J-11
$/Bu. 000 Contracts Non Comm. Net Longs (L Axis)
Nearby Futures Contract (R Axis)
Source: CBOT 19

Fertilizer Supply/Demand Outlook
20
Overview World demand expected to hit record levels
Continued recovery in the U.S. Near Record Demand in India, China, L.A.
S/D for nitrogen is expected to remain in somewhat of a tight position.
However – Supply availability is expected improve over the tight conditions in 2011 as growth in capacity outpaces increase in demand

U.S. and World Nitrogen Demand Driven Mostly by Grains (% of Total N Demand)
Corn 47%
Wheat 11% Cotton
3%
High Value 12%
Other 22%
Source: IFA, NPKFAS
Corn 15%
Wheat 20%
Rice 15%
Other 37%
United States World
21
Fruits/ Vegetables
14%

World Food Consumption (MM Tonnes)
Source: FAO, NPKFAS
2008-18 2000 2008 2018 Volume CAGR
Food Grains 1,194 1,322 1,485 163 1.2% Coarse Grains 875 1,026 1,229 202 1.8% Oilseeds 110 133 167 34 2.3% Roots/Tubers 679 764 875 112 1.4% Fruits & Vegetables 1,221 1,339 1,494 155 1.1% Other 194 247 316 69 2.5% Total 4,274 4,831 5,567 736 1.4%
Beef/Veal 60 67 76 9 1.3% Pork 90 100 115 14 1.4% Poultry 69 84 107 23 2.4% Lamb 11 13 16 3 2.1% Total Meat 230 265 314 50 1.7%
Milk (Cows) 580 648 745 97 1.4%
“World food demand is projected to grow at a CAGR of 1.4%, mostly in the coarse grains and oilseed sectors as consumers in developing countries improve diets.”
22

1200
1400
1600
1800
2000
2200
2400
2600
80 84 88 92 96 00 04 08 12 16 20
Production Consumption
(MM Tonnes) World Grain Supply/Demand

0
500
1000
1500
2000
2500
90 92 94 96 98 00 02 04 06 08 10 12 14 16 18 20
Acreage Yield Improvement
(MM Tonnes)
Source: USDA FAS, FAO, NPKFAS
World Grain Production by Source
Yield increases Will Have to come from: BMP Improved Seed Fertilizer/Crop Protection

0
20
40
60
80
100
120
140
160
2000 2002 2004 2006 2008 2010 2012 2014Source: IFA, NPKFAS
(MM Nutrient Tonnes) World Nitrogen Demand
Industrial/Other
Forecast
Fertilizer
25

World Nitrogen Fertilizer Demand (MM Nutrient Tonnes)
Nitrogen
2006 94.8
2007 99.5
2008 99.1
2009 100.3
2010 101.9 2011 104.7
2012 108.8 %
Change 3.9%
0.0
20.0
40.0
60.0
80.0
100.0
120.0
06 07 08 09 10 11 12

Sources: IFDC, IFA , Industry Reports
World Ammonia/Urea Project List (000 Product Tonnes)
Country Company Month Ammonia Urea CY 2011
Qatar QAFCO 5 October 759 1271 Saudi Arabia Ma'aden Feb 1089 Myanmar Petrochemical Industries January 107 165 Pakistan Engro Chemicals Pakistan Ltd April 750 France GPN February 360 Netherlands Yara July 1155 Pakistan Engro Chemicals Pakistan Ltd April 1300 China Various 5320 7880 2011 Total 8025 12131
CY 2012 Russia CJSC Agro Cherepovets October 495 Algeria EDEOLA 1 October 660 1271 Algeria EDEOLA 2 1271 Algeria Sorfert January 726 1155 Algeria Sorfert July 726
Egypt Egyptian Nitrogen Producing Company (ENPC) 1 April 396 635
Egypt Egyptian Nitrogen Producing Company (ENPC) 2 July 396 635
Qatar QAFCO 5 February 759 1271
Vietnam Ninh Binh Fertilizers & Chemicals (Vinachem) January 330 580
Vietnam Petrovietnam Fertilizer and Chemical Company April 450 787
Australia Incitec Pivot Ltd June 149 Venezuela Pequiven July 594 726 China Various 4581 5950
9767 14776

20.0%
30.0%
40.0%
50.0%
60.0%
70.0%
80.0%
90.0%
100.0%
0
20
40
60
80
100
120
140
160
99 01 03 05 07 09 11 13 15
DemandCapacityOperating Rate
World Nitrogen Supply/Demand Balance Ex China (MM Tonnes N)
28

U.S. Urea Import Requirements for FY2012 (MM Product Tons)
29
Fertilizer Years 2010 2011 Fct. 2012
Demand Ag Consumption 7.37 7.54 7.81 Industrial/Other 1.46 1.86 1.92 Exports 0.16 0.21 0.17
Total Demand 8.99 9.61 9.90 Supply Production 2.97 2.96 3.22 Required Imports 6.04 6.61 6.71
Source: TFI, DOC, NPKFAS

U.S. Urea Imports (000 Product Tons)
0100200300400500600700800900
10001100
J A S O N D J F M A M J
FY10FY11FY12
♦ Source: TFI, DOC, NPKFAS
“Imports running well ahead of last year”

Source: US DOC
U.S. Urea Imports by Source (000 Product Tons)
% of FY 2008 2009 2010 2011 Total
Canada 1,749 1,770 1,896 1,851 28% Offshore Trinidad 474 483 374 424 6% Middle East 1,968 2,225 1,942 2,304 35% China 1,175 254 427 727 11% Egypt 180 242 564 487 7% Other 1,010 778 839 818 12% Sub-Total 4,807 3,981 4,146 4,760 72%
Total 6,556 5,751 6,042 6,611 100%

300
325
350
375
400
425
450
475
500
525
2/4 3/4 4/1 4/29 5/27 6/24 7/22 8/19 9/16 10/14 11/11
U.S. Gulf Price
M. East Del. Cost
“U.S. prices are currently running roughly $30 per ton below Middle East landed values”
U.S. Gulf Urea Barge Price vs. Middle East Delivered Cost ($/ton)
32 ♦ Source: NPKFAS, Industry Sources

0
5
10
15
20
25
30
35
40
06 07 08 09 10 11 12
33
2009 2010 2011 2012
U.S. 4.70 6.32 5.65 6.09 W. Europe 4.63 4.53 3.88 4.24 L. America 5.67 6.62 7.11 6.93 India 5.47 6.10 7.30 6.73 Rest of Asia 8.50 7.85 8.14 7.90 Other 4.48 6.04 5.39 5.01
World Total 33.45 37.46 37.77 37.00
World Urea Imports (MM Product Tonnes – Calendar Year Basis)
“World imports expected to decline marginally in 2012 from the record levels of the previous two years”
♦ Source: IFA, NPKFAS, Country statistics, Industry sources

-300
-200
-100
0
100
200
300
N D J F M A M J
World Urea Trade Balance (000 Tonnes)
Surplus
Deficit
34
“World Balance expected to move into a balanced/long position in 2012”

Chinese Urea Balance (000 Product Tonnes)
0.0
10.0
20.0
30.0
40.0
50.0
60.0
00 02 04 06 08 10 12
ProductionConsumption
35 ♦ Source: IFA, NPKFAS, Industry sources
-1.0
0.0
1.0
2.0
3.0
4.0
5.0
6.0
7.0
8.0
00 02 04 06 08 10 12
Net Exports

FY 2010 2011 2012 Demand Ag Consumption 10.82 12.73 12.37 Exports 0.30 0.22 0.03 Other/Inv. Change -0.24 0.04 -0.02 Total Demand 10.88 12.99 12.38
Supply Production 9.05 9.47 9.63
Required Imports 1.84 3.52 2.75 10.88 12.99 12.38
36
U.S. UAN Import Requirements for FY2012 (MM Product Tons)

U.S. UAN 32% Imports (000 Product Tons)
0
100
200
300
400
500
J A S O N D J F M A M J
FY10FY11FY12
♦ Source: TFI, DOC, NPKFAS
FY Totals
FY06 2.83 FY07 2.39 FY08 3.49 FY09 1.60 FY10 1.84 FY11 3.52 FY12 2.75

U.S. UAN Producer Inventory (000 Product Tons – 32% Material)
0.00
0.20
0.40
0.60
0.80
1.00
1.20
J A S O N D J F M A M J
FY10FY11FY12 Fct5-Yr Average
♦ Source: TFI, DOC, NPKFAS

U.S. UAN Capacity (000 tons 32% Material)
% of Total
FY11 FY12 Capacity Cumulative
CF 6,240 6,490 51.2% 51.2%
PCS 2,023 2,023 16.0% 67.1%
Koch 1,085 1,085 8.6% 75.7%
Agrium 870 870 6.9% 82.5%
CVR 738 738 5.8% 88.4%
LSB 705 705 5.6% 93.9%
Rentech 390 390 3.1% 97.0%
Dyno Nobel 272 272 2.1% 99.1%
Trademark 110 110 0.9% 100.0%
12,433 12,683 100% Source: IFDC

0.02.04.06.08.0
10.012.014.016.018.020.022.0
2005 2006 2007 2008 2009 2010 2011
Prod.
U.S. Ammonia Supply (MM Tons)
Imports
40 ♦ Source: TFI, DOC, NPKFAS Fertilizer Year
“Imports account for roughly 40% of U.S. ammonia supply. However, the vast majority is used in DAP/MAP production and in the industrial sector”

U.S. Tampa Ammonia Import Price vs. MW Wholesale Price ($/ton)
0
100
200
300
400
500
600
700
800
J09 A J O J10 A J O J11 A J O
DifferentialTampa Import $MW Wholesale $

Limited MW Ammonia Supply
42
Lack of Infrastructure to offload and move imports to the Midwest Ag markets Limited Offloading Limited distribution system - Port to MW Limited storage capabilities downstream
Fall S/D - Mostly fixed supply facing potentially another strong application season
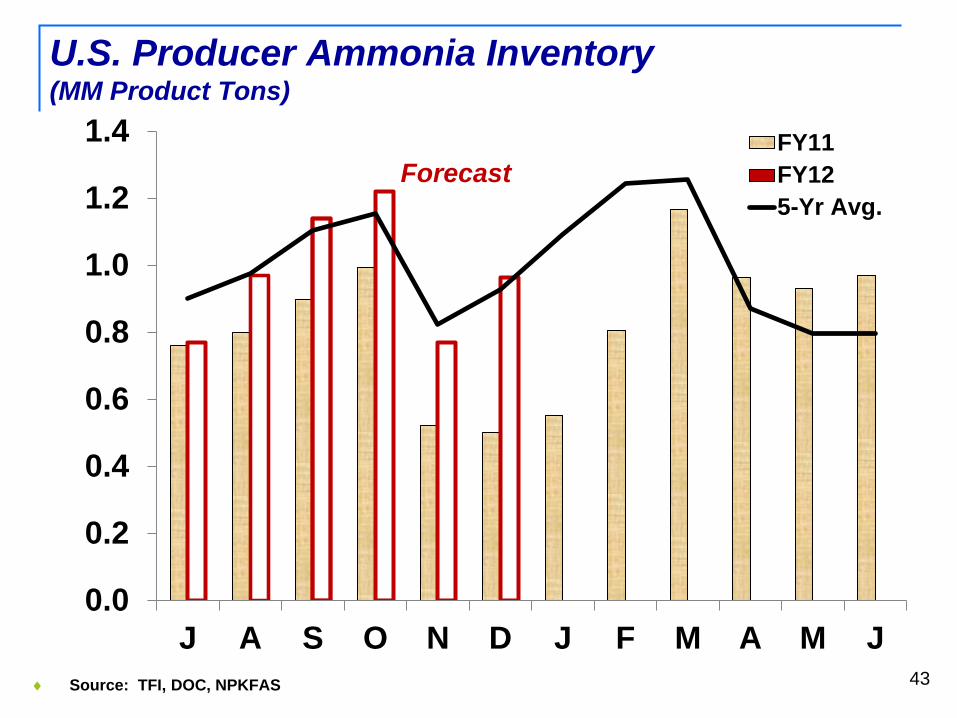
U.S. Producer Ammonia Inventory (MM Product Tons)
0.0
0.2
0.4
0.6
0.8
1.0
1.2
1.4
J A S O N D J F M A M J
FY11FY125-Yr Avg.
Forecast
43 ♦ Source: TFI, DOC, NPKFAS

0.0
1.0
2.0
3.0
4.0
5.0
2004 2005 2006 2007 2008 2009 2010 2011 2012
Fall
U.S. Ammonia Fertilizer Demand (MM Tons)
Spring
44 Fertilizer Year
“Fall demand expected to be down from last year’s near record setting pace, but above historic averages”

Fertilizer Supply/Demand Outlook
45
Overview World demand expected to hit record levels
Continued recovery in the U.S. Near Record Demand in India, China, L.A.
S/D for nitrogen is expected to remain a somewhat of a tight position.
However – Supply availability is expected improve over the tight conditions in 2011 as growth in capacity outpaces increase in demand
