njdep drought management overview - new jersey€¢ causes confusion between us drought monitor,...
TRANSCRIPT
NJDEP Drought Management OverviewOctober 27, 2016
Photo: George M. AronsonPhoto Credit: George M. Aronson
Steve Doughty, Research ScientistDivision of Water Supply & Geoscience
Presented to an advisory committee of the DRBC. Contents should not be published or re-posted in whole or in part withoutthe permission of the author(s) or the DRBC Water Management Advisory
Committee.
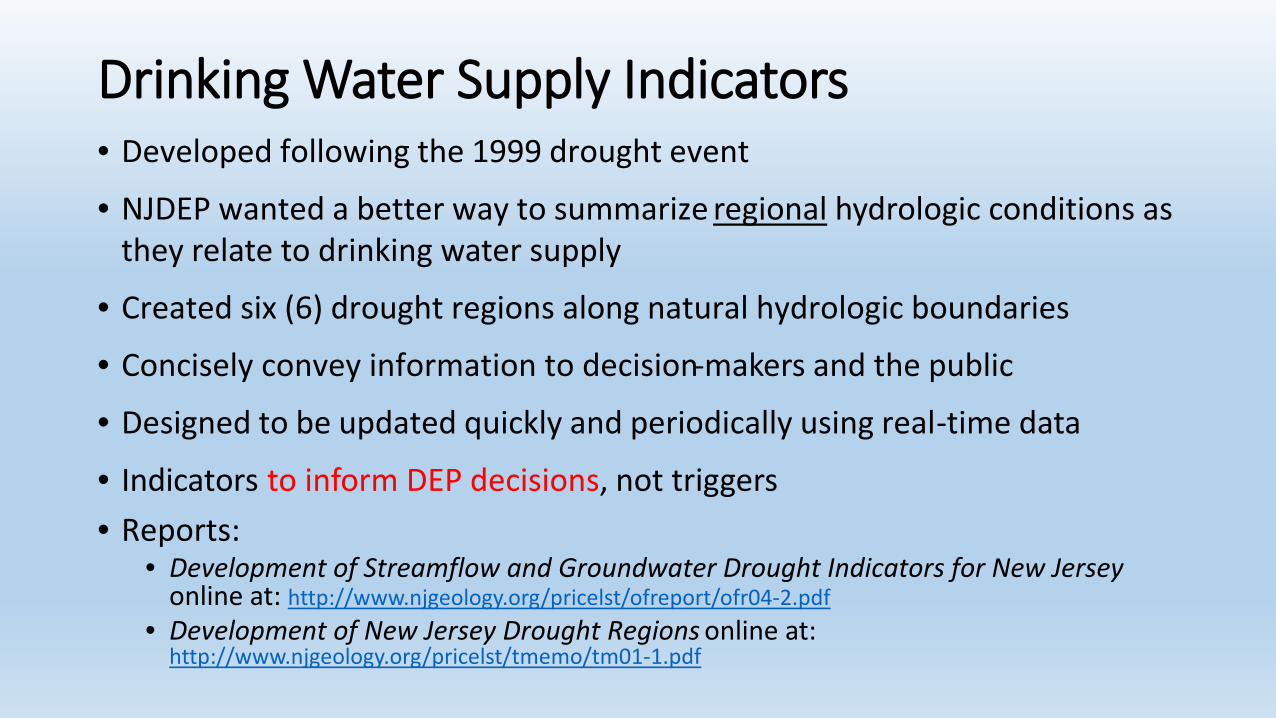
Drinking Water Supply Indicators• Developed following the 1999 drought event
• NJDEP wanted a better way to summarize regional hydrologic conditions as they relate to drinking water supply
• Created six (6) drought regions along natural hydrologic boundaries
• Concisely convey information to decision-makers and the public
• Designed to be updated quickly and periodically using real-time data
• Indicators to inform DEP decisions, not triggers• Reports:
• Development of Streamflow and Groundwater Drought Indicators for New Jerseyonline at: http://www.njgeology.org/pricelst/ofreport/ofr04-2.pdf
• Development of New Jersey Drought Regions online at: http://www.njgeology.org/pricelst/tmemo/tm01-1.pdf
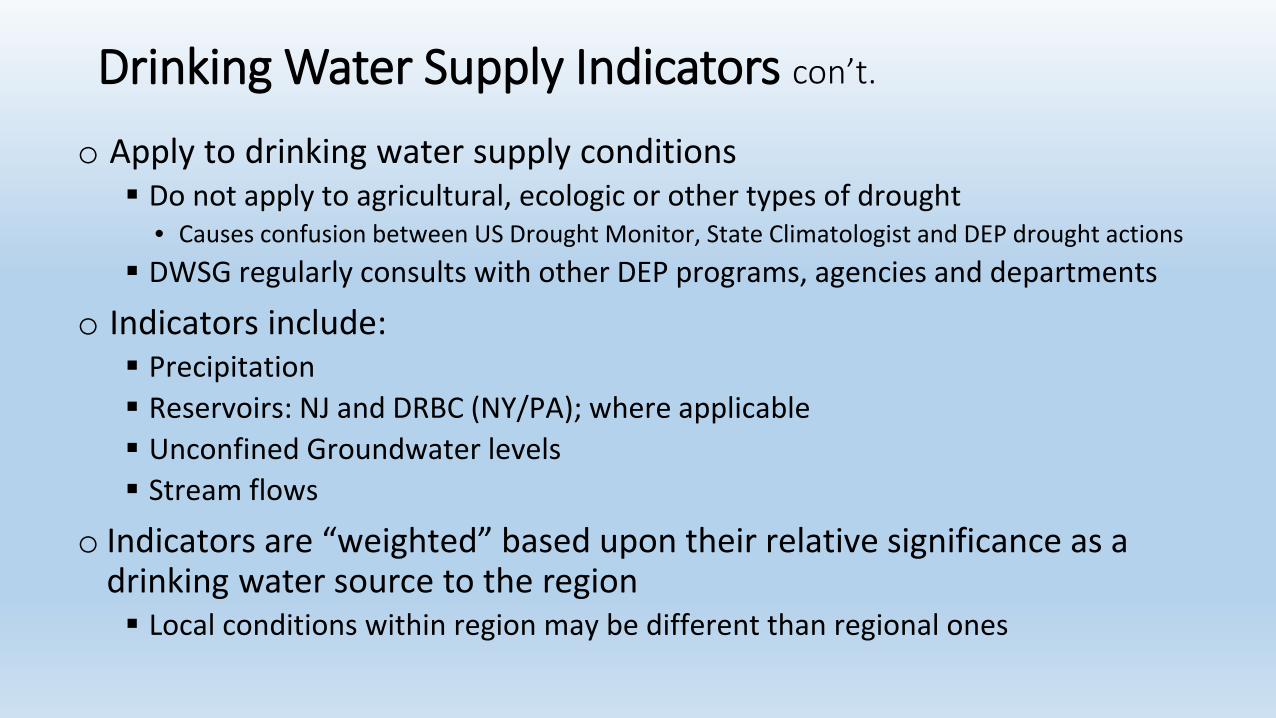
Drinking Water Supply Indicators con’t.
o Apply to drinking water supply conditions Do not apply to agricultural, ecologic or other types of drought
• Causes confusion between US Drought Monitor, State Climatologist and DEP drought actions DWSG regularly consults with other DEP programs, agencies and departments
o Indicators include: Precipitation Reservoirs: NJ and DRBC (NY/PA); where applicable Unconfined Groundwater levels Stream flows
o Indicators are “weighted” based upon their relative significance as a drinking water source to the region Local conditions within region may be different than regional ones

Overall Approach• Precipitation, streamflow and unconfined groundwater indicators
• Analyses determined that the 90-day median, 30th percentile and 10th percentile cumulative departures from average synced with progressive water supply condition impacts
• Generally, a comparison of long-term average vs current/observed• Larger deficits represent dry periods and smaller or negative deficits reflect wetter periods• As deficit gets larger, indicator conditions worsen
• Reservoirs• Compare to long-term averages and model simulations
Ranked as: • Normal or above normal = Green• Moderately dry = Yellow• Severely dry = Orange• Extremely dry = Red

Example Streamflow Indicator
-2500
-2000
-1500
-1000
-500
0
500
1/1/
15
2/1/
15
3/1/
15
4/1/
15
5/1/
15
6/1/
15
7/1/
15
8/1/
15
9/1/
15
10/1
/15
11/1
/15
12/1
/15
Cum
ulat
ive
Stre
amflo
w D
efic
it (c
fs)
Median 30th Percentile 10th Percentile Observed 90 Day Deficit
Use average of 3 stream gages per region to set indicator status
Near or above normal
Slightly below normal
Extremely dry
Severely dry

Example Groundwater Indicator
Use average of 3 unconfined aquifer wells per region to set indicator status
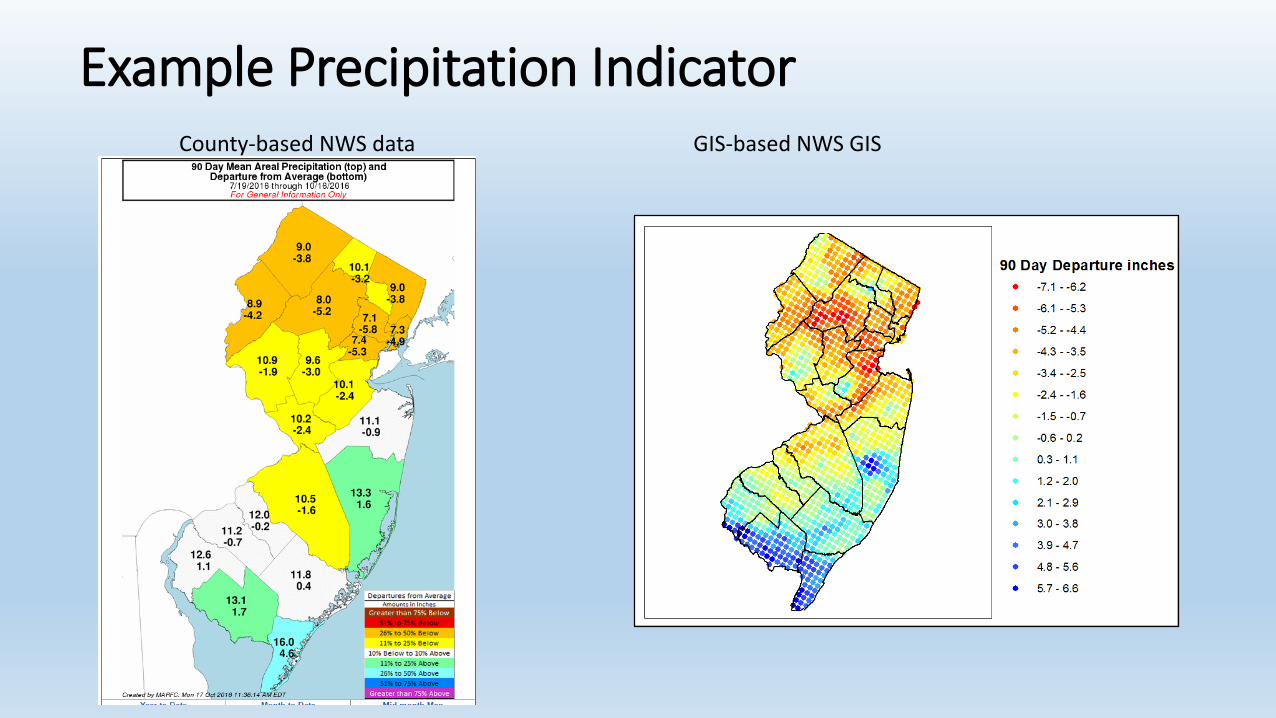
Example Precipitation IndicatorCounty-based NWS data GIS-based NWS GIS
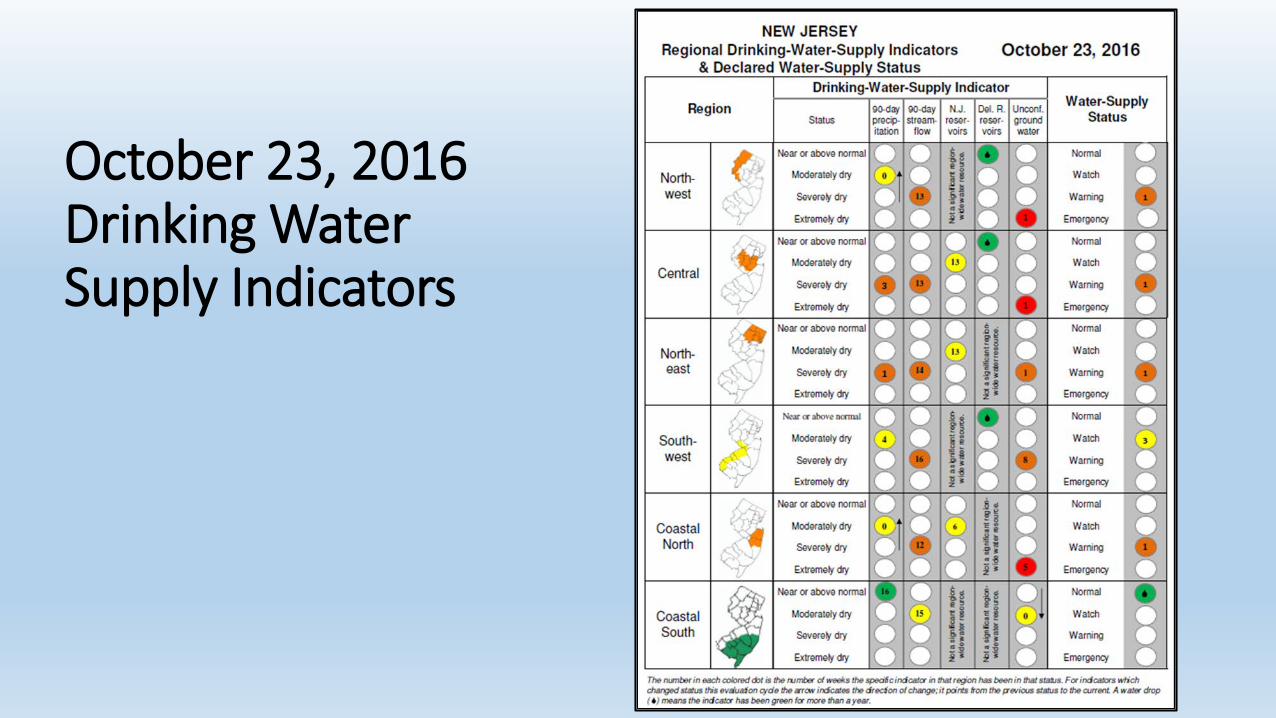
October 23, 2016Drinking Water Supply Indicators
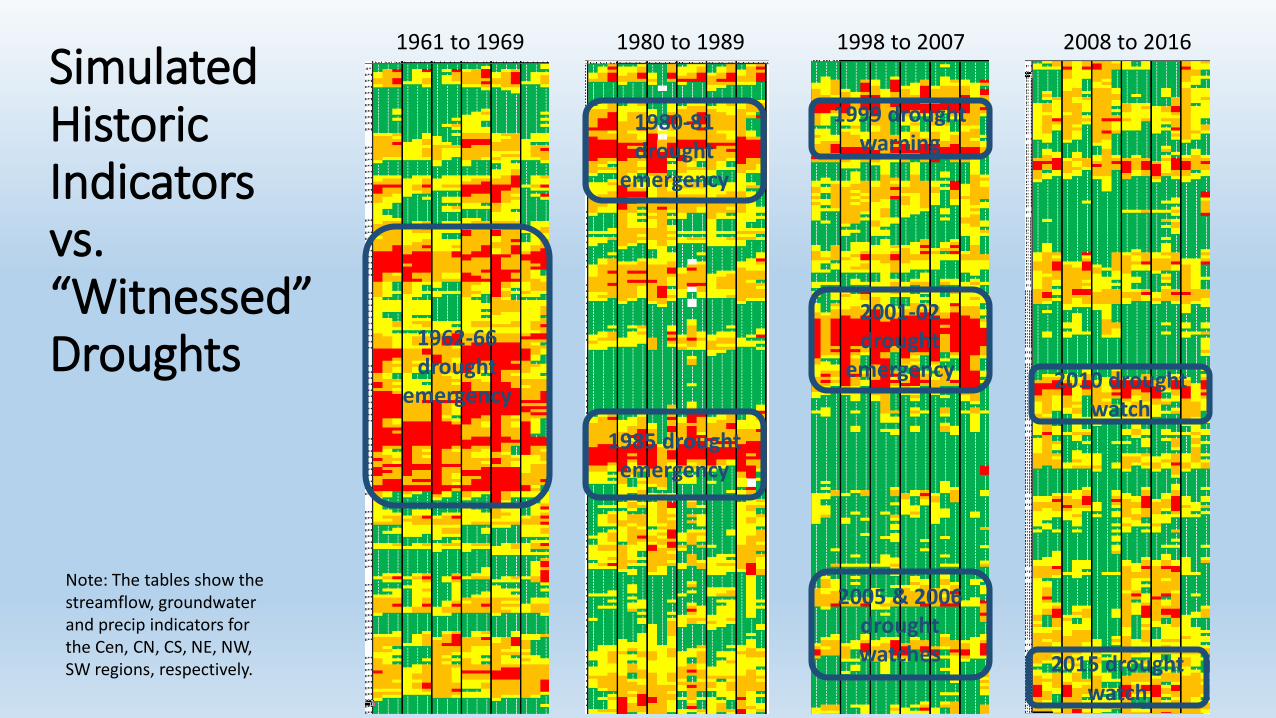
Simulated Historic Indicatorsvs.“Witnessed” Droughts
1961 to 1969 1980 to 1989 1998 to 2007 2008 to 2016
1962-66 drought
emergency
1980-81 drought
emergency
1985 drought emergency
1999 drought warning
2001-02 drought
emergency 2010 drought watch
2015 drought watch
2005 & 2006 drought watches
Note: The tables show the streamflow, groundwater and precip indicators for the Cen, CN, CS, NE, NW, SW regions, respectively.

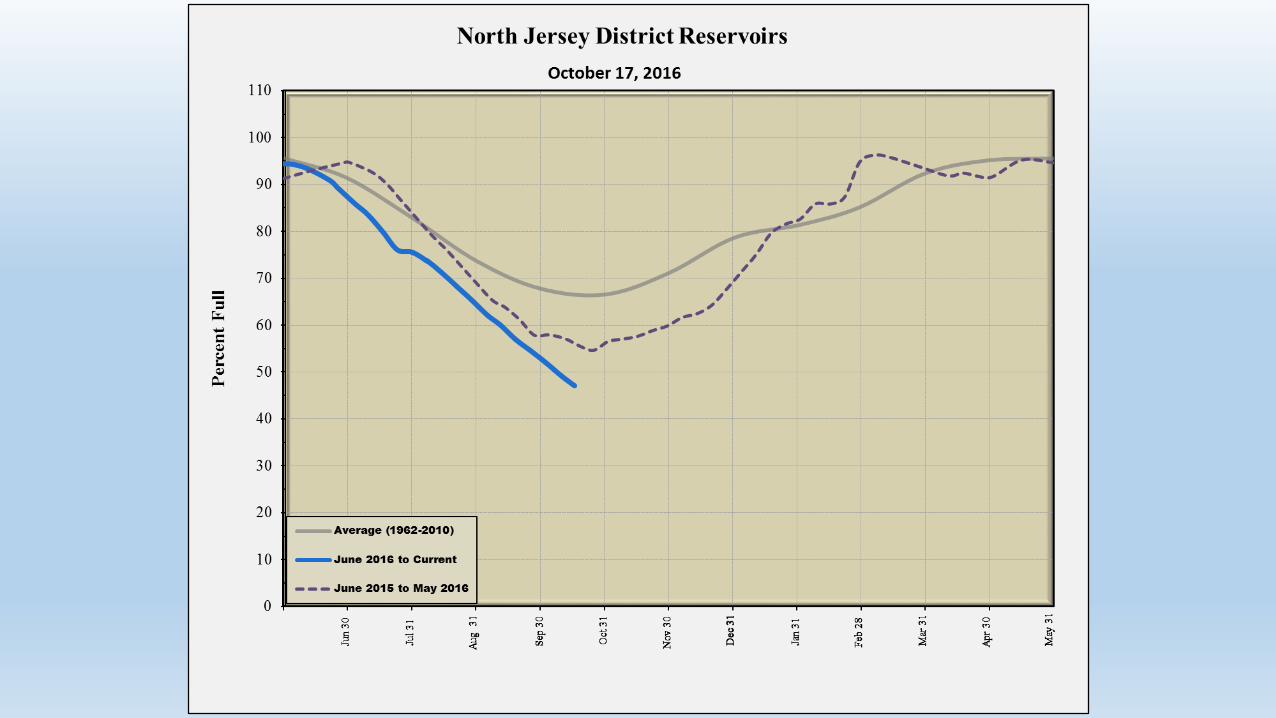
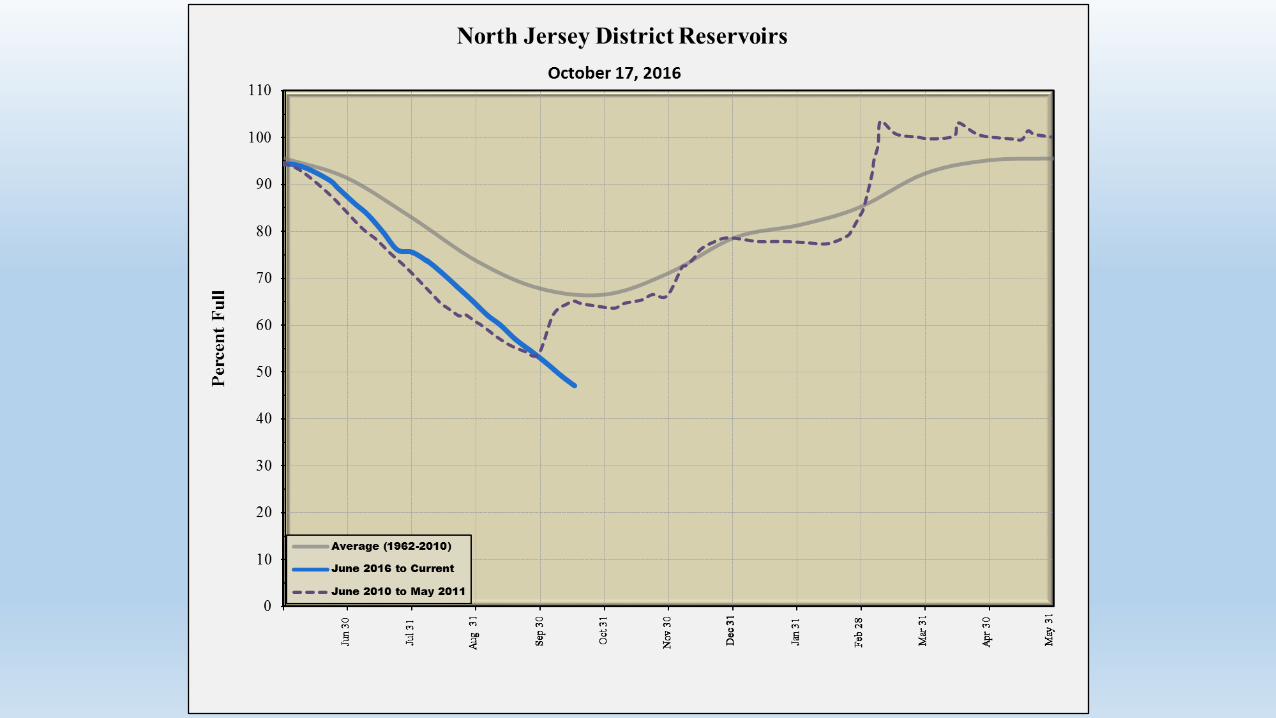
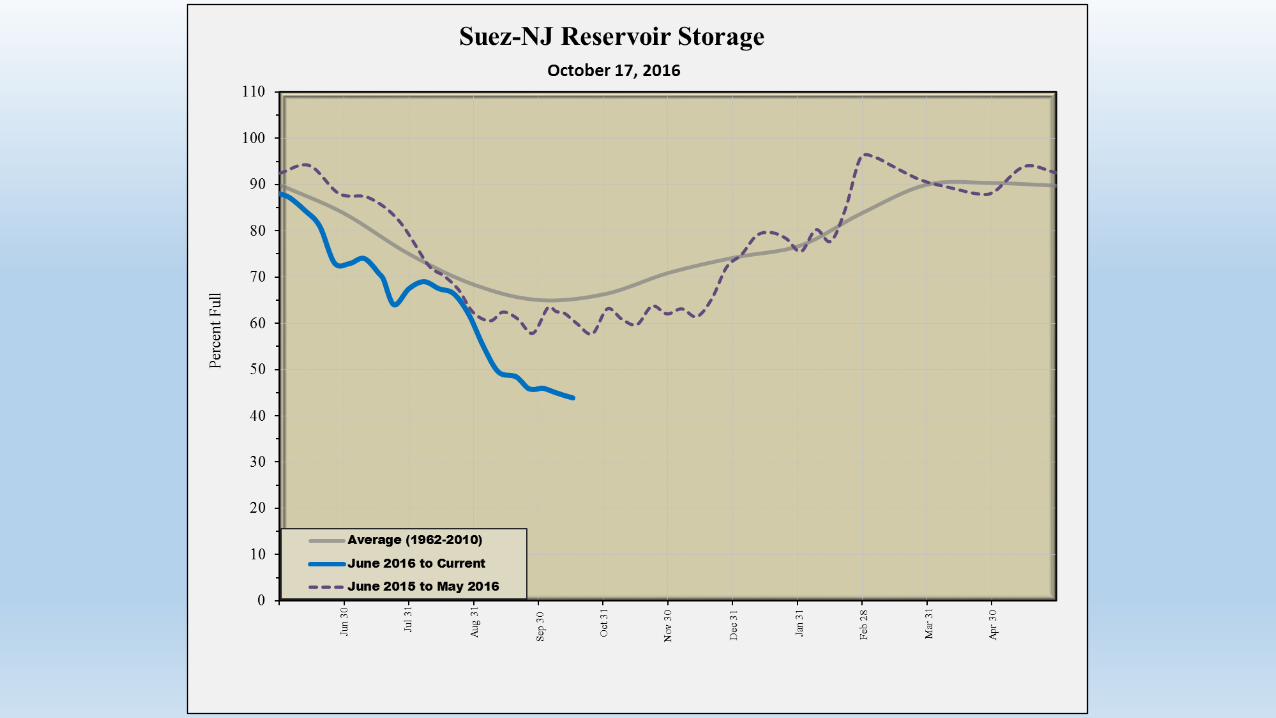
Reservoir Storage in the Regions

Reservoir Indicators
• Northeast: 6 major surface water purveyors, ~72 BG
• Central: 1 major surface water purveyor, ~66 BG
• Coastal North: 4 major surface water purveyors, ~8.5 BG
• Northwest & Southwest: PA & NYC DRBC reservoirs
• Several other “smaller” sources


Declared Water Supply Status
• Determined using all available data
• Status and Trend of indicators• Time of year• Precipitation/Temperature forecasts
• Water demands
• Water Supplier input• Other agencies, states
• Best Professional Judgement

2002 Drought Warning
2002 Drought
Emergency
2016 Drought Warning
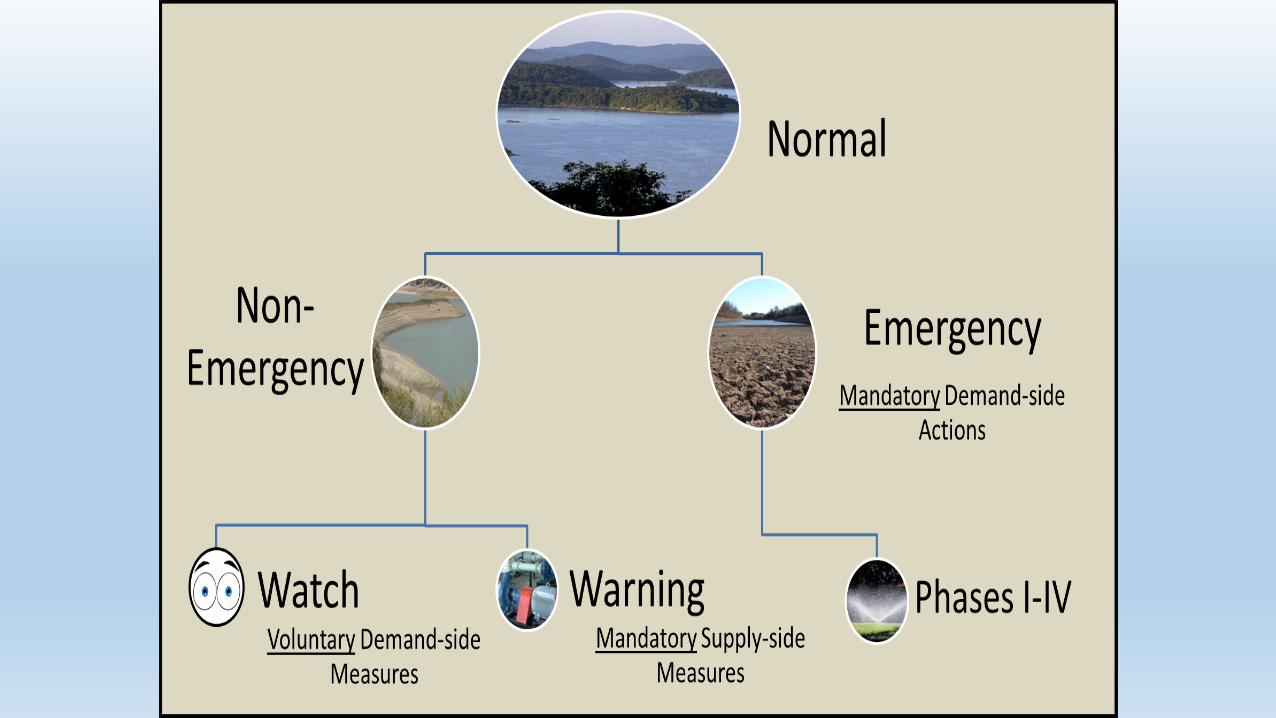

So, what is a Drought Warning anyway?• Drought Warning is a non-emergency phase of managing available water supplies as drought
conditions persist
• The aim of Drought Warning is to reduce the likelihood of a more serious water shortage, which in turn could lead to a Water Emergency
• Under Drought Warning, the DEP may direct any of the following types of actions:
Develop alternative sources of water
Complete interconnections between systems
Transfer water between systems or regions of the State
Other modifications or measures to ensure an adequate water supply
Mandatory water use restrictions are not imposed under a Warning; however, the public is urged to use water sparingly in the affected areas
• A Water Emergency includes:• Mandatory water use restrictions – residential, commercial/industrial
• Water use rationing
• Selective Curtailment - potentially drastic measures (to preserve public health and safety)

Drought Warning Measures• Primary goal is to preserve storage and balance supplies within the
affected region(s)
• Objective is to achieve parity among supply sources so that they are drawn down uniformly until normal rainfall resumes
• Specific types of measures –
Transfers of water between individual systems
Water transfers between regions (e.g. Central to Northeast)
Water service substitutions
Temporary modifications of reservoir releases and regulated stream passing flows
• Coordinated with other DEP programs (DWQ and Fish & Wildlife) to ensure no adverse impacts occur
• DEP is only able to limit water demands under a Water Emergency declared by the governor
