nl4dv: a toolkit for generating analytic specifications for
TRANSCRIPT

© 2020 IEEE. This is the author’s version of the article that has been published in IEEE Transactions on Visualization andComputer Graphics. The final version of this record is available at: xx.xxxx/TVCG.201x.xxxxxxx/
NL4DV: A Toolkit for Generating Analytic Specificationsfor Data Visualization from Natural Language Queries
Arpit Narechania*, Arjun Srinivasan*, and John Stasko
Create a histogram showing distribution of IMDB ratings
Show average gross across genres for science fiction and fantasy movies
Visualize rating and budget
a b
NL4
DV
c
Attribute(s)
Visualization(s)
Task(s)
Attribute(s)
Visualization(s)
Task(s)
Attribute(s)
Visualization(s)
Task(s)
IMDB Rating
Distribution
Histogram
- Derived Value (Attribute = Worldwide Gross; Operation = AVG)
- Filter (Attribute = Creative Type; Values = Science Fiction, Fantasy;)
Bar Chart
IMDB Rating, Content Rating, Rotten Tomatoes Rating, Production Budget
- Correlation (Attributes = [IMDB Rating, Production
Budget], [Rotten Tomatoes Rating, Production Budget])
- Derived Value (Attributes = Production Budget; Operation = AVG)
Scatterplot, Bar Chart
Worldwide Gross, Genre,Creative Type
Movies
Fig. 1: Examples illustrating the flexibility of natural language queries for specifying data visualizations. NL4DV processesall three query variations, inferring explicit , partially explicit or ambiguous , and implicit references to attributes, tasks, andvisualizations. The corresponding visualizations suggested by NL4DV in response to the individual queries are also shown.
Abstract— Natural language interfaces (NLIs) have shown great promise for visual data analysis, allowing people to flexibly specifyand interact with visualizations. However, developing visualization NLIs remains a challenging task, requiring low-level implementationof natural language processing (NLP) techniques as well as knowledge of visual analytic tasks and visualization design. We presentNL4DV, a toolkit for natural language-driven data visualization. NL4DV is a Python package that takes as input a tabular dataset anda natural language query about that dataset. In response, the toolkit returns an analytic specification modeled as a JSON objectcontaining data attributes, analytic tasks, and a list of Vega-Lite specifications relevant to the input query. In doing so, NL4DV aidsvisualization developers who may not have a background in NLP, enabling them to create new visualization NLIs or incorporate naturallanguage input within their existing systems. We demonstrate NL4DV’s usage and capabilities through four examples: 1) renderingvisualizations using natural language in a Jupyter notebook, 2) developing a NLI to specify and edit Vega-Lite charts, 3) recreating dataambiguity widgets from the DataTone system, and 4) incorporating speech input to create a multimodal visualization system.
Index Terms—Natural Language Interfaces; Visualization Toolkits;
1 INTRODUCTION
Natural language interfaces (NLIs) for visualization are becoming in-creasingly popular in both academic research (e.g., [13, 22, 46, 52, 69])as well as commercial software [34, 55]. At a high-level, visualizationNLIs allow people to pose data-related queries and generate visual-izations in response to those queries. To generate visualizations fromnatural language (NL) queries, NLIs first model the input query interms of data attributes and low-level analytic tasks [1, 9] (e.g., filter,correlation, trend). Using this information, the systems then determinewhich visualizations are most suited as a response to the input query.While NLIs provide flexibility in posing data-related questions, inherentcharacteristics of NL such as ambiguity and underspecification makeimplementing NLIs for data visualization a challenging task.
• Arpit Narechania, Arjun Srinivasan, and John Stasko are from the GeorgiaInstitute of Technology, Atlanta, GA (USA). E-mail: {arpitnarechania,arjun010}@gatech.edu, [email protected].
• *Authors contributed equally.
Manuscript received xx xxx. 201x; accepted xx xxx. 201x. Date of Publicationxx xxx. 201x; date of current version xx xxx. 201x. For information onobtaining reprints of this article, please send e-mail to: [email protected] Object Identifier: xx.xxxx/TVCG.201x.xxxxxxx
To create visualization NLIs, besides implementing a graphical userinterface (GUI) and rendering views, visualization system developersmust also implement a natural language processing (NLP) module tointerpret queries. Although there exist tools to support GUI and visu-alization design (e.g., D3.js [6], Vega-Lite [43]), developers currentlyhave to implement custom modules for query interpretation. However,for developers without experience with NLP techniques and toolkits(e.g., NLTK [31], spaCy [21]), implementing this pipeline is non-trivial,requiring them to spend significant time and effort in learning andimplementing different NLP techniques.
Consider the spectrum of queries in Figure 1 issued to create vi-sualizations in the context of an IMDb movies dataset with differentattributes including the Û Worldwide Gross, ~ Genre, and � ReleaseYear, among others (for consistency, we use this movies dataset forexamples throughout this paper). The query “Create a histogram show-ing distribution of IMDB ratings” (Figure 1a) explicitly refers to a dataattribute (IMDB Rating), a low-level analytic task (Distribution), andrequests a specific visualization type (Histogram). This is an ideal inter-pretation scenario from a system standpoint since the query explicitlylists all components required to generate a visualization.
On the other hand, the second query “Show average gross acrossgenres for science fiction and fantasy movies” (Figure 1b) does notexplicitly state the visualization type or the attribute Creative Type.
1

Instead, it explicitly references the attributes Worldwide Gross andGenre through ‘gross’ and ‘genres’, and implicitly refers to the CreativeType through the values ‘science fiction’ and ‘fantasy’. Furthermore,by specifying data values for the Creative Type attribute and the word‘average,’ the query also mentions two intended analytic tasks: Filteringand computing Derived Values, respectively. This second query ismore challenging since it requires the system to implicitly infer one ofthe attributes and then determine the visualization type based on theidentified attributes and tasks.
Finally, the third query “Visualize rating and budget” (Figure 1c) iseven more challenging to interpret since it neither explicitly states thedesired visualization type nor the intended analytic task. Furthermore,while it explicitly references one attribute (Production Budget through‘budget’), the reference to the second attribute is ambiguous (‘rating’can map to IMDB Rating, Content Rating, or Rotten Tomatoes Rating).
To accommodate such query variations, visualization NLIs employsophisticated NLP techniques (e.g., dependency parsing, semantic wordmatching) to identify relevant information from the query and buildupon visualization concepts (e.g., analytic tasks) and design principles(e.g., choosing graphical encodings based on attribute types) to generateappropriate visualizations. For instance, given the query in Figure 1b,after detecting the data attributes and analytic tasks, a visualizationNLI should select a visualization (e.g., bar chart) that is well-suited tosupport the task of displaying Derived Values (average) for WorldwideGross (a quantitative attribute) across different Genres (a nominalattribute). Similarly, in the scenario in Figure 1c, a NLI must first detectambiguities in the input query attributes, determine the visualizationssuited to present those attribute combinations (e.g., scatterplot for twoquantitative attributes), and ultimately infer the analytic tasks basedon those attributes and visualizations (e.g., a scatterplot may imply theuser is interested in finding correlations).
To support prototyping NLIs for data visualization, we contribute theNatural Language-Driven Data Visualization (NL4DV) toolkit. NL4DVis a Python package that developers can initialize with a tabular dataset.Once initialized, NL4DV processes subsequent NL queries about thedataset, inferring data attributes and analytic tasks from those queries.Additionally, using built-in mappings between attributes, tasks, andvisualizations, NL4DV also returns an ordered list of Vega-Lite spec-ifications relevant to those queries. By providing a high-level API totranslate NL queries to visualizations, NL4DV abstracts out the coretask of interpreting NL queries and provides task-based visualizationrecommendations as plug-and-play functionality. Using NL4DV, de-velopers can create new visualization NLIs as well as incorporate NLquerying capabilities into their existing visualization systems.
In this paper, we discuss NL4DV’s design goals and describe howthe toolkit infers data attributes, analytic tasks, and visualization spec-ifications from NL queries. Furthermore, we formalize the inferredinformation into a JSON-based analytic specification that can be pro-grammatically parsed by visualization developers. Finally, throughexample applications, we showcase how this formalization can help:1) implement visualization NLIs from scratch, 2) incorporate NL in-put into an existing visualization system, and 3) support visualizationspecification in data science programming environments.
To support development of future systems, we also provide NL4DVand the described applications as open-source software available at:https://nl4dv.github.io/nl4dv/
2 RELATED WORK
2.1 Natural Language Interfaces for Data VisualizationIn 2001, Cox et al. [10] presented an initial prototype of a NLI thatsupported using well-structured commands to specify visualizations.Since then, given the advent of NL understanding technology and NLIsfor databases (e.g., [4,17,20,29,39,40,60,71]), there has been a surge ofNLIs for data visualization [13,22,24,25,27,46,47,49,50,52,54,69], es-pecially in recent years. Srinivasan and Stasko [51] summarize a subsetof these NLIs, characterizing systems based on their supported capa-bilities including visualization-focused capabilities (e.g., specifying orinteracting with visualizations), data-focused capabilities (e.g., com-putationally answering questions about a dataset), and system control-
focused capabilities (e.g., augmenting graphical user interface actionslike moving windows with NL). Along these lines, NL4DV’s currentfocus is primarily to support visualization specification. With this scopein mind, below we highlight systems that serve as the motivation forNL4DV’s development and are most relevant to our work.
Articulate [54] is a visualization NLI that allows people to generatevisualizations by deriving mappings between tasks and data attributes inuser queries. DataTone [13] uses a combination of lexical, constituency,and dependency parsing to let people specify visualizations through NL.Furthermore, detecting ambiguities in the input query, DataTone lever-ages mixed-initiative interaction to resolve these ambiguities throughGUI widgets such as dropdown menus. FlowSense [69] uses seman-tic parsing techniques to support NL interaction within a dataflowsystem, allowing people to specify and connect components withoutlearning the intricacies of operating a dataflow system. Eviza [46]incorporates a probabilistic grammar-based approach and a finite statemachine to allow people to interact with a given visualization. Ex-tending Eviza’s capabilities and incorporating additional pragmaticsconcepts, Evizeon [22] allows both specifying and interacting withvisualizations through standalone and follow-up utterances. The ideasin Eviza and Evizeon were also used to design the Ask Data feature inTableau [55]. Ask Data internally uses Arklang [47], an intermediatelanguage developed to describe NL queries in a structured format thatTableau’s VizQL [53] can parse to generate visualizations.
The aforementioned systems all present different interfaces and ca-pabilities, supporting NL interaction through grammar- and/or lexical-parsing techniques. A commonality in their underlying NLP pipeline,however, is the use of data attributes and analytic tasks (e.g., correlation,distribution) to determine user intent for generating the system response.Building upon this central observation and prior system implementa-tions (e.g., string similarity metrics and thresholds [13, 46, 52], parsingrules [13, 25, 69]), NL4DV uses a combination of lexical and depen-dency parsing-based techniques to infer attributes and tasks from NLqueries. However, unlike previous systems that implement custom NLPengines and languages that translate NL queries into system actions,we develop NL4DV as an interface-agnostic toolkit. In doing so, weformalize attributes and tasks inferred from a NL query into a structuredJSON object that can be programmatically parsed by developers.
2.2 Visualization Toolkits and Grammars
Fundamentally, our research falls under the broad category of user inter-face toolkits [28, 37, 38]. As such, instead of presenting a single noveltechnique or interface, we place emphasis on reducing developmentviscosity, lowering development skill barriers, and enabling replicationand creative exploration. Within visualization research, there exist anumber of visualization toolkits with similar goals that particularlyfocus on easing development effort for specifying and rendering visual-izations. Examples of such toolkits include Prefuse [19], Protovis [5],and D3 [6]. With the advent of visualizations on alternative platformslike mobile devices and AR/VR, a new range of toolkits are also beingcreated to assist visualization development on these contemporary plat-forms. For instance, EasyPZ.js [45] supports incorporating navigationtechniques (pan and zoom) in web-based visualizations across bothdesktops and mobile devices. Toolkits like DXR [48] enable develop-ment of expressive and interactive visualizations in Unity [57] that canbe deployed in AR/VR environments. NL4DV extends this line of workon toolkits for new modalities and platforms by making it easier forvisualization system developers to interpret NL queries without havingto learn or implement NLP techniques.
Besides toolkits that aid programmatically creating visualizations,researchers have also formulated visualization grammars that providea high-level abstraction for building visualizations to reduce softwareengineering know-how [18]. Along these lines, based on the Grammarof Graphics [62], more recently developed visualization grammarssuch as Vega [44] and Vega-Lite [43] support visualization designthrough declarative specifications, enabling rapid visualization designand prototyping. NL4DV’s primary goal is to return visualizationsin response to NL queries. To enable this, in addition to a structuredrepresentation of attributes and tasks inferred from a query, NL4DV
2
© 2020 IEEE. This is the author’s version of the article that has been published in IEEE Transactions on Visualization andComputer Graphics. The final version of this record is available at: xx.xxxx/TVCG.201x.xxxxxxx/
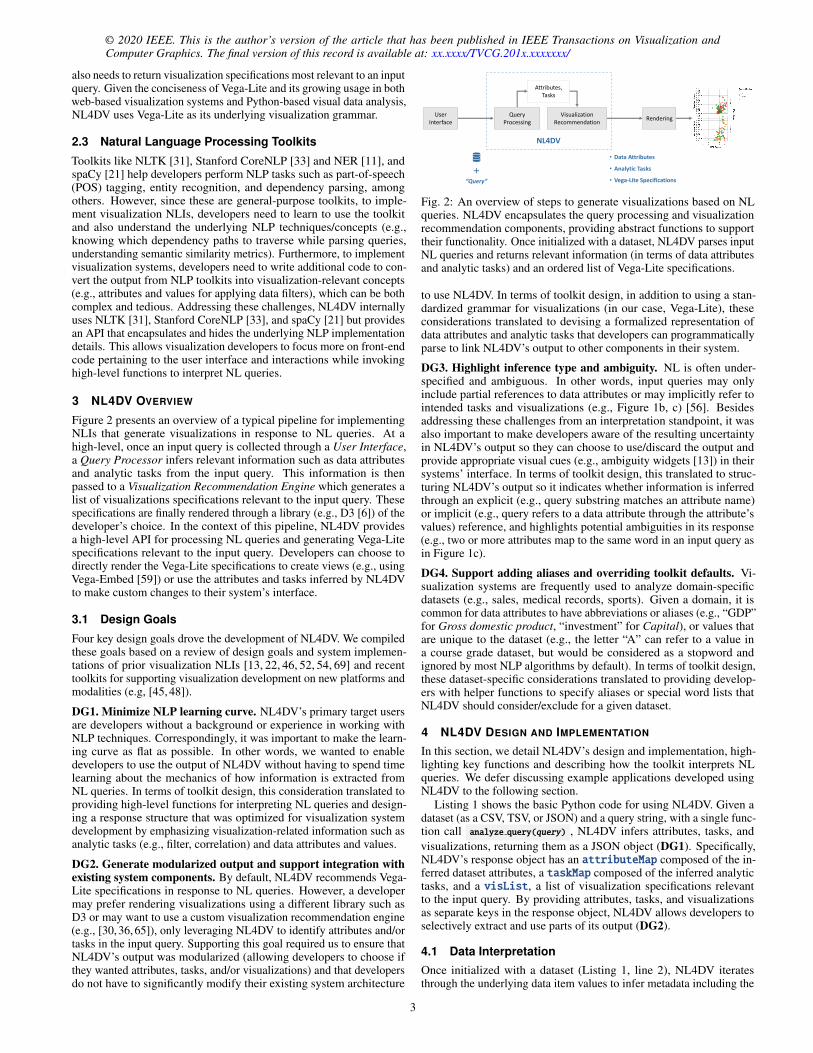
also needs to return visualization specifications most relevant to an inputquery. Given the conciseness of Vega-Lite and its growing usage in bothweb-based visualization systems and Python-based visual data analysis,NL4DV uses Vega-Lite as its underlying visualization grammar.
2.3 Natural Language Processing Toolkits
Toolkits like NLTK [31], Stanford CoreNLP [33] and NER [11], andspaCy [21] help developers perform NLP tasks such as part-of-speech(POS) tagging, entity recognition, and dependency parsing, amongothers. However, since these are general-purpose toolkits, to imple-ment visualization NLIs, developers need to learn to use the toolkitand also understand the underlying NLP techniques/concepts (e.g.,knowing which dependency paths to traverse while parsing queries,understanding semantic similarity metrics). Furthermore, to implementvisualization systems, developers need to write additional code to con-vert the output from NLP toolkits into visualization-relevant concepts(e.g., attributes and values for applying data filters), which can be bothcomplex and tedious. Addressing these challenges, NL4DV internallyuses NLTK [31], Stanford CoreNLP [33], and spaCy [21] but providesan API that encapsulates and hides the underlying NLP implementationdetails. This allows visualization developers to focus more on front-endcode pertaining to the user interface and interactions while invokinghigh-level functions to interpret NL queries.
3 NL4DV OVERVIEW
Figure 2 presents an overview of a typical pipeline for implementingNLIs that generate visualizations in response to NL queries. At ahigh-level, once an input query is collected through a User Interface,a Query Processor infers relevant information such as data attributesand analytic tasks from the input query. This information is thenpassed to a Visualization Recommendation Engine which generates alist of visualizations specifications relevant to the input query. Thesespecifications are finally rendered through a library (e.g., D3 [6]) of thedeveloper’s choice. In the context of this pipeline, NL4DV providesa high-level API for processing NL queries and generating Vega-Litespecifications relevant to the input query. Developers can choose todirectly render the Vega-Lite specifications to create views (e.g., usingVega-Embed [59]) or use the attributes and tasks inferred by NL4DVto make custom changes to their system’s interface.
3.1 Design Goals
Four key design goals drove the development of NL4DV. We compiledthese goals based on a review of design goals and system implemen-tations of prior visualization NLIs [13, 22, 46, 52, 54, 69] and recenttoolkits for supporting visualization development on new platforms andmodalities (e.g, [45, 48]).
DG1. Minimize NLP learning curve. NL4DV’s primary target usersare developers without a background or experience in working withNLP techniques. Correspondingly, it was important to make the learn-ing curve as flat as possible. In other words, we wanted to enabledevelopers to use the output of NL4DV without having to spend timelearning about the mechanics of how information is extracted fromNL queries. In terms of toolkit design, this consideration translated toproviding high-level functions for interpreting NL queries and design-ing a response structure that was optimized for visualization systemdevelopment by emphasizing visualization-related information such asanalytic tasks (e.g., filter, correlation) and data attributes and values.
DG2. Generate modularized output and support integration withexisting system components. By default, NL4DV recommends Vega-Lite specifications in response to NL queries. However, a developermay prefer rendering visualizations using a different library such asD3 or may want to use a custom visualization recommendation engine(e.g., [30, 36, 65]), only leveraging NL4DV to identify attributes and/ortasks in the input query. Supporting this goal required us to ensure thatNL4DV’s output was modularized (allowing developers to choose ifthey wanted attributes, tasks, and/or visualizations) and that developersdo not have to significantly modify their existing system architecture
User Interface
RenderingVisualization
RecommendationQuery
Processing
Attributes, Tasks
NL4DV
• Data Attributes
• Analytic Tasks
• Vega-Lite Specifications+
“Query”
Fig. 2: An overview of steps to generate visualizations based on NLqueries. NL4DV encapsulates the query processing and visualizationrecommendation components, providing abstract functions to supporttheir functionality. Once initialized with a dataset, NL4DV parses inputNL queries and returns relevant information (in terms of data attributesand analytic tasks) and an ordered list of Vega-Lite specifications.
to use NL4DV. In terms of toolkit design, in addition to using a stan-dardized grammar for visualizations (in our case, Vega-Lite), theseconsiderations translated to devising a formalized representation ofdata attributes and analytic tasks that developers can programmaticallyparse to link NL4DV’s output to other components in their system.
DG3. Highlight inference type and ambiguity. NL is often under-specified and ambiguous. In other words, input queries may onlyinclude partial references to data attributes or may implicitly refer tointended tasks and visualizations (e.g., Figure 1b, c) [56]. Besidesaddressing these challenges from an interpretation standpoint, it wasalso important to make developers aware of the resulting uncertaintyin NL4DV’s output so they can choose to use/discard the output andprovide appropriate visual cues (e.g., ambiguity widgets [13]) in theirsystems’ interface. In terms of toolkit design, this translated to struc-turing NL4DV’s output so it indicates whether information is inferredthrough an explicit (e.g., query substring matches an attribute name)or implicit (e.g., query refers to a data attribute through the attribute’svalues) reference, and highlights potential ambiguities in its response(e.g., two or more attributes map to the same word in an input query asin Figure 1c).
DG4. Support adding aliases and overriding toolkit defaults. Vi-sualization systems are frequently used to analyze domain-specificdatasets (e.g., sales, medical records, sports). Given a domain, it iscommon for data attributes to have abbreviations or aliases (e.g., “GDP”for Gross domestic product, “investment” for Capital), or values thatare unique to the dataset (e.g., the letter “A” can refer to a value ina course grade dataset, but would be considered as a stopword andignored by most NLP algorithms by default). In terms of toolkit design,these dataset-specific considerations translated to providing develop-ers with helper functions to specify aliases or special word lists thatNL4DV should consider/exclude for a given dataset.
4 NL4DV DESIGN AND IMPLEMENTATION
In this section, we detail NL4DV’s design and implementation, high-lighting key functions and describing how the toolkit interprets NLqueries. We defer discussing example applications developed usingNL4DV to the following section.
Listing 1 shows the basic Python code for using NL4DV. Given adataset (as a CSV, TSV, or JSON) and a query string, with a single func-tion call analyze query(query) , NL4DV infers attributes, tasks, andvisualizations, returning them as a JSON object (DG1). Specifically,NL4DV’s response object has an attributeMap composed of the in-ferred dataset attributes, a taskMap composed of the inferred analytictasks, and a visList, a list of visualization specifications relevantto the input query. By providing attributes, tasks, and visualizationsas separate keys in the response object, NL4DV allows developers toselectively extract and use parts of its output (DG2).
4.1 Data InterpretationOnce initialized with a dataset (Listing 1, line 2), NL4DV iteratesthrough the underlying data item values to infer metadata including the
3

1 from nl4dv import NL4DV2 nl4dv_instance = NL4DV(data_url="movies.csv")
3 response = nl4dv_instance.analyze_query("Show the
relationship between budget and rating for Action
and Adventure movies that grossed over 100M")
↪→
↪→
4 print(response)
{"attributeMap": { ... },
"taskMap": { ... },
"visList": [ ... ]}
Listing 1: Python code illustrating NL4DV’s basic usage involvinginitializing NL4DV with a dataset (line 2) and analyzing a query string(line 3). The high-level structure of NL4DV’s response is also shown.
attribute types (Û Quantitative, ~ Nominal, 9 Ordinal, � Temporal)along with the range and domain of values for each attribute. Thisattribute metadata is used when interpreting queries to infer appropriateanalytic tasks and generate relevant visualization specifications.
Since NL4DV uses data values to infer attribute types, it may makeerroneous interpretations. For example, a dataset may have the attributeDay with values in the range [1,31]. Detecting a range of integer values,by default, NL4DV will infer Day as a quantitative attribute insteadof temporal. This misinterpretation can lead to NL4DV making poordesign choices when selecting visualizations based on the inferred at-tributes (e.g., a quantitative attribute may result in a histogram instead ofa line chart). To overcome such issues caused by data quality or datasetsemantics, NL4DV allows developers to verify the inferred metadatausing get metadata() . This function returns a hash map of attributesalong with their inferred metadata. If they notice errors, developers canuse other helper functions (e.g., set attribute type(attribute,type) )to override the default interpretation (DG4).
4.2 Query InterpretationTo generate visualizations in response to a query, visualization NLIsneed to identify informative phrases in the query that map to relevantconcepts like data attributes and values, analytic tasks, and visualizationtypes, among others. Figure 3 shows the query in Listing 1 “Showthe relationship between budget and rating for Action and Adventuremovies that grossed over 100M” with such annotated phrases (we usethis query as a running example throughout this section to describeNL4DV’s query interpretation strategy). To identify relevant phrasesand generate the attributeMap, taskMap, and visList, NL4DVperforms four steps: 1) query parsing, 2) attribute inference, 3) taskinference, and 4) visualization specification generation. Figure 4 givesan overview of NL4DV’s underlying architecture. Below we describethe individual query interpretation steps (task inference is split into twosteps to aid explanation) and summarize the pipeline in Figure 5.
4.2.1 Query ParsingThe query parser runs a series of NLP functions on the input string toextract details that can be used to detect relevant phrases. In this step,NL4DV first preprocesses the query to convert any special symbolsor characters into dataset-relevant values (e.g., converting 100M tothe number 100000000). Next, the toolkit identifies the POS tags foreach token (e.g., NN: Noun, JJ: Adjective, CC: Coordinating Con-junction) using Stanford’s CoreNLP [33]. Furthermore, to understand
Show the relationship between budget and rating for Actionand Adventure movies that grossed over 100M.
Task Keyword Attributes
Data ValuesFilter Expression
Fig. 3: An illustration of query phrases that NL4DV identifies whileinterpreting NL queries.
QueryParser
AttributeIdentifier
TaskIdentifier
Visualization Spec. Generator
“InputQuery”
OutputJSON
Aliases
Parsing rules& Keywords
Fig. 4: NL4DV’s architecture. The arrows indicate the flow of informa-tion between different modules.
the relationship between different phrases in the query, NL4DV usesCoreNLP’s dependency parser to create a dependency tree. Then, withthe exception of conjunctive/disjunctive terms (e.g., ‘and’, ‘or’) andsome prepositions (e.g., ‘between’, ‘over’) and adverbs (e.g., ‘except’,‘not’), NL4DV trims the input query by removing all stop words andperforms stemming (e.g., ‘grossed’ → ‘gross’). Lastly, the toolkitgenerates all N-grams from the trimmed query string. The output fromthe query parser (POS tags, dependency tree, N-grams) is shown inFigure 5a and is used internally by NL4DV during the remaining stagesof query interpretation.
4.2.2 Attribute Inference
After parsing the input query, NL4DV looks for data attributes that arementioned both explicitly (e.g., through direct references to attributenames) and implicitly (e.g., through references to an attribute’s values).Developers can also configure aliases (e.g., ‘Investment’ for ProductionBudget) to support dataset- and domain-specific attribute references(DG4). To do so, developers can provide a JSON object consisting ofattributes (as keys) and lists of aliases (as values). This object can bepassed through the optional parameters alias map or alias map urlwhen initializing NL4DV (Listing 1, line 2) or using the helper functionset alias map(alias map, url="") .
To infer attributes, NL4DV iterates through the N-grams generatedby the query parser, checking for both syntactic (e.g., misspelled words)and semantic (e.g., synonyms) similarity between N-grams and a lex-icon composed of data attributes, aliases, and values. To check forsyntactic similarity, NL4DV computes the cosine similarity Simcos(i, j)between a N-gram i and a tokenized lexical entity j. The possible valuesfor Simcos(i, j) range from [0,1] with 1 indicating that strings are equiv-alent. For semantic similarity, the toolkit checks for the Wu-Palmersimilarity score [67] Simwup(i, j) between a N-gram i and a tokenizedlexical entry j. This score returns the distance between stemmed ver-sions of p and a in the WordNet graph [35], and is a value in the range(0,1], with higher values implying greater similarity. If Simcos(i, j) orSimwup(i, j) ≥ 0.8, NL4DV maps the N-gram i to the attribute corre-sponding to j, also adding the attribute as a key in the attributeMap.
As shown in Figure 5b, the attributeMap is structured such thatbesides the attributes themselves, for each attribute, developers can alsoidentify: (1) query substrings that led to an attribute being detected(queryPhrase) along with (2) the type of reference (inferenceType),and (3) ambiguous matches (ambiguity). For instance, given the queryin Figure 3, NL4DV detects the attributes Production Budget (basedon ‘budget’), Content Rating, IMDB Rating, Rotten Tomatoes Rating(ambiguity caused by the word ‘rating’), Worldwide Gross (based on‘grossed’), and Genre (based on the values ‘Action’ and ‘Adventure’).Furthermore, since Genre is referenced by its values, it is marked asimplicit whereas the other attributes are marked as explicit (DG3).
4.2.3 Explicit Task Inference
After detecting N-grams mapping to data attributes, NL4DV checks theremaining N-grams for references to analytic tasks. NL4DV currentlyidentifies five low-level analytic tasks [1] including four base tasks: Cor-relation, Distribution, Derived Value, Trend, and a fifth Filter task. Weseparate base tasks from filter since base tasks are used to determine ap-propriate visualizations (e.g., correlation maps to a scatterplot) whereasfilters are applied across different types of visualizations. We focus onthese five tasks as a starting set since they are commonly supported inprior NLIs [13,24,47,54,69] and are most relevant to NL4DV’s primary
4

© 2020 IEEE. This is the author’s version of the article that has been published in IEEE Transactions on Visualization andComputer Graphics. The final version of this record is available at: xx.xxxx/TVCG.201x.xxxxxxx/
Query Goal:Extract sub-phrases from the input query and determine relationships between those phrases.
Key Challenges:Dependency parsingPOS taggingUnit conversionStemming
1. Process the input query to convert units into data values (e.g., 100M = 100000000).
2. Identify POS tags and create a dependency tree.
3. Remove stopwords and perform stemming.
4. Generate a list of tokens and N-grams.
N-grams
Aliases
Dataset-specificwords to checkor ignore
Goal:Identify data attributes referenced in the query.
Key Challenges:Semantic andsyntactic matching.
Detecting ambiguousand implicit attributereferences.
5. Compare N-grams to attributes (+aliases) and data values to identify explicit and implicit data attribute references.
6. Add identified attributes along with reference type and corresponding query N-gram to attributeMap.
7. If there is ambiguity (multiple attribute matches) associated with an attribute in step 5, also list the ambiguous references.
Tokens
DependencyTree & ParsingRules
Task keywords
Visualizationsinferred fromquery attributes
Visualization xTask mappings
Goal:Identify intended analytic tasks.
Key Challenges:Populating taskparameters throughrelationshipsbetween queryphrases.
Inferring implicitlystated analytic tasks.
8. Compare tokens to task keywords to detect explicitly mentioned base tasks.
9. Parse the dependency tree to populate the taskMap with both filter tasks and base tasks from step 8.
10. If only filter tasks are detected in step 8, go to step 12.
11. Use inferred visualizations from step 14 to implicitly infer tasks.
N-grams
Attributes
Tasks
Attribute xTask xVisualizationmappings
Goal:Generate query-relevant visualization specifications.
Key Challenge:Implicitly inferringand rankingvisualizations basedon data attributesand/or analytic tasks.
12. Check N-grams for explicit visualization requests. If true, go to step 13, else go to step 14.
13. Generate Vega-Lite specifications corresponding to the requested chart type using the attributes detected in steps 4-6 and populate the visList.
14. If base tasks are detected in step 8, use inferred attributes & tasks to determine visualizations and populate the visList. Else, only use attributes to infer relevant visualizations and go to step 11.
{“inferenceType”: “implicit”,“attributes”: [“IMDB Rating”,
“Production Budget”],“tasks”: [“Correlation”,
“Filter”],“vlSpec”: {
“mark” : “point”,“encoding” : {
…
{“inferenceType”: “implicit”,“attributes”: [“Production
Budget”, “Rotten Tomatoes Rating”],“tasks”: [“Correlation”,
“Filter”],“vlSpec”: {
“mark” : “point”,“encoding” : {
…
{“inferenceType”: “implicit”, “attributes”: [“Content
Rating”, “Production Budget”],“tasks”: [“Correlation”,
“Filter”],“vlSpec”: {
“mark” : “point”,“encoding” : {
…
Qu
ery
Pa
rsin
g
Input Goal & Challenges NL4DV Steps Output
Att
rib
ute
Infe
ren
ceTa
sk In
fere
nce
Vis
ua
liza
tio
n G
ener
ati
on
{“Production Budget”:{
“queryPhrase”: “budget”,“inferenceType” : “explicit”
} ,“Content Rating”:{
“queryPhrase”: “rating”,“isAmbiguous”: true,“ambiguity”: [“IMDB Rating”,
“Rotten Tomatoes Rating”] ,“inferenceType” : “explicit”
},“IMDB Rating”:{
“queryPhrase”: “rating”,“isAmbiguous”: true,“ambiguity”: [“Content Rating”,
“Rotten Tomatoes Rating”] ,“inferenceType” : “explicit”
},
“Rotten Tomatoes Rating”:{“queryPhrase”: “rating”,“isAmbiguous”: true,“ambiguity”: [“Content Rating”,
“IMDB Rating”] ,“inferenceType” : “explicit”
},“Worldwide Gross”:{
“queryPhrase”: “grossed”,“inferenceType” : “explicit” ,“encode” : false
},“Genre”:{
“queryPhrase”: “Action and Adventure”,
“inferenceType” : “implicit”,“encode” : false
}}
{“Correlation”: [
{“attributes”: [“Production Budget”,
“IMDB Rating”] ,“inferenceType”: “explicit”,
},{
“attributes”: [“Production Budget”, “Content Rating”] ,
“inferenceType”: “explicit”,},{
“attributes”: [“Production Budget”,“Rotten Tomatoes Rating”] ,
“inferenceType”: “explicit”,}
],
“Filter”:[ {
“attributes”: [“Major Genre”],“operator”: “IN”,“values”: [“Action”, “Adventure”],“inferenceType”: “explicit”,
},{
“attributes”: [“Worldwide Gross”],“operator”: “GT”,“values”: [100000000] ,“inferenceType”: “explicit”,
}]
}
visList
taskMap
attributeMap
Show the relationship between budget and rating for Action and Adventure movies that grossed over 100M.
VB DT NN IN NN CC NN IN NNP CC NNP NNS WDT VBD IN CD
(Show), (relationship), (budget), …, (Show relationship), (relationship budget), …,(Action and Adventure), (Adventure movies gross), …, (Show relationship budget andrating Action and Adventure movies gross over 100000000)
nmod: between conj: and
nmod: for
conj: and nmod: over
nmod: between
POS Tags + Dependency Parse Tree
Tokens and N-grams
nsubj
(Note: only a subset of the traversed paths are shown to aid readability.)
VIS+NL
VIS+NL
VIS+NL
VIS
NLP
NLP
(a)
(b)
(c)
(d)
Fig. 5: Summary of the query interpretation pipeline triggered by analyze query(query) . Information flows sequentially across stages unlessexplicitly indicated by bi-directional arrows. Input to different stages is g provided externally by developers, 2 generated by other stages ofNL4DV’s pipleline, or/ preconfigured into NL4DV. The figure also highlights the key goal and implementation challenges for each stage ( NLP :general NLP challenge, VIS+NL : challenge specific to visualization NLIs, VIS : visualization design/recommendation challenge). NL4DVinternally tackles these challenges, providing visualization developers with a high-level API for query interpretation.
goal of supporting visualization specification through NL (as opposedto interacting with a given chart [46, 52] or question answering [25]).
While filters may be detected via data values (e.g., ‘Action’, ‘Com-edy’), to detect base tasks, NL4DV compares the query tokens to apredefined list of task keywords (e.g., ‘correlate’, ‘relationship’, etc.,for the Correlation task, ‘range’, ‘spread’, etc., for the Distributiontask, ‘average’, ‘sum’, etc., for Derived Value). Merely detecting refer-ences to attributes, values, and tasks is insufficient to infer user intent,however. To model relationships between query phrases and popu-late task details, NL4DV leverages the POS tags and the dependency
tree generated by the query parser. Specifically, using the token typeand dependency type (e.g., nmod, conj, nsubj) and distance, NL4DVidentifies mappings between attributes, values, and tasks. These map-pings are then used to model the taskMap. The task keywords anddependency parsing rules were defined based on the query patterns andexamples from prior visualization NLIs [13, 22, 46, 54, 69] as well as∼200 questions collected by Amar et al. [1] when formulating theiranalytic task taxonomy.
The taskMap contains analytic tasks as keys. Tasks are broken downas a list of objects that include an inferenceType field to indicate
5

if a task was stated explicitly (e.g., through keywords) or derivedimplicitly (e.g., if a query requests for a line chart, a trend task maybe implied) and parameters to apply when executing a task. Theseinclude the attributes a task maps to, the operator to be used (e.g.,GT, EQ, AVG, SUM), and values. If there are ambiguities in taskparameters (e.g., the word ‘fiction’ may refer to the values ‘ScienceFiction,’ ‘Contemporary Fiction,’ ‘Historical Fiction’), NL4DV addsadditional fields (e.g., isValueAmbiguous=true) to highlight them(DG3). In addition to the tasks themselves, this structuring of thetaskMap allows developers to detect: (1) the parameters needed toexecute a task (attributes, operator, values), (2) operator- andvalue-level ambiguities (e.g., isValueAmbiguous), and (3) if the taskwas stated explicitly or implicitly (inferenceType).
Consider the taskMap (Figure 5c) for the query in Figure 3. Usingthe dependency tree in Figure 5a, NL4DV infers that the word ‘relation-ship’ maps to the Correlation task and links to the tokens ‘budget’ and‘rating’ which are in-turn linked by the conjunction term ‘and.’ Next,referring back to the attributeMap, NL4DV maps the words ‘budget’and ‘rating’ to their respective data attributes, adding three objectscorresponding to correlations between the attributes [ProductionBudget, IMDB Rating], [Production Budget, Content Rating], and[Production Budget, Rotten Tomatoes Rating] to the correlation task.Leveraging the tokens ‘Action’ and ‘Adventure’, NL4DV also infersthat the query refers to a Filter task on the attribute Genre, wherethe values are in the list (IN) [Action, Adventure]. Lastly, using thedependencies between tokens in the phrase ‘gross over 100M,’ NL4DVadds an object with the attributeWorldwide Gross, the greater than(GT) operator, and 100000000 in the values field. While populatingfilter tasks, NL4DV also updates the corresponding attributes in theattributeMap with the key encode=False (Figure 5b). This helpsdevelopers detect that an attribute is used for filtering and is not visuallyencoded in the recommended charts.
4.2.4 Visualization Generation
NL4DV uses Vega-Lite as the underlying visualization grammar. Thetoolkit currently supports the Vega-Lite marks: bar, tick, line, area,point, arc, boxplot, text and encodings: x, y, color, size, column, row,theta to visualize up to three attributes at a time. This combinationof marks and encodings allows NL4DV to support a range of com-mon visualization types including histograms, strip plots, bar charts(including stacked and grouped bar charts), line and area charts, piecharts, scatterplots, box plots, and heatmaps. To determine visualiza-tions relevant to the input query, NL4DV checks the query for explicitrequests for visualization types (e.g., Figure 1a) or implicitly infersvisualizations from attributes and tasks (e.g., Figures 1b, 1c, and 3).
Explicit visualization requests are identified by comparing queryN-grams to a predefined list of visualization keywords (e.g., ‘scatter-plot’, ‘histogram’, ‘bar chart’). For instance, the query in Figure 1aspecifies the visualization type through the token ‘histogram,’ leadingto NL4DV setting bar as the mark type and binned IMDB Rating asthe x encoding in the underlying Vega-Lite specification.
To implicitly determine visualizations, NL4DV uses a combinationof the attributes and tasks inferred from the query. NL4DV startsby listing all possible visualizations using the detected attributes byapplying well-known mappings between attributes and visualizations(Table 1). These mappings are preconfigured within NL4DV based onheuristics used in prior systems like Show Me [32] and Voyager [64,66]. As stated earlier, when generating visualizations from attributes,NL4DV does not visually encode the attributes used as filters. Instead,filter attributes are added as a filter transform in Vega-Lite. Doingso helps avoid a combinatorial explosion of attributes when a queryincludes multiple filters (e.g., including the filter attributes for the queryin Figure 3 would require generating visualizations that encode fourattributes instead of two).
Besides attributes, if tasks are explicitly stated in the query, NL4DVuses them as an additional metric to modify, prune, and/or rank thegenerated visualizations. Consider the query in Figure 3. Similar tothe query in Figure 1c, if only attributes were used to determine thecharts, NL4DV would output two scatterplots (for QxQ) and one bar
Attributes(x, y, color/size/row/column) Visualizations Task
Q x Q x {N, O, Q, T} Scatterplot Correlation
N, O x Q x {N, O, Q, T} Bar Chart Derived Value
Q, N, O x {N, O, Q, T} x {Q} Strip Plot, Histogram,Bar Chart, Heatmap Distribution
T x {Q} x {N, O} Line Chart Trend
Table 1: Attribute (+encodings), visualization, and task mappings pre-configured in NL4DV. Attributes in curly brackets {are optional}. Notethat these defaults can be overridden via explicit queries. For instance,“Show average gross across genres as a scatterplot” will create a scat-terplot instead of a bar chart with Genre on the x- and AVG(WorldwideGross) on the y-axis. For unsupported attribute combinations and tasks,NL4DV resorts to a table-like view created using Vega-Lite’s text mark.
chart (for NxQ). However, since the query contains the token ‘relation-ship,’ which maps to a Correlation task, NL4DV enforces a scatterplotas the chart type, setting the mark in the Vega-Lite specifications topoint. Furthermore, because correlations are more apparent in QxQcharts, NL4DV also ranks the two QxQ charts higher, returning thethree visualization specifications shown in Figure 5d. These Task x Vi-sualization mappings (Table 1) are configured within NL4DV based onprior visualization systems [8, 14, 36] and studies [26, 42].
NL4DV complies the inferred visualizations into a visList (Fig-ure 5d). Each object in this list is composed of a vlSpec contain-ing the Vega-Lite specification for a chart, an inferenceType field tohighlight if a visualization was requested explicitly or implicitly in-ferred by NL4DV, and a list of attributes and tasks that a visualizationmaps to. Developers can use the visList to directly render visual-izations in their systems (via the vlSpec). Alternatively, ignoring thevisList, developers can also extract only attributes and tasks usingthe attributeMap and taskMap, and feed them as input to othervisualization recommendation engines (e.g., [30, 65]) (DG2).
4.2.5 Implicit Task InferenceWhen the input query lacks explicit keywords referring to analytic tasks,NL4DV first checks if the query requests for a specific visualizationtype. If so, the toolkit uses mappings between Visualizations x Tasksin Table 1 to infer tasks (e.g., distribution for a histogram, trend for aline chart, correlation for a scatterplot).
Alternatively, if the query only mentions attributes, NL4DV first listspossible visualizations based on those attributes. Then, using the in-ferred visualizations, the toolkit implicitly infers tasks (again leveragingthe Visualization x Task mappings in Table 1). Consider the examplein Figure 1c. In this case, the tasks Correlation and Derived Value areinferred based on the two scatterplots and one bar chart generated usingthe attribute combinations QxQ and NxQ, respectively. In such caseswhere the tasks are implicitly inferred through visualizations, NL4DValso sets their inferenceType in the taskMap to implicit.
5 EXAMPLE APPLICATIONS
5.1 Using NL4DV in Jupyter NotebookSince NL4DV generates Vega-Lite specifications, in environments thatsupport rendering Vega-Lite charts, the toolkit can be used to createvisualizations through NL in Python. Specifically, NL4DV provides awrapper function render vis(query) that automatically renders the firstvisualization in the visList. By rendering visualizations in responseto NL queries in environments like Jupyter Notebook, NL4DV en-ables novice Python data scientists and programmers to conduct visualanalysis without needing to learn about visualization design or Pythonvisualization packages (e.g., Matplotlib, Plotly). Figure 6 shows aninstance of a Jupyter Notebook demonstrating the use of NL4DV tocreate visualizations for a cars dataset. For the first query “Create aboxplot of acceleration,” detecting an explicit visualization request,NL4DV renders a box plot showing values for the attribute Accelera-tion. For the second query “Visualize horsepower mpg and cylinders”,
6

© 2020 IEEE. This is the author’s version of the article that has been published in IEEE Transactions on Visualization andComputer Graphics. The final version of this record is available at: xx.xxxx/TVCG.201x.xxxxxxx/
Fig. 6: NL4DV being used to specify visualizations through NL inPython within a Jupyter Notebook.
Fig. 7: A Vega-Lite editor that supports NL-based chart specificationand presents design alternatives using the visList returned by NL4DV.Here, the query “Show debt and earnings for different types of colleges”issued in the context of a U.S. colleges dataset results in the systemsuggesting a colored scatterplot and a colored + faceted scatterplot. Thefaceted scatterplot is selected as the active chart by the user.
NL4DV implicitly selects a scatterplot as the appropriate visualizationusing the inferred attributes (Û Horsepower, Û MPG, Î Cylinders).
5.2 Creating Visualization Systems with NL4DVThe above example illustrates how the visList generated by NL4DVis used to create visualizations in Python-based data science environ-ments. The following two examples showcase how NL4DV can assistthe development of web-based NLIs for data visualization.
5.2.1 NL-Driven Vega-Lite Editor
Although the declarative nature of Vega-Lite makes it an intuitive wayto specify visualizations, novices unaware of visualization terminologymay need to spend a significant amount of time and effort to look atexamples and learn the specification grammar. NL input presents itselfas a promising solution in such scenarios to help onboard users forlearning Vega-Lite. With a NLI, users can load their data and expresstheir intended chart through NL. The system in response can presentboth the chart and the corresponding Vega-Lite specification, allowingusers to learn the underlying grammar through charts of their interest.Figure 7 illustrates this idea implemented as an alternative version ofthe Vega-Lite editor [58], supporting NL input. Users can enter queriesthrough the text input box at the top of the page to specify charts andedit the specification on the left to modify the resulting visualization.Besides the main visualization returned in response to an NL query,the interface also presents a alternative visualizations using differentencodings similar to the Voyager systems [64, 66].
This example is developed following a classic client-server archi-tecture and is implemented as a Python Flask [12] application. Froma development standpoint, the client-side of this application is writ-ten from scratch using HTML and JavaScript. On the Python server-side, a single call is made to NL4DV’s analyze query(query) function
1 $.post("/analyzeQuery", {"query": query})
2 .done(function (responseString) {3 let nl4dvResponse = JSON.parse(responseString);4 let visList = nl4dvResponse['visList'];5 // render visList[0]['vlSpec'] as default chart6 for(let visObj of visList){7 // add visObj['vlSpec'] as a thumbnail in the
bottom panel displaying all possible designs↪→
8 }
9 });
Listing 2: JavaScript code to parse NL4DV’s output to create the Vega-Lite editor application shown in Figure 7.
Fig. 8: A sample interface illustrating how NL4DV can be used toreplicate DataTone’s [13] ambiguity widgets.
where the query is collected and passed via JavaScript. As shownearlier (Listing 1), this function returns a JSON object composed ofthe attributeMap, taskMap, and visList. For this example, thevisList returned by NL4DV is parsed in JavaScript to render the mainchart along with the alternative designs (Listing 2, lines 5-8). Thevisualizations are rendered using Vega-Embed [59].
5.2.2 Recreating Ambiguity Widgets in DataToneConsider a second example where we use NL4DV to replicate featuresof the DataTone system [13]. Given a NL query, DataTone identifiesambiguities in the query and surfaces them via “ambiguity widgets”(dropdown menus) that users can interact with to clarify their intent.
Figure 8 shows a DataTone-like interface implemented using NL4DV.This system is also implemented as a Flask web-application usingHTML and JavaSript on the client-side. The example in Figure 8illustrates the result of executing the query “Show me medals for hockeyand skating by country” against an Olympics medal winners dataset(query reused from the DataTone paper [13]). Here, ‘medals’ is anambiguous reference to four data attributes—the three medal types(Bronze, Silver, Gold) and the Total Medals. Similarly, ‘hockey’ and‘skating’ are value-level ambiguities corresponding to the Sport attribute(e.g., ‘hockey’=[Ice Hockey, Hockey]).
Similar to the Vega-Lite editor application, the server-side code onlyinvolves initializing NL4DV with the active dataset and making a call tothe analyze query(query) function to process user queries. As detailedin Listing 3, on the client-side, to highlight attribute- and value-levelambiguities in the query, we parse the attributeMap and taskMapreturned by NL4DV in JavaScript, checking the isAmbiguous fields.Vega-Embed is once again used to render the vlSpecs returned aspart of NL4DV’s visList. Note that we only focus on data ambigu-ity widgets in this example, not displaying design ambiguity widgets(e.g., dropdown menus for switching between visualization types). Togenerate design ambiguity widgets, however, developers can parsethe visList, converting the Vega-Lite marks and encodings intodropdown menu options.
5.3 Adding NL Input to an Existing Visualization SystemNL4DV can also be used to augment existing visualization systemswith NL input. As an example, consider TOUCHPLOT (Figure 9-top), a
7

1 $.post("/analyzeQuery", {"query": query})
2 .done(function (responseString) {3 let nl4dvResponse = JSON.parse(responseString);4 let attributeMap = nl4dvResponse['attributeMap'],5 taskMap = nl4dvResponse['taskMap'];6 for(let attr in attributeMap){7 if(attributeMap[attr]['isAmbiguous']){8 // add attr and attributeMap[attr]['ambiguity']
to attribute-level ambiguity widget
corresponding to the
attributeMap[attr]['queryPhrase']
↪→
↪→
↪→
9 }
10 }
11 ...
12 });
Listing 3: JavaScript code to parse NL4DV’s output and generateattribute-level ambiguity widgets (highlighted in Figure 8-left). Asimilar logic is used to iterate over the taskMap when creating value-level ambiguity widgets (highlighted in Figure 8-right) for filtering.
touch-based scatterplot visualization system running on a tablet. Wemodeled TOUCHPLOT after the interface and capabilities of the scatter-plot visualization system, Tangere [41]. Specifically, users can selectpoints and zoom/pan by interacting directly with the chart canvas, bindattributes to the position, color, and size encodings using dropdownmenus on axes and legends, or apply filters using a side panel. TOUCH-PLOT is implemented using HTML and JavaScript, and D3 is used forcreating the visualization.
Recent work has shown that complementing touch interactions withspeech can support a more fluid interaction experience during visualanalysis on tablets [49]. For example, while touch can support fine-grained interactions with marks, speech can allow specifying filterswithout having to open and interact with the side panel, saving screenspace and preserving the user workflow. To explore such fluid interac-tions, we developed MMPLOT (Figure 9-bottom), a modified versionof TOUCHPLOT that supports multimodal touch and speech input. Inaddition to touch interactions, MMPLOT allows issuing speech com-mands to specify charts (e.g., “Correlate age and salary by country”)and filter points (e.g., “Remove players over the age of 30”).
To support these interactions, we record speech input and con-vert it to a text string using the Web Speech API [61]. This querystring is then passed to the server, where we make a call to NL4DV’sanalyze query(query) . By parsing NL4DV’s response in JavaScript,
TOUCHPLOT is modified to support the required speech interactions(Listing 4). In particular, we parse the taskMap to detect and applyany filters requested as part of the query (lines 6-12). Next, we check ifthe input query specifies a new scatterplot that can be rendered by thesystem and adjust the view mappings accordingly (lines 13-16). Thissequential parsing of taskMap and visList allows using speech toapply filters, specify new scatterplots, or do both with a single query(Figure 9). Unlike previous examples, since this application uses D3(as opposed to Vega-Lite) to create the visualization, when parsingNL4DV’s output, we perform an added step of invoking the D3 coderequired to update the view (line 17).
Implementing the aforementioned examples (NL-based Vega-Lite edi-tor, DataTone’s ambiguity widgets, MMPLOT) would typically requiredevelopers to write hundreds of lines of code (in addition to the front-end code) requiring both NLP and visualization design knowledge(Figure 2). As illustrated above, with NL4DV, developers can accom-plish the desired NLI capabilities with a single call to analyze query()
and a few additional lines of code to parse NL4DV’s response, enablingthem to focus on the interface design and user experience.
6 DISCUSSION AND FUTURE WORK
6.1 EvaluationIn this paper, we illustrate NL4DV’s query interpretation capabilitiesthrough sample queries executed on different datasets1. As part of this
1Additional queries available at: https://nl4dv.github.io/nl4dv/showcase.html
Fig. 9: (Top) TOUCHPLOT interface supporting interaction throughtouch and control panels. (Bottom) MMPLOT interface supportingmultimodal interactions. Here, the user has specified a new scatterplotand applied a filter through a single query “Show a scatter plot of ageand salary for players under the age of 30.”1 $.post("/analyzeQuery", {"query": query})
2 .done(function (responseString) {3 let nl4dvResponse = JSON.parse(responseString);4 let taskMap = nl4dvResponse['taskMap'],5 visList = nl4dvResponse['visList'];6 if("filter" in taskMap){ // query includes a filter7 for(let taskObj of taskMap['filter']){8 for(let attr of taskObj['attributes']){9 // use the attribute type, 'operator', and
'values' to apply requested filters↪→
10 }
11 }
12 }
13 if(visList.length>0){ // query specifies a new chart14 let newVisSpec = visList[0]['vlSpec'];15 // check if newVisSpec is a scatterplot
configuration supported by the system and
modify the attribute-encoding mappings
↪→
↪→
16 }
17 // invoke the D3 code to update the view
18 });
Listing 4: JavaScript code to parse NL4DV’s output for supportingspeech and multimodal interactions in MMPLOT (Figure 9-bottom).
initial validation, we used NL4DV to query tabular datasets containing300-6000 rows and up to 27 attributes. The toolkit’s response time forthese queries ranged between 1-18 sec. (mean: 3 sec.)2. Besides samplequeries, we also present applications employing NL4DV to highlighthow the toolkit can reduce development viscosity and lower skill bar-riers (in terms of prior knowledge of NLP tools and techniques) [38].However, assessing the toolkit’s usability and utility likely involves amore detailed evaluation in two ways. First, we need to formally bench-mark NL4DV’s performance by executing it against a large corpus ofNL queries. To this end, an important area for future work is to collectlabeled data on utterances people use to specify visualizations and useit to benchmark NL4DV and other visualization NLIs. Second, weneed to conduct a longitudinal study incorporating feedback from bothvisualization and NLP developers. Going forward, we hope that theopen-source nature of this research will help us conduct such a studyin the wild, enabling us to assess NL4DV’s practical usability, identifypotential issues, and understand the breadth of possible applications.
6.2 Supporting Follow-up QueriesNL input presents the opportunity to support a richer visual analyticdialog through conversational interaction (as opposed to one-off utter-
2Reported based on a MacBook Pro with a 6-core 2.9GHz processor and16GB RAM running MacOS Catalina version 10.15.5
8

© 2020 IEEE. This is the author’s version of the article that has been published in IEEE Transactions on Visualization andComputer Graphics. The final version of this record is available at: xx.xxxx/TVCG.201x.xxxxxxx/
ances). For example, instead of a single query including both visual-ization specification and filtering requests (e.g., “Show a scatterplotof gross and budget highlighting only Action and Adventure movies”),one can issue a shorter query to first gain an overview by specifying avisualization (e.g., “Show a scatterplot of gross and budget”) and thenissue a follow-up query to apply filters (e.g., “Now just show Actionand Adventure movies”). However, supporting such a dialog through aninterface-agnostic toolkit is challenging as it requires the toolkit to havecontext of system state in which the query was issued. Furthermore, notall queries in a dialog may be follow-up queries. While current systemslike Evizeon [22] allow users to reset the canvas to reset the querycontext, explicitly specifying when context should be preserved/clearedwhile operating an interface-agnostic toolkit is impractical.
NL4DV currently does not support follow-up queries. However,as a first pass at addressing these challenges, we are experiment-ing with an additional dialog parameter to analyze query() andrender vis() to support follow-up queries involving filtering and en-
coding changes. Specifically, setting dialog=true notifies NL4DVto check for follow-up queries. NL4DV uses conversational centeringtechniques [15, 16] similar to prior visualization NLIs [22, 50, 52] toidentify missing attributes, tasks, or visualization details in a querybased on the toolkit’s previous response. Consider the example inFigure 10 showing queries issued in the context of a housing dataset.In response to the first query “Show average prices for different hometypes over the years,” NL4DV generates a line chart by detecting theattributes Price, House Type, and Year, and the task Derived Value (withthe operator AVG). Next, given the follow-up query “As a bar chart,”NL4DV infers the attributes and tasks from its previous response, up-dating the mark type and encoding channels in the Vega-Lite specifi-cation to create a grouped bar chart. Lastly, with the third query, “Justshow condos and duplexes,” detecting ‘condos’ and ‘duplexes’ as datavalues, NL4DV modifies the underlying taskMap and applies a filter onthe House Type attribute. Besides implementing additional parametersand functions to support conversational interaction in NL4DV, a generalfuture research challenge is to investigate how interface context (e.g.,active encodings, selections) can be modeled into a structured formatthat can be interpreted by interface-agnostic toolkits like NL4DV.
6.3 Improving Query Interpretation and Enabling Addi-tional Query Types
Through our initial testing, we have already identified some areas forimprovement in NL4DV’s interpretation pipeline. One of these is betterinference of attribute types upon initialization. To this end, we arelooking into how we can augment NL4DV’s data interpretation pipelinewith recent semantic data type detection models that use both attributenames and values (e.g., [23, 70]). Another area for improvement istask detection. NL4DV currently leverages a combination of lexicon-and dependency-based approach to infer tasks. Although this servesas a viable starting point, it is less reliable when there is uncertaintyin the task keywords (e.g., the word “relationship” may not alwaysmap to a Correlation task) or the keywords conflict with data attributes(e.g., the query “Show the average cost of schools by region” wouldcurrently apply a Derived Value task on the Average Cost attributeeven though Average Cost already represents a derived value). As wecollect more user queries, we are exploring ways to complement thecurrent approach with semantic parsers (e.g., [2, 3]) and contemporarydeep learning models (e.g., [7, 68]) that can infer tasks based on thequery phrasing and structure. Finally, a third area for improvementis to connect NL4DV to knowledge bases like WolframAlpha [63] tosemantically understand words in the input query. Incorporating suchconnections will help resolve vague predicates for data values (e.g.,‘large’, ‘expensive’, ‘near’) [46, 47] and may also reduce the need fordevelopers to manually configure attribute aliases.
Besides improving query interpretation, another theme for futurework is to support additional query types. As stated earlier, NL4DVis currently primarily geared to support visualization specification-oriented queries (e.g., “What is the relationship between worldwidegross and content rating?,” “Create a bar chart showing average profitby state”). To aid development of full-fledged visualization systems,
“Show average prices for different home types over the years.”
“As a bar chart.” “Just show condos and duplexes.”
Fig. 10: Example of NL4DV supporting follow-up queries using theexperimental dialog parameter. Here, the three visualizations are gen-erated through consecutive calls to render vis(query, dialog=true ).
however, the toolkit needs to support a tighter coupling with an active vi-sualization and enable other tasks such as question answering [25] (e.g.,“How many movies grossed over 100M?,” “When was the difference be-tween the two stocks the highest?”) and formatting visualizations (e.g.,“Color SUVs green,” “Highlight labels for countries with a populationof more than 200M”). Incorporating these new query types wouldentail making changes in terms of both the interpretation strategies (toidentify new task categories and their parameters) and the output format(to include the computed “answers” and changes to the view).
6.4 Balancing Simplicity and CustomizationNL4DV is currently targeted towards visualization developers whomay not have a strong NLP background (DG1). As such, NL4DVuses a number of default settings (e.g., preset rules for dependencyparsing, empirically set thresholds for attribute detection) to minimizethe learning curve and facilitate ease-of-use. Developers can overridesome of these defaults (e.g., replace CoreNLP with spaCy [21], ad-just similarity matching thresholds) and also configure dataset-specificsettings to improve query interpretation (e.g., attribute aliases, specialwords referring to data values, additional stopwords to ignore) (DG4).Furthermore, by invoking analyze query() with the debug parameterset to true, developers can also get additional details such as why anattribute was detected (e.g., semantic vs. syntactic match along withthe match score) or how a chart was implicitly inferred (e.g., usingattributes vs. attributes and tasks).
NLP or visualization experts, however, may prefer using custommodules for query processing or visualization recommendation. To thisend, visualization developers can override the toolkit’s default recom-mendation engine by using the inferred attributes and tasks as input totheir custom modules (i.e., ignoring the visList). However, NL4DVcurrently does not support using custom NLP models for attribute andtask inference (e.g., using word embedding techniques to detect syn-onyms or classification models to identify tasks). Going forward, as wegather feedback on the types of customizations developers prefer, wehope to provide the option for developers to replace NL4DV’s heuristicmodules with contemporary ML models/techniques. Given the end goalof aiding prototyping of visualization NLIs, a challenge in supportingthis customization, however, is to ensure that the output from the cus-tom models can be compiled into NL4DV’s output specification or tomodify NL4DV’s specification to accommodate additional information(e.g., classification accuracy) generated by the custom models.
7 CONCLUSION
We present NL4DV, a toolkit that supports prototyping visualizationNLIs. Given a dataset and a NL query, NL4DV generates a JSON-basedanalytic specification composing of attributes, tasks, and visualizationsinferred from the query. Through example applications, we showhow developers can use this JSON response to create visualizationsin Jupyter notebooks through NL, develop web-based visualizationNLIs, and augment existing visualization tools with NL interaction. Weprovide NL4DV and the example applications as open-source software(https://nl4dv.github.io/nl4dv/) and hope these will serve asvaluable resources to advance research on NLIs for data visualization.
ACKNOWLEDGMENTS
This work was supported in part by a National Science FoundationGrant IIS-1717111.
9

REFERENCES
[1] R. Amar, J. Eagan, and J. Stasko. Low-level components of analyticactivity in information visualization. In Proceedings of IEEE InfoVis, pp.111–117, 2005.
[2] J. Berant, A. Chou, R. Frostig, and P. Liang. Semantic parsing on freebasefrom question-answer pairs. In Proceedings of the EMNLP, pp. 1533–1544.ACL, 2013.
[3] J. Berant and P. Liang. Semantic parsing via paraphrasing. In Proceedingsof the 52nd Annual Meeting of the ACL (Volume 1: Long Papers), pp.1415–1425, 2014.
[4] L. Blunschi, C. Jossen, D. Kossmann, M. Mori, and K. Stockinger. Soda:Generating sql for business users. Proceedings of the VLDB Endowment,5(10):932–943, 2012.
[5] M. Bostock and J. Heer. Protovis: A graphical toolkit for visualization.IEEE Transactions on Visualization and Computer Graphics, 15(6):1121–1128, 2009.
[6] M. Bostock, V. Ogievetsky, and J. Heer. D3: data-driven documents. IEEETransactions on Visualization and Computer Graphics, 17(12):2301–2309,2011.
[7] T. B. Brown, B. Mann, N. Ryder, M. Subbiah, J. Kaplan, P. Dhariwal,A. Neelakantan, P. Shyam, G. Sastry, A. Askell, et al. Language modelsare few-shot learners. arXiv preprint arXiv:2005.14165, 2020.
[8] S. M. Casner. Task-analytic approach to the automated design of graphicpresentations. ACM Transactions on Graphics (ToG), 10(2):111–151,1991.
[9] Y. Chen, J. Yang, and W. Ribarsky. Toward effective insight managementin visual analytics systems. In Proceedings of IEEE PacificVis, pp. 49–56,2009.
[10] K. Cox, R. E. Grinter, S. L. Hibino, L. J. Jagadeesan, and D. Mantilla.A multi-modal natural language interface to an information visualizationenvironment. International Journal of Speech Technology, 4(3-4):297–314,2001.
[11] J. R. Finkel, T. Grenager, and C. Manning. Incorporating non-local in-formation into information extraction systems by gibbs sampling. InProceedings of ACL, pp. 363–370, 2005.
[12] Flask. https://palletsprojects.com/p/flask/.[13] T. Gao, M. Dontcheva, E. Adar, Z. Liu, and K. G. Karahalios. DataTone:
Managing ambiguity in natural language interfaces for data visualization.In Proceedings of ACM UIST, pp. 489–500, 2015.
[14] D. Gotz and Z. Wen. Behavior-driven visualization recommendation. InProceedings of ACM IUI, pp. 315–324, 2009.
[15] B. J. Grosz and C. L. Sidner. Attention, intentions, and the structure ofdiscourse. Computational linguistics, 12(3):175–204, 1986.
[16] B. J. Grosz, S. Weinstein, and A. K. Joshi. Centering: A framework formodeling the local coherence of discourse. Computational linguistics,21(2):203–225, 1995.
[17] P. He, Y. Mao, K. Chakrabarti, and W. Chen. X-SQL: reinforce schemarepresentation with context. arXiv preprint arXiv:1908.08113, 2019.
[18] J. Heer and M. Bostock. Declarative language design for interactivevisualization. IEEE Transactions on Visualization and Computer Graphics,16(6):1149–1156, 2010.
[19] J. Heer, S. K. Card, and J. A. Landay. Prefuse: a toolkit for interactiveinformation visualization. In Proceedings of ACM CHI, pp. 421–430,2005.
[20] J. Herzig, P. K. Nowak, T. Muller, F. Piccinno, and J. M. Eisenschlos.TAPAS: Weakly Supervised Table Parsing via Pre-training. arXiv preprintarXiv:2004.02349, 2020.
[21] M. Honnibal and I. Montani. spacy 2: Natural language understandingwith bloom embeddings. Convolutional Neural Networks and IncrementalParsing, 2017.
[22] E. Hoque, V. Setlur, M. Tory, and I. Dykeman. Applying pragmaticsprinciples for interaction with visual analytics. IEEE Transactions onVisualization and Computer Graphics, 24(1):309–318, 2018.
[23] M. Hulsebos, K. Hu, M. Bakker, E. Zgraggen, A. Satyanarayan, T. Kraska,c. Demiralp, and C. Hidalgo. Sherlock: A deep learning approach tosemantic data type detection. In Proceedings of SIGKDD. ACM, 2019.
[24] J.-F. Kassel and M. Rohs. Valletto: A multimodal interface for ubiquitousvisual analytics. In ACM CHI ’18 Extended Abstracts, 2018.
[25] D. H. Kim, E. Hoque, and M. Agrawala. Answering questions aboutcharts and generating visual explanations. In Proceedings of ACM CHI,pp. :1–:13, 2020.
[26] Y. Kim and J. Heer. Assessing effects of task and data distribution on the
effectiveness of visual encodings. In Computer Graphics Forum, vol. 37,pp. 157–167. Wiley Online Library, 2018.
[27] A. Kumar, J. Aurisano, B. Di Eugenio, A. Johnson, A. Gonzalez, andJ. Leigh. Towards a dialogue system that supports rich visualizations ofdata. In Proceedings of the SIGDIAL, pp. 304–309, 2016.
[28] D. Ledo, S. Houben, J. Vermeulen, N. Marquardt, L. Oehlberg, andS. Greenberg. Evaluation strategies for hci toolkit research. In Proceedingsof ACM CHI, pp. 1–17, 2018.
[29] F. Li and H. V. Jagadish. NaLIR: an interactive natural language interfacefor querying relational databases. In Proceedings of the ACM SIGMOD,pp. 709–712, 2014.
[30] H. Lin, D. Moritz, and J. Heer. Dziban: Balancing agency & automationin visualization design via anchored recommendations. In Proceedings ofACM CHI, pp. 751:1–751:12, 2020.
[31] E. Loper and S. Bird. NLTK: The natural language toolkit. In Proceedingsof ACL Workshop on Effective Tools and Methodologies for TeachingNatural Language Processing and Computational Linguistics, pp. 63–70,2002.
[32] J. Mackinlay, P. Hanrahan, and C. Stolte. Show Me: Automatic presenta-tion for visual analysis. IEEE Transactions on Visualization and ComputerGraphics, 13(6):1137–1144, 2007.
[33] C. D. Manning, M. Surdeanu, J. Bauer, J. R. Finkel, S. Bethard, andD. McClosky. The Stanford CoreNLP natural language processing toolkit.In Proceedings of ACL: System Demonstrations, pp. 55–60, 2014.
[34] Microsoft Power BI. https://powerbi.microsoft.com/en-us.[35] G. A. Miller. WordNet: a lexical database for english. Communications of
the ACM, 38(11):39–41, 1995.[36] D. Moritz, C. Wang, G. L. Nelson, H. Lin, A. M. Smith, B. Howe, and
J. Heer. Formalizing visualization design knowledge as constraints: Ac-tionable and extensible models in draco. IEEE Transactions on Visualiza-tion and Computer Graphics, 25(1):438–448, 2018.
[37] B. Myers, S. E. Hudson, and R. Pausch. Past, present, and future ofuser interface software tools. ACM Transactions on Computer-HumanInteraction, 7(1):3–28, 2000.
[38] D. R. Olsen Jr. Evaluating user interface systems research. In Proceedingsof ACM UIST, pp. 251–258, 2007.
[39] P. Pasupat and P. Liang. Compositional semantic parsing on semi-structured tables. In Proceedings of IJCNLP, pp. 1470–1480. ACL, 2015.
[40] A.-M. Popescu, O. Etzioni, and H. Kautz. Towards a theory of naturallanguage interfaces to databases. In Proceedings of IUI, pp. 149–157.ACM, 2003.
[41] R. Sadana and J. Stasko. Designing and implementing an interactivescatterplot visualization for a tablet computer. In Proceedings of AVI, pp.265–272, 2014.
[42] B. Saket, A. Endert, and C. Demiralp. Task-based effectiveness of basic vi-sualizations. IEEE Transactions on Visualization and Computer Graphics,25(7):2505–2512, 2018.
[43] A. Satyanarayan, D. Moritz, K. Wongsuphasawat, and J. Heer. Vega-Lite:A grammar of interactive graphics. IEEE Transactions on Visualizationand Computer Graphics, 23(1):341–350, 2016.
[44] A. Satyanarayan, R. Russell, J. Hoffswell, and J. Heer. Reactive vega: Astreaming dataflow architecture for declarative interactive visualization.IEEE Transactions on Visualization and Computer Graphics, 22(1):659–668, 2015.
[45] M. Schwab, J. Tompkin, J. Huang, and M. A. Borkin. Easypz. js: Inter-action binding for pan and zoom visualizations. In Proceedings of IEEEVIS: Short Papers, pp. 31–35, 2019.
[46] V. Setlur, S. E. Battersby, M. Tory, R. Gossweiler, and A. X. Chang. Eviza:A natural language interface for visual analysis. In Proceedings of ACMUIST, pp. 365–377, 2016.
[47] V. Setlur, M. Tory, and A. Djalali. Inferencing underspecified naturallanguage utterances in visual analysis. In Proceedings of ACM IUI, pp.40–51, 2019.
[48] R. Sicat, J. Li, J. Choi, M. Cordeil, W.-K. Jeong, B. Bach, and H. Pfis-ter. Dxr: A toolkit for building immersive data visualizations. IEEETransactions on Visualization and Computer Graphics, 25(1):715–725,2018.
[49] A. Srinivasan, B. Lee, N. H. Riche, S. M. Drucker, and K. Hinckley. InCho-rus: Designing consistent multimodal interactions for data visualizationon tablet devices. In Proceedings of ACM CHI, pp. 653:1–653:13, 2020.
[50] A. Srinivasan, B. Lee, and J. T. Stasko. Interweaving multimodal in-teraction with flexible unit visualizations for data exploration. IEEETransactions on Visualization and Computer Graphics, 2020.
10

© 2020 IEEE. This is the author’s version of the article that has been published in IEEE Transactions on Visualization andComputer Graphics. The final version of this record is available at: xx.xxxx/TVCG.201x.xxxxxxx/
[51] A. Srinivasan and J. Stasko. Natural language interfaces for data anal-ysis with visualization: Considering what has and could be asked. InProceedings of EuroVis: Short Papers, pp. 55–59, 2017.
[52] A. Srinivasan and J. Stasko. Orko: Facilitating multimodal interactionfor visual exploration and analysis of networks. IEEE Transactions onVisualization and Computer Graphics, 24(1):511–521, 2018.
[53] C. Stolte, D. Tang, and P. Hanrahan. Polaris: A system for query, anal-ysis, and visualization of multidimensional relational databases. IEEETransactions on Visualization and Computer Graphics, 8(1):52–65, 2002.
[54] Y. Sun, J. Leigh, A. Johnson, and S. Lee. Articulate: A semi-automatedmodel for translating natural language queries into meaningful visualiza-tions. In Proceedings of the International Symposium on Smart Graphics,pp. 184–195, 2010.
[55] Tableau Ask Data. https://www.tableau.com/about/blog/2018/10/announcing-20191-beta-96449.
[56] M. Tory and V. Setlur. Do what i mean, not what i say! design consid-erations for supporting intent and context in analytical conversation. InProceedings of IEEE VAST, pp. 93–103, 2019.
[57] Unity. https://unity.com/.[58] Vega editor. https://vega.github.io/editor/.[59] Vega-embed. https://github.com/vega/vega-embed.[60] C. Wang, K. Tatwawadi, M. Brockschmidt, P.-S. Huang, Y. Mao, O. Polo-
zov, and R. Singh. Robust Text-to-SQL generation with execution-guideddecoding. arXiv preprint arXiv:1807.03100, 2018.
[61] https://developer.mozilla.org/en-US/docs/Web/API/Web_Speech_API, 2019.
[62] L. Wilkinson. The grammar of graphics. Springer Science & BusinessMedia, 2013.
[63] WolframAlpha. https://www.wolframalpha.com/.[64] K. Wongsuphasawat, D. Moritz, A. Anand, J. Mackinlay, B. Howe, and
J. Heer. Voyager: Exploratory analysis via faceted browsing of visualiza-tion recommendations. IEEE transactions on visualization and computergraphics, 22(1):649–658, 2015.
[65] K. Wongsuphasawat, D. Moritz, A. Anand, J. Mackinlay, B. Howe, andJ. Heer. Towards a general-purpose query language for visualizationrecommendation. In Proceedings of the HILDA Workshop, pp. 1–6, 2016.
[66] K. Wongsuphasawat, Z. Qu, D. Moritz, R. Chang, F. Ouk, A. Anand,J. Mackinlay, B. Howe, and J. Heer. Voyager 2: Augmenting visualanalysis with partial view specifications. In Proceedings of ACM CHI, pp.2648–2659, 2017.
[67] Z. Wu and M. Palmer. Verbs semantics and lexical selection. In Proceed-ings of ACL, pp. 133–138, 1994.
[68] T. Young, D. Hazarika, S. Poria, and E. Cambria. Recent trends in deeplearning based natural language processing. IEEE Computational Intelli-gence magazine, 13(3):55–75, 2018.
[69] B. Yu and C. T. Silva. FlowSense: A natural language interface forvisual data exploration within a dataflow system. IEEE Transactions onVisualization and Computer Graphics, 26(1):1–11, 2019.
[70] D. Zhang, Y. Suhara, J. Li, M. Hulsebos, C. Demiralp, and W.-C. Tan.Sato: Contextual semantic type detection in tables. arXiv preprintarXiv:1911.06311, 2019.
[71] V. Zhong, C. Xiong, and R. Socher. Seq2SQL: Generating StructuredQueries from Natural Language using Reinforcement Learning. CoRR,abs/1709.00103, 2017.
11