nlmk presentation 2013
TRANSCRIPT
1
NLMK
Moscow, 27 March 2014
Q4 2013 AND 12M 2013 US GAAP CONSOLIDATED RESULTS

This document is confidential and has been prepared by NLMK (the “Company”) solely for use at the investor presentation of the Company and may not be reproduced, retransmitted or further distributed to any other person or published, in whole or in part, for any other purpose. This document does not constitute or form part of any advertisement of securities, any offer or invitation to sell or issue or any solicitation of any offer to purchase or subscribe for, any shares in the Company or Global Depositary Shares (GDSs), nor shall it or any part of it nor the fact of its presentation or distribution form the basis of, or be relied on in connection with, any contract or investment decision. No reliance may be placed for any purpose whatsoever on the information contained in this document or on assumptions made as to its completeness. No representation or warranty, express or implied, is given by the Company, its subsidiaries or any of their respective advisers, officers, employees or agents, as to the accuracy of the information or opinions or for any loss howsoever arising, directly or indirectly, from any use of this presentation or its contents. This document is for distribution only in the United Kingdom and the presentation is being made only in the United Kingdom to persons having professional experience in matters relating to investments falling within Article 19(1) of the Financial Services and Markets Act 2000 (Financial Promotion) Order 2005 (the “Order”) or high net worth entities, and other persons to whom it may otherwise lawfully be communicated, falling within Article 49(2) of the Order (all such persons together being referred to as “relevant persons”). Any person who is not a relevant person should not act or rely on this presentation or any of its contents. The distribution of this document in other jurisdictions may be restricted by law and any person into whose possession this document comes should inform themselves about, and observe, any such restrictions. This document may include forward-looking statements. These forward-looking statements include matters that are not historical facts or statements regarding the Company’s intentions, beliefs or current expectations concerning, among other things, the Company’s results of operations, financial condition, liquidity, prospects, growth, strategies, and the industry in which the Company operates. By their nature, forwarding-looking statements involve risks and uncertainties because they relate to events and depend on circumstances that may or may not occur in the future. The Company cautions you that forward-looking statements are not guarantees of future performance and that the Company’s actual results of operations, financial condition and liquidity and the development of the industry in which the Company operates may differ materially from those made in or suggested by the forward-looking statements contained in this document. In addition, even if the Company’s results of operations, financial condition and liquidity and the development of the industry in which the Company operates are consistent with the forward-looking statements contained in this document, those results or developments may not be indicative of results or developments in future periods. The Company does not undertake any obligation to review or confirm analysts’ expectations or estimates or to update any forward-looking statements to reflect events that occur or circumstances that arise after the date of this presentation. By attending/viewing/downloading this presentation you agree to be bound by the foregoing terms.
DISCLAIMER
2
200
300
400
500
600
700
800
900
Jan
-12
Feb
-12
Mar
-12
Ap
r-1
2M
ay-1
2Ju
n-1
2Ju
l-1
2A
ug-
12
Sep
-12
Oct
-12
No
v-1
2D
ec-1
2Ja
n-1
3Fe
b-1
3M
ar-1
3A
pr-
13
May
-13
Jun
-13
Jul-
13
Au
g-1
3Se
p-1
3O
ct-1
3N
ov-
13
Dec
-13
Jan
-14
Feb
-14
Mar
-14
HRC USA, EXW HRC Europe, EXW
HRC China, EXW HRC Russia, EXW
55%
65%
75%
85%
Jan
-12
Feb
-12
Mar
-12
Ap
r-1
2M
ay-1
2Ju
n-1
2Ju
l-1
2A
ug-
12
Sep
-12
Oct
-12
No
v-1
2D
ec-1
2Ja
n-1
3Fe
b-1
3M
ar-1
3A
pr-
13
May
-13
Jun
-13
Jul-
13
Au
g-1
3Se
p-1
3O
ct-1
3N
ov-
13
Dec
-13
Jan
-14
Feb
-14
Global average China North America EU (27)
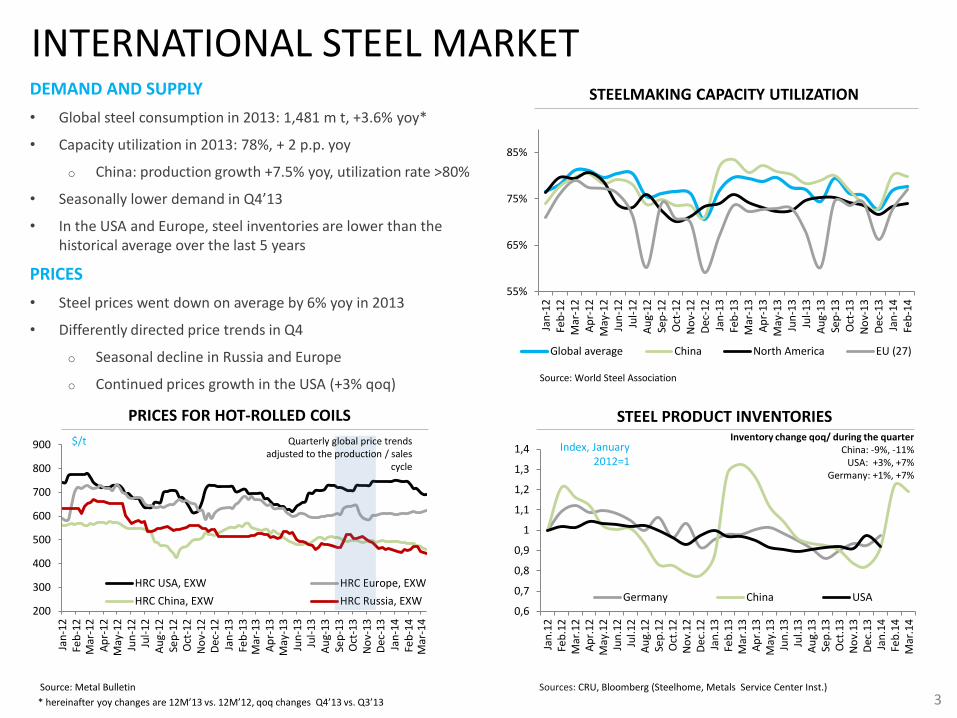
INTERNATIONAL STEEL MARKET DEMAND AND SUPPLY
• Global steel consumption in 2013: 1,481 m t, +3.6% yoy*
• Capacity utilization in 2013: 78%, + 2 p.p. yoy
o China: production growth +7.5% yoy, utilization rate >80%
• Seasonally lower demand in Q4’13
• In the USA and Europe, steel inventories are lower than the historical average over the last 5 years
PRICES
• Steel prices went down on average by 6% yoy in 2013
• Differently directed price trends in Q4
o Seasonal decline in Russia and Europe
o Continued prices growth in the USA (+3% qoq)
PRICES FOR HOT-ROLLED COILS
$/t Quarterly global price trends adjusted to the production / sales
cycle
Source: Metal Bulletin
3
STEELMAKING CAPACITY UTILIZATION
Source: World Steel Association
0,6
0,7
0,8
0,9
1
1,1
1,2
1,3
1,4
Jan
.12
Feb
.12
Mar
.12
Ap
r.1
2M
ay.1
2Ju
n.1
2Ju
l.12
Au
g.1
2Se
p.1
2O
ct.1
2N
ov.
12
Dec
.12
Jan
.13
Feb
.13
Mar
.13
Ap
r.1
3M
ay.1
3Ju
n.1
3Ju
l.13
Au
g.1
3Se
p.1
3O
ct.1
3N
ov.
13
Dec
.13
Jan
.14
Feb
.14
Mar
.14
Germany China USA
Index, January 2012=1
STEEL PRODUCT INVENTORIES
Sources: CRU, Bloomberg (Steelhome, Metals Service Center Inst.)
Inventory change qoq/ during the quarter China: -9%, -11%
USA: +3%, +7% Germany: +1%, +7%
* hereinafter yoy changes are 12M’13 vs. 12M’12, qoq changes Q4’13 vs. Q3’13
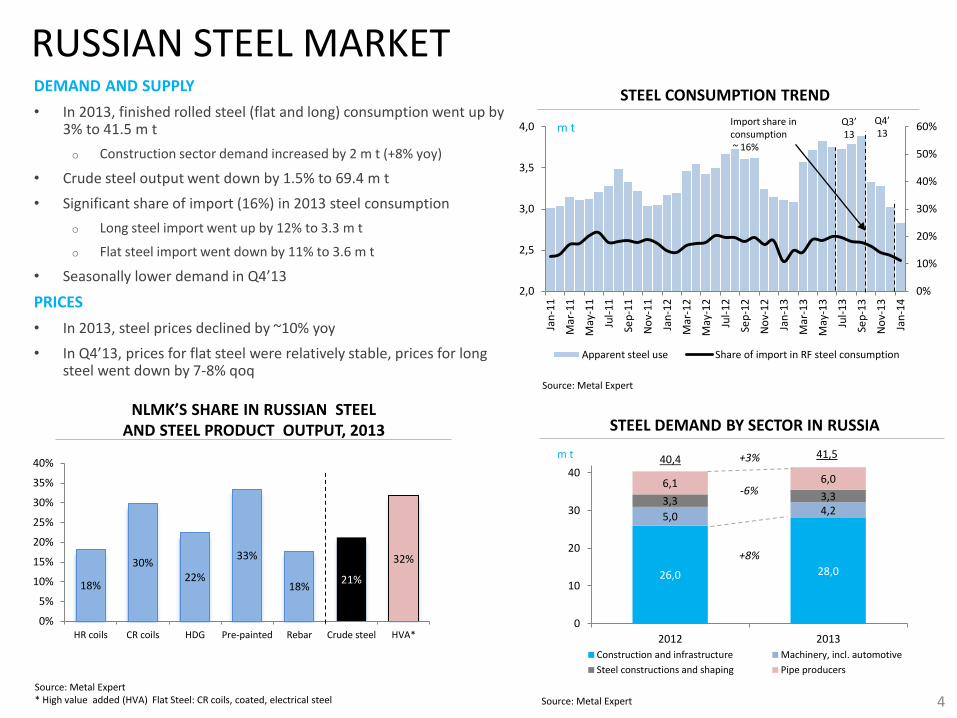
RUSSIAN STEEL MARKET
0%
10%
20%
30%
40%
50%
60%
2,0
2,5
3,0
3,5
4,0
Jan
-11
Mar
-11
May
-11
Jul-
11
Sep
-11
No
v-1
1
Jan
-12
Mar
-12
May
-12
Jul-
12
Sep
-12
No
v-1
2
Jan
-13
Mar
-13
May
-13
Jul-
13
Sep
-13
No
v-1
3
Jan
-14
Apparent steel use Share of import in RF steel consumption
STEEL CONSUMPTION TREND
m t
Source: Metal Expert
DEMAND AND SUPPLY
• In 2013, finished rolled steel (flat and long) consumption went up by 3% to 41.5 m t
o Construction sector demand increased by 2 m t (+8% yoy)
• Crude steel output went down by 1.5% to 69.4 m t
• Significant share of import (16%) in 2013 steel consumption
o Long steel import went up by 12% to 3.3 m t
o Flat steel import went down by 11% to 3.6 m t
• Seasonally lower demand in Q4’13
PRICES
• In 2013, steel prices declined by ~10% yoy
• In Q4’13, prices for flat steel were relatively stable, prices for long steel went down by 7-8% qoq
Import share in consumption ~ 16%
4 Source: Metal Expert * High value added (HVA) Flat Steel: CR coils, coated, electrical steel Source: Metal Expert
NLMK’S SHARE IN RUSSIAN STEEL AND STEEL PRODUCT OUTPUT, 2013
18%
30% 22%
33%
18% 21%
32%
0%
5%
10%
15%
20%
25%
30%
35%
40%
HR coils CR coils HDG Pre-painted Rebar Crude steel HVA*
Q3’ 13
Q4’ 13
STEEL DEMAND BY SECTOR IN RUSSIA
26,0 28,0
5,0 4,2
3,3 3,3 6,1 6,0
0
10
20
30
40
2012 2013
Construction and infrastructure Machinery, incl. automotive
Steel constructions and shaping Pipe producers
m t
+8%
-6%
+3% 40,4 41,5

40
50
60
70
80
90
100
110
Jan
-11
Mar
-11
May
-11
Jul-
11
Sep
-11
No
v-1
1Ja
n-1
2M
ar-1
2M
ay-1
2Ju
l-1
2Se
p-1
2N
ov-
12
Jan
-13
Mar
-13
May
-13
Jul-
13
Sep
-13
No
v-1
3Ja
n-1
4
RAW MATERIALS MARKET PRICES AND DEMAND IN INTERNATIONAL MARKETS
• 2013 average prices vs 2012:
o Iron ore prices in China: +3% yoy. Demand for iron ore remained high: import to China went up by 10% yoy in 2013
o Prices for coking coal and scrap: -24% yoy and -6% yoy, respectively
• In Q4 2013:
o Average prices for iron ore of $135/t CFR China supported steel prices
o Prices for coking coal went down by 6% qoq due to weakened demand from China
RAW MATERIALS MARKET IN RUSSIA REMAINS OVERSUPPLIED
GLOBAL RAW MATERIAL PRICES
Source: Metal Bulletin
5
0,3
0,4
0,5
0,6
0,7
0,8
0,9
1,0
1,1
1,2
Jan
-12
Feb
-12
Mar
-12
Ap
r-1
2
May
-12
Jun
-12
Au
g-1
2
Sep
-12
Oct
-12
No
v-1
2
Dec
-12
Feb
-13
Mar
-13
Ap
r-1
3
May
-13
Jun
-13
Jul-
13
Sep
-13
Oct
-13
No
v-1
3
Dec
-13
Jan
-14
Feb
-14
Iron ore fines (Fe 62%) import China, CFR
Coking coal, export Australia, FOB
Scrap export Europe, FOB
HRC China export, FOB
CHINA: IRON IMPORT AND INVENTORIES
m t
Source: Bloomberg
-22% yoy
+16% in Q4
745
820
100
200
300
400
500
600
700
800
900
Импорт ЖРС
2012 2013
+10%
IRON ORE IMPORT IRON ORE INVENTORIES AT CHINA PORTS
RUSSIA: RAW MATERIALS MARKET BALANCE
Source: Metal Expert
m t
Q4’ 13
-17,5 -21,5
40,6 39,4
2,0 2,0
-25
-15
-5
5
15
25
35
45
Export Sales to domestic market Import
2012 2013

0%
20%
40%
60%
80%
100%
120%
Q1
'08
Q2
'08
Q3
'08
Q4
'08
Q1
'09
Q2
'09
Q3
'09
Q4
'09
Q1
'10
Q2
'10
Q3
'10
Q4
'10
Q1
'11
Q2
'11
Q3
'11
Q4
'11
Q1
'12
Q2
'12
Q3
'12
Q4
'12
Q1
'13
Q2
'13
Q3
'13
Q4
'13
Novolipetsk
Average world rate
3,0 3,1 3,1 3,2
0,5 0,5 0,6 0,7 0,2 0,2 0,2 0,2
3,7 3,8 3,9 4,1
Q1'13 Q2'13 Q3'13 Q4'13
Steel segment Long products segment
Foreign rolled products segment
PRODUCTION RESULTS HIGH CAPACITY UTILIZATION RATES
• Steel production in 2013: 15.4 m t (+3% yoy)
o NLMK Kaluga: 0.4 m t
• Steel production in Q4’13: 4.1 m t (+5% qoq)
o NLMK Kaluga: 0.2 m t (+166% qoq)
• Steelmaking capacities utilization rate in Q4’13: 96%
o Novolipetsk: 100%
o NLMK Long Products (incl. NLMK Kaluga): 87%
o NLMK Indiana: 85%
6
NLMK: STEELMAKING CAPACITY UTILIZATION STEEMAKING CAPACITY UTILIZATION
Source: global capacity utilization rate according to WSA
NLMK: STEEL PRODUCTION*
m t
* excluding NLMK Verona output in Q4‘13
12,2 12,4
1,8 2,2 0,9 0,8
2012 2013
14,9 15,4
91% 90%
99% 96%
85% 87%
100%
96%
70%
80%
90%
100%
NLMK USA NLMK Longproducts
Novolipetsk NLMK Group
Q3'13 Q4'13
1,60 1,46
0,60 0,66
0,43 0,25
0,51 0,67
0,22 0,25 0,36 0,28
0
1
2
3
Q3'13 Q4'13
Others S.E. Asia N. America M. East* EU Russia
76%
12%
12%
0%
20%
40%
60%
80%
100%
Sales by sectorQ4'13
Pipe producers
Machinery
Construction andinfrastructure
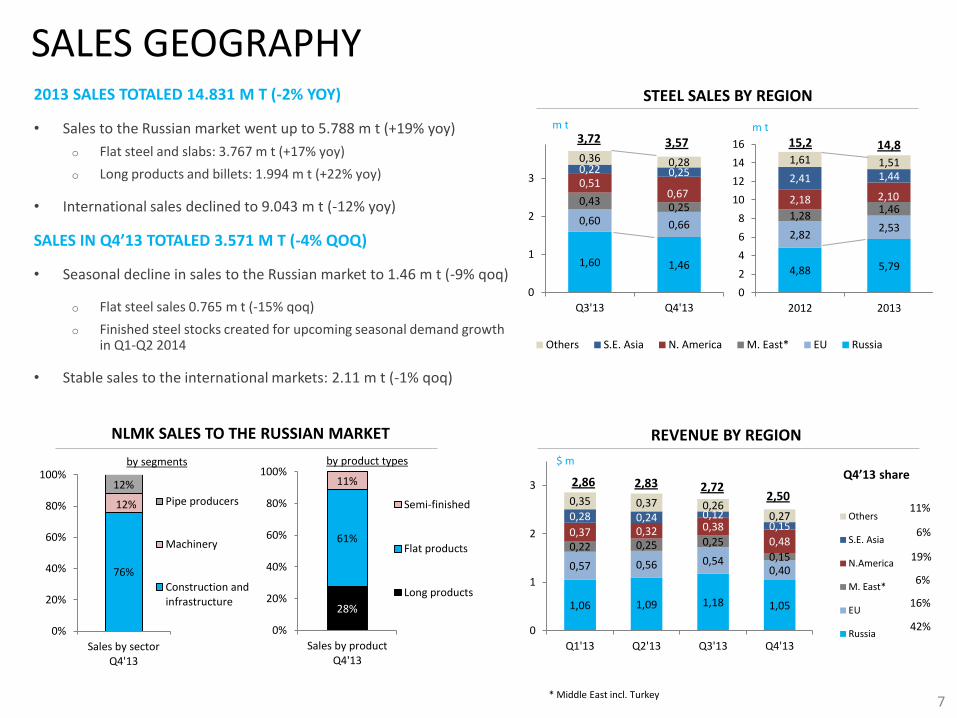
SALES GEOGRAPHY 2013 SALES TOTALED 14.831 M T (-2% YOY)
• Sales to the Russian market went up to 5.788 m t (+19% yoy)
o Flat steel and slabs: 3.767 m t (+17% yoy)
o Long products and billets: 1.994 m t (+22% yoy)
• International sales declined to 9.043 m t (-12% yoy)
SALES IN Q4’13 TOTALED 3.571 M T (-4% QOQ)
• Seasonal decline in sales to the Russian market to 1.46 m t (-9% qoq)
o Flat steel sales 0.765 m t (-15% qoq)
o Finished steel stocks created for upcoming seasonal demand growth in Q1-Q2 2014
• Stable sales to the international markets: 2.11 m t (-1% qoq)
7
NLMK SALES TO THE RUSSIAN MARKET
28%
61%
11%
0%
20%
40%
60%
80%
100%
Sales by productQ4'13
Semi-finished
Flat products
Long products
REVENUE BY REGION
1,06 1,09 1,18 1,05
0,57 0,56 0,54 0,40
0,22 0,25 0,25
0,15
0,37 0,32 0,38 0,48
0,28 0,24 0,12 0,15
0,35 0,37 0,26 0,27
0
1
2
3
Q1'13 Q2'13 Q3'13 Q4'13
Others
S.E. Asia
N.America
M. East*
EU
Russia
2,86
$ m
2,83 2,72
STEEL SALES BY REGION
m t 3,72 3,57
Q4’13 share by segments by product types
11%
6%
19%
6%
16%
42%
* Middle East incl. Turkey
4,88 5,79
2,82 2,53
1,28 1,46
2,18 2,10
2,41 1,44
1,61 1,51
0
2
4
6
8
10
12
14
16
2012 2013
m t
15,2 14,8
2,50

SALES STRUCTURE 12М ’13: HIGHER SHARE OF HVA
• Share of finished steel in total sales: 71% (+1 p.p. yoy)
o sales of long products +18% yoy following the launch of NLMK Kaluga
• Sales of pig iron went down to 0.17 m t (-73% yoy)
• Sales of thick plates: equipment upgrade at NLMK Dansteel during
2013 and NBH deconsolidation in Q4’13
Q4’13: DECONSOLIDATION OF NBH RESULTS
• Slab sales increased by 57% qoq
• Finished steel sales decreased by 23% qoq
• Finished steel share: 63% (-15 p.p.)
8
SALES BY PRODUCT
* Note: Revenue from other operations includes revenues from sales of iron ore, coke, scrap and others
CHANGE IN SALES BY PRODUCT 2013/2012 REVENUE BY PRODUCT
9% 7%
13% 13%
10% 11%
23%
16%
14% 26%
9% 10%
Q3 '13 Q4 '13
0%
20%
40%
60%
80%
100%Revenue from otheroperations*Slabs
Billets
HRC
Long products
Metalware
Plate
CRC
Galvanized
Pre-painted
Electrical steel
$2.505 billion $2.720 billion
15% 14% 13% 13%
8% 7% 7%
12%
13% 9% 11%
28%
19%
25% 24%
21%
34% 26% 27%
Q3'13 Q4'13 2012 2013
Pig iron
Slabs
Billets
HRC
Long products
Plate
Galvanized
Pre-painted
CRC
Metalware
Electrical steel
3,724 15,184 3,571 14,831
-16%
-5%
-5%
-4%
-1%
3%
3%
7%
18%
-20% -10% 0% 10% 20%
Thick plates
HRC
Pre-painted
Galvanised
CRC
Electrical steel
Slabs
Metalware
Long products
m t

NLMK PRODUCTION SYSTEM
9
211
26 7
Technology of productionprocesses
Energy efficiency
Labor efficiency
$ m
*To 2012 level. Including $12 m of savings at NBH
STRUCTURAL EFFECT ON COSTS IN 2013*
$244 m
EFFICIENCY IMPROVEMENT PROGRAM FOR NLMK GROUP
COMPANIES
NLMK PRODUCTION SYSTEM DEVELOPMENT
o Roll-out at all divisions, sites and production processes
o Covers process technology, equipment and practices
o Clear cost, productivity and quality targets
o Continuous process monitoring and control
o Lean manufacturing tools
o Incentivizing and engaging personnel
MANAGEMENT SYSTEM SUPPORT
o Financial controls
o Management by objectives and incentive systems
STRUCTURAL SAVINGS IN 2013: $244 MPA
33
59
69
83
244
Q1'13 Q2'13 Q3'13 Q4'13 2013
$ m
STRUCTURAL EFFECT ON COSTS IN 2013*

12,2 10,9
2,8 2,9 2,8 2,7 2,5 1,9 1,5
0,4 0,3 0,4 0,4 0,4
16% 14% 14%
11%
14% 14%
16%
0%
5%
10%
15%
20%
-
2,0
4,0
6,0
8,0
10,0
12,0
14,0
2012 2013 Q42012
Q12013
Q22013
Q32013
Q42013
Revenue EBITDA EBITDA margin
KEY HIGHLIGHTS 2013 FINANCIAL RESULTS
• Revenue $10,909 m (-10% yoy)
• EBITDA $1,505 m (-21% yoy)
• EBITDA margin 13.8% (-1.8 p.p.)
• Operating cash flow* $1,219 m (-33% yoy)
• Investments** $756 m (-48% yoy)
• Net income $189 m (-68% yoy)
• Net debt *** $2,702 m
• Net debt/12M EBITDA*** 1.8х
FINANCIAL RESULTS Q4’13
• Revenue $2,505 m (-8% qoq)
• EBITDA $409 m (+8% qoq)
• EBITDA margin 16.3% (+2.4 p.p.)
10
* Operating cash flow before net interest income and expenses ** Investments include interest capitalized *** Net debt w/o NBH debt, guaranteed by NLMK Group
$ bn
$ bn
PROFITABILITY 2012-2013
OPERATING CASH FLOW AND INVESTMENTS
1,8
1,2
1,5
0,8
0
0,5
1
1,5
2
2012 2013
Operating cash flow* Investments **
PROFITABILITY
11
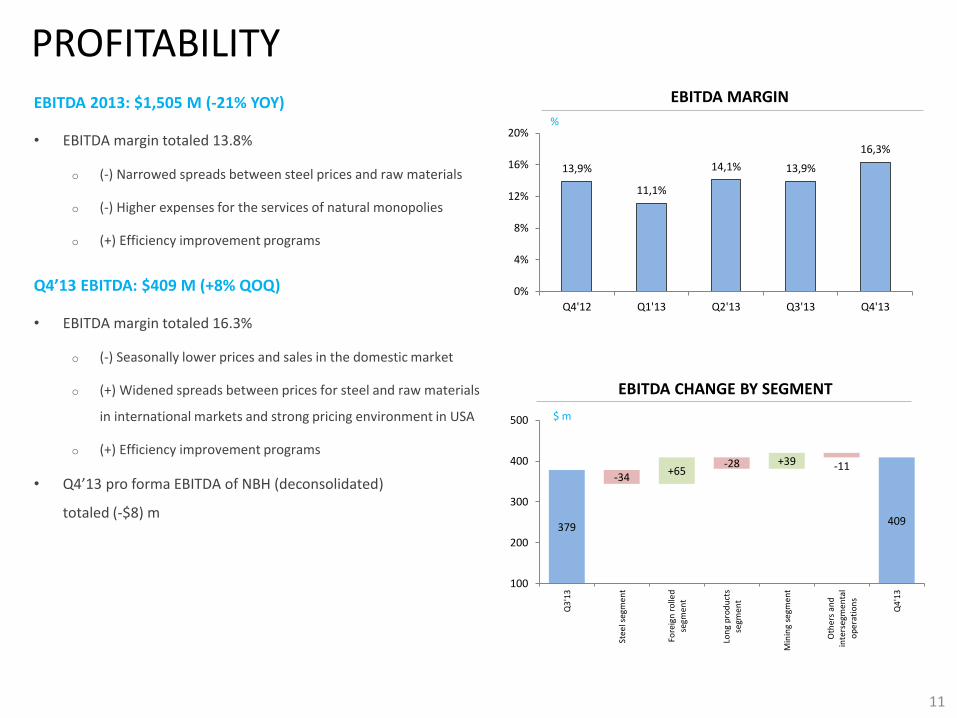
EBITDA 2013: $1,505 M (-21% YOY)
• EBITDA margin totaled 13.8%
o (-) Narrowed spreads between steel prices and raw materials
o (-) Higher expenses for the services of natural monopolies
o (+) Efficiency improvement programs
Q4’13 EBITDA: $409 M (+8% QOQ)
• EBITDA margin totaled 16.3%
o (-) Seasonally lower prices and sales in the domestic market
o (+) Widened spreads between prices for steel and raw materials
in international markets and strong pricing environment in USA
o (+) Efficiency improvement programs
• Q4’13 pro forma EBITDA of NBH (deconsolidated)
totaled (-$8) m
EBITDA CHANGE BY SEGMENT
$ m
13,9%
11,1%
14,1% 13,9%
16,3%
0%
4%
8%
12%
16%
20%
Q4'12 Q1'13 Q2'13 Q3'13 Q4'13
EBITDA MARGIN
%
379
-34 +65
-28 +39 -11
409
100
200
300
400
500
Q3
'13
Stee
l seg
men
t
Fore
ign
ro
lled
segm
ent
Lon
g p
rod
uct
sse
gmen
t
Min
ing
segm
ent
Oth
ers
and
inte
rseg
men
tal
op
erat
ion
s
Q4
'13

EBITDA
Working capital changes
Other non-cash operations
Income tax
Net interest *
NET OPERATING CASH FLOW
Capital expenditures **
FREE CASH FLOW TO THE FIRM
Net repayment of borrowings
FREE CASH FLOW TO EQUITY
Change in deposits
FX rate change
CHANGE IN CASH
CASH FLOW
FREE CASH FLOW TO THE FIRM IN 2013:
$544 M (+63% YOY)
• (-) EBITDA $1,505 m (-21% yoy)
• (+) Investments $756 m (-48% yoy)
• Stable working capital level
Q4’13 FCF: $92 M
• (+) EBITDA $409 m (+8% qoq)
• (-) Working capital increase by $106 m
o Finished steel from Novolipetsk to be sold in Q1-Q2 2014
o NLMK Kaluga production ramp-up
• (+) Investments $98 m (-65% qoq)
* Interest paid (does not include capitalized interest): $10 m, interest received: $12 m ** Including capitalized interest of $21 m 12
Q4‘13 CASH FLOW BRIDGE
135
1
30
104
12
92
98
190
2
36
78
106
409
$ m

3,0
2,5
2,7
3,1
3,3 3,4
3,6
3,3
2,0
2,2
2,4
2,6
2,8
3,0
3,2
3,4
3,6
3,8
Q1'12
Q2'12
Q3'12
Q4'12
Q1'13
Q2'13
Q3'13
Q4'13
3,5 3,0
0,6
+0,34
-0,33 1,1
0
1
2
3
4
5
30 Sep'13 Borrowings Settlements 31 Dec'13
ST debt LT debt
2,8
0,2 0,1
2,7
2,0
2,2
2,4
2,6
2,8
3,0
30 Sep'13 Operating cashflow
Capital expeditures 31 Dec'13
DEBT POSITION
13
MATURITY AND NET DEBT/EBITDA
Weighted average maturity
Years to maturity
1,69
1,90
1,84
1,88
1,93
2,15
1,87
1,80
0,0
0,5
1,0
1,5
2,0
2,5
3,0
Q1'12
Q2'12
Q3'12
Q4'12
Q1'13
Q2'13
Q3'13
Q4'13
Net debt/EBITDA
CHANGE IN DEBT POSITION
NET DEBT CHANGE
$ bn
$ bn
CONSISTENT REDUCTION OF NET DEBT AND LIQUIDITY
IMPROVEMENT
• Net debt* $2.70 bn (-3% qoq)
• Gross debt $4.16 bn (+1% qoq)
• Cash and equivalents** $1.45 bn (+8% qoq)
• Net debt / 12M EBITDA * 1.8х
* W/o NBH debt, guaranteed by NLMK Group ** Cash and equivalents and ST investments

1 455
1 070
2 960
60 466 211 333
$0
$500
$1 000
$1 500
$2 000
$2 500
$3 000
$3 500
$4 000
$4 500
$5 000
Liquid assets Q1 '14 Q2'14 Q3'14 Q4 '14 12M
SETTLEMENT OF FINANCIAL LIABILITIES
14
ЛИКВИДНЫЕ СРЕДСТВА И ГРАФИК ПОГАШЕНИЯ К/С ДОЛГА*
TOTAL DEBT MATURITY SCHEDULE ***
$ m Undrawn committed credit lines
Cash and equivalents
INTEREST EXPENSES **
31 31 27 22 33
37 33
35 35
22
0%
5%
10%
15%
20%
25%
0
10
20
30
40
50
60
70
Q4'12 Q1'13 Q2'13 Q3'13 Q4'13
Capitalized interest expense (lhs) Non-capitalized interest expense (lhs)
Interest expense to EBITDA (rhs)
$ m
55 57 62
64 68
SIGNIFICANT LIQUIDITY POSITION
COMFORTABLE MATURITY SCHEDULE
• Short term debt $1.1 bn
o Ruble bonds
o Revolving credit lines for working capital financing
o ECA financing
• Long term debt $3.0 bn
o Eurobonds and ruble bonds
o Long term part of ECA
$0
$200
$400
$600
$800
$1 000
$1 200
2014 2015 2016 2017 2018 2019 andonward
Other debt
Revolving credit lines for working capital financing
Eurobonds (USD)
ECA-financing and investments credits
Ruble bonds
1 070
721
428 367
917
591
$ m
* ST maturity payments without interest accrued and debt maturity schedule (according to management data) ** Quarterly figures are derived by computational method on the basis of quarterly reports *** Maturity payments do not include interest payments

Q4 2014 OUTLOOK
15
PRODUCTION AND SALES
• In Q1’14, we expect stable output of steel and higher sales driven by improved condition in international and domestic markets
FINANCIAL RESULTS
• In Q1’14, we expect a seasonal improvement in demand for steel products. Together with the ongoing efficiency programs and positive impact from the RUB weakening against the USD on the Company’s expenses, this should result in improved financials (qoq).


-45%
-41%
1%
13%
7%
1%
-12%
-10%
SEGMENT CONTRIBUTION – Q4 ‘13
153
12
228
30 14
409
$0
$50
$100
$150
$200
$250
$300
$350
$400
$450
Stee
lse
gmen
t
Lon
gp
rod
uct
sse
gmen
t
Min
ing
segm
ent
Fore
ign
rolle
dp
rod
uct
s
Oth
er
fact
ors
Q4
'13
SEGMENT CONTRIBUTION TO Q4’13 EBITDA
$ m
197 83
214 187 153
31
20
23 40 12
207
215
227 190 228
27
26
-2 -2 -14 -72 -26 -62 -35
30
-$90
$110
$310
$510
Q4'12 Q1'13 Q2'13 Q3'13 Q4'13
Steel segment Long products segment
Mining segment Other operations and intersegmental
Foregn rolled segment
EBITDA BY SEGMENT
$ m
17
STEEL SEGMENT
• Seasonal reduction in prices and sales on the domestic market
• Widened spreads between steel and raw materials
• Efficiency improvement programs
LONG PRODUCTS SEGMENT
• Seasonal decline in prices and narrowing of spreads between steel and raw materials
MINING SEGMENT
• Average sales prices growth driven by international price trends
FOREIGN ROLLED PRODUCTS SEGMENT
• Change of the segment perimeter: NLMK USA and NLMK Dansteel
SEGMENT FINANCIAL INDICATORS CHANGE Q4/Q3
Steel segment
Foreign rolled products segment
Revenue
Production expenses
Revenue
Revenue
Revenue
Production expenses
Production expenses
Production expenses
409 379 400
318
390
Long products segment
Mining segment

1,70 1,66 1,68 1,53 1,60
0,35 0,35 0,37 0,47 0,21
0,20 0,08
0,21 0,19 0,15
0,0
0,5
1,0
1,5
2,0
2,5
Q4'12 Q1'13 Q2'13 Q3'13 Q4'13
Revenue from intra-group sales Revenue from third-party sales EBITDA
9,6% 4,2%
10,4% 9,3% 8,5%
EBITDA margin
STEEL SEGMENT Q4 REVENUE DOWN BY 10%
• Finished product sales down by 21% to 1,141 m t
o Seasonality factor
o Slabs sales profitability increased
• Higher finished product inventories to be sold in Q1-2’14 on the back of
improved market conditions
HIGHER EXTERNAL SALES (+8%) AND EXTERNAL REVENUE (+4%)
• NBH deconsolidation: slab sales to NBH recognized as external sales
STABLE PROFITABILITY: EBITDA 9%
• Seasonal reduction in prices and sales in the domestic market
• Wider steel/raw material price spreads
• Efficiency enhancement programs
• One-off repairs at Novolipetsk
5% 6% 4% 6% 7% 9% 6%
7% 7%
9% 15% 19% 15%
17% 17%
28% 14%
23%
51%
34%
40% 24%
8% 8%
0%
20%
40%
60%
80%
100%
Q4 sales Q3 sales Q4 revenue Q3 revenue
Income from otheroperations*Pig iron
Slabs
HRC
CRC
HDG
Pre-painted
Dynamo
Transformer
THIRD PARTY SALES AND REVENUE STRUCTURE
2,395 k t $1,595 m
* Revenue from other products and services
$ bn
REVENUE AND EBITDA COST OF SALES IN Q4’13
18
2,210 k t $1,529 m
31%
21% 7%
5% 5%
5%
6% 2%
12%
-3% 9%
Iron ore
Coke and coal
Scrap
Ferroalloys
Raw and other materials
Electrci energy
Natual gas
Other enegry resources
Personnel costs
Other costs and changes in WIP and finished productinventoriesDepreciation
281 288 314 355
371 88
59 113
114 102
31 20 23 40 12
0
70
140
210
280
350
420
490
560
Q4'12 Q1'13 Q2'13 Q3'13 Q4'13
Revenue from intra-group sales Revenue from third-party sales EBITDA
8%
6% 5%
8%
3%
EBITDA margin
12% 14% 13% 15%
11% 5%
52%
71%
73% 77%
36% 15% 0%
0% 0% 3% 3%
0%
20%
40%
60%
80%
100%
Q4 sales Q3 sales Q4 revenue Q3 revenue
Income from otheroperations*
NLMK Kaluga
Long products
Metalware
LONG PRODUCTS SEGMENT HIGHER SALES AND REVENUES FROM THIRD PARTIES
• Increase in NLMK Kaluga utilization rates
PROFITABILITY DOWN TO 3%
• Seasonal reduction in prices for long products
• Narrower long product/scrap price spreads: seasonally high
scrap prices
570 k t $355 m
$ m
THIRD PARTY SALES AND REVENUE STRUCTURE
19
* Revenue from other products
REVENUE AND EBITDA COST OF SALES IN Q4’13
$371 m 635 k t
* Revenue from intra-group sales in represented mostly by ferrous scrap deliveries to the Lipetsk site
66% 3% 1%
9%
9%
7% 6%
Scrap
Ferroalloys
Raw and other materials
Electric energy
Labour costs
Other costs
Depreciation

127 92 100 86 94
220 245 249 226
259
207 215 227 190
228
0
100
200
300
400
500
Q4'12 Q1'13 Q2'13 Q3'13 Q4'13Revenue from intra-group sales
Revenue from third-party sales
EBITDA
60% 64%
65%
61%
65%
EBITDA margin
MINING SEGMENT Q4’13 REVENUE GROWTH BY 13% QOQ
• Higher iron ore sales (concentrate and sinter ore): 3,694 m t (+2% qoq)
o 77% (+1 p.p.) to the Lipetsk site
EBITDA MARGIN GROWTH TO ДО 65%
• Average sales price growth on the back of higher prices in the global market
20
77% 76% 71% 72%
23% 24% 22% 23%
7% 3%
0%
20%
40%
60%
80%
100%
Q4 sales Q3 sales Q4 revenue Q3 revenue
Other operations* Iron ore sales to third parties
Iron ore sales to Novolipetsk
SALES AND REVENUE STRUCTURE
$ m
REVENUE AND EBITDA COST OF SALES IN Q4’13
3,860 k t $312 m $353 m 3,964 k t
* Other operations include limestone and dolomite sales
7%
26%
1% 6%
24%
20%
17%
Raw and other materials
Electric energy
Natural gas
Other energy resources
Personnel costs
Other costs
Depriciation

692
817 730 750
445
-72 -26 -62 -35 30
-10%
-3%
-9% -5%
7%
-15%
-10%
-5%
0%
5%
10%
-200
0
200
400
600
800
1 000
Q4'12 Q1'13 Q2'13 Q3'13 Q4'13
Segment revenue EBITDA EBITDA margin (r.h.)
55% 61% 49% 54%
28% 24%
29% 26%
18% 14% 19% 16%
3% 3%
0%
20%
40%
60%
80%
100%
Q4 sales Q3 sales Q4 revenue Q3 revenue
Otheroperations
Pre-painted
CRC
HRC
FOREIGN ROLLED PRODUCTS SEGMENT NBH DECONSOLIDATION
• Change of the segment perimeter: NLMK USA и NLMK Dansteel
remained within the segment
• NBH results are excluded from the segment results in Q4’13
POSITIVE EBITDA OF $30 MILLION IN Q4’13
• Relatively stable sales for NLMK USA and NLMK Dansteel (0% qoq)
• Higher sales prices in USA, stable prices in Europe
• EBITDA in Q4 totaled $30 m
$ m
NLMK EUROPE SALES AND REVENUE
NLMK USA SALES AND REVENUE
21
REVENUE AND EBITDA
28% 28%
30% 23%
16% 19%
100%
19%
100%
18%
0%
20%
40%
60%
80%
100%
Sales Q4 Sales Q3 Revenue Q4 Revenue Q3
Other sales
NLMK Dansteel
Pre-painted
CRC
HRC
Thick plates
$364 m $336 m 451’000 t 455’000 t
90,000 t $81 m 490,000 t $414 m
*NLMK Dansteel produce and sell thick plates


1 483
-132
-300
0
300
600
900
1200
1500
1800
Revenue2013
EBITDA2013
FOREIGN ASSETS PERFORMANCE
23
FOREIGN ASSET FINANCIALS
$ m
421
-8
-100
0
100
200
300
400
500
RevenueQ4'13
EBITDAQ4'13
$ m
NLMK USA AND NLMK DANSTEEL STEEL SALES
274 268 275 246
116 110 111 125
82 51 65
80 73 92 92 90
0
50
100
150
200
250
300
Q1'13 Q2'13 Q3'13 Q4'13
HRC CRC Coated steel Thick plates (NLMK Dansteel)
m t
NBH STEEL SALES
134 128 146
204
17 21 14 17
92 105
80 86
151 141 138 152
0
50
100
150
200
250
Q1'13 Q2'13 Q3'13 Q4'13
HRC CRC Coated steel Thick plates
m t
LIPETSK SITE SLAB SALES IN 2013
1,11
0,91
0,76 0,78
0,35
0,48 0,47 0,45
0,11 0,13 0,10 0,13 0,05
-
0,37
0,21
-
0,2
0,4
0,6
0,8
1,0
1,2
Q1'13 Q2'13 Q3'13 Q4'13
To third parties to NBH to NLMK Dansteel to NLMK USA
m t

24
CASH COST OF SLABS
CONSOLIDATED CASH COST OF SLABS (AT LIPETSK SITE)
Cost item Q4’13 Q3’13 ∆, $/t
Coke and coking coal $88 $84 +$4
Iron ore $70 $60 +$10
Scrap $32 $29 +$3
Other materials $26 $27 -$1
Electricity $21 $23 -$2
Natural gas $22 $21 +$1
Personnel $35 $33 +$2
Other expenses $54 $52 +$1
Total $349 $329 +$20
CASH COST OF SLABS (AT LIPETSK SITE), 2012-2013
Period $/t
Q1'12 $395
Q2'12 $411
Q3'12 $383
Q4'12 $361
2012 $388
Q1'13 $364
Q2'13 $348
Q3'13 $329
Q4'13 $349
2013 $348
25
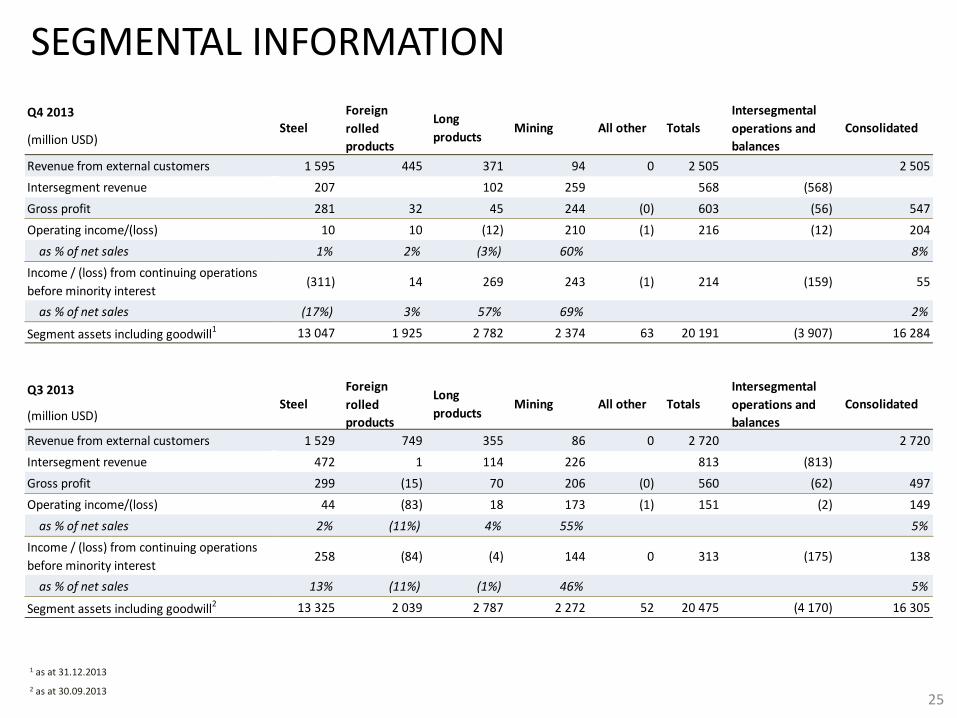
1 as at 31.12.2013
2 as at 30.09.2013
SEGMENTAL INFORMATION
Q4 2013
(million USD)
Revenue from external customers 1 595 445 371 94 0 2 505 2 505
Intersegment revenue 207 102 259 568 (568)
Gross profit 281 32 45 244 (0) 603 (56) 547
Operating income/(loss) 10 10 (12) 210 (1) 216 (12) 204
as % of net sales 1% 2% (3%) 60% 8%
Income / (loss) from continuing operations
before minority interest(311) 14 269 243 (1) 214 (159) 55
as % of net sales (17%) 3% 57% 69% 2%
Segment assets including goodwill1 13 047 1 925 2 782 2 374 63 20 191 (3 907) 16 284
Q3 2013
(million USD)
Revenue from external customers 1 529 749 355 86 0 2 720 2 720
Intersegment revenue 472 1 114 226 813 (813)
Gross profit 299 (15) 70 206 (0) 560 (62) 497
Operating income/(loss) 44 (83) 18 173 (1) 151 (2) 149
as % of net sales 2% (11%) 4% 55% 5%
Income / (loss) from continuing operations
before minority interest258 (84) (4) 144 0 313 (175) 138
as % of net sales 13% (11%) (1%) 46% 5%
Segment assets including goodwill2 13 325 2 039 2 787 2 272 52 20 475 (4 170) 16 305
Totals
Intersegmental
operations and
balances
Consolidated
Steel
Foreign
rolled
products
Long
productsMining All other Totals
Intersegmental
operations and
balances
Consolidated
Steel
Foreign
rolled
products
Long
productsMining All other
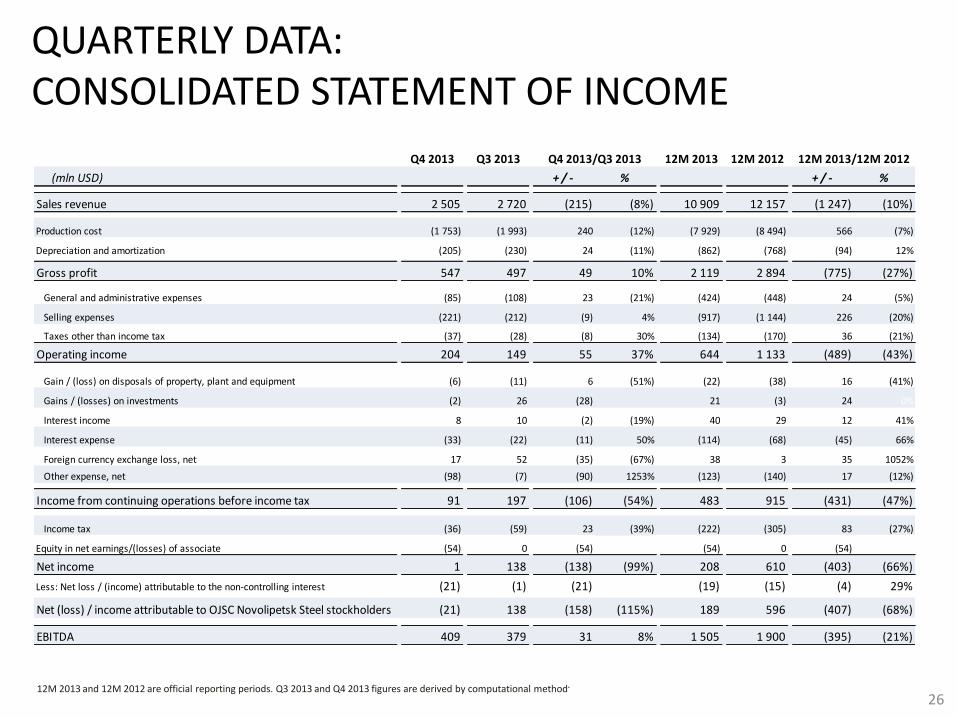
QUARTERLY DATA: CONSOLIDATED STATEMENT OF INCOME
26 12M 2013 and 12M 2012 are official reporting periods. Q3 2013 and Q4 2013 figures are derived by computational method.
Q4 2013 Q3 2013 12M 2013 12M 2012
(mln USD) + / - % + / - %
Sales revenue 2 505 2 720 (215) (8%) 10 909 12 157 (1 247) (10%)
Production cost (1 753) (1 993) 240 (12%) (7 929) (8 494) 566 (7%)
Depreciation and amortization (205) (230) 24 (11%) (862) (768) (94) 12%
Gross profit 547 497 49 10% 2 119 2 894 (775) (27%)
General and administrative expenses (85) (108) 23 (21%) (424) (448) 24 (5%)
Selling expenses (221) (212) (9) 4% (917) (1 144) 226 (20%)
Taxes other than income tax (37) (28) (8) 30% (134) (170) 36 (21%)
Operating income 204 149 55 37% 644 1 133 (489) (43%)
Gain / (loss) on disposals of property, plant and equipment (6) (11) 6 (51%) (22) (38) 16 (41%)
Gains / (losses) on investments (2) 26 (28) 21 (3) 24 0%
Interest income 8 10 (2) (19%) 40 29 12 41%
Interest expense (33) (22) (11) 50% (114) (68) (45) 66%
Foreign currency exchange loss, net 17 52 (35) (67%) 38 3 35 1052%
Other expense, net (98) (7) (90) 1253% (123) (140) 17 (12%)
Income from continuing operations before income tax 91 197 (106) (54%) 483 915 (431) (47%)
Income tax (36) (59) 23 (39%) (222) (305) 83 (27%)
Equity in net earnings/(losses) of associate (54) 0 (54) (54) 0 (54) 0%
Net income 1 138 (138) (99%) 208 610 (403) (66%)
Less: Net loss / (income) attributable to the non-controlling interest (21) (1) (21) (19) (15) (4) 29%0%
Net (loss) / income attributable to OJSC Novolipetsk Steel stockholders (21) 138 (158) (115%) 189 596 (407) (68%)
EBITDA 409 379 31 8% 1 505 1 900 (395) (21%)
Q4 2013/Q3 2013 12M 2013/12M 2012

27
CONSOLIDATED CASH FLOW STATEMENT
12M 2013 and 12M 2012 are official reporting periods. Q3 2013 and Q4 2013 figures are derived by computational method.
Q4 2013 Q3 2013 12M 2013 12M 2012
(mln. USD) + / - % + / - %
Cash flow from operating activities
Net income 1 138 (138) (99%) 208 610 (403) (66%)
Adjustments to reconcile net income to net cash provided by operating Depreciation and amortization 205 230 (24) (11%) 862 768 94 12%Loss on disposals of property, plant and equipment 6 11 (6) (51%) 22 38 (16)(Gain)/loss on investments 2 (26) 28 (21) 3 (24)Interest income (8) (10) 2 (19%) (40) (40)Interest expense 33 22 11 50% 114 68 45 66%Equity in net ernings of associate 54 (0) 54 54 (0) 54Defferd income tax (benefit)/expense 61 20 41 210% 81 21 60Loss / (income) on forward contracts 7 (16) 22 (0) (9) 8Other movements (65) (45) (20) 44% (49) 14 (63)
Changes in operating assets and liabilitiesIncrease in accounts receivables 80 (295) 375 (127%) (337) 167 (504) (302%)Increase in inventories (248) 51 (299) (583%) (96) 170 (266) (156%)Decrease/(increase) in other current assets 2 4 (2) (58%) 7 32 (24) (77%)Increase in accounts payable and oher l iabilities 79 368 (289) (79%) 412 (70) 482Increase/(decrease) in current income tax payable (19) (3) (16) 511% 2 12 (10)
Cash provided from operating activities 189 1 219 1 825Interest received 12 40Interest paid (10) (81)
Net cash provided from operating activities* 190 432 (241) (56%) 1 177 1 825 (647) (35%)
Cash flow from investing activities Proceeds from sale of property, plant and equipment 3 2 2 6 29 (22) (78%)Purchases and construction of property, plant and equipment (98) (281) 183 (65%) (756) (1 453) 697 (48%)
Proceeds from sale / (purchases) of investments, net (107) 11 (117) (87) (87)(Placement) / withdrawal of bank deposits, net 139 (381) 520 (264) (264)Prepayment for acquisition of interests in new subsidiaries (157) 157
Disposal of investments 46 46Acquisition of additional stake in existing subsidiary (10) (10)
Net cash used in investing activities (63) (604) 541 (90%) (1 065) (1 443) 378 (26%)
Cash flow from financing activities
Proceeds from borrowings and notes payable 341 402 (61) (15%) 2 005 1 819 186 10%
Repayments of borrowings and notes payable (330) (601) 271 (45%) (1 996) (1 799) (197) 11%
Capital lease payments (5) (7) 2 (29%) (24) (23) (1) 6%Dividends to shareholders (0) (3) 2 (114) (117) 3 (3%)
Net cash used in financing activities 7 (208) 215 (103%) (128) (119) (9)
Net increase / (decrease) in cash and cash equivalents 134 (381) 515 (135%) (16) 263 (279)
Effect of exchange rate changes on cash and cash equivalents 1 (25) 25 (103%) 35 (109) 143
Cash and cash equivalents at the beginning of the period 835 1 241 (405) (33%) 951 797 154 19%
Cash and cash equivalents at the end of the period 970 835 135 16% 970 951 19 2%
Q4 2013/Q3 2013 12M 2013/12M 2012

28
CONSOLIDATED BALANCE SHEET as at
30.12.2013as at
30.09.2013as at
30.06.2013as at
31.03.2013as at
31.12.2012as at
31.12.2011
(mln. USD)
ASSETS
Current assets 5 102 4 918 5 537 5 834 5 469 5 504Cash and cash equivalents 970 835 1 241 1 220 951 797Short-term investments 485 516 121 271 107 227Accounts receivable, net 1 438 1 540 1 497 1 557 1 491 1 573Inventories, net 2 124 1 897 2 530 2 689 2 827 2 828Deferred income tax assets 78 120 121 71 63 19Other current assets, net 8 9 27 25 30 59
Non-current assets 11 182 11 388 12 101 12 677 12 988 11 753Long-term investments, net 501 552 17 20 19 8Property, plant and equipment, net 10 003 10 163 10 981 11 442 11 753 10 570Intangible assets 116 121 129 136 142 159Goodwill 463 468 753 776 786 760Other non-current assets, net 40 32 31 36 38 19Deferred income tax assets 59 50 189 266 250 237
Total assets 16 284 16 305 17 638 18 510 18 458 17 257
LIABILITIES AND STOCKHOLDERS’ EQUITY
Current liabilities 2 317 1 760 2 647 2 940 3 302 2 940Accounts payable and other l iabilities 1 176 1 104 1 609 1 412 1 462 1 623Short-term borrowings 1 119 616 994 1 484 1 816 1 306Current income tax liability 22 40 44 45 24 11
Non-current liabilities 3 693 4 147 4 695 4 678 4 065 4 212Long-term borrowings 3 038 3 508 3 792 3 459 2 816 3 074Deferred income tax liability 599 578 746 765 792 714Other long-term liabilities 55 61 157 454 457 425
Total liabilities 6 009 5 906 7 342 7 619 7 367 7 152
Stockholders’ equityCommon stock 221 221 221 221 221 221Statutory reserve 10 10 10 10 10 10Additional paid-in capital 257 257 257 257 306 306Other comprehensive income (1 897) (1 772) (1 736) (1 224) (997) (1 489)Retained earnings 11 655 11 676 11 538 11 620 11 582 11 099
NLMK stockholders’ equity 10 247 10 392 10 290 10 885 11 123 10 147Non-controlling interest 28 7 6 7 (33) (42)Total stockholders’ equity 10 275 10 399 10 296 10 892 11 090 10 105
Total liabilities and stockholders’ equity 16 284 16 305 17 638 18 510 18 458 17 257

www.nlmk.com
Sergey Takhiev
NLMK Investor Relations Russia, 115054, Moscow
18, Bakhrushina str, bldg 1
t. +7 495 915 15 75
f. +7 495 915 79 04