nnua eort - waverley council
TRANSCRIPT

2013/14Annual Report

PART 1 WAVERLEY ANNUAL REPORT
SECTION 1 – COMMUNITY OVERVIEWOur Community’s Vision ...............................................................................................................................................1
Mission ..........................................................................................................................................................................2
SECTION 2 – COUNCIL OVERVIEWMessage from the Mayor .............................................................................................................................................3
Message from the General Manager ...........................................................................................................................4
Ward boundaries ..........................................................................................................................................................5
Ward Councillors ...........................................................................................................................................................6
Council and Council’s Committees ...............................................................................................................................7
How Council is organised ..............................................................................................................................................8
Integrated Planning and Reporting ..............................................................................................................................9
SECTION 3 – MEASURING OUR PROGRESSMeasuring our progress (summary overview) ...........................................................................................................11
Sustainable Community ..............................................................................................................................................13
Sustainable Living ........................................................................................................................................................31
Sustainable Environment ............................................................................................................................................52
Sustainable Governance .............................................................................................................................................65
SECTION 4 – MEETING OUR STATUTORY REQUIREMENTSState of the Environment Report................................................................................................................................82
Condition of Public Works ..........................................................................................................................................82
Legal proceedings taken or against Council ...............................................................................................................84
Mayoral and Councillor Fees and Charges .................................................................................................................87
Employment of senior staff and the General Manager .............................................................................................88
Major contracts awarded by Council ..........................................................................................................................88
Bush fire reduction activities ......................................................................................................................................88
Access and equity for multicultural communities – updates and highlights .............................................................89
Supporting Organisational Diversity ...........................................................................................................................90
Contents
Communications ........................................................................................................................................................90
Waverley Housing for Older People (WHOP) Program .............................................................................................90
Public Programs ..........................................................................................................................................................91
Waverley Library .........................................................................................................................................................91
Events ..........................................................................................................................................................................91
Access and Equity Report for Aboriginal and Torres Strait Islander Communities – Updates and Highlights ....................93
Works carried out on private land ..............................................................................................................................94
Contributions and Donations .....................................................................................................................................94
Human Resources Report ...........................................................................................................................................96
Human Resources activities undertaken by Council during 2013-2014 ....................................................................98
External Bodies exercising Council Functions ..........................................................................................................100
Controlling Interests in Companies ..........................................................................................................................100
Partnerships, Cooperatives and Joint Ventures........................................................................................................100
Other Regulatory Information ..................................................................................................................................100
Government Information (Public Access) applications ............................................................................................101
Amounts of Rates and Charges written off during the year ....................................................................................103
Compliance with and effect of Planning Agreements in force as at 30 June 2014 .................................................103
Activities during the year relating to enforcing and ensuring compliance with the Companion Animals Act and Regulations ..........................................................................................................103
Companion Animals Graphs .....................................................................................................................................104
Protected Disclosures ...............................................................................................................................................105
Privacy and Personal Information management ......................................................................................................105
Gift Registers Information .........................................................................................................................................105
Sponsorship...............................................................................................................................................................106
PART 2 FINANCIAL STATEMENTS
1 Waverley Council 2013–14 Annual Report
SECTION 1 – COMMUNITY OVERVIEW
1 Waverley Council 2013–14 Annual Report
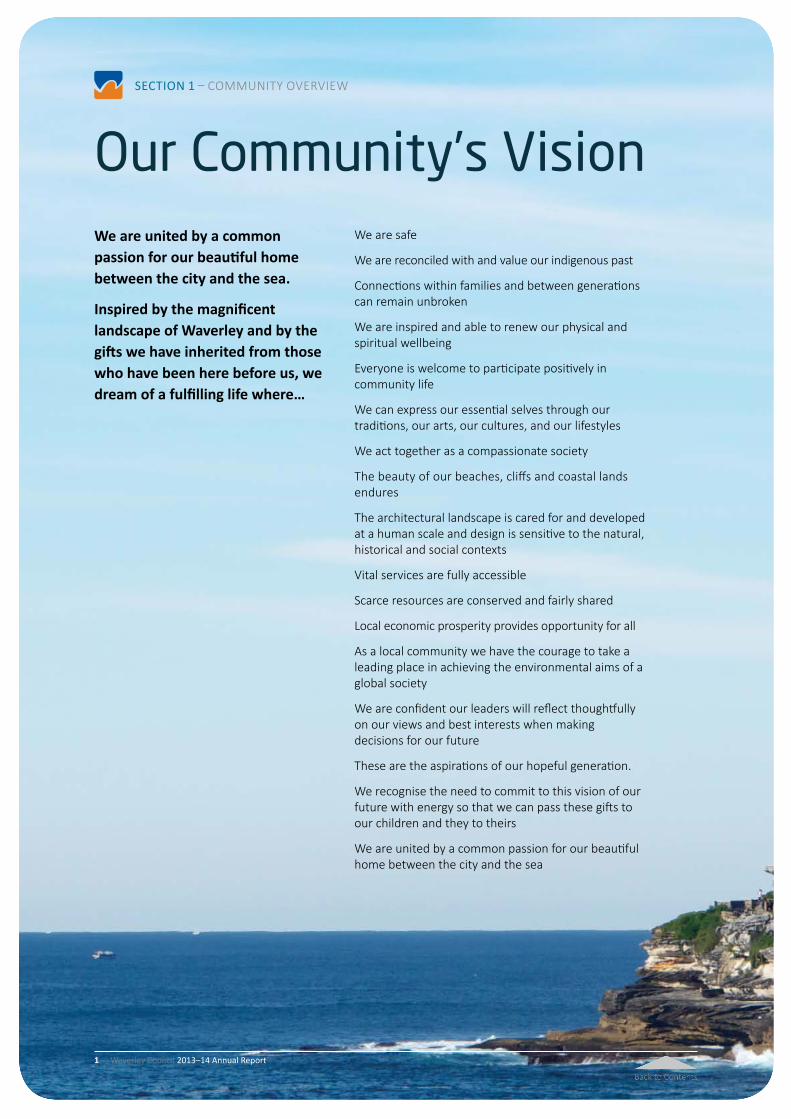
We are safe
We are reconciled with and value our indigenous past
Connections within families and between generations can remain unbroken
We are inspired and able to renew our physical and spiritual wellbeing
Everyone is welcome to participate positively in community life
We can express our essential selves through our traditions, our arts, our cultures, and our lifestyles
We act together as a compassionate society
The beauty of our beaches, cliffs and coastal lands endures
The architectural landscape is cared for and developed at a human scale and design is sensitive to the natural, historical and social contexts
Vital services are fully accessible
Scarce resources are conserved and fairly shared
Local economic prosperity provides opportunity for all
As a local community we have the courage to take a leading place in achieving the environmental aims of a global society
We are confident our leaders will reflect thoughtfully on our views and best interests when making decisions for our future
These are the aspirations of our hopeful generation.
We recognise the need to commit to this vision of our future with energy so that we can pass these gifts to our children and they to theirs
We are united by a common passion for our beautiful home between the city and the sea
Our Community’s VisionWe are united by a common passion for our beautiful home between the city and the sea.
Inspired by the magnificent landscape of Waverley and by the gifts we have inherited from those who have been here before us, we dream of a fulfilling life where…
SECTION 1 – COMMUNITY OVERVIEW

2 Waverley Council 2013–14 Annual Report
SECTION 1 – COMMUNITY OVERVIEW
2 Waverley Council 2013–14 Annual Report
SECTION 1 – COMMUNITY OVERVIEW
Through its detailed Integrated Engagement Strategy, Waverley Council has taken note of the breadth and depth of community priorities and articulated these in a Vision for the Waverley community. Council’s Mission is to take a leading role in partnership with other levels of government, businesses and community groups and individuals to make the community’s vision a reality.
In doing this, we rely on our commitment to and cohesion as a professional, friendly and ethical Council that consults with and listens to the community.
Mission

3 Waverley Council 2013–14 Annual Report
SECTION 2 – COUNCIL OVERVIEW
At the 2012 election we promised the community that we would return Waverley to a strong financial position and that we would work hard to make inroads into our infrastructure backlog. I am delighted to
tell you that we achieved both of these goals. This Annual Report is one of the key tools that Council uses to communicate with our community. It is how we report on the progress made over the last financial year in delivering our services and projects. Our annual report also includes information on the current condition of public assets, community services provided and Council’s financial information.
More specifically, this report shows how we are tracking with our targets in the Delivery Program 2013-17 and Operational Plan 2013-14. Achievement of these targets represents progress in helping the community move towards its long term vision for the future, as set out in the Community Strategic Plan, Waverley Together 3.
One aspect of the community’s vision is that “we are inspired and able to renew our physical and spiritual wellbeing.” Council has enabled the community to move closer to this vision element through projects such as an upgrading of some of our children’s playgrounds, the expansion of the outdoor gym at North Bondi and improvements to the Waverley Park sporting fields.
The Waverley community also hopes that “the architectural landscape is cared for and developed at a human scale and design is sensitive to the natural, historical and social contexts.” On 18 June 2013, Council dissolved its Development Control Committee (DCC) and implemented an independent panel to determine significant Development
Message from the Mayor
Applications in Waverley. The panel is made up of community representatives and planning experts who are independent of Council and who have expertise in the areas of architecture, urban design, town planning and planning law, heritage, disability and access, and the environment. The Waverley Development Assessment Panel (WDAP) offers a more streamlined approach to development assessment in Waverley, allowing Councillors more time to focus on strategic planning issues, such as the planning controls that underpin DA decisions. It also represents an important step towards achieving this element of the community vision.
Furthermore, we have begun implementation of the Bondi Junction Complete Streets program to solve the problem of how we best integrate cars, buses, bikes and pedestrians on our roads and pathways. This is helping to improve the accessibility and amenity of Bondi Junction. Additionally, this year we are going to spend $3million fixing the internal fences and walls in our beautiful Waverley Cemetery.
As shown in the audited financial reports in this document, Council is in a strong financial position.
We have achieved a lot over the last year and intend on continuing the improvement and efficiency of services into the future.

4 Waverley Council 2013–14 Annual Report
SECTION 2 – COUNCIL OVERVIEW
This is the first Annual Report which I am pleased to present as General Manager of Waverley Council.
Prior to joining this organisation in February this year, I took a trip to
London to visit one of my sons. I recall checking in to the hotel with my wife, and the young woman at the front desk commented on my Australian passport. She mentioned that she wanted to go to Australia to go to Bondi Beach. We got to talking, and I told her about my new role at Waverley Council. She was delighted when I mentioned Bondi Beach, and her happiness as she spoke about one day wanting to visit our backyard was truly infectious.
I often reflect on that moment, and I feel incredibly proud to be a part of an organisation that has such a prominent position in the world, an organisation with rich history and incredibly dedicated staff, both current and past.
There have been so many achievements, not only during my time here, but also in the past 12 months. Our staff work hard to continue to deliver on our commitments that are set out in the Delivery Program 2013-14 and Operational Plan 2013-14.
I have been truly impressed by Council’s lively events, including our multicultural food festival, Global Table in Bondi Junction and Bondi Winter Magic, which encourages people from all over Sydney (and some international faces) to visit our famous beach in the cooler months.
Though it was before my time, I continue to hear wonderful things about the Tamarama kiosk and park upgrade. I often see this area buzzing with activity.
In Bondi Junction, our Complete Streets project has already started to transform the appearance of the streets and the interaction on our streets. Our pop up parks are full of people enjoying the sunshine and I am looking forward to see what happens next in this space.
Message from the General Manager
We have high environmental targets and our award-winning environment team continue to impress me with the amazing work they do. This includes our Waverley Bike Plan, which aims to get people of our roads and using alternate means of transport, and our summer litter campaign, which was run in conjunction with our neighbours, Randwick Council. We have also reduced energy usage by 7.7 per cent in the last year, shaving $110,000 off Council’s electricity bills.
We also aim to make it easier for you to get in contact and do business with us. And, this year, we made huge steps towards achieving this goal – we launched a new user-focused system that has changed the way we manage your enquiries. We also completely revitalised our website to better improve access to information.
My promise to you, and to my staff, is to continue to deliver and improve on our commitments. I am certainly looking forward to the next 12 months.
5 Waverley Council 2013–14 Annual Report
SECTION 2 – COUNCIL OVERVIEW
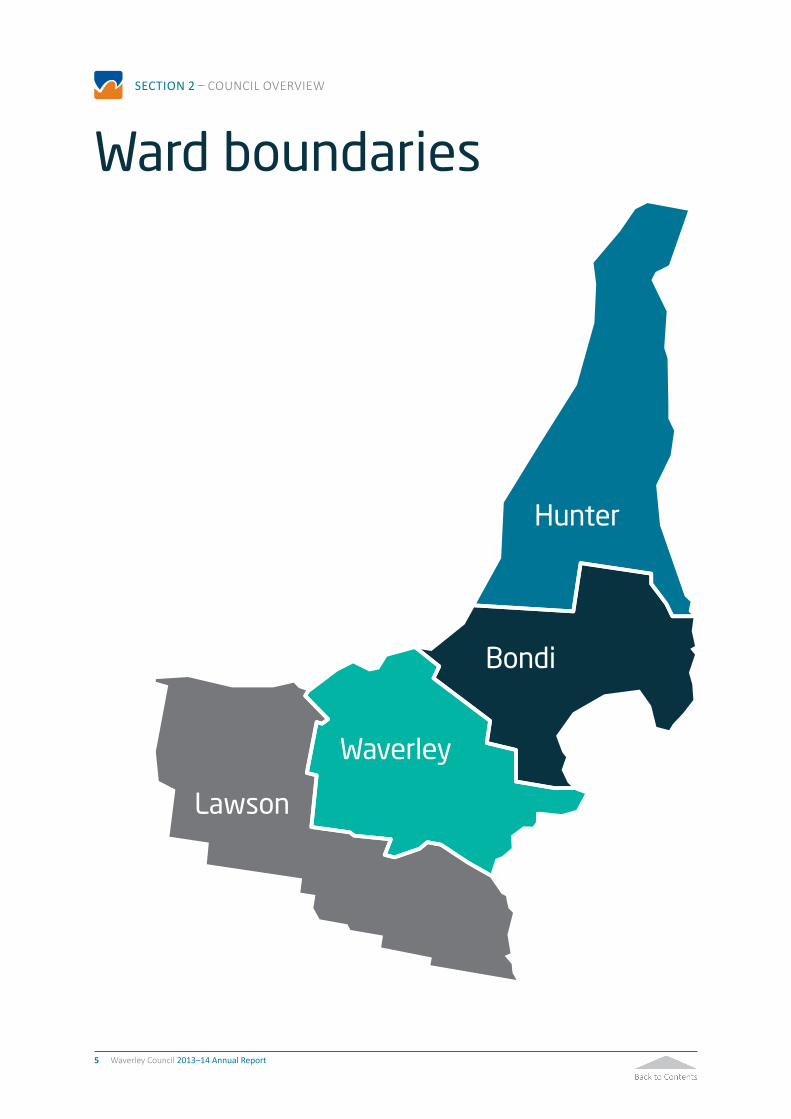
Ward boundaries
Hunter
Bondi
Waverley
Lawson

6 Waverley Council 2013–14 Annual Report
SECTION 2 – COUNCIL OVERVIEW
Bondi Ward
Cr Joy Clayton (Liberal)PHONE 9130 8430MOBILE 0409 308 430EMAIL [email protected]
Cr Dominic Wy Kanak (Greens) PHONE 9130 8460WORK 9369 8027EMAIL [email protected]
Cr John Wakefield (Labor)MOBILE 0427 023 987EMAIL [email protected]
Waverley Ward
Cr Tony Kay (Liberal) Deputy MayorPHONE 9365 7707FAX 9365 7707EMAIL [email protected]
Cr Ingrid Strewe (Labor)PHONE 9389 7299FAX 9389 4639EMAIL [email protected]
Cr Bill Mouroukas (Liberal) MOBILE 0421 341 815EMAIL [email protected]
Hunter Ward
Cr Leon Goltsman (Liberal)PHONE 8006 2799EMAIL [email protected]
Cr Sally Betts (Liberal) MayorPHONE 9130 3250MOBILE 0425 363 530EMAIL [email protected]
Cr Miriam Guttman-Jones (Independent)PHONE 9371 1412EMAIL [email protected]
Ward Councillors
Cr Paula Masselos (Labor)MOBILE 0419 292 207EMAIL [email protected]
Cr Andrew Cusack (Liberal) PHONE 9114 8986 EMAIL [email protected]
Cr Angela Burrill (Liberal)PHONE 9114 8981EMAIL [email protected]
Lawson Ward

7 Waverley Council 2013–14 Annual Report
SECTION 2 – COUNCIL OVERVIEW
Council is made up of 12 councillors elected by the ratepayers and residents of Waverley for a four-year term. The last Local Government election was held on 8 September 2012 with the next one scheduled for September 2016.
Councillors are elected by Ward (a geographical area). Three of these Wards (Bondi, Waverley and Hunter) were established in 1860, with Lawson Ward being created in 1867.
The positions of Mayor and Deputy Mayor are decided annually by a vote of all councillors. Councillor Sally Betts was elected Mayor and Councillor Tony Kay was elected Deputy Mayor each September since the last Local Government elections in September 2012.
The Waverley Council area is located in the State Parliamentary seats of Coogee and Vaucluse and the Federal Parliamentary seat of Wentworth. The State Members for the area are Mr Bruce Notley-Smith, M.P. (Member for Coogee) and Ms Gabrielle Upton, M.P. (Member for Vaucluse). The Federal Member for Wentworth is Mr Malcolm Turnbull, M.P.
Waverley Council encourages the community to attend meetings of Council. All meetings are open to the public and take place on the third floor of the Council Chambers. Members of the public can address Council on any issue included on the agenda for the meeting, provided they notify Governance staff on 9369 8000 by 3pm on the day of the meeting.
Full Council meetings are usually held on the third Tuesday of each month. On 10 December 2013, Council resolved to dissolve the Finance, Ethics and Strategic Planning Committee (FESP) and the Community, Housing, Environmental Services and Public Works Committee (CHESPW). In place of these two committees, Council endorsed the establishment of an Operations Committee, which meets on the first Tuesday of each month.
In June 2013, Council dissolved its Development Control Committee (DCC) and replaced it with an independent assessment panel, the Waverley Development Assessment Panel (WDAP). This panel commenced operation on 1 July 2013 and generally
Council and Council’s Committees
meets on the fourth Wednesday of each month at 11.00am at Council Chambers. The panel determines Development Applications within the Waverley local government area (LGA) and is currently operating as part of a two-year trial. The panel comprises of professional experts in architecture, urban design, town planning and planning law as well as community representatives and specialists in Aboriginal Archaeology and Heritage, Disability and Access, Coastal Risk and Water Management.
An outline of Waverley Council’s Committee structure is set out below.
For more information regarding Council’s committee structure and the Councillor membership of Committees, please visit www.waverley.nsw.gov.au/council.
WAVERLEY COUNCIL’S COMMITTEE STRUCTURE AS AT 30 JUNE 2014
COUNCIL
Operati onal Committ ee
Waverley Traffi c Committ ee
Environmental Sustainability Advisory Committ ee
Multi cultural Advisory Committ ee
Community Safety Advisory Committ ee
Waverley Public Arts Committ ee
Waverley Surf Life Saving Club Committ ee
Waverley Housing Advisory Committ ee
Legal Services Review Panel
Waverley Business Forum
Waverley Access Committ ee
Internal Audit Committ ee
Waverley Development Assessment Panel

8 Waverley Council 2013–14 Annual Report
SECTION 2 – COUNCIL OVERVIEW
How Council is organised
The role of the elected Council is to represent the community, decide on Council’s strategic direction and policies, to allocate and monitor the use of Council resources through the budget process and to appoint a General Manager.
The General Manager is responsible for providing the elected Council with ‘policy advice’ and for implementing the decisions (policy) of Council.
Section 332 of the Local Government Act outlines that a Council must determine the organisation’s structure, senior staff positions and the resources that will be allocated towards the employment of all staff. Once a Council has determined these matters, the General Manager is responsible for managing all staff. In June 2014, Council underwent a restructure,
which significantly changed the configuration of the organisation. As this report covers the period 1 July 2013 to 30 June 2014, this section will reflect how Council was organised for the majority of that period. The new reporting structure will be set out in next year’s Annual Report and future Council documents. More information on Council’s new organisational structure can be found on our website: www.waverley.nsw.gov.au/council/council_departments.
For most of 2013-14, Council was organised into a General Manager’s Unit and four Departments. The Departments were divided into Divisions to deliver a range of functions.
COUNCILMAYOR
General ManagerHuman Resources/
Organisati onal Development
General Manager’s Unit
Community & Recreati on services
Cultural & Community
Services
Library & Customer Services
Recreati on & Community
Planning
Events & Business Development
Public Works & Services
Business & Services
Resource Recovery & Public Place
Cleansing
Maintenance & Constructi on
Parks & Open Space Operati ons
Planning & Environmental
Services
Environmental Services
Strategic Town Planning
Compliance
Development Assessment
Corporate & Technical Services
Finance & Informati on
Systems & Services
Parking Services
Governance & Integrated Planning
Technical Services
Business Services & Property

9 Waverley Council 2013–14 Annual Report
SECTION 2 – COUNCIL OVERVIEW
Integrated Planning and ReportingAll Councils in NSW are required to conduct their business based around Integrated Planning and Reporting. This framework of plans and reports ensures long term planning for the future, sustainability and a commitment to the community having a more direct say in what happens in their area. Waverley Council has been a leader in this area since the legislation was introduced, having produced award-winning asset and financial management plans, and being one of the first Councils to produce the full suite of documents required under the Integrated Planning and Reporting legislation.
The framework requires Council to take a long term approach to decision making which considers the Quadruple Bottom Line – social, economic, environmental and civic leadership – and the Social Justice Principles of equity, access, participation and rights.
The diagram below shows the framework hierarchy.
The Community Strategic Plan (Waverley Together 3)The Community Strategic Plan – called Waverley Together 3 – is the highest level plan which identifies the community’s main priorities and aspirations for the future and the broad strategies for achieving these. Importantly, the Community Strategic Plan is the community’s plan for the future. While Waverley Council has a custodial role in initiating, preparing and maintaining the plan on behalf of the residents of Waverley, it is not wholly responsible for its implementation. Other partners such as State and Federal Government and community groups may also be engaged in delivering the long-term community outcomes of this plan.
The Community Strategic Plan takes a long term outlook and covers a minimum of 10 years. It is reviewed every four years and addresses social, environmental, economic and civic leadership matters in an integrated manner.
Delivery Program and Resourcing StrategySitting below the Community Strategic Plan is the Delivery Program. The Delivery Program is effectively the elected Council’s answer to the community vision. It sets out what specific activities are to be undertaken during its term of office (normally four years) to implement the strategies outlined in the Community Strategic Plan.
To carry out these activities, the Resourcing Strategy sets out how time, money, assets and people will be allocated. It consists of:
• Long Term Financial Plan
• Workforce Management Plan
• Asset Management Plan.
DeliveryProgram
4 years
Communityengagement
CommunityStrategic Plan
10+ years
AnnualReport
ResourcingStrategy
OperationalPlan1 year
Long TermFinancial planning
Workforce ManagementPlanning
Asset ManagementPlanning
PerpetualMonitoring& Review

10 Waverley Council 2013–14 Annual Report
SECTION 2 – COUNCIL OVERVIEW
Operational PlanThe Operational Plan sets out the programs and projects to be carried out each financial year to meet the commitments made by the Council in the Delivery Program. By setting specific targets, the Operational Plan identifies how Council will determine the effectiveness of the activities to be undertaken and is supported by a detailed budget.
The Annual ReportThe Annual Report is the key point of accountability between Council and its community where it reports on the implementation of the Delivery Program and Operational Plan. This is supported by six monthly Progress Reports on the Delivery Program, which are usually produced every June and December.
How the Integrated Plans help Council achieve the Community Vision
There is a direct connection between the services delivered by Waverley Council, the community vision and the targets of Waverley Together 3. The diagram below sets out this relationship.
Vision14 Vision elements of Waverley Together 3
Strategies79 strategies
Directions33 directions
Targets & Indicators60 targets/indicators for the quadruple bottom line
The direction the community wants to take
How we will get there
Contributes to the achievement of targets
How we measurse our progress

11 Waverley Council 2013–14 Annual Report
SECTION 3 – MEASURING OUR PROGRESS
Measuring our progress (summary overview)
The Delivery Program and Operational Plan are also based on these quadrants.
Each quadrant has a set of directions which outline the specific directions we intend to head in. Sitting beneath these are the strategies we will implement to move in the direction set out in WT3, and Council’s reporting tracks our progress in delivering these.
Below is a summary overview of our overall progress, as well as progress in each of the quadrants.
The following pages provide a specific analysis of our how we’re tracking with implementation of the individual strategies. To assist readers in understanding the level of progress, we have used a ‘traffic light’ approach:
RED We did not meet our target or are not on track to meet the target
AMBER We are on track to meet the target
GREEN We have met the target
73%
15%
12%
Met or meeting target
On track to meet target
Did not meet target or not on track
Sustainable Environment
Sustainable Governance
Sustainable Living
Sustainable Community
Waverley’s Community Strategic Plan, Waverley Together 3, is built around four quadrants:
Waverley Council’s Overall Performance for 2013-14 in meeting targets set out in the Delivery Program 2013-17 and the Operational Plan 2013-14

12 Waverley Council 2013–14 Annual Report
SECTION 3 – MEASURING OUR PROGRESS
Overall, 87 per cent of the targets in Sustainable Community were met, are on track to meet target or are ongoing but meeting the target. Some reasons for targets not being met were due to overly ambitious targets compared to current resources, increases in library online resources not reflecting in a rise of memberships, rescheduling due to staffing gaps, new regulations and construction delays.
Met or meeting target
On track to meet target
Did not meet target or not on track
63%24%
13%
SUSTAINABLE COMMUNITY
In Sustainable Environment, 85 per cent of the targets were met, are on track to be met or are ongoing and meeting their target. Some reasons for 15 per cent of targets not met were lack of funding, negotiation delays, staff changes and changing priorities for some projects.
Met or meeting target
On track to meet target
Did not meet target or not on track
89%
SUSTAINABLE ENVIRONMENT
78%7%
15%
The Sustainable Governance quadrant saw 87 per cent of deliverables completed, on track to meet target or ongoing but meeting target. Some reasons for targets not being met included rescheduling and further research being needed for some projects.
Met or meeting target
On track to meet target
Did not meet target or not on track
89%
SUSTAINABLE GOVERNANCE
64%23%
13%
Up to 92 per cent of the deliverables in the Sustainable Living quadrant were completed, ongoing but meeting the target, or are on track to be completed. Some targets that were not met were due to staffing changes, some maintenance quotes being over budget and required sourcing, lack of additional funding, and some road works were delayed by Energy Australia works.
Met or meeting target
On track to meet target
Did not meet target or not on track
89%
3%8%
SUSTAINABLE LIVING
Waverley Council’s Performance for 2013-14 by Quadrant

13 Waverley Council 2013–14 Annual Report
SECTION 3 – MEASURING OUR PROGRESS
Sustainable CommunityThis quadrant covers those plans, policies and initiatives that contribute to the development of our community capacity, including our cultural vitality and indigenous and post colonial heritage, our sense of community and connection, as well as a safe, healthy and harmonious living environment. It represents the ‘social’ component of the quadruple bottom line.
Directions
C1 Waverley’s cultural heritage and diversity is recognised, protected and respected.
C2 The community is welcoming and inclusive and people feel that they are connected and belong.
C3 Housing options are available to enable long term residents and those with a connection to the community to remain in Waverley.
C4 Community support services continue to be targeted to and accessible by those who need them most, including children and young people, older people and people with a disability.
C5 People feel safe in all parts of Waverley.
C6 Arts and cultural activities foster an involved community and a creative environment.
C7 Health and quality of life are improved through a range of recreation and leisure opportunities.
14 Waverley Council 2013–14 Annual Report
SECTION 3 – MEASURING OUR PROGRESS
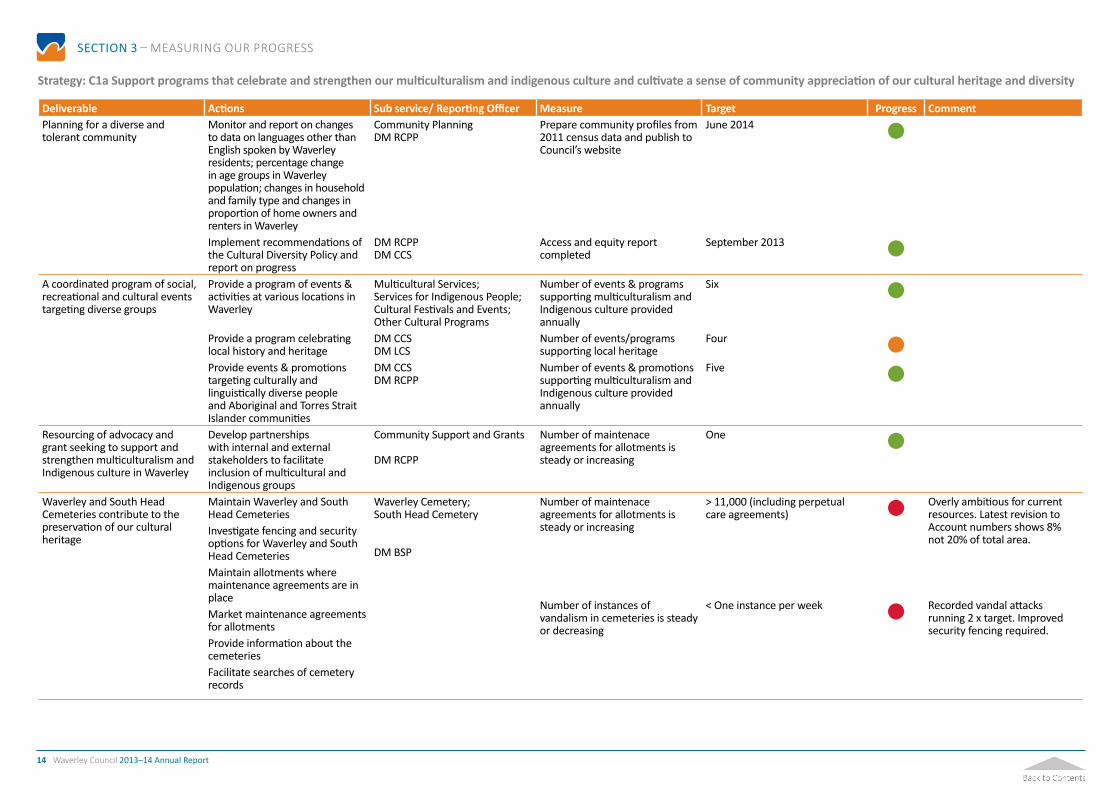
Strategy: C1a Support programs that celebrate and strengthen our multiculturalism and indigenous culture and cultivate a sense of community appreciation of our cultural heritage and diversity
Deliverable Actions Sub service/ Reporting Officer Measure Target Progress Comment Planning for a diverse and tolerant community
Monitor and report on changes to data on languages other than English spoken by Waverley residents; percentage change in age groups in Waverley population; changes in household and family type and changes in proportion of home owners and renters in Waverley
Community PlanningDM RCPP
Prepare community profiles from 2011 census data and publish to Council’s website
June 2014
Implement recommendations of the Cultural Diversity Policy and report on progress
DM RCPPDM CCS
Access and equity report completed
September 2013 A coordinated program of social, recreational and cultural events targeting diverse groups
Provide a program of events & activities at various locations in Waverley
Multicultural Services;Services for Indigenous People;Cultural Festivals and Events;Other Cultural Programs
Number of events & programs supporting multiculturalism and Indigenous culture provided annually
Six
Provide a program celebrating local history and heritage
DM CCSDM LCS
Number of events/programs supporting local heritage
Four Provide events & promotions targeting culturally and linguistically diverse people and Aboriginal and Torres Strait Islander communities
DM CCSDM RCPP
Number of events & promotions supporting multiculturalism and Indigenous culture provided annually
Five
Resourcing of advocacy and grant seeking to support and strengthen multiculturalism and Indigenous culture in Waverley
Develop partnerships with internal and external stakeholders to facilitate inclusion of multicultural and Indigenous groups
Community Support and Grants
DM RCPP
Number of maintenace agreements for allotments is steady or increasing
One
Waverley and South Head Cemeteries contribute to the preservation of our cultural heritage
Maintain Waverley and South Head CemeteriesInvestigate fencing and security options for Waverley and South Head CemeteriesMaintain allotments where maintenance agreements are in placeMarket maintenance agreements for allotmentsProvide information about the cemeteriesFacilitate searches of cemetery records
Waverley Cemetery;South Head Cemetery
DM BSP
Number of maintenace agreements for allotments is steady or increasing
> 11,000 (including perpetual care agreements) Overly ambitious for current
resources. Latest revision to Account numbers shows 8% not 20% of total area.
Number of instances of vandalism in cemeteries is steady or decreasing
< One instance per week Recorded vandal attacks running 2 x target. Improved security fencing required.

15 Waverley Council 2013–14 Annual Report
SECTION 3 – MEASURING OUR PROGRESS
Strategy: C2a Provide a broad range of relevant, affordable and accessible facilities, spaces, programs and activities that promote harmony, respect and togetherness
Deliverable Actions Sub service/ Reporting Officer Measure Target Progress Comment Affordable and accessible community facilities
Provide a community garden for use by residents and community organisations who lack access to a garden
Services for older People;Services for People with a Disability;Bondi Pavilion Programs;Arts Programs
DM RCPPDM CCS
Percentage of community garden plots maintained to standards
90%
A coordinated program of social, recreational and cultural events targeting diverse groups
Provide a coordinated program of events for identified target groups including children, youth, older people and people with disability. Program to include music, exhibitions, festivals, workshops and special events at Council venues.
Cultural Services Planning;Arts Programs;Music rooms and Programs;Literary Programs;Cultural Festivals and Events;Bondi Pavilion Programs;Other Cultural Programs
Number and type of programs/ events for different groups eg young people, older people provided annually
Minimum 50 Council events, programs and activities
Provide a range of recreation programs for the community at Margaret Whitlam Recreation Centre
% of bookings of sport court available hours
70%
Provide a Community and Seniors Centre
DM RCPPDM CCS
Number of participants per year 17,500 A range of venue hire places for and accessible to the local community and corporate sector
Provide a range of indoor venues for hire
Library Services;DM LCS
Establish a benchmark for level of usage for each site
June 2014 New venue management software activated 19 May and will now start gathering data
Undertake a review of hiring arrangements for Council indoor venues
Review completed and report finalised
June 2014 Accessible cemetery services for internments, memorials and associated ceremonial activities
Provide interments and associated services
Waverley Cemetery;South Head CemeteryDM BSP
Number of interment services provided at our cemeteries annually is steady or increasing
> 172 per year Investigate Cemetery pavilion construction (offset by loan to be repaid by entry to funeral business)
Waverley Cemetery, South Head Cemetery,DM BSP
Community panel established Panel to meet at least bi-monthly over 2013-14

16 Waverley Council 2013–14 Annual Report
SECTION 3 – MEASURING OUR PROGRESS
Strategy: C2b Encourage and foster community pride through community groups and volunteering initiatives such as the ‘Civic Pride’ program
Deliverable Actions Sub service/ Reporting Officer Measure Target Progress Comment Programs which encourage volunteering including civic pride and bush care that enhance community cohesion
Develop a program to recruit volunteers for community organisations and to assist Council services in their volunteer recruitment drives
Community Planning;Volunteering Programs;Civic Pride Programs;Bush Care ProgramsDM RCPPDM CCS
Number of services assisted Ten
Respond to volunteering inquiries and improve volunteering referral database
Percentage of inquiries actioned and (where relevant) referred
100% Provide support and skills development to community gardeners
Number of workshops per year Minimum of 3 Provide a program of Recognition & Awards
Number of recognition events Two Pocket Parks program and other civic pride initiatives continuedSupport bushcare program through skills and capacity development, promotion and recruitment
Number of sites initiated in partnership with volunteers
Two Regular / workshop / meetings to support bushcare program
Two meetings per year

17 Waverley Council 2013–14 Annual Report
SECTION 3 – MEASURING OUR PROGRESS
Strategy: C2c Provide a socially inclusive, vital and welcoming library service that supports the educational, social and recreational needs of the community.
Deliverable Actions Sub service/ reporting Officer Measure Target Progress Comment A vibrant and relevant Library space that meets user needs
Review and upgrade Library spaces
DM LCS Revitalisation Plan produced and initial stages implemented
December 2013 Programs, events and activities that meet community needs and interests
Implement annual schedule of events, public programs, exhibitions and activities
DM LCS Annual activities program produced and delivered
January 2014 Current and relevant Library collections and services
Provide collections which are relevant and responsive to community demands
DM LCS Number of members >28,000 Increase in use of online resources and programs attended is not reflected in membership numbers
Number of loans per year >500,000 p.a. Number of visits in person to the library
>450,000 p.a. Visits via Library website >50,000 p.a. Number of e-resources added and loaned
Number added > 2,000Number loaned >3,500
A range of relevant and reliable information and technology services
Enhance online access to library services, e-resources and information
DM LCS Percentage of enquiries to the Library successfully completed on same day
Same day enquiry success rate >80%
Establish optimum staff and public access to WiFiContinue digitisation of relevant collections
Annual strategies for Library technology developedService level established
August 2013, with annual updates thereafter Delay due to Local Studies staff
gap
Stronger connections and partnerships with the community that encourage participation in the Library and its services and promote the Library as a community learning hub
Develop and implement a plan to identify needs and expectations of Library users and non-users
DM LCS Establish annual priorities for digitisation
Dec 2013 Delay due to Local Studies staff gap. Is now included in Library’s Future Direction PlanPlan developed and strategies
commencedAugust 2013, with annual updates thereafter
Market and promote Library services, facilities and resources, including e-resources
Scope marketing strategy DM LCS Marketing strategy scoped June 2014 Deferred to Q1/Q2 of 2014-2015
Develop suite of promotional material
Promotional material produced June 2014September 2014

18 Waverley Council 2013–14 Annual Report
SECTION 3 – MEASURING OUR PROGRESS
Strategy: C3a Promote a mix of housing types in new developments, including housing that is affordable and accessible
Deliverable Actions Sub service/ Reporting Officer Measure Target Progress Comment Planning controls that support the provision of affordable housing through WLEP 2012 CI 4.4(b) or monetary contributions generated by Voluntary Planning Agreements towards affordable housing.
Review development applications relating to the use of CI4.4(b) in WLEP 2012, the use of VPAs or applications under the Affordable rental Housing SEPP
DM STP Number of affordable housing units in Council ownership
Retain or increase
Implement planning controls that seek to retain existing affodable housing
Percentage of new affordable housing recommendations implemented
100%
Strategy: C3b Ensure Council’s own portfolio of housing is affordable and accessible
Deliverable Actions Sub service/ Reporting Officer Measure Target Progress Comment Social housing for older people, people with a disability and families on low to middle incomes
Provide a range of social housing options
Social Housing Program Number of social housing units 54 units or more Where possible acquire additional units of social housing
DM RCPP Ensure Program operations are efficient and effective
Report program performance annually
Develop and implement asset maintenance plan
DMBSPDMRCPP
Plan is implemented within the year
June 2014 Affordable housing for low to moderate incomes households who are unable to secure rental housing and who demonstrate a strong connection to the Waverley LGA
Provide a range of affordable housing options
Affordable Housing Program Number of affordable housing units in Council ownership
22 units or more Where possible acquire additional units of affordable housing
DM RCPP Report to Council February 2014 Collect data on tenant profile for social and affordable housing
Ensure Program operations are efficient and effective
Report program performance annually
Report on Housing Need in Waverley
Report to Council February 2014

19 Waverley Council 2013–14 Annual Report
SECTION 3 – MEASURING OUR PROGRESS
Strategy: C3c Investigate and pursue housing initiatives through joint venture and other forms of partnership opportunities
Deliverable Actions Sub service/ Reporting Officer Measure Target Progress Comment A working group to develop local and regional partnerships to address homelessness
Convene meetings of the Waverley Homeless Coalition to develop strategies to address homelessness
Community PlanningDM RCPP
Number of partnerships that support needs of homeless people
At least three
Strategy: C4a Continue to resource and diversify the funding sources of family support services, affordable childcare and programs for young people, older people and people with a disability
Deliverable Actions Sub service/ Reporting Officer Measure Target Progress Comment High quality affordable long day care and family day care for children aged birth to five years and holiday and recreational programs for preschool children
Provide long day care for children aged birth to five years
Waverley, Bronte, Gardiner and Mill Hill Early Education Centre ServicesFamily Day Care ServicesDM CCS
% of long day care places utilised 97% per annum Provide family day care for children aged birth to five years
Number of children in long day care per day
Minimum of 272 Benchmark fees and charges structure for family day care educators
Number of full time equivalent children in family day care per week
More than 275 Provide holiday and recreational programs for preschool children
Benchmark completed and fees reviewed
Dec 2013 Number of preschool children in holiday programs
At least 20 per program Percentage of services maintaining National Quality Standards
100% Satisfaction score from annual early education centre and family day care services user survey
At least 75% Support to families and their children aged from birth to five years including parenting programs and counselling
Provide specific support to families and their children aged from birth to five years
Family Support ServicesDM CCS
Number of families in parenting education & support programs annually
At least 80 Coordinate a program of parenting education and support programs
Provide places in Council’s Early Education Centres for children with additional needs
Number of places provided for children with additional needs annually
At least 25 places Provide family case management and counselling
Number of families in case management and/ or counselling annually
At least 40 families Provide community information forums about children’s services
Number of community participants at the ‘Transition to School’ forum
100 participants

20 Waverley Council 2013–14 Annual Report
SECTION 3 – MEASURING OUR PROGRESS
Deliverable Actions Sub service/ Reporting Officer Measure Target Progress Comment An increase in the number of child care places provided by Council
Increase number of places for children available in the Family Day Care program
Community Planning, Child Care ServicesDM RCPPDM CCS
Number of additional family day care places
20 places New regulations have resulted in decreased numberts allowed in each Family Day Care Home causing decrease in numbers
Recreational, educational and social initiatives for young people
Ensure inclusion of recreation activities for young people in recreation and open space planning
Services for Young PeopleRecreation Planning
Number of plans including recommendations relating to recreation needs of young people
At least one
Provide a coordinated school holiday program for school children of all ages
DM RCPPDM CCSDM LCS
Number of holiday programs delivered per annum
Four High quality affordable services for frail older people including Meals on Wheels, Home Library Service and programs at Bondi Pavilion
Maintain Home and Community Care (HACC) validation for Council HACC programs
Services for Older People;Library Services;Bondi Pavilion ProgramsDM CCSDM LCS
Percentage of services maintaining accreditation
100% Provide a Meals on Wheels service
Number of meals provided daily at home for older people
At least 80 Provide shopping service Total number of shopping
service usersAt least 15 clients
Implement external review of best practice service models for Meals on Wheels
Recommendations implemented June 2014 Provide a Waverley Home Library Service
Number of Home Library Service users and loans per annum
>140>16,000 p.a.
Satisfaction rating on regular client survey
>80% Provide programs for older people at Bondi Pavilion
Number of programs at Bondi Pavilion per month
Four per month Services for the over fifties including a seniors centre that offers recreational, physical, educational and social activities
Operate the Community & Seniors Centre
Services for Older PeopleDM CCS
Average monthly attendance at Seniors Centre maintained or increased
1700 Provide a varied program of activities and events for older people
Number of programs/ activities provided per week at Seniors Centre for older people
At least 30 Investigate potential for shared service programs and activities with appropriate community and government organisations
Number of new activities established in collaboration with external organisations
2
Services to adults with mild intellectual disability to promote independent living
Provide a program of classes and courses aimed at improving independent living skills for people with mild intellectual disability
Services for People with a DisabilityDM CCS
Number life skills courses held annually
12
21 Waverley Council 2013–14 Annual Report
SECTION 3 – MEASURING OUR PROGRESS
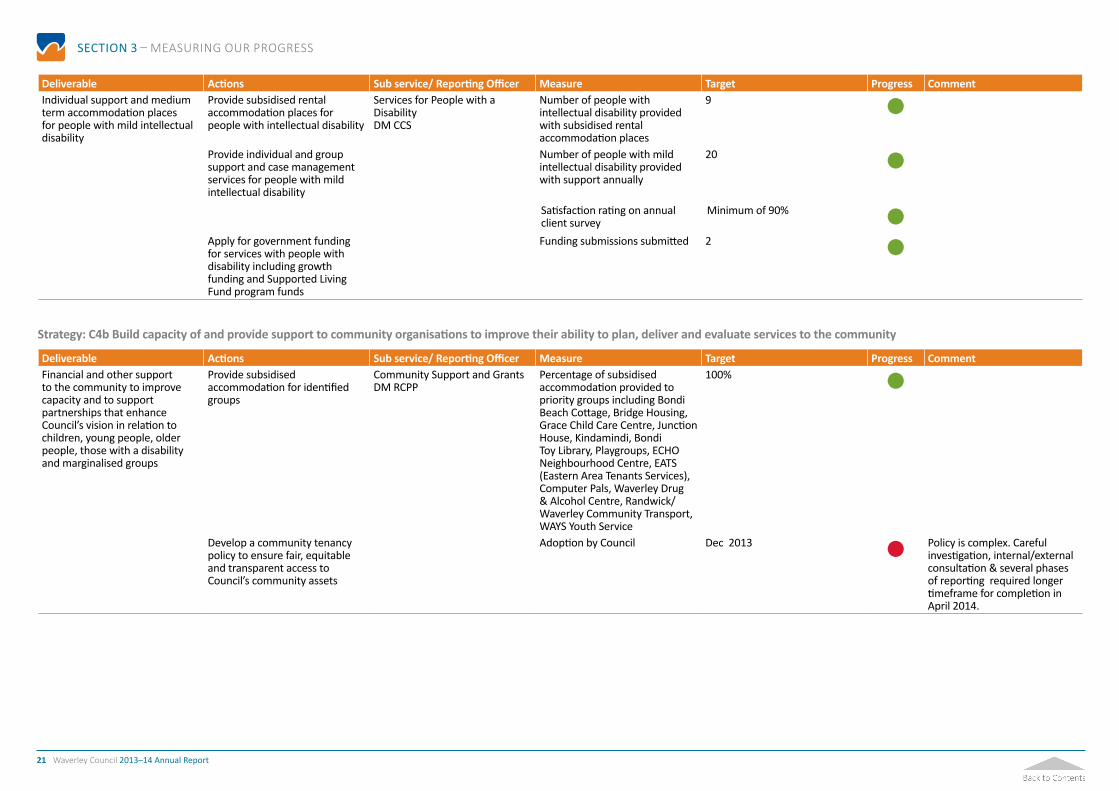
Deliverable Actions Sub service/ Reporting Officer Measure Target Progress Comment Individual support and medium term accommodation places for people with mild intellectual disability
Provide subsidised rental accommodation places for people with intellectual disability
Services for People with a DisabilityDM CCS
Number of people with intellectual disability provided with subsidised rental accommodation places
9
Provide individual and group support and case management services for people with mild intellectual disability
Number of people with mild intellectual disability provided with support annually
20
Satisfaction rating on annual client survey
Minimum of 90% Apply for government funding for services with people with disability including growth funding and Supported Living Fund program funds
Funding submissions submitted 2
Strategy: C4b Build capacity of and provide support to community organisations to improve their ability to plan, deliver and evaluate services to the community
Deliverable Actions Sub service/ Reporting Officer Measure Target Progress Comment Financial and other support to the community to improve capacity and to support partnerships that enhance Council’s vision in relation to children, young people, older people, those with a disability and marginalised groups
Provide subsidised accommodation for identified groups
Community Support and GrantsDM RCPP
Percentage of subsidised accommodation provided to priority groups including Bondi Beach Cottage, Bridge Housing, Grace Child Care Centre, Junction House, Kindamindi, Bondi Toy Library, Playgroups, ECHO Neighbourhood Centre, EATS (Eastern Area Tenants Services), Computer Pals, Waverley Drug & Alcohol Centre, Randwick/ Waverley Community Transport, WAYS Youth Service
100%
Develop a community tenancy policy to ensure fair, equitable and transparent access to Council’s community assets
Adoption by Council Dec 2013 Policy is complex. Careful investigation, internal/external consultation & several phases of reporting required longer timeframe for completion in April 2014.
22 Waverley Council 2013–14 Annual Report
SECTION 3 – MEASURING OUR PROGRESS
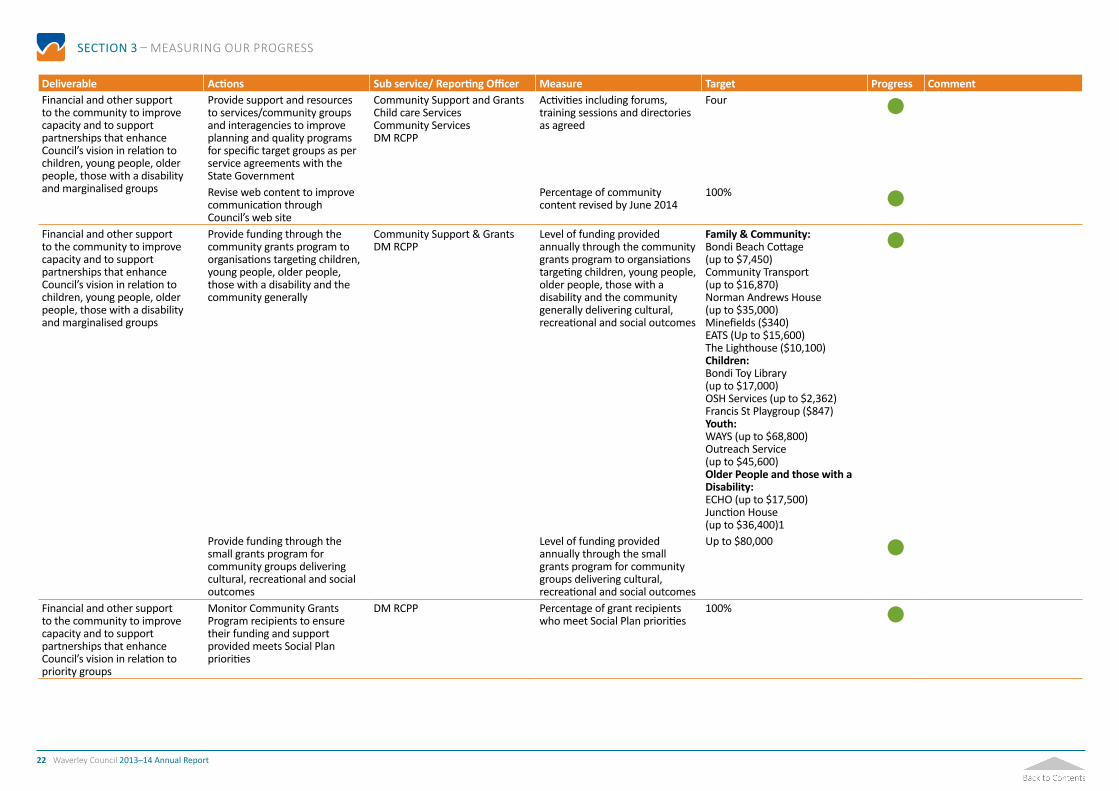
Deliverable Actions Sub service/ Reporting Officer Measure Target Progress Comment Financial and other support to the community to improve capacity and to support partnerships that enhance Council’s vision in relation to children, young people, older people, those with a disability and marginalised groups
Provide support and resources to services/community groups and interagencies to improve planning and quality programs for specific target groups as per service agreements with the State Government
Community Support and GrantsChild care ServicesCommunity ServicesDM RCPP
Activities including forums, training sessions and directories as agreed
Four
Revise web content to improve communication through Council’s web site
Percentage of community content revised by June 2014
100% Financial and other support to the community to improve capacity and to support partnerships that enhance Council’s vision in relation to children, young people, older people, those with a disability and marginalised groups
Provide funding through the community grants program to organisations targeting children, young people, older people, those with a disability and the community generally
Community Support & GrantsDM RCPP
Level of funding provided annually through the community grants program to organsiations targeting children, young people, older people, those with a disability and the community generally delivering cultural, recreational and social outcomes
Family & Community:Bondi Beach Cottage (up to $7,450)Community Transport (up to $16,870)Norman Andrews House (up to $35,000)Minefields ($340)EATS (Up to $15,600)The Lighthouse ($10,100)Children:Bondi Toy Library (up to $17,000)OSH Services (up to $2,362)Francis St Playgroup ($847)Youth:WAYS (up to $68,800)Outreach Service (up to $45,600)Older People and those with a Disability:ECHO (up to $17,500)Junction House (up to $36,400)1
Provide funding through the small grants program for community groups delivering cultural, recreational and social outcomes
Level of funding provided annually through the small grants program for community groups delivering cultural, recreational and social outcomes
Up to $80,000
Financial and other support to the community to improve capacity and to support partnerships that enhance Council’s vision in relation to priority groups
Monitor Community Grants Program recipients to ensure their funding and support provided meets Social Plan priorities
DM RCPP Percentage of grant recipients who meet Social Plan priorities
100%

23 Waverley Council 2013–14 Annual Report
SECTION 3 – MEASURING OUR PROGRESS
Strategy: C4c Collect and analyse and interpret emerging social trends, contemporary research and government initiatives to inform the services provided by Council and its partner agencies
Deliverable Actions Sub service/ Reporting Officer Measure Target Progress Comment Up to date and accessible community profile and demographic information
Ensure Council’s online profile is updated to reflect 2011 census data and supplemented with updates
Community PlanningDM RCPP
Reviewed and updated annually September 2013
Documented research on key issues including safety, housing, children, ageing
Completed social planning research for identified priority issues including Volunteering in Waverley
Community PlanningDM RCPP
Number of social planning research reports completed and published to Council’s web site annually
Two
Strategy: C5a Maintain safety in public areas such as streets, malls, parks and beaches; prioritise specific areas for safety and crime prevention programs; manage alcohol related ssues and support vulnerable groups.
Deliverable Actions Sub service/ Reporting Officer Measure Target Progress Comment Implementation of Community Safety Plan
Safety audits of Bondi and Bondi Junction Place undertaken
Place ManagementDM B&S
Number of safety audits of Bondi and Bondi Junction undertaken annual
At least two
Issues from audits that require attention actionedAlcohol free zones signs audited and maintained as required
Condition and location of alcohol free zone signs audited
October and April annually A summer strategy for Bondi to promote a safe and enjoyable environment at peak times
Safe Summer program implemented, including safety initiatives, crowd management, events and promotion.
Place MaintenanceDM B&S
Safe Summer Initiative evaluated annually
July 2013
Investigate closed circuit TV Investigate options to develop closed circuit TV in key Waverley locations
DM RCPPDM DA
Report to Community Safety Advisory Committee
November 2013

24 Waverley Council 2013–14 Annual Report
SECTION 3 – MEASURING OUR PROGRESS
Strategy: C5b Continue to strengthen community safety and crime prevention partnerships with police, licensees, businesses, youth organisations, schools, regulatory and emergency services, other agencies and community organisations
Deliverable Actions Sub service/ Reporting Officer Measure Target Progress Comment Support for the operation of a Community Safety Committee
Initiate, contribute to and support community safety programs and activities with reference to Waverley’s Community Safety Plans
Community SafetyAdvisory Committees and Forums
Implement at least one major project annually in association with external partners
At least one per annum
Provide administrative and other support to Community Safety Committee
DM RCPP Composition of Community Safety Committee includes a broad range of groups that are representative of the community
Representation includes Police and at least three other community interest groups
Provide emergency management including support for Waverley/ Woollahra SES
Provide accommodation and other support for Waverley/ Woollahra SES
Emergency Management Services
Disaster Management Plan (DISPLAN) reviewed and kept up to date
100% Meet regularly with Waverley/ Woollahra SES ControllerMaintain up to date Disaster Management Plans
Director PW&S
Strategy: C5c Maintain a high level of beach safety at Bondi, Bronte and Tamarama
Deliverable Actions Sub service/ Reporting Officer Measure Target Progress Comment A Lifeguard Service, deploying Council Lifeguards and working with surf life saving clubs to safeguard the public and minimise risk to Council at Waverley’s beaches
Roster Lifeguards for year round operations at Council’s beaches
Lifeguard ServicesDM B&S
Number of lives lost by drowning on Council’s beaches annually
No Drownings Sadly one drowning at Bondi Beach
Undertake patrols of beaches to maintain surf safety
Number of serious injuries on Council’s beaches annually
Less serious injuries than previous year
Undertake rescues and provide first aid and other assistance on Council’s beaches
Number of rescues undertaken on Councils beaches annually compared to number of users
Less rescues per 10,000 users than previous year
Work with surf life saving clubs and volunteer lifesavers
Percentage attendance by volunteer surf life savers on weekend and public holiday
100% Recruit and provide induction and training for casual Lifeguards for summer season
A program of Surf Awareness/ Education Programs
Develop Surf Awareness/ Education ProgramsPresent Surf Awareness/ Education ProgramsReview the format, content and provision of Surf Awareness/ Education Programs presented
Lifeguard ServicesDM B&S
Number of surf education programs including initiatives for targeted vulnerable groups presented each year
At least 10 programs including one for targeted vulnerable groups

25 Waverley Council 2013–14 Annual Report
SECTION 3 – MEASURING OUR PROGRESS
Deliverable Actions Sub service/ Reporting Officer Measure Target Progress Comment Financial and other support to surf lifesaving clubs in the Waverley area for volunteer lifesaving programs
Provide support to surf lifesaving clubs in the Waverley
Support to Surf Life Saving Clubs Level of funding or other support provided annually to surf lifesaving clubs in the Waverley area
= or > previous year (2010-11 $72,500)
Support refurbishment works at North Bondi Surf Club (Misc Buildings 05)
DM B&SDM BSPDM M&C
Finished cost for projects and time to complete compared to agreed budget and timetable
Finished cost is within + or - 10% of agreed budget and completed within 6 months of agreed timetable
Strategy: C5d Assist in the maintenance of public health
Deliverable Actions Sub service/ Reporting Officer Measure Target Progress Comment Health, food and hygiene inspections undertaken
Undertake inspections of registered food premisesUndertake inspections of registered hair and beauty premises
Food Hygiene and Regulation Percentage of inspections undertaken compared to number of premises that require inspection
> 80% subject to resource availability
Strategy: C6a Enrich community’s cultural life and support life long learning through a variety of cultural events and activities, balancing the needs of residents and visitors
Deliverable Actions Sub service/ Reporting Officer Measure Target Progress Comment A diverse and exciting range of arts and cultural events across Waverley
Provide arts and cultural events across Waverley including events provided in collaboration with external organisations
Arts Programs;Other Cultural Programs;Cultural Events and FestivalsDM CCS
Number and type of arts and cultural events held annually
At least 40
Provide support to community organisations delivering cultural community benefits that align with Council priorities
Number of collaborative arts and cultural events held annually supported by Waverley Council
20
Financial and other support to arts and cultural programs in the Waverley area
Provide funding through the Community Grants Program to Waverley Band and Waverley Philharmonic Orchestra, Sculpture by the Sea and Kiteflyers Association for Festival of the WindsFund Waverley Art Prize and Waverley Youth Art Award for annual competition at Waverley School of Arts
Arts Programs;Other Cultural Programs;Community Support and GrantsDM RCPP
Level of funding annually to arts and cultural programs in Waverley
Up to $7,700 for Waverley Band and Waverley Philharmonic OrchestraUp to $7,000 for Waverley Art Prize $10,250 to Sculpture by the Sea$5000 for Mayors Prize at Sculpture by the SeaUp to $8000 to Kiteflyers Association

26 Waverley Council 2013–14 Annual Report
SECTION 3 – MEASURING OUR PROGRESS
Deliverable Actions Sub service/ Reporting Officer Measure Target Progress Comment Implementation of Arts Plus Plan Implement Arts Plus
Implementation PlanArts ProgramsDM RCPPDMLCSDMCCS
Number of arts, entertainment and cultural initiatives developed annually from Arts Plus
One
Deliver the Artist in Residence Program
Number of artists involved in program
Up to 12 Report on the delivery of key milestones for the Resident Theatre Program funding
Level of funding provided annually to resident theatre company depending on agreement
Up to $75,000
Funding sought from other levels of government and business to develop and provide arts, entertainment and cultural events in Waverley
Develop and submit submissions for funding and awards to celebrate and support arts and cultural events
Cultural Services PlanningDM RCPPDM CCS
Number of successful grant and award proposals
2
Encourage arts and cultural sponsorships and partnerships with local businesses
Number of sponsorship proposals presented
At least ten
27 Waverley Council 2013–14 Annual Report
SECTION 3 – MEASURING OUR PROGRESS
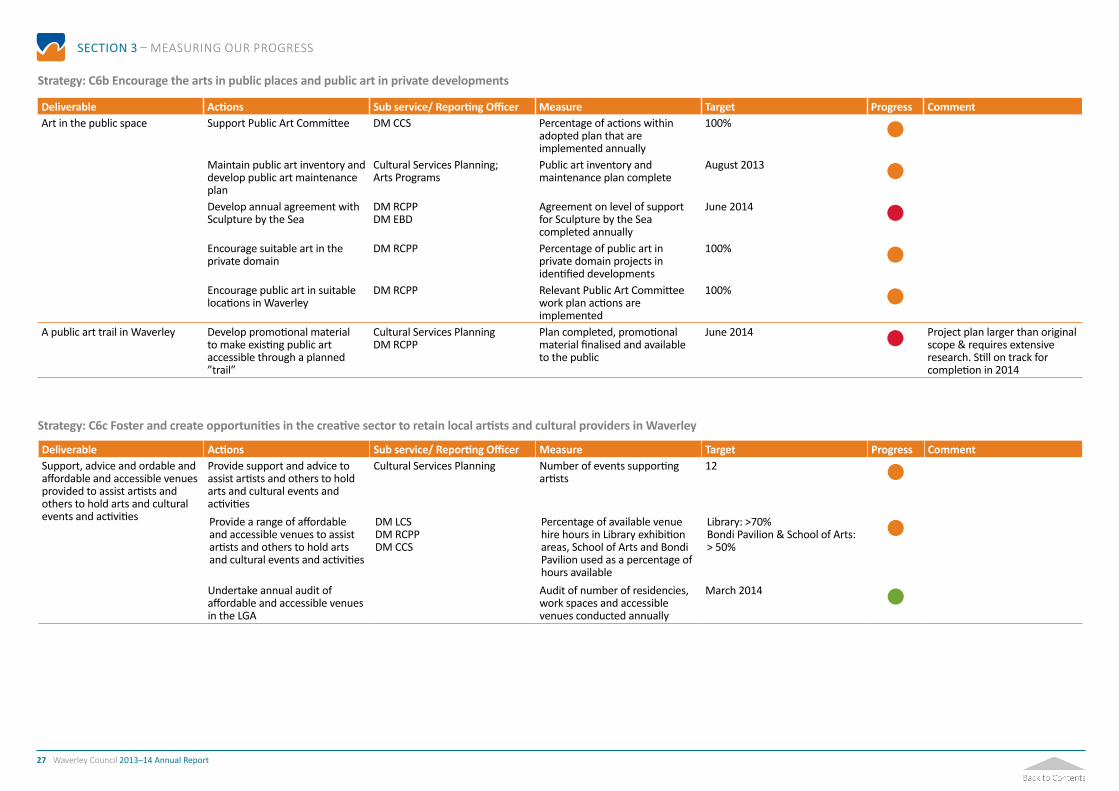
Strategy: C6b Encourage the arts in public places and public art in private developments
Deliverable Actions Sub service/ Reporting Officer Measure Target Progress Comment Art in the public space Support Public Art Committee DM CCS Percentage of actions within
adopted plan that are implemented annually
100% Maintain public art inventory and develop public art maintenance plan
Cultural Services Planning;Arts Programs
Public art inventory and maintenance plan complete
August 2013 Develop annual agreement with Sculpture by the Sea
DM RCPPDM EBD
Agreement on level of support for Sculpture by the Sea completed annually
June 2014 Encourage suitable art in the private domain
DM RCPP Percentage of public art in private domain projects in identified developments
100% Encourage public art in suitable locations in Waverley
DM RCPP Relevant Public Art Committee work plan actions are implemented
100% A public art trail in Waverley Develop promotional material
to make existing public art accessible through a planned ”trail”
Cultural Services PlanningDM RCPP
Plan completed, promotional material finalised and available to the public
June 2014 Project plan larger than original scope & requires extensive research. Still on track for completion in 2014
Strategy: C6c Foster and create opportunities in the creative sector to retain local artists and cultural providers in Waverley
Deliverable Actions Sub service/ Reporting Officer Measure Target Progress Comment Support, advice and ordable and affordable and accessible venues provided to assist artists and others to hold arts and cultural events and activities
Provide support and advice to assist artists and others to hold arts and cultural events and activities
Cultural Services Planning Number of events supporting artists
12
Provide a range of affordable and accessible venues to assist artists and others to hold arts and cultural events and activities
DM LCSDM RCPPDM CCS
Percentage of available venue hire hours in Library exhibition areas, School of Arts and Bondi Pavilion used as a percentage of hours available
Library: >70%Bondi Pavilion & School of Arts: > 50%
Undertake annual audit of affordable and accessible venues in the LGA
Audit of number of residencies, work spaces and accessible venues conducted annually
March 2014
28 Waverley Council 2013–14 Annual Report
SECTION 3 – MEASURING OUR PROGRESS
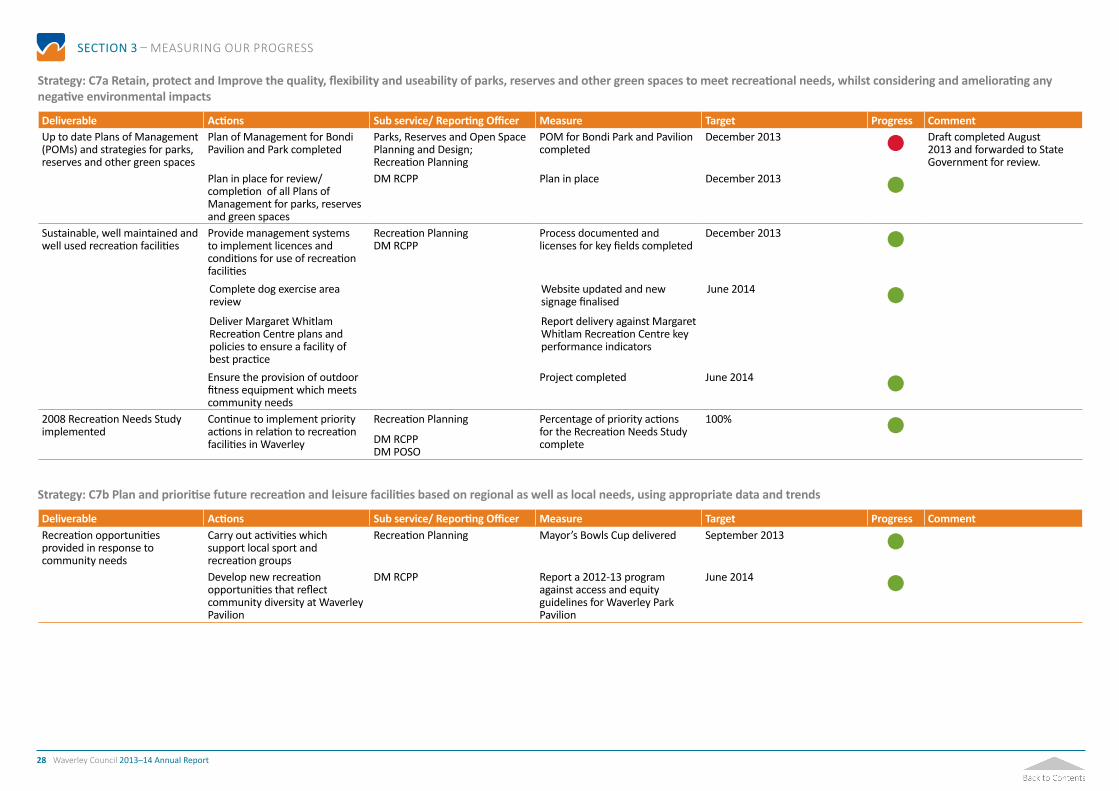
Strategy: C7a Retain, protect and Improve the quality, flexibility and useability of parks, reserves and other green spaces to meet recreational needs, whilst considering and ameliorating any negative environmental impacts
Deliverable Actions Sub service/ Reporting Officer Measure Target Progress Comment Up to date Plans of Management (POMs) and strategies for parks, reserves and other green spaces
Plan of Management for Bondi Pavilion and Park completed
Parks, Reserves and Open Space Planning and Design;Recreation Planning
POM for Bondi Park and Pavilion completed
December 2013 Draft completed August 2013 and forwarded to State Government for review.
Plan in place for review/completion of all Plans of Management for parks, reserves and green spaces
DM RCPP Plan in place December 2013
Sustainable, well maintained and well used recreation facilities
Provide management systems to implement licences and conditions for use of recreation facilities
Recreation PlanningDM RCPP
Process documented and licenses for key fields completed
December 2013
Complete dog exercise area review
Website updated and new signage finalised
June 2014 Deliver Margaret Whitlam Recreation Centre plans and policies to ensure a facility of best practice
Report delivery against Margaret Whitlam Recreation Centre key performance indicators
Ensure the provision of outdoor fitness equipment which meets community needs
Project completed June 2014 2008 Recreation Needs Study implemented
Continue to implement priority actions in relation to recreation facilities in Waverley
Recreation Planning
DM RCPPDM POSO
Percentage of priority actions for the Recreation Needs Study complete
100%
Strategy: C7b Plan and prioritise future recreation and leisure facilities based on regional as well as local needs, using appropriate data and trends
Deliverable Actions Sub service/ Reporting Officer Measure Target Progress Comment Recreation opportunities provided in response to community needs
Carry out activities which support local sport and recreation groups
Recreation Planning Mayor’s Bowls Cup delivered September 2013 Develop new recreation opportunities that reflect community diversity at Waverley Pavilion
DM RCPP Report a 2012-13 program against access and equity guidelines for Waverley Park Pavilion
June 2014

29 Waverley Council 2013–14 Annual Report
SECTION 3 – MEASURING OUR PROGRESS
Strategy: C7c Provide and support a broad range of facilities and activities to improve the physical and mental health of community members
Deliverable Actions Sub service/ Reporting Officer Measure Target Progress Comment Active and passive recreation facilities provided on Council land or through joint ventures
Finalise investigation of potential for tennis court operations and tender in Waverley Park
Parks Infrastructure Works and MaintenanceDM RCPPDM POSODM M&C
Report to Council December 2013 Rescheduled due to gap in staffing resources
Sporting fields and other active recreation facilities upgraded
Finalise schedule and plans for facilities in Waverley Park
Parks Infrastructure Works and Maintenance
Waverley March 2013 Remove and reconstruct Bocce Court depending on funding
DM RCPP Within schedule to allow other works
July 2013 Schedule altered due to delayed funding
Investigate location of netball court at Waverley Park
Report to Council August 2013 Schedule altered as above and due to gap in staffing resources
Implement landscape improvements to south west corner of Waverley Park
Completed according to agreed timetable
Within 3 months
Strategy: C7c Provide and support a broad range of facilities and activities to improve the physical and mental health of community members
Deliverable Actions Sub service/ Reporting Officer Measure Target Progress Comment Playgrounds upgraded Minimum of two playgrounds (to
be identified) to be upgraded Parks Infrastructure Works and MaintenanceDM POSODM RCPP
Construction complete June 2014 Bondi Fitness area construction scheduled to commence in June 2014, Expected completion is September 2014.Clarke Reserve Playground, construction scheduled for late June 2014, completion due early August 2014. Both projects were delayed due to longer consultation period and negotiation of contract for works.Design for Murrieverie Rd and Dudley Page playgrounds completed
Finished cost for projects and time to complete compared to agreed budget and timetable
Finished cost is within + or - 10% of agreed budget and completed within 6 months of agreed timetable
Source additional funding for playground development in priority locations as identified
Proportion of funding programs sourced
100%
Implementation of priority projects to deliver facilities and infrastructure upgraded in parks and reserves
Undertake works arising from Park Plans of Management (POM)
Parks Infrastructure Works and Maintenance
Finished cost for projects and time to complete compared to agreed budget and timetable
Finished cost is within + or - 10% of agreed budget and completed within 6 months of agreed timetable
Commence Parks Template, detailing preferred palette of materials, finishes, planting, signage and wayfinding.
DM RCPP Template completed within agreed timetable
Within 3 months of commencement
Detailed planning commenced for priority works in Bondi Park
Timeframe established Within 3 months of completion of Bondi Plan of Management

30 Waverley Council 2013–14 Annual Report
SECTION 3 – MEASURING OUR PROGRESS
Deliverable Actions Sub service/ Reporting Officer Measure Target Progress Comment Implementation of priority projects to deliver facilities and infrastructure upgraded in parks and reserves
Detailed design and construction of amenity building, Waverley Park
Parks Infrastructure Works and Maintenance
Finished cost for projects and time to complete compared to agreed budget and timetable
Finished cost is within + or - 10% of agreed budget and completed within 6 months of agreed timetable completed
Tamarama Park landscape improvements implemented
DM RCPPDM M&C
Finished cost for projects and time to complete compared to agreed budget and timetable
Finished cost is within + or - 10% of agreed budget and completed within 6 months of agreed timetable completed

31 Waverley Council 2013–14 Annual Report
SECTION 3 – MEASURING OUR PROGRESS
Sustainable LivingThis quadrant refers to those plans, policies and initiatives that support the liveability and economic vitality of the Waverley area. It covers everything from place management strategies to improve the look and feel of villages and town centres and promote economic development, through to planning for the best built form and better transport, parking and access. It represents the ‘economic’ component of the quadruple bottom line.
DirectionsL1 Waverley’s economy is vibrant and robust and
supports the creation of a variety of jobs and business opportunities.
L2 Visitors and tourists are welcomed and make a positive contribution to the community and economy.
L3 Waverley’s public places and spaces look and feel good.
L4 The unique physical qualities and strong sense of identity of Waverley’s villages is respected and celebrated.
L5 Buildings are well designed, safe and accessible and the new is balanced with the old.
L6 Streets are safe and vibrant places which facilitate movement and interaction.
L7 People frequently walk and ride their bikes, particularly for local trips.
L8 Improved quality, integration and increased frequency of public transport in Waverley.
L9 Parking, both on-street and off-street, is equitably accessed and effectively managed.
32 Waverley Council 2013–14 Annual Report
SECTION 3 – MEASURING OUR PROGRESS
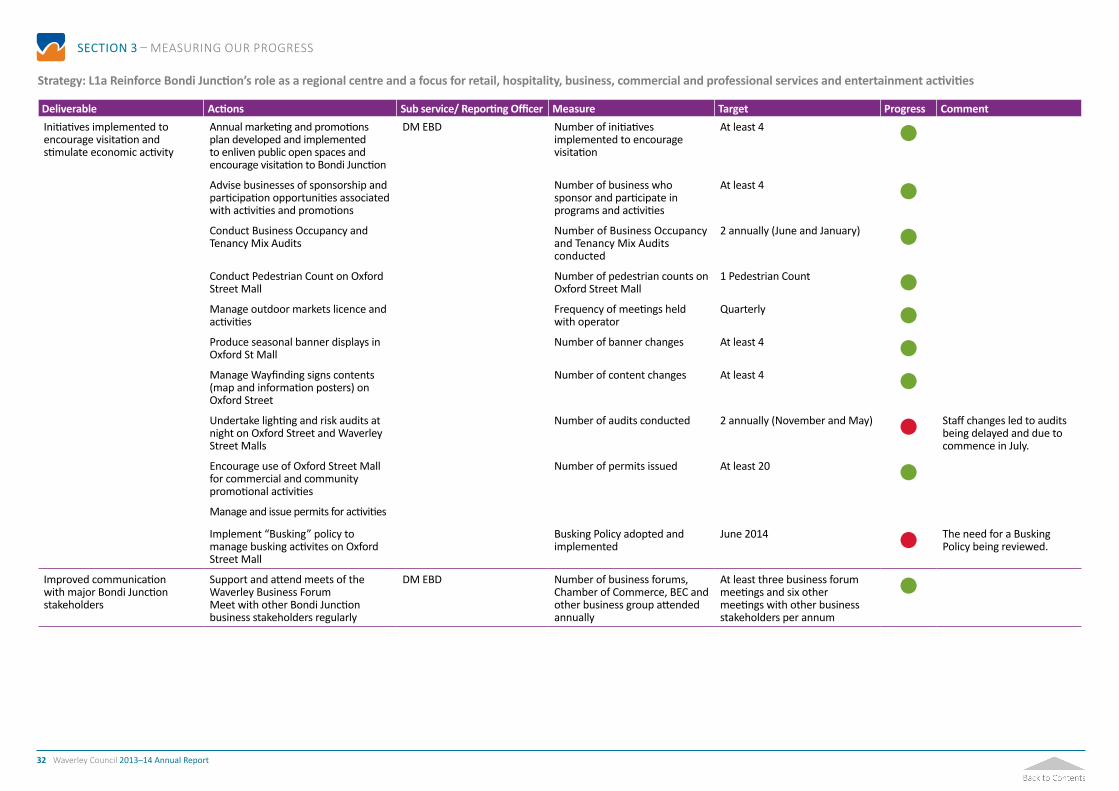
Strategy: L1a Reinforce Bondi Junction’s role as a regional centre and a focus for retail, hospitality, business, commercial and professional services and entertainment activities
Deliverable Actions Sub service/ Reporting Officer Measure Target Progress Comment Initiatives implemented to encourage visitation and stimulate economic activity
Annual marketing and promotions plan developed and implemented to enliven public open spaces and encourage visitation to Bondi Junction
DM EBD
Number of initiatives implemented to encourage visitation
At least 4
Advise businesses of sponsorship and participation opportunities associated with activities and promotions
Number of business who sponsor and participate in programs and activities
At least 4 Conduct Business Occupancy and Tenancy Mix Audits
Number of Business Occupancy and Tenancy Mix Audits conducted
2 annually (June and January) Conduct Pedestrian Count on Oxford Street Mall
Number of pedestrian counts on Oxford Street Mall
1 Pedestrian Count Manage outdoor markets licence and activities
Frequency of meetings held with operator
Quarterly Produce seasonal banner displays in Oxford St Mall
Number of banner changes At least 4 Manage Wayfinding signs contents (map and information posters) on Oxford Street
Number of content changes At least 4 Undertake lighting and risk audits at night on Oxford Street and Waverley Street Malls
Number of audits conducted 2 annually (November and May) Staff changes led to audits being delayed and due to commence in July.
Encourage use of Oxford Street Mall for commercial and community promotional activities
Number of permits issued At least 20 Manage and issue permits for activities
Implement “Busking” policy to manage busking activites on Oxford Street Mall
Busking Policy adopted and implemented
June 2014 The need for a Busking Policy being reviewed.
Improved communication with major Bondi Junction stakeholders
Support and attend meets of the Waverley Business ForumMeet with other Bondi Junction business stakeholders regularly
DM EBD Number of business forums, Chamber of Commerce, BEC and other business group attended annually
At least three business forum meetings and six other meetings with other business stakeholders per annum
33 Waverley Council 2013–14 Annual Report
SECTION 3 – MEASURING OUR PROGRESS
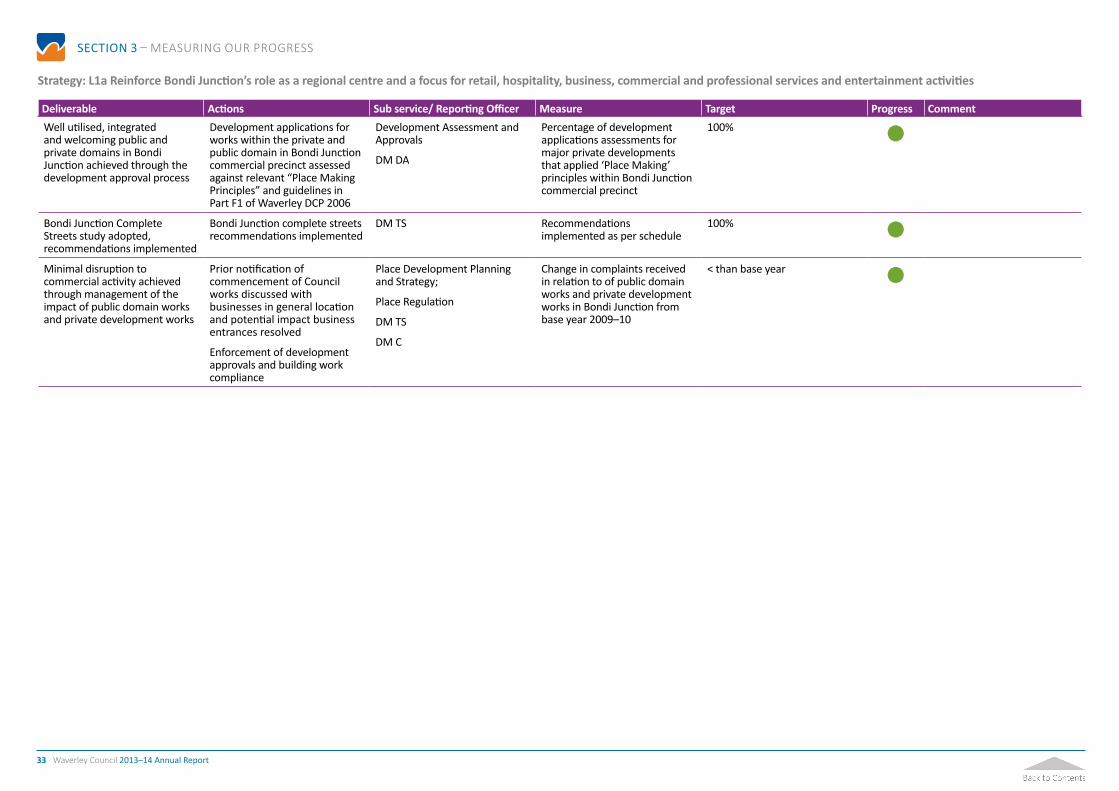
Strategy: L1a Reinforce Bondi Junction’s role as a regional centre and a focus for retail, hospitality, business, commercial and professional services and entertainment activities
Deliverable Actions Sub service/ Reporting Officer Measure Target Progress Comment Well utilised, integrated and welcoming public and private domains in Bondi Junction achieved through the development approval process
Development applications for works within the private and public domain in Bondi Junction commercial precinct assessed against relevant “Place Making Principles” and guidelines in Part F1 of Waverley DCP 2006
Development Assessment and Approvals
DM DA
Percentage of development applications assessments for major private developments that applied ‘Place Making’ principles within Bondi Junction commercial precinct
100%
Bondi Junction Complete Streets study adopted, recommendations implemented
Bondi Junction complete streets recommendations implemented
DM TS Recommendations implemented as per schedule
100% Minimal disruption to commercial activity achieved through management of the impact of public domain works and private development works
Prior notification of commencement of Council works discussed with businesses in general location and potential impact business entrances resolved
Enforcement of development approvals and building work compliance
Place Development Planning and Strategy;
Place Regulation
DM TS
DM C
Change in complaints received in relation to of public domain works and private development works in Bondi Junction from base year 2009–10
< than base year
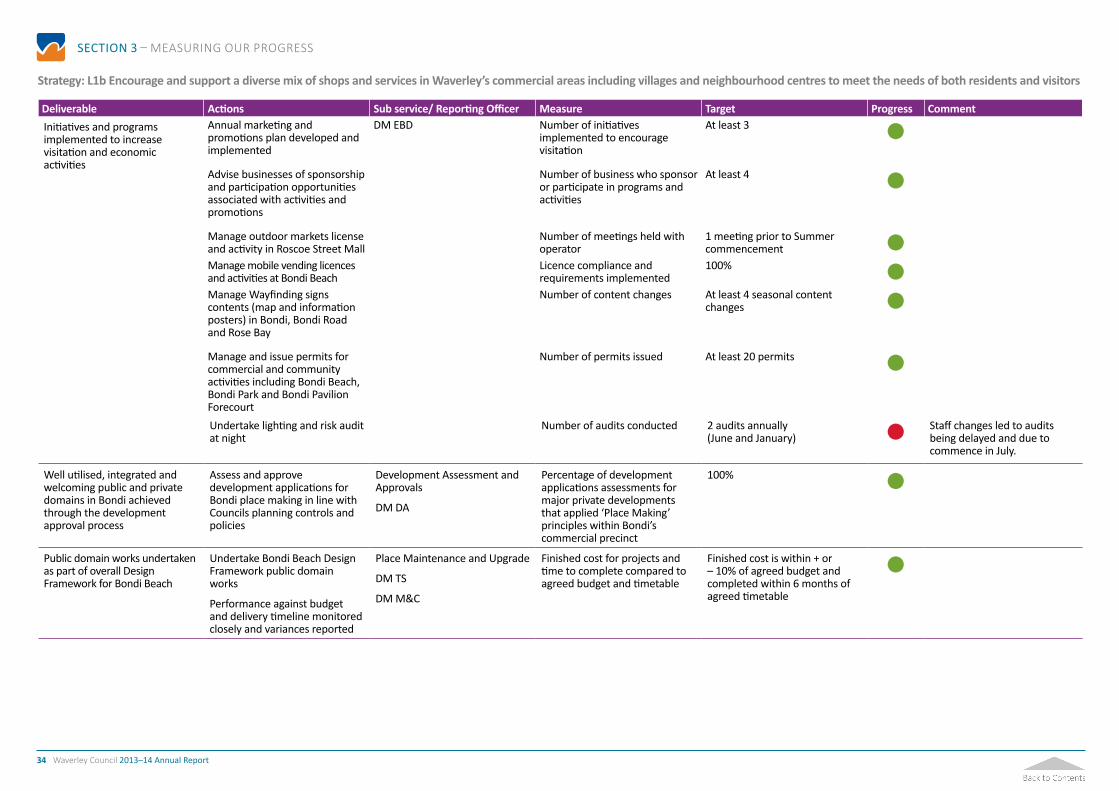
34 Waverley Council 2013–14 Annual Report
SECTION 3 – MEASURING OUR PROGRESS
Strategy: L1b Encourage and support a diverse mix of shops and services in Waverley’s commercial areas including villages and neighbourhood centres to meet the needs of both residents and visitors
Deliverable Actions Sub service/ Reporting Officer Measure Target Progress Comment Initiatives and programs implemented to increase visitation and economic activities
Annual marketing and promotions plan developed and implemented
DM EBD Number of initiatives implemented to encourage visitation
At least 3 Advise businesses of sponsorship and participation opportunities associated with activities and promotions
Number of business who sponsor or participate in programs and activities
At least 4
Manage outdoor markets license and activity in Roscoe Street Mall
Number of meetings held with operator
1 meeting prior to Summer commencement
Manage mobile vending licences and activities at Bondi Beach
Licence compliance and requirements implemented
100% Manage Wayfinding signs contents (map and information posters) in Bondi, Bondi Road and Rose Bay
Number of content changes At least 4 seasonal content changes
Manage and issue permits for commercial and community activities including Bondi Beach, Bondi Park and Bondi Pavilion Forecourt
Number of permits issued At least 20 permits
Undertake lighting and risk audit at night
Number of audits conducted 2 audits annually (June and January) Staff changes led to audits
being delayed and due to commence in July.
Well utilised, integrated and welcoming public and private domains in Bondi achieved through the development approval process
Assess and approve development applications for Bondi place making in line with Councils planning controls and policies
Development Assessment and Approvals
DM DA
Percentage of development applications assessments for major private developments that applied ‘Place Making’ principles within Bondi’s commercial precinct
100%
Public domain works undertaken as part of overall Design Framework for Bondi Beach
Undertake Bondi Beach Design Framework public domain works
Performance against budget and delivery timeline monitored closely and variances reported
Place Maintenance and Upgrade
DM TS
DM M&C
Finished cost for projects and time to complete compared to agreed budget and timetable
Finished cost is within + or – 10% of agreed budget and completed within 6 months of agreed timetable

35 Waverley Council 2013–14 Annual Report
SECTION 3 – MEASURING OUR PROGRESS
Deliverable Actions Sub service/ Reporting Officer Measure Target Progress Comment Minimal disruption to commercial activity achieved through management of the impact of public domain works and private development works
Prior notification of commencement of Council works discussed with businesses in general location and potential impact business entrances resolved
Place Development Planning and Strategy;
Place Regulation
Change in complaints received in relation to of public domain works and private development works at Bondi Beach from base year 2009–10
Less than base year
Enforcement of development approvals and building work compliance
DM TSDM C
Percentage of complaints investigated to agreed service standards timetable
100% Sustained and diverse mix of commercial activity
Conduct Business Occupancy and Tenancy Mis Audits
DM EBD Business Occupancy and Tenancy Mix Audits conducted
At least 2 Promote diverse range of business operating in commercial areas and villages
Number of promotions At least 2
Strategy: L1c Support the creation of jobs and business opportunities in Waverley commercial areas including its villages and neighbourhood centres
Deliverable Actions Sub service/ Reporting Officer Measure Target Progress Comment Programs and initiatives implemented to sustain visitation levels and commercial viability
Develop and implement a program of activities to increase and/or sustain business activity in villages
DM EBD Number of cooperative activities undertaken each year
At least two annually
Carry out regular Business Activity Audit and report results of these audits
Level of business activity in the commercial villages
Business Activity Audit show business activity stable or increasing
Meet with other business stakeholders regularly
Number of Chamber, BEC and precinct meetings attended annually
At least four meetings with business stakeholders per annum
Up to date and accessible business start-up and development information on Council’s business webpage
Work with Communications Unit in development of Council’s website with new look and navigation capabilities to include Business page and information requirements
DM EBD New look Business webpage implemented
100%
Business Page to provide relevant information and links to relevant Council areas and forms, rules and regulations to meet business needs
Business Page audited Quarterly audits of information on business webpage
Update “Doing Business” page on Council’s website regularly

36 Waverley Council 2013–14 Annual Report
SECTION 3 – MEASURING OUR PROGRESS
Strategy: L1d Create vibrant public places through the support and provision of a range of community and visitor related activities
Deliverable Actions Sub service/ Reporting Officer Measure Target Progress Comment
Programs, activities and events enliven public place
Initiatives and programs implemented to increase visitation, economic activity and employment opportunities
DM EBD Range of public place activities implemented
At least 3
Undertake surveys to measure level of community and visitor participation
Community and visitor participation in programs and activities
At least 1
Strategy: L2a Develop and implement tourism initiatives to benefit the local economy and community
Deliverable Actions Sub service/ Reporting Officer Measure Target Progress Comment Visitor information promotes shopping, dining and recreational experiences.
Visitor information marketing and material to promote diversity of shopping areas, dining, cultural and recreational experiences available
DM EBD Number of marketing material, guides and maps produced
At least two
Visitor information page on Council’s website kept up-to-date and linked to Eating Out Guide, My Bondi Summer and Bondi Winter Magic Sites
Information on visitor information page is timely and relevant
100%
Programs and events benefit both visitors and the local community.
Undertake tourim research to identify Bondi visitors numbers, country of origin, demographic, interests, spend, transport mode and length of stay. (Report to inform development of future tourism programs and initiatives).
DM EBD Tourism research undertaken 1 Awaiting results of Economic Development strategy and required actions to ensure research is relevant.
Deliver and manage a range of Council and Commercial events to suit a range of interests
Public place events addressed in accordance with Council’s Events Policy.
At least 3 Develop and deliver a program to increase winter visitation levels in Bondi to sustain business activity
Number of winter programs implemented
At least 1

37 Waverley Council 2013–14 Annual Report
SECTION 3 – MEASURING OUR PROGRESS
Deliverable Actions Sub service/ Reporting Officer Measure Target Progress Comment Regular communication with tourism providers and organisations
Attend meetings with tourism providers and organisations
DM EBD Number of meetings attended At least 4 Lobby tourism providers and organisations to include safety and alcohol messages in their marketing and promotions using Bondi Beach as a draw card
Number of marketing material containing safety and behaviour messages
At least 1
Strategy: L2b Ensure visitor related activities contribute positively to the local community and economy
Deliverable Actions Sub service/ Reporting Officer Measure Target Progress Comment Visitor management and safety program implemented.
Develop and implement summer safety and education program “My Bondi Summer”
Visitor Management Services Summer visitor management and education program implemented
1 Manage Free Beach WiFi trial at Bondi Beach and landing page message
DM EBD WiFi analytics (Baseline: 2012 – 500 average daily summer usage)
5% increase annually Safety and environmental messages are visible to and accessible to visitors and tourists at Waverley’s beaches
Replace and/or upgrade signage in commercial areas as required by Place Management Audit
DM B&S 90% of signs replaced June 2014 Distribute and maintain levels of brochures and safety information available to visitors at information centres and tourism associated businesses
DM EBD Number of outlets where brochures available
At least 10
An excessive noise compliance program
Receive noise complaints Pollution Control Programs Number of noise complaints received annually compared to base year 2009-10
Reduction in noise complaints that are sustained is = or < than base year
Investigate noise complaints DM C Commence investigation of
complaints within 21 days of receipt
100% Issue fines or take other enforcement action under the Protection of the Environment Operations Act 1997 when required to deal with noise pollution
Take enforcement action for non compliance
100%

38 Waverley Council 2013–14 Annual Report
SECTION 3 – MEASURING OUR PROGRESS
Strategy:L3a Ensure that public places are clean and well maintained
Deliverable Actions Sub service/ Reporting Officer Measure Target Progress Comment Improved coordination of public place services to commercial centres
Hold meetings between auditor and relevant managers to monitor provision of services for Commercial Centres and Villages with Public Works and Services and Compliance Divisions
DM B&S Frequency of meetings Monthly
All public place areas including high profile gardens, landscaped traffic calming devices and village centres maintained
Planting and maintenance of high profile gardens undertaken Cleaning and maintenance of landscaped traffic calming devices undertaken
Parks Cleaning and Maintenance; Place Cleaning Services; Nature Strip Mowing Services;
Percentage compliance with SLA maintenance of parks and high profile gardens
95%
Programmed cleaning of streets, village centres and non landscaped traffic calming devices undertaken in accordance with Public Place Cleansing Standards of Service
No of times annually:• landscaped traffic calming
devices are maintained;• streets, village centres and
non landscaped traffic calming devices are cleaned
• programmed maintenance of nature strips undertake
Minimum four times per year
Programmed mowing of nature strips undertaken in accordance with Public Place Cleansing Standards of Service
DM POSODM RR&PPC
Minimum four times per year
Hazards or item requiring maintenance reported and rectified
Minimum four times per year Programmed cleaning and maintenance of Council assets undertaken
Undertake programmed cleaning of council assets including street furniture, signage and litter bins in accordance with adopted Service Level Agreement
Place Cleaning Services
DM RR&PPC
Percentage compliance with SLA for maintenance of Council assets
90%

39 Waverley Council 2013–14 Annual Report
SECTION 3 – MEASURING OUR PROGRESS
Deliverable Actions Sub service/ Reporting Officer Measure Target Progress Comment Graffiti and posters removed in accordance with Council’s Graffiti Management and Poster Removal Policy
Remove graffiti in accordance with Council’s Graffiti and Billposter Removal Policy
Remove of billposters in accordance with Council’s Graffiti and Billposter Removal Policy
Respond to customer requests to remove graffiti and billposters with Service Desk (customer request system) service standards
Graffiti Removal Services
DM RR&PPC
Percentage compliance with established graffiti and bill poster removal protocol
90%
Increased graffiti removal (Service Plus Component 7 – Providing more cleaning and greening of all the spaces we share)
Graffiti Removal ServicesDM RR&PPC
Increase Graffiti Removal (m3) per Quarter
> 890m3 graffiti removed per Quarter
Community awareness of and engagement with strategies to prevent/ manage graffiti
Graffiti prevention/ management program implemented with reference to the Community Safety Plan
Community Safety;Civic Pride Programs
Update website June 2013
Number of civic pride sites maintained per year
Six sites DM RCPP New sites added each year One
Public place regulation and compliance programs undertaken
Undertake regular patrols of the area to ensure regulatory compliance in accordance with Service Level Agreements or in response to customer complaints or requests
Place Regulation
DM C
Percentage of times public place regulation and compliance programs meet service standards
90%
Abandoned cars removed Identify abandoned vehiclesArrange removal of abandon vehicles to Council depot and securely stored pending disposalArrange return or disposal of abandon vehicles
Abandon Car Control and RemovalDM CDM M&C
Percentage of abandoned cars removed in accordance with Impounding Act
100%
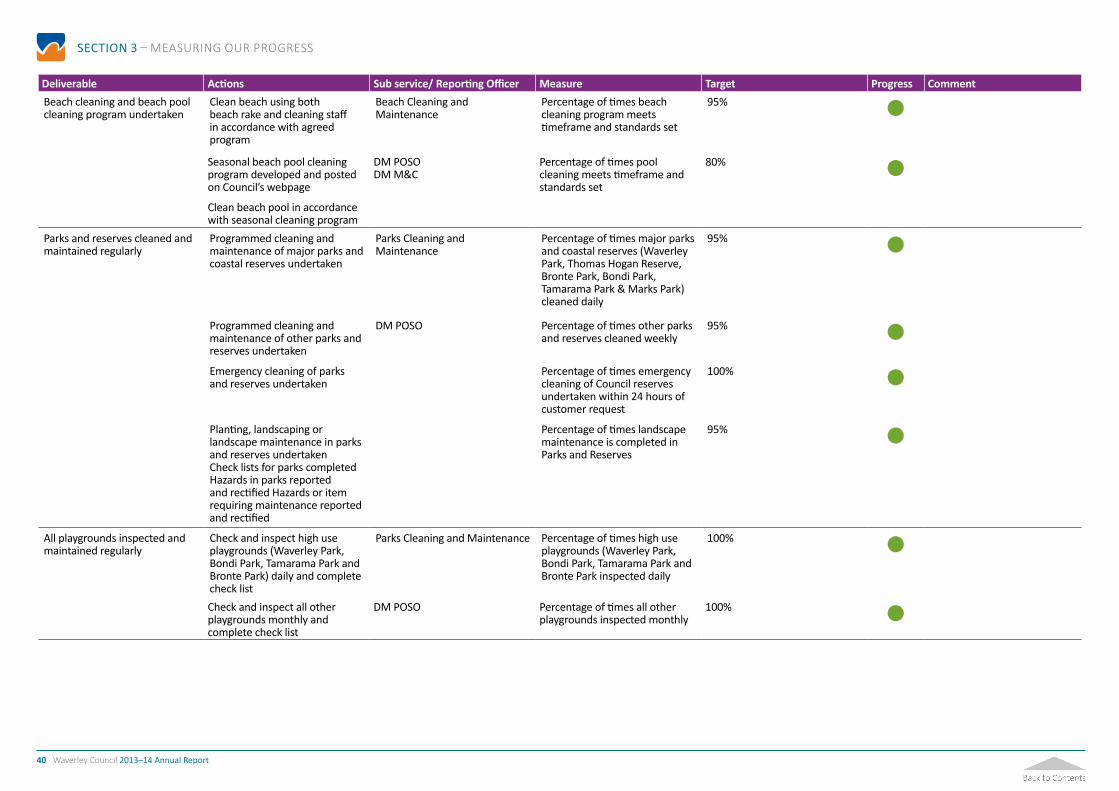
40 Waverley Council 2013–14 Annual Report
SECTION 3 – MEASURING OUR PROGRESS
Deliverable Actions Sub service/ Reporting Officer Measure Target Progress Comment Beach cleaning and beach pool cleaning program undertaken
Clean beach using both beach rake and cleaning staff in accordance with agreed program
Beach Cleaning and Maintenance
Percentage of times beach cleaning program meets timeframe and standards set
95%
Seasonal beach pool cleaning program developed and posted on Council’s webpage
Clean beach pool in accordance with seasonal cleaning program
DM POSODM M&C
Percentage of times pool cleaning meets timeframe and standards set
80%
Parks and reserves cleaned and maintained regularly
Programmed cleaning and maintenance of major parks and coastal reserves undertaken
Parks Cleaning and Maintenance
Percentage of times major parks and coastal reserves (Waverley Park, Thomas Hogan Reserve, Bronte Park, Bondi Park, Tamarama Park & Marks Park) cleaned daily
95%
Programmed cleaning and maintenance of other parks and reserves undertaken
DM POSO Percentage of times other parks and reserves cleaned weekly
95% Emergency cleaning of parks and reserves undertaken
Percentage of times emergency cleaning of Council reserves undertaken within 24 hours of customer request
100%
Planting, landscaping or landscape maintenance in parks and reserves undertakenCheck lists for parks completedHazards in parks reported and rectified Hazards or item requiring maintenance reported and rectified
Percentage of times landscape maintenance is completed in Parks and Reserves
95%
All playgrounds inspected and maintained regularly
Check and inspect high use playgrounds (Waverley Park, Bondi Park, Tamarama Park and Bronte Park) daily and complete check list
Parks Cleaning and Maintenance Percentage of times high use playgrounds (Waverley Park, Bondi Park, Tamarama Park and Bronte Park inspected daily
100%
Check and inspect all other playgrounds monthly and complete check list
DM POSO Percentage of times all other playgrounds inspected monthly
100%
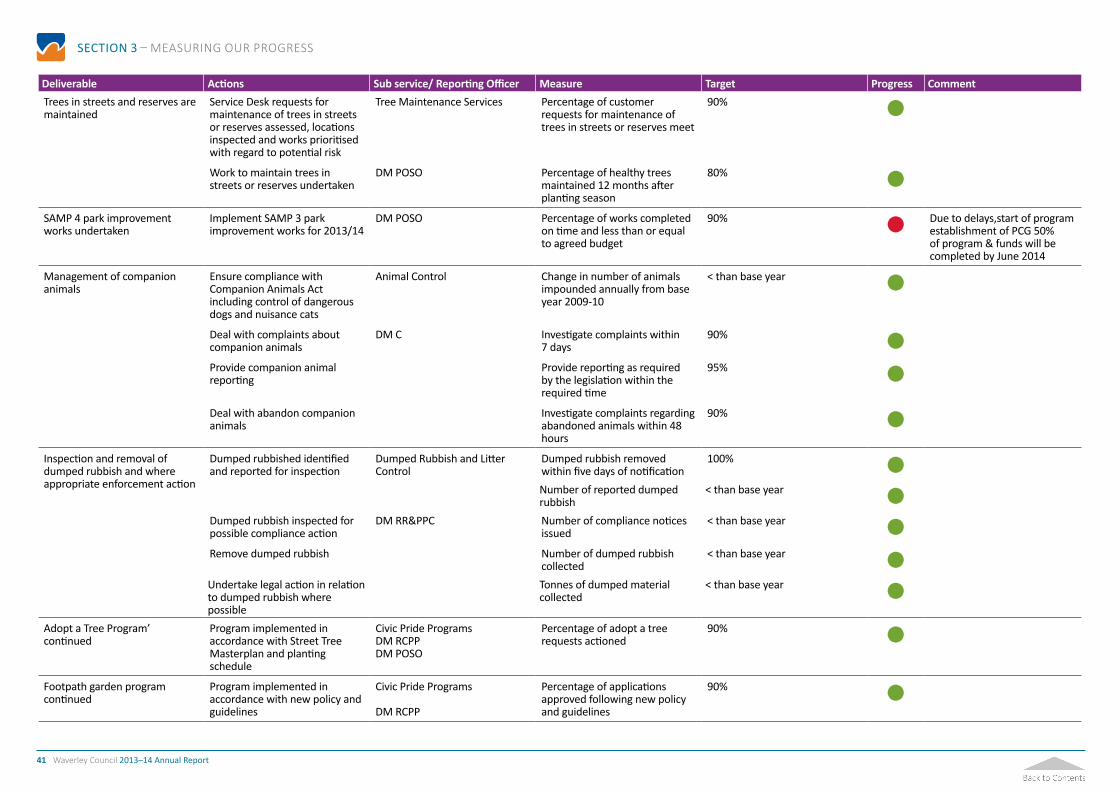
41 Waverley Council 2013–14 Annual Report
SECTION 3 – MEASURING OUR PROGRESS
Deliverable Actions Sub service/ Reporting Officer Measure Target Progress Comment Trees in streets and reserves are maintained
Service Desk requests for maintenance of trees in streets or reserves assessed, locations inspected and works prioritised with regard to potential risk
Tree Maintenance Services Percentage of customer requests for maintenance of trees in streets or reserves meet
90%
Work to maintain trees in streets or reserves undertaken
DM POSO Percentage of healthy trees maintained 12 months after planting season
80% SAMP 4 park improvement works undertaken
Implement SAMP 3 park improvement works for 2013/14
DM POSO Percentage of works completed on time and less than or equal to agreed budget
90% Due to delays,start of program establishment of PCG 50% of program & funds will be completed by June 2014
Management of companion animals
Ensure compliance with Companion Animals Act including control of dangerous dogs and nuisance cats
Animal Control Change in number of animals impounded annually from base year 2009-10
< than base year
Deal with complaints about companion animals
DM C Investigate complaints within 7 days
90% Provide companion animal reporting
Provide reporting as required by the legislation within the required time
95% Deal with abandon companion animals
Investigate complaints regarding abandoned animals within 48 hours
90% Inspection and removal of dumped rubbish and where appropriate enforcement action
Dumped rubbished identified and reported for inspection
Dumped Rubbish and Litter Control
Dumped rubbish removed within five days of notification
100% Number of reported dumped rubbish
< than base year Dumped rubbish inspected for possible compliance action
DM RR&PPC Number of compliance notices issued
< than base year Remove dumped rubbish Number of dumped rubbish
collected< than base year
Undertake legal action in relation to dumped rubbish where possible
Tonnes of dumped material collected
< than base year Adopt a Tree Program’ continued
Program implemented in accordance with Street Tree Masterplan and planting schedule
Civic Pride ProgramsDM RCPPDM POSO
Percentage of adopt a tree requests actioned
90%
Footpath garden program continued
Program implemented in accordance with new policy and guidelines
Civic Pride Programs
DM RCPP
Percentage of applications approved following new policy and guidelines
90%

42 Waverley Council 2013–14 Annual Report
SECTION 3 – MEASURING OUR PROGRESS
Strategy: L3b Develop E-Reporting process for illegal graffiti and billposters
Deliverable Actions Sub service/ Reporting Officer Measure Target Progress Comment Application available for residents to report graffiti available and promoted on Council website
Development of a graffiti reporting form available on Council’s website
DM RR&PPC Creation of the online reporting form
June 2014
Strategy: L4a Use planning and heritage policies and controls to protect and improve the unique built environment
Deliverable Actions Sub service/ Reporting Officer Measure Target Progress Comment Approved developments maintain and enhance the identity of Waverley’s villages
Assess and approve development applications in line with Councils planning controls and policies
Urban Planning
DM DA
Percentage of development applications assessed in line with Council’s planning controls and policies
100%
All properties with heritage significance listed within LEP
Properties with heritage significance identified and reviewed
Urban Planning Properties and areas with heritage significance are identified within LEP
100% Consultation undertaken, where required, into heritage listingProperties with heritage significance listed in LEP
DM STP Review DCP Heritage controls for areas outside Bondi Junction
June 2014
Part H (Heritage) of Waverley DCP reviewed as part of Waverley Planning Review
Actions for this deliverable will be carried out in future years of this Delivery Program period (subject to available funding)
DM STP Review Heritage Inventory Sheets for Heritage Items and Conservation areas
June 2014

43 Waverley Council 2013–14 Annual Report
SECTION 3 – MEASURING OUR PROGRESS
Strategy: L4b Maintain a distinct sense of identity for individual village centres, including Bondi, Bronte, Charing Cross, North Bondi and Rose Bay
Deliverable Actions Sub service/ Reporting Officer Measure Target Progress Comment Looking Good – streetscape improvement works undertaken
Consultation with key stakeholders including Place Managers undertaken
Place Maintenance and Upgrade
DM TS
Finished cost and time to complete compared to agreed budget and timetable
Cost is within + or -10% of agreed budget and completed within 6 months of agreed timetable
Rose Bay – quotations were over budget, additional funding now sourced and construction to commence shortly. Bondi Rd – following unsuccessful quotation process C&M will now call for tenders for the complete package.
Civic Pride Village Improvement Project initiated
Consultation on civic pride elements of Footpath Improvement Program with key stakeholders including Place Managers and community depending on funding 2012-13
Civic Pride Programs Number of civic pride enhancements developed and implemented annually
Two
Provide landscaping enhancement to Looking Good streetscape and other projects
DM TSDM ES
Percentage of priority projects actioned
100% Liaise with key stakeholders to plan for inclusion of civic pride elements in Footpath Improvement Program
DM RCPP Number of civic pride enhancements proposed
Two
Provide landscaping enhancement to Looking Good streetscape and other projects
Percentage of priority projects actioned
100% Action no longer part of Operational Plan

44 Waverley Council 2013–14 Annual Report
SECTION 3 – MEASURING OUR PROGRESS
Strategy: L5a Ensure planning and building controls for new buildings and building upgrades deliver high quality urban design that is safe and accessible, in which heritage and open space is recognised, respected and protected
Deliverable Actions Sub service/ Reporting Officer Measure Target Progress Comment Approved developments achieve high quality urban design outcomes
Assess and approve development applications in line with Councils planning controls and policies
Development Assessments and ApprovalsDM DA
Percentage of development applications assessed in line with Council’s planning controls and policies
100%
Comprehensive local environment plan (LEP) updated annually in line with Council’s Land Use Strategy and the requirements of the NSW Department of Planning and Infrastructure
Review comprehensive LEP
Comprehensive LEP to be publicly exhibited as required by DoPI.
Urban Planning Amendments to comprehensive LEP adopted by Council.
Annually
Arrange for LEP to be gazetted DM STP Once the LEP is gazetted by the Department of Planning post gazettal tasks completed.
Within 1 month of gazettal Development Control Plan (DCP) updated annually
Undertake review of Waverley Development Control Plan in line with LEPSubmit DCP to Council for adoption
Urban PlanningDM STP
Amendments to comprehensive DCP adopted by Council
Annually
Strategic Land Use policies and plans reviewed regularly
Ensure all key strategic land use policies and plans reviewed annually or as required
Review and where necessary amend Council land use policies and plans in the light of new and amended state and federal government legislation and policies
Urban PlanningDM STP
Specific Strategic Land Use policies and plans reviewed
100%
Compliance with Council requests for new or amended planning policies and land use plans
Update existing or create new strategic land use policies when requested by Council
Urban Planning
DM STP
Percentage of Land Use plans/ policies requested by Council completed within timeframe required
100%
Building regulation, inspection and compliance undertaken
Undertake building compliance inspectionsRespond to complaints about building compliance issues
Building and Fire Safety Regulation
Number of complaints about building work received annually compared to base year 2009-10
= or < than base year
Undertake building fire safety inspectionsIssue building occupation certificates
DM C Time to issue building certificates 14 days

45 Waverley Council 2013–14 Annual Report
SECTION 3 – MEASURING OUR PROGRESS
Strategy: L5b Protect and maintain heritage significant buildings while ensuring they are fit for use
Deliverable Actions Sub service/ Reporting Officer Measure Target Progress Comment Expert heritage advice on development applications
Provide heritage advice to development applicants
Provide heritage advice to Council officers to assist them in assessing development applications
Heritage ConservationDM STP
Heritage advice referrals completed within service standard
90%
An ongoing public education campaign on heritage and good design including annual Heritage and Urban Design Awards
Provide information to the public on heritage and good design
Conduct Heritage and Urban Design Awards
Heritage ConservationDM STP
Heritage and Urban Design Awards conducted annually
April 2014
Strategy: L5c Consider the use of planning controls and agreements to provide improvements to built infrastructure
Deliverable Actions Sub service/ Reporting Officer Measure Target Progress Comment Opportunities to deliver public infrastructure through Voluntary Planning Agreements (VPA)
Identify opportunities to deliver public infrastructure through Voluntary Planning Agreements
Urban Planning
DM STP
Percentage change in number of Voluntary Planning Agreements (VPA) executed annually from 2009-10 base year
Increase from base year
Develop new VPA policy Develop Voluntary Planning Agreements Policy that deliver public infrastructure
Urban Planning
DM STP
New VPA Policy adopted by Council
March 2014

46 Waverley Council 2013–14 Annual Report
SECTION 3 – MEASURING OUR PROGRESS
Strategy: L5d Develop a vision for Bondi Junction which creates vibrant and accessible public places through high quality urban design and placemaking principles
Deliverable Actions Sub service/ Reporting Officer Measure Target Progress Comment Conduct retail hierarchy Study in Bondi Junction
Lead DM to undertake training in Economic development
DM STP Successful completion of training
June 2014 Bondi Junction is safer and more vibrant at night
Complete Streets project adopted by Council and key recommendations implementedActions for these deliverables will be carried out in future years of this Delivery Program period (subject to available funding)
DM STP Increased pedestrian activity in Bondi Junction measured by a pedestrian survey every 5 years.
Number of pedestrians in Bondi Junction is steady or increasing
Strategy: L6a Reduce vehicle and pedestrian crashes by improving road and traffic safety measures
Deliverable Actions Sub service/ Reporting Officer Measure Target Progress Comment Construction of traffic islands in the Council area
Traffic islands designed and documented
Construction delivery in accordance with program
Traffic Management Services; Road Works and Maintenance
DM TS
DM M&C
Finished cost and time to complete compared to agreed budget and timetable
Cost within + or - 10% of agreed budget and completed within 6 months of agreed timetable
Martins Ave now complete following Energy Australia’s completion of their works.
Traffic & pedestrian crashes reviewed annually
Collect and collate traffic & pedestrian crash data
Review traffic & pedestrian crash data
Report and if required make recommendations on traffic & pedestrian accident data review
Road and Parking Safety Programs
DM TS
In 2005 total of 287 crashes with:• 2 fatal crashes• 160 injury • 125 non-casualty crashes
(tow away)Included in these crashes were:• 2 pedestrian fatalities • 24 pedestrian injuries• 0 cyclist fatalities• 25 cyclist injuries
Number of vehicle, pedestrian and cyclist crashes causing death or injury is equal to or less than 2005 base year
Improve safety around schools Undertake parking patrols around school zones
Provide information to improve safety around schools
Undertake enforcement action to ensure safety around schools
Road and Safety Parking Programs
DM PS
Number of parking patrols a week conducted around schools
Minimum of five parking patrols a week

47 Waverley Council 2013–14 Annual Report
SECTION 3 – MEASURING OUR PROGRESS
Strategy: L6b Stabilise or reduce private passenger vehicle numbers or trips
Deliverable Actions Sub service/ Reporting Officer Measure Target Progress Comment Waverley Transport Plan review completed
Commence implementation of short term projects identified in the Waverley Transport Plan
DM ES Percentage of identified works completed as per schedule
100% Review The Waverley Transport Plan
Review complete October 2013 The review of the Waverley Transport Plan was integrated within the Complete Streets, Waverley Bike Plan and Light Rail Feasibility programs completed in December 2013
Infrastructure, education and promotion programs to encourage car efficiency and active travel as an alternative to the private car
Coordinate local events, including Ride to Work Day and Walk to Schools Day, that promote sustainable transport
Run community workshops, including bike proficiency and bike maintenance, that encourage cycling
Prepare transport access guides for Council facilities
Alternative Transport ProgramsDM ES
Number of event, educational activities and other programs to encourage sustainable transport alternatives provided each year
Three events, 12 workshops, two guides
Improved quality and frequency of public transport in the LGA through working with state government and other agencies
Meet regularly with state government agencies to discuss possible improvements/ changes to increase in public transport capacity in LGA
Transport Planning
DM ESDM STPDM TS
Meetings held with agencies Twice per year
Strategy: L6c Ensure access to major movement hubs is clear and direct
Deliverable Actions Sub service/ Reporting Officer Measure Target Progress Comment
Improved pedestrian and commuter connections to public transport
Implement the Complete Streets recommendations adopted by Council in Bondi Junction
DM STPDM TSDM ES
Compare public transport usage information from STA and SRA
Increase in commuters using public transport over 4 years from the base year 2013/14.

48 Waverley Council 2013–14 Annual Report
SECTION 3 – MEASURING OUR PROGRESS
Strategy: L6d Create place based centres which prioritise the pedestrian experience
Deliverable Actions Sub service/ Reporting Officer Measure Target Progress Comment
Improved public domain infrastructure
Implement the Complete Streets recommendations adopted by Council in Bondi Junction
DM STPDM TSDM EBD
Conduct pedestrian survey in key commercial centres annually and compare pedestrian numbers over 4 years from the base year.
Increase in pedestrian numbers
Strategy: L7a Create safe and accessible pedestrian and cycle links into, out of and within Waverley
Deliverable Actions Sub service/ Reporting Officer Measure Target Progress Comment
Availability of bicycle parking improved
Identify locations that require new or additional bicycle parking or other bicycle related facilities
Provide bicycle parking or other bicycle related facilities
Consultation with key stakeholders including Place Managers undertaken
Cyclist Mobility ProgramsDM ESDM TS
Annual increase in the number of bicycle parking spaces
20 per year
Footpath amenity and accessibility improved
Develop annual footpath program in consultation with Access Committee
Undertake adopted annual footpath program
Pedestrian Mobility Programs
DM TSDM M&C
Finished cost and time to complete compared to agreed budget and timetable
Cost within + or - 10% of agreed budget and completed within 6 months of agreed timetable
10% increase in proportion of footpaths kept in top condition
(Service Plus Component 4 – Providing more and safer access to public places)
Consultation with key stakeholders including Place Managers undertaken
Pedestrian Mobility Programs
DM TSDM M&C
Finished cost and time to complete compared to agreed budget and timetable
Cost within + or - 10% of agreed budget and completed within 6 months of agreed timetable

49 Waverley Council 2013–14 Annual Report
SECTION 3 – MEASURING OUR PROGRESS
Strategy: L8a Improve and augment public transport along main routes
Deliverable Actions Sub service/ Reporting Officer Measure Target Progress Comment Support for public buses to directly connect neighbourhood centres
Bus operations reviewed annually with STAReport and if required make recommendations on traffic and pedestrian accident data review to assist with STA planning
Transport Planning
DM TS
Meeting held with STA December 2013
Bus shelters maintained and replaced
Bus shelter replacement developed and adopted
Other Infrastructure Works and MaintenanceDM TS
Number of bus shelters replaced annually
At least two No funding in 2013/14.
Bus shelters requiring maintenance identifiedMaintenance of bus shelters undertaken
Finished cost and time to complete compared to agreed budget and timetable
Cost within + or - 10% of agreed budget and completed within 6 months of agreed timetable
Information on Bondi Junction and Bondi Beach promotes the use of public transport
Provide information on the use of public transport in marketing material for events and activities at Bondi Junction and Bondi BeachEnsure promoters for events at Bondi Junction and Bondi Beach where Council is an event partner promotes the use of public transport in marketing/ promotional material
Place MarketingDM EBD
Percentage of marketing material that promotes the use of public transport
100%
Parking patrol conducted along main roads during weekdays
Undertake parking patrols along main roads during weekdaysProvide information to improve parking compliance along main roadsUndertake enforcement action to ensure compliance along main roads
On Street Parking ServicesDM PS
Number of parking patrols conducted each day along main roads during weekdays
Two
Parking patrol conducted along transport corridors during weekends
Undertake parking patrols along transport corridors during weekendsProvide information to improve parking compliance along transport corridorsUndertake enforcement action to ensure compliance along transport corridors
On Street Parking ServicesDM PS
Number of parking patrols conducted each day along transport corridors during weekends
Two
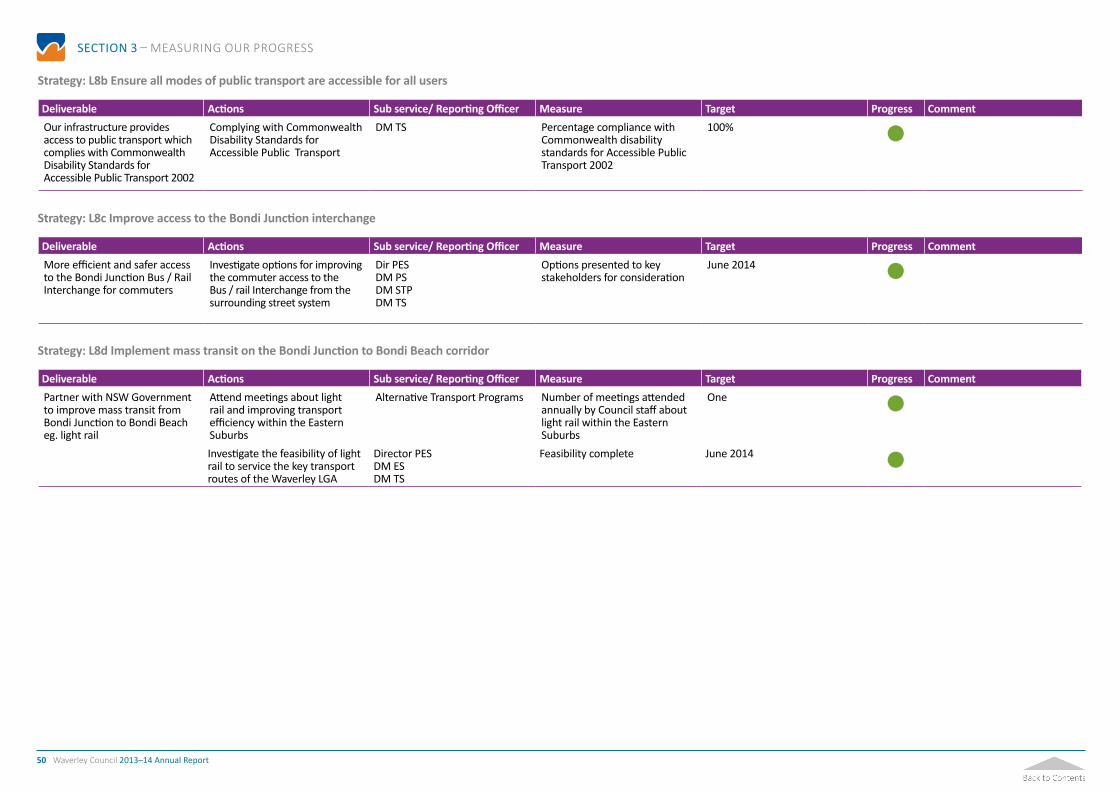
50 Waverley Council 2013–14 Annual Report
SECTION 3 – MEASURING OUR PROGRESS
Strategy: L8b Ensure all modes of public transport are accessible for all users
Deliverable Actions Sub service/ Reporting Officer Measure Target Progress Comment Our infrastructure provides access to public transport which complies with Commonwealth Disability Standards for Accessible Public Transport 2002
Complying with Commonwealth Disability Standards for Accessible Public Transport
DM TS Percentage compliance with Commonwealth disability standards for Accessible Public Transport 2002
100%
Strategy: L8c Improve access to the Bondi Junction interchange
Deliverable Actions Sub service/ Reporting Officer Measure Target Progress Comment More efficient and safer access to the Bondi Junction Bus / Rail Interchange for commuters
Investigate options for improving the commuter access to the Bus / rail Interchange from the surrounding street system
Dir PESDM PSDM STPDM TS
Options presented to key stakeholders for consideration
June 2014
Strategy: L8d Implement mass transit on the Bondi Junction to Bondi Beach corridor
Deliverable Actions Sub service/ Reporting Officer Measure Target Progress Comment Partner with NSW Government to improve mass transit from Bondi Junction to Bondi Beach eg. light rail
Attend meetings about light rail and improving transport efficiency within the Eastern Suburbs
Alternative Transport Programs Number of meetings attended annually by Council staff about light rail within the Eastern Suburbs
One
Investigate the feasibility of light rail to service the key transport routes of the Waverley LGA
Director PESDM ESDM TS
Feasibility complete June 2014

51 Waverley Council 2013–14 Annual Report
SECTION 3 – MEASURING OUR PROGRESS
Strategy: L9a Ensure fair access to parking services through regular review of parking demand, fee structures, enforcement and facilities
Deliverable Actions Sub service/ Reporting Officer Measure Target Progress Comment Parking patrols conducted in accordance with adopted program in commercial and residential areas
Identify priority areas to be patrolledUndertake parking patrols in commercial and residential areas
On Street Parking Services Patrol numbers in commercial areas
Commercial areas• Bondi Beach – Minimum 2
per day• Bondi Junction – Minimum 2
per day• Bronte – Minimum 1 per day• Local villages – Minimum 1
per week
Undertake enforcement action to ensure compliance
DM PS Patrol numbers in residential areas
Residential areas• Bondi Beach – Minimum 2 per
day (weekend) and 1 per day (weekday)
• Bondi Junction – Minimum 1 per day
• Bronte – Minimum 1 per day• Local neighbourhoods –
Minimum 1 per week
Accepted Residential Preferential Parking Scheme Recommendations implemented
Implementation of all recommendations of the RPPS Review as resolved by Council
On Street Parking ServicesDM PS
Finalisation of the implementation of all recommendations of the RPPS Review
80 % complete within one year of adoption of the recommendations
Strategy: L9b Increase the community’s knowledge and awareness of safe parking practices
Deliverable Actions Sub service/ Reporting Officer Measure Target Progress Comment Rolling education program to promote safe parking carried out
Identify parking and road safety issues that would benefit from further community education
Road and Safety Parking Programs
Produce educational material for identified risk areas
DM PS Number of articles on safe parking published annually
At least two Provide talks on parking and road safety issues to school and community organisations
Number of talks on road safety provided to schools or other organisations
At least five

52 Waverley Council 2013–14 Annual Report
SECTION 3 – MEASURING OUR PROGRESS
Sustainable EnvironmentThis quadrant refers to those plans, policies and initiatives that improve environmental sustainability. For example, strategies that seek to promote recycling and reuse in the community, actions that maintain and enhance wildlife corridors and those that encourage water and energy saving by the community. It represents the ‘environmental’ component of the quadruple bottom line.
Directions
E1 Waverley’s community contributes to the reduction of greenhouse gas emissions.
E2 Waverley and its community is well prepared for the impacts of climate change.
E3 Waverley’s community, including its visitors, reduces the amount of waste it generates and increases the amount it reuses and recycles.
E4 Water is used carefully and sparingly in Waverley’s buildings, gardens, businesses and Council operations.
E5 The waterways and beaches are clean and free of pollutants.
E6 A network of parks and coastal reserves, street trees and other plantings provides a habitat for a thriving local ecology.
E7 Our coastal waters provide a habitat for a thriving marine ecology.
E8 Waverley is an environmentally educated and committed community.
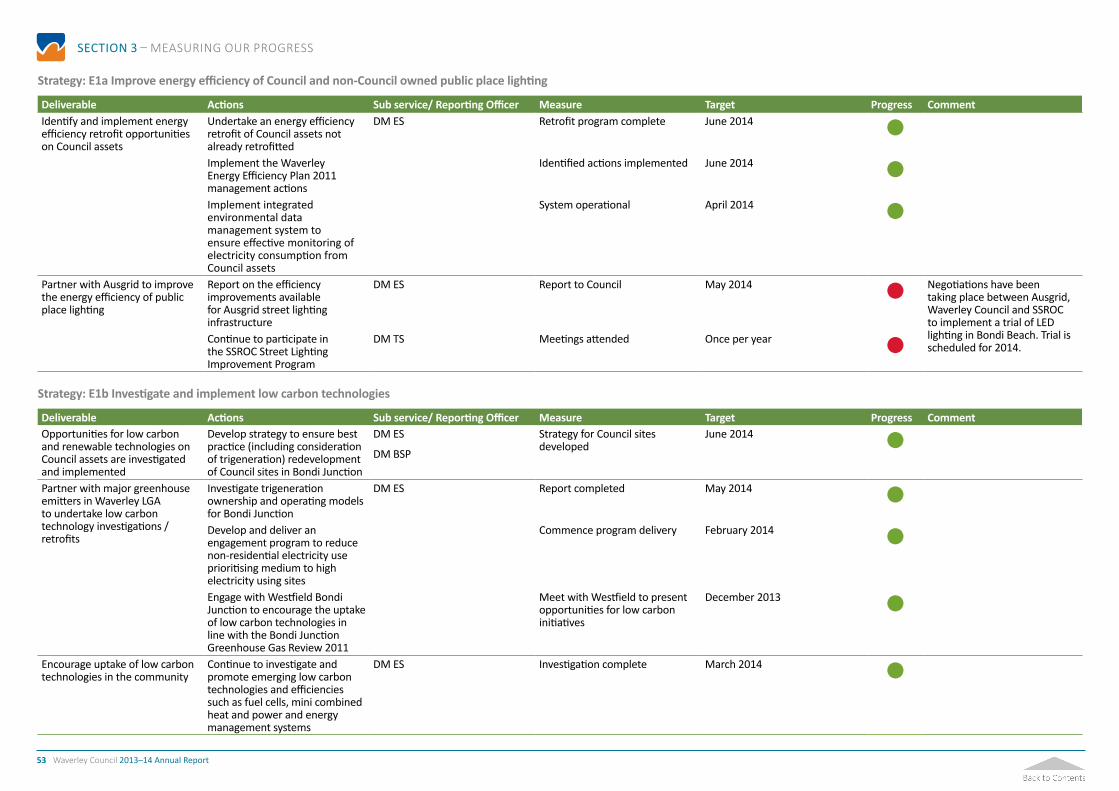
53 Waverley Council 2013–14 Annual Report
SECTION 3 – MEASURING OUR PROGRESS
Strategy: E1a Improve energy efficiency of Council and non-Council owned public place lighting
Deliverable Actions Sub service/ Reporting Officer Measure Target Progress Comment Identify and implement energy efficiency retrofit opportunities on Council assets
Undertake an energy efficiency retrofit of Council assets not already retrofitted
DM ES Retrofit program complete June 2014 Implement the Waverley Energy Efficiency Plan 2011 management actions
Identified actions implemented June 2014 Implement integrated environmental data management system to ensure effective monitoring of electricity consumption from Council assets
System operational April 2014
Partner with Ausgrid to improve the energy efficiency of public place lighting
Report on the efficiency improvements available for Ausgrid street lighting infrastructure
DM ES Report to Council May 2014 Negotiations have been taking place between Ausgrid, Waverley Council and SSROC to implement a trial of LED lighting in Bondi Beach. Trial is scheduled for 2014.
Continue to participate in the SSROC Street Lighting Improvement Program
DM TS Meetings attended Once per year
Strategy: E1b Investigate and implement low carbon technologies
Deliverable Actions Sub service/ Reporting Officer Measure Target Progress Comment Opportunities for low carbon and renewable technologies on Council assets are investigated and implemented
Develop strategy to ensure best practice (including consideration of trigeneration) redevelopment of Council sites in Bondi Junction
DM ES
DM BSP
Strategy for Council sites developed
June 2014
Partner with major greenhouse emitters in Waverley LGA to undertake low carbon technology investigations / retrofits
Investigate trigeneration ownership and operating models for Bondi Junction
DM ES Report completed May 2014 Develop and deliver an engagement program to reduce non-residential electricity use prioritising medium to high electricity using sites
Commence program delivery February 2014
Engage with Westfield Bondi Junction to encourage the uptake of low carbon technologies in line with the Bondi Junction Greenhouse Gas Review 2011
Meet with Westfield to present opportunities for low carbon initiatives
December 2013
Encourage uptake of low carbon technologies in the community
Continue to investigate and promote emerging low carbon technologies and efficiencies such as fuel cells, mini combined heat and power and energy management systems
DM ES Investigation complete March 2014

54 Waverley Council 2013–14 Annual Report
SECTION 3 – MEASURING OUR PROGRESS
Strategy: E1c Improve energy efficiency of new and existing building stock
Deliverable Actions Sub service/ Reporting Officer Measure Target Progress Comment Incentives developed to encourage sustainable retrofits of existing building stock
Survey large multi-unit developments to develop an energy and water efficiency program
Energy Management Programs
DM ES
Survey complete June 2014
Incentives developed to encourage sustainable building design and construction beyond BASIX through the DA process
Encourage the uptake of low carbon technologies in Bondi Junction mixed development via incentive program
Energy Management Programs
DM ES
Incentive program developed Feb 2014 Incorporated into the Green Infrastructure project
Information and education for residents on energy efficient technologies and behaviors in building design and construction, renovations and general retrofits
Coordinate community workshops that assist residents improve energy efficiency and reduce energy consumption
Environmental Education Programs
Number of targeted workshops run annually
Four
Provide up to date information to residents in a range of formats on energy efficient technologies and rebates
DM ES Update website monthly 100%
Opportunities for improved energy efficiency and low carbon technologies in commercial and residential buildings identified and controls developed.
Identify opportunities for improved energy efficient and uptake of low carbon technologies and develop planning controls to encourage via the Waverley DCP
Energy Management Programs Integrate controls into the Waverley DCP
Sep 2013
Ensure all new Council buildings have a high energy performance
DM ES
DM STP
Ensure Environmental Services are represented on Project Control Groups for new builds
100%

55 Waverley Council 2013–14 Annual Report
SECTION 3 – MEASURING OUR PROGRESS
Strategy: E1d Encourage and support the Waverley community to minimise electricity use and reliance on non-renewable energy
Deliverable Actions Sub service/ Reporting Officer Measure Target Progress Comment Uptake of Green Power by residents and businesses increased through promotions and retailer partnerships
Advocate for the Australian Government to release Greenpower consumption data by LGA
Energy Management ProgramsDM ES
Correspondence sent December 2013
Partner with major residential and non-residential electricity consumers to reduce consumption and improve efficiency
Develop and deliver an engagement program to reduce non-residential electricity use prioritising medium to high electricity using sites
Energy Management ProgramsDM ES
Commence program delivery February 2014
Develop and deliver and engagement program to increase residents awareness of the phase out of electric hot water systems and options for an efficient system
Program delivered December 2013
Strategy: E1e Increase the efficiency of car use through increased passengers, car pooling, car sharing, small cars, fuel efficiency and avoiding trips
Deliverable Actions Sub service/ Reporting Officer Measure Target Progress Comment Increased use of car sharing vehicles to reduce private vehicle ownership, vehicle kilometres travelled (VKT) and parking demand
Identify locations for additional car share spacesCreate additional car share spacesPublicise car share scheme and additional car share spaces
Alternative Transport ProgramsDM TS DM ES
Increase in car share spaces in 2012–2013
15% increase on previous year
Improve environmental performance of Council’s fleet
Implement identified actions in the Waverley Sustainable Fleet Policy
Alternative Transport ProgramsDM ESDM TS DM BS
Percentage of identified actions complete
100%

56 Waverley Council 2013–14 Annual Report
SECTION 3 – MEASURING OUR PROGRESS
Strategy: E1f Increase trips by active travel including walking, cycling and public transport
Deliverable Actions Sub service/ Reporting Officer Measure Target Progress Comment An expanded bicycle network together with the provision of bike facilities throughout the LGA
Participate in the Inner Sydney Regional Bike Plan discussions/ workshops
Cyclist Mobility Programs Attend workshops Two per year Improve the provision of bike parking facilities in the Waverley LGA
DM ESDM TS
Number of bike parking facilities provided
20 per year Pedestrian networks developed, which enable pedestrians to enjoy safe, convenient and coherent independent mobility particularly around transit corridors and facilities
Prepare application for a Local Area Traffic Zone in Bondi Junction Commercial Core
DM TSDM ES
Application submitted to the RTA December 2013 BJ – no funding in 2013/14.
Prepare application for a Local Area Traffic Zone on the Eastern Beaches Coast Walk from Notts Avenue to Bronte Beach
Application submitted to the RTA June 2014 Coast walk – consultant to be engaged to undertake traffic and pedestrian counts in advance of submission to RMS.
Strategy: E2a Identify, plan and respond to future impacts of climate change
Deliverable Actions Sub service/ Reporting Officer Measure Target Progress Comment Continue to assess and manage climate change impacts in theWaverley area including impacts on our natural assets, built infrastructure and the community’s health
Implement the recommendations of the Waverley Coastal Risk and Hazards Vulnerability Study
Environmental Sustainability PlanningDM ESDM TS
Percentage of identified actions implemented
100%
Investigate and implement micro-climate management actions to reduce urban heat island effect
Seek grant funding to complete thermal imaging project across the Eastern Suburbs
Environmental Sustainability PlanningDM ESDM POSO
Grant documentation prepared May 2014
Strategy: E2b Ensure Council and the Community are well prepared for inevitable climate change impacts
Deliverable Actions Sub service/ Reporting Officer Measure Target Progress Comment Develop and implement climate change adaptation plan
No action in 2013/14

57 Waverley Council 2013–14 Annual Report
SECTION 3 – MEASURING OUR PROGRESS
Strategy: E3a Reduce waste generation and maximise recycling in CUOncil operations, homes, businesses, schools, development sites and public places
Deliverable Actions Sub service/ Reporting Officer Measure Target Progress Comment A domestic waste and recycling service, together with a public place litter collection service
Collect domestic waste weekly Domestic Waste Services;Recycling Services;Green Waste Services;Clean Up ServicesDM RR&PPC
Total tonnes domestic waste collected annually
Decrease in tonnes from previous year Environmental Services
developing a Multi Unit Dwelling Recycling Project Action Plan with the assistance from RR&PPC
Collect domestic recycling weekly
Total tonnes domestic recycling collected annually
Increase in tonnes from previous year
Collect domestic garden waste fortnightly
Total domestic tonnes garden waste collected annually
Increase in tonnes from previous year
Provide a domestic waste clean up service
Total tonnes domestic waste clean up collected annually
Equal to tonnes from previous year
Empty street litter bins Street litter bins less than 100% full
>95% Percentage of domestic waste services provided compared to services missed
>95% Work with businesses, schools and residents to increase recycling and recovery rates and decrease waste generation rates
Undertake trial program with residents in multi unit developments to improve recycling rates and reduce contamination and illegal dumping
Waste Management Programs Trial program commenced
Recycling increased annually
August 2013
Increased recycling rates compared to previous year
Develop and deliver an engagement program to maximise recycling
DM ESDM RR&PPCDM B&SDM M&C
Program implemented September 2013 MUDs trial has been completed. Roll out will commence in July 2014.
Develop in collaboration with industry a residential engagement program to recover wastes of concern and other waste types
Program developed June 2014
Residential food waste reduction program implemented
Continue to run the Compost Revolution food waste program in partnership with Woollahra and Randwick Council’s
Waste Management Programs
DM ESDM RR&PPCDM B&S
Number of compost bins distributed
200 each year
A waste and litter management strategy for public places that integrates infrastructure, education, management and enforcement
Run an anti-litter education/ enforcement program at Waverley beaches
Waste Management Programs Anti-litter program complete Summer 2013 Investigate options for improved waste management within Bondi Park
DM ESDM BJDM BBDM C
Review complete June 2014 Waste and litter reduction management plan for Bondi Place Management Area reviewed, implemented and monitored
Reduction in amount of waste produced

58 Waverley Council 2013–14 Annual Report
SECTION 3 – MEASURING OUR PROGRESS
Deliverable Actions Sub service/ Reporting Officer Measure Target Progress Comment Local events and initiatives that encourage recycling of other waste types eg, Clothes Swaps, Second Hand Market Days, Freecycle
Coordinate community workshops that encourage recycling and reuse of otherwise discarded items
Environmental Education ProgramsDM ES
Number of targeted waste workshops
10
Coordinate and promote collection services that encourage recycling of other waste types
Number of drop off electronic waste collections
2 per year
Strategy: E3a Reduce waste generation and maximise recycling in Council operations, homes, businesses, schools, development sites and public places
Deliverable Actions Sub service/ Reporting Officer Measure Target Progress Comment Work with SSROC to investigate regional waste reuse, recovery and disposal opportunities
Work with SSROC to identify and apply for NSW Government Waste Less, Recycle More grants to improve regional waste performance
Waste Management PlanningDM ESDM RR&PPC
Grant application complete One per year
Local collection options for the responsible disposal or recycling of non-putrescible wastes eg, batteries, paints, oil heaters investigated
Update Council’s website to provide up to date information of collection program for other waste types
Waste Management ProgramsDM ES
Website maintained with current information
100%
Strategy: E3b Reduce illegal dumping and littering
Deliverable Actions Sub service/ Reporting Officer Measure Target Progress Comment Infrastructure, education and enforcement programs to reduce littering and illegal dumping are implemented
Continue to implement the Waverley Littering and Illegal Dumping Action Plan
Waste Management PlanningDM RR&PPC
Percentage of identified actions implemented
100% Develop and deliver a community engagement program to reduce littering and illegal dumping
DM ES Engagement program commenced
October 2014
Partner with the NSW Government and regional Council’s to deliver an integrated littering and illegal dumping program
Work with SSROC to identify and apply for NSW Government Waste Less, Recycle More grants to improve regional waste performance
Waste Management Planning
DM ESDM RR&PPC
Grant application complete One per year
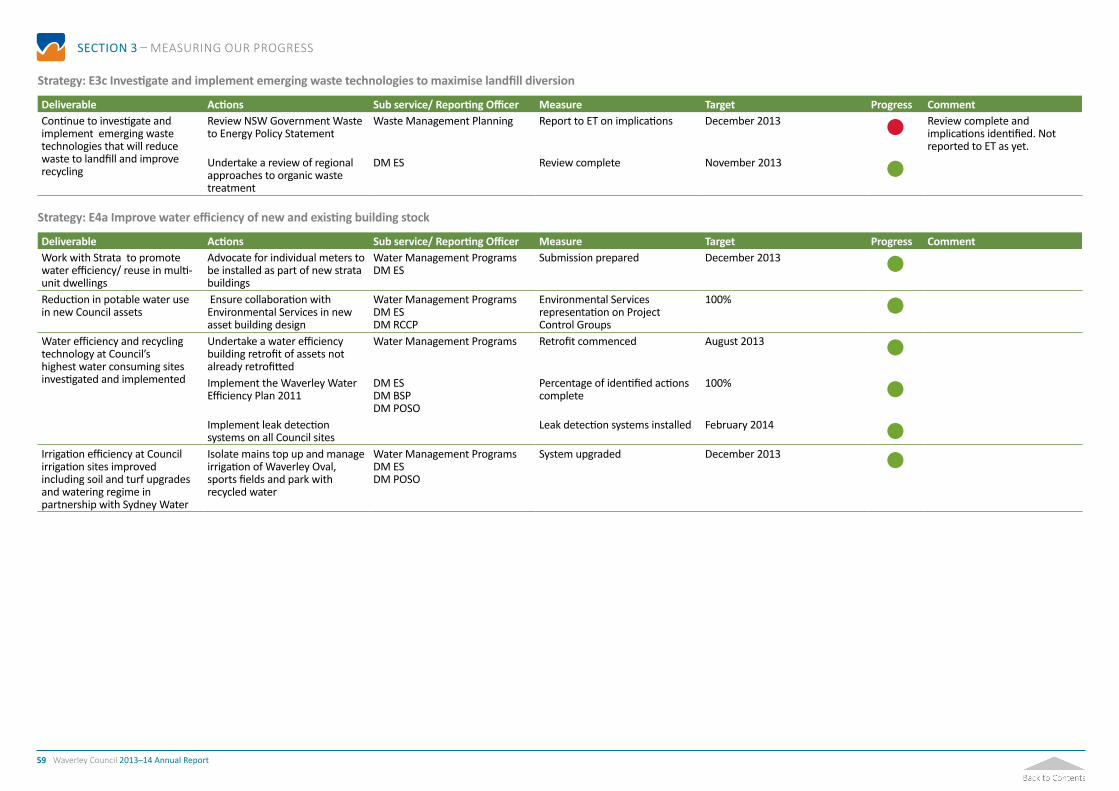
59 Waverley Council 2013–14 Annual Report
SECTION 3 – MEASURING OUR PROGRESS
Strategy: E3c Investigate and implement emerging waste technologies to maximise landfill diversion
Deliverable Actions Sub service/ Reporting Officer Measure Target Progress Comment Continue to investigate and implement emerging waste technologies that will reduce waste to landfill and improve recycling
Review NSW Government Waste to Energy Policy Statement
Waste Management Planning Report to ET on implications December 2013 Review complete and implications identified. Not reported to ET as yet.
Undertake a review of regional approaches to organic waste treatment
DM ES Review complete November 2013
Strategy: E4a Improve water efficiency of new and existing building stock
Deliverable Actions Sub service/ Reporting Officer Measure Target Progress Comment Work with Strata to promote water efficiency/ reuse in multi-unit dwellings
Advocate for individual meters to be installed as part of new strata buildings
Water Management ProgramsDM ES
Submission prepared December 2013 Reduction in potable water use in new Council assets
Ensure collaboration with Environmental Services in new asset building design
Water Management ProgramsDM ESDM RCCP
Environmental Services representation on Project Control Groups
100% Water efficiency and recycling technology at Council’s highest water consuming sites investigated and implemented
Undertake a water efficiency building retrofit of assets not already retrofitted
Water Management Programs Retrofit commenced August 2013 Implement the Waverley Water Efficiency Plan 2011
DM ESDM BSPDM POSO
Percentage of identified actions complete
100% Implement leak detection systems on all Council sites
Leak detection systems installed February 2014 Irrigation efficiency at Council irrigation sites improved including soil and turf upgrades and watering regime in partnership with Sydney Water
Isolate mains top up and manage irrigation of Waverley Oval, sports fields and park with recycled water
Water Management ProgramsDM ESDM POSO
System upgraded December 2013

60 Waverley Council 2013–14 Annual Report
SECTION 3 – MEASURING OUR PROGRESS
Strategy: E4b Encourage and support the Waverley community to minimise water consumption and reliance on potable water supplies
Deliverable Actions Sub service/ Reporting Officer Measure Target Progress Comment Water conservation workshops giving practical advice for sustainable building design, renovations and water efficient technologies focusing on residents and businesses
Continue to run targeted water efficiency workshops for residents
Water Management ProgramsDM ES
Workshops held Four per year
Communication and awareness activities on water efficient tips, rainwater harvesting and reuse, greywater reuse, blackwater systems, groundwater use and available rebates/ discounts rolled out
Provide up to date information to residents on improving water efficiency Promote other rebates and water savings programs offered by other government agencies
Water Management Programs
DM ES
Information available on Council’s website and in promotional materials
100%
Continue to work with businesses to reduce potable water consumption
Develop and deliver an engagement program to reduce water use by medium to high users
Water Management Programs Program delivered June 2014
Run the Eastern Suburbs Sustainable Business Program within Woollahra and Randwick councils
DM ES Twenty major water users audited
December 2013
Strategy: E4c Investigate and implement recycled water technologies
Deliverable Actions Sub service/ Reporting Officer Measure Target Progress Comment Water harvesting and reuse opportunities at sites with reliable harvesting potential (ie, base flow or groundwater) and high demand for reuse water identified and projects designed and undertaken to harvest and reuse water
Investigate the feasibility of and implement recycled water systems at identified Council sites
Water Management ProgramsDM ESDM POSO DM TS
Feasibility assessment complete June 2014

61 Waverley Council 2013–14 Annual Report
SECTION 3 – MEASURING OUR PROGRESS
Strategy: E5a Minimise pollutants in stormwater discharged into waterways
Deliverable Actions Sub service/ Reporting Officer Measure Target Progress Comment Pollution prevention devices installed and maintained throughout the LGA
Gross pollutant traps monitored and maintained across the LGA
Pollution Control Programs DM ESDM M&C
Reduction in amount of pollutants removed from gross pollution control devices each year compared to 2008-09 base year
5%
Stormwater Harvesting Infrastructure maintained
Maintain existing stormwater and groundwater infrastructureMonitor re-use water quality and improve quality of stormwater discharge
Water Management ProgramsDM ESDM M&C
Maintenance reports and water quality data monitored bi-monthly
100%
Water quality at key coastal sites is regularly monitored
Undertake water monitoring program
Water Management ProgramsDM ES
Dry weather monitoring program implemented
100% Targeted community environmental education and awareness program on stormwater pollution prevention undertaken
Run community education program on stormwater pollution in Waverley LGA
Environmental Education ProgramsDM ES
Program conducted January 2014
Inspections of LGA to ensure compliance with the Protection of the Environment Operations Act 1997 undertaken
Regular inspection of LGA undertaken to ensure compliance with Protection of the Environment Operations Act 1997Follow up on reported pollution incidentsInspection of building sites to ensure compliance with Protection of the Environment Operations Act 1997
Pollution Control ProgramsDM C
Change in number of POEO Act inspections undertaken compared to base year 2009-10
= or > than base year
Strategy: E5b Minimise the discharge of untreated wastewater and sewage overflows into receiving waterways
Deliverable Actions Sub service/ Reporting Officer Measure Target Progress Comment Partnerships with external organanisations to promote water quality improvement programs
Participation in OEH Beachwatch programPromote Sydney Water Sewer Fix monitoring programComplete monitoring of ocean pool quality in partnership with NSW Health
Water Management ProgramsDM ES
Number of program in which Council participates annually
At least three
Integrated water quality management program implemented in Waverley
Develop and implement a integrated water quality improvement strategy to identify appropriate mitigation stratgies
Water Management ProgramsDM ES
Strategy complete June 2014 Deferred for integration within the Green Infrastructure Masterplan.

62 Waverley Council 2013–14 Annual Report
SECTION 3 – MEASURING OUR PROGRESS
Strategy: E6a Ensure no further loss of remnant vegetation
Deliverable Actions Sub service/ Reporting Officer Measure Target Progress Comment A Tree Management Plan to maximise tree canopy cover in Waverley implemented
Plant trees over the winter months
Tree Planting Services; Tree Maintenance Services;Tree Management PlanningDM POSODM RCPP
Number of tree planted per year by Council
200 trees planted by June 2014 Implement a watering and maintenance program over the summer months
Percentage of trees planted that survive by Council
80% Update and maintain street tree data base Improve public access to tree planning information on Council’s website
Maximum time to update street tree data base after removal or new planting
Three months Due to staff changes and changes to priority of works, data base has not been updated.
Develop Tree Technical Manual TTM commenced June 2014 Significant tree register maintained and updated
Process to provide access to Significant Tree Register developed including consultation with the community
Tree Management Planning Significant Tree Register finalised Register to be completed by July 2013
Report on proposed process completed and adopted
DM RCPP June 2014 Local native seed propagation program for local plantings implemented
Collect seed from local bushland remnants.
Biodiversity Management Programs
Seed collection undertaken Annually Program propagation to provide plants for projects
DM RCCP Collected seed is propagated 5% of seed stock is propagated annually
Outcomes from Waverley flora and fauna study integrated into Council plans and policies
Integrate remnant condition surveys from Waverley flora and fauna study into Council’s Strategic Asset Management Plan
Biodiversity management ProgramsDM ESDM STEP
SAMP updated December 2013

63 Waverley Council 2013–14 Annual Report
SECTION 3 – MEASURING OUR PROGRESS
Strategy: E6b Improve the condition of existing areas of remnant vegetation
Deliverable Actions Sub service/ Reporting Officer Measure Target Progress Comment Council strategy for the protection, restoration and enhancement of remnant vegetation and habitat
Develop a Biodiversity Action Plan
Biodiversity Management ProgramsDM ES
Plan developed April 2014 Project due to be reported to Council in July 2014.
Remediation and restoration programs in Waverley including hydrological, contamination and geotechnical issues, weed management and native plantings identified and implemented
Undertake bush regeneration works to improve the quality of our existing remnants
Biodiversity Management ProgramsDM RCPP
Works completed June 2014
Waverley Street Tree Planting program implemented
Plant trees in priority areas Tree Planting ServicesDM POSO
Number of priority areas planted per year by Council
Two Strategy: E6c Increase the quantity and quality of habitat cover on private and public properties
Deliverable Actions Sub service/ Reporting Officer Measure Target Progress Comment Encourage native plantings on public / private property in identified habitat corridors
Develop community engagement program to increase plantings of native species and decrease weed species on private property prirotising sites in areas of remnant vegetation and habitat corridors
Biodiversity Management ProgramsDM ES
Program delivered April 2014
Strategy: E7a Protect local marine biodiversity through education and enforcement
Deliverable Actions Sub service/ Reporting Officer Measure Target Progress Comment Work with Department of Environment and Climate Change and Water (DECCW) to protect local marine biodiversity
Work with Sydney Coastal Councils Group to better regulate and improve management of marine environment
Biodiversity Management ProgramsDM ES
Meetings attended 6 per year
Enforcement of marine regulations including fishing bait collection rules throughout the LGA
Regular patrols carried out along LGA sea shore to ensure compliance with marine regulationsInfringement notices issue for breaches of marine regulations
Biodiversity Management ProgramsDM C
Percentage of complaints investigated within agreed timetable
100%
Partnering with the Marine Discovery Centre to educate the community about our local marine environment
Work with Marine Discovery Centre to improve awareness of human impacts on the marine environment
Biodiversity Management ProgramsDM ES
Program implemented May 2014

64 Waverley Council 2013–14 Annual Report
SECTION 3 – MEASURING OUR PROGRESS
Strategy: E8a Encourage and support community involvement in our environmental program
Deliverable Actions Sub service/ Reporting Officer Measure Target Progress Comment Communication and awareness activities on Council’s sustainability program rolled out
Develop an internal sustainability program for Council staff to improve awareness of Environmental Action Plan
Environmental Education ProgramsDM ES
Program developed February 2014
Coordination and support to the Eastern Suburbs Schools Environment Network so local teachers, parents, and students have the opportunity share experiences and increase their skills and knowledge
Coordinate the Eastern Suburbs Schools Environment Network
Environmental Education ProgramsDM ES
Meetings with schools held quarterly
100%
Work with local childcare centres to improve environmental skills and knowledge and deliver environmental outcomes
Implement the SSROC Little Green Steps Program at Waverley, Gardiner and Bronte Childcare Centres
Environmental Education ProgramsDM ES
Number of environmental initiatives implemented at each childcare centre
At least two
A Waverley Council Sustainable Schools Program
Implement Council’s Sustainable Schools Program
Environmental Education Programs
Percentage of schools in LGA participating
75% Run Council’s Sustainable Schools Grants program
DM ESDM RCCS
Bi-Annual grants program completed
February 2014August 2014
Strategy: E8b Conduct engagement programs that encourage positive environmental behaviour change
Deliverable Actions Sub service/ Reporting Officer Measure Target Progress Comment A environmental workshop program so residents can gain the skills and tools required to undertake positive environmental behaviours
Run community Greenwave workshop program to improve community behaviours
Environmental Education ProgramsDM ES
Number of residents participating
400
A lecture and activity series developed so residents can continue to be informed and engaged in debates around current environmental issues
Run community Green Brains program to improve community behaviours
Environmental Education ProgramsDM ES
Annual Green Brains program held
October 2013
A Summer Activities Program so residents can gain a greater appreciation and understanding of the coastal environment
Coordinate Council’s Summer Activities Program
Environmental Education ProgramsDM ES
2011-12 program completed February 2014

65 Waverley Council 2013–14 Annual Report
SECTION 3 – MEASURING OUR PROGRESS
Sustainable GovernanceThis quadrant refers to practices, policies and procedures that aid in the efficiency, transparency and accountability of Council operations. They ensure we’re governed well – codes of conduct for staff and councillors, financial, asset and information management, risk and safety, organisational development, procurement policies, customer service charters and standards, community engagement and integrated planning. It represents the ‘governance’ component of the quadruple bottom line.
Directions
G1 Inspiring community leadership is achieved through decision making processes that are open, transparent, corruption resistant and based on sound integrated planning.
G2 Our community is actively engaged in well-informed decision processes.
G3 Services are accessible provided in a professional, friendly and timely manner.
G4 Coordinated, efficient and effective services are delivered through the most appropriate agencies and partnerships .
G5 Waverley is financially sustainable with the revenue and resources required to support implementation of the community’s plans and to provide the infrastructure performance and services our community needs.
G6 Waverley assets are well maintained for their current purpose and for future generations.
G7 In service delivery sound safety and risk management practices are maintained to protect the community and service agency staff.
G8 Community information assets are well secured and managed in an accessible way.
G9 A committed and adaptable workforce governed by good leadership makes a strong contribution to achieving the community vision.

66 Waverley Council 2013–14 Annual Report
SECTION 3 – MEASURING OUR PROGRESS
Strategy: G1a Develop and maintain a framework of plans and policies that ensures open and transparent operations that facilitate equitable benefit sharing and progress towards sustainability
Deliverable Actions Sub service/ Reporting Officer Measure Target Progress Comment Significant governance policies developed and existing policies reviewed regularly and access to Council’s policy register provided
Assess need for new policies and develop as need identified
Governance All identified governance policies reviewed at least every three years
Policies for review 2013-14• Councillor’s Expenses and
Facilities - November 2013
Develop a policy review program for all governance policies
DM G&IP • Code of Meeting Practice – August 2013 Rescheduled for completion by
June 2015Undertake policy reviews • Internal Reporting Policy &
Investigation Process Policy – July 2013
Regularly review policies available on Council’s website to ensure currency
• Petitions Policy – July 2013 Rescheduled for completion by June 2015
• Records Management Policy – August 2013 Rescheduled for completion by
June 2015• Statement of Business Ethics –
April 2014 All significant Council policies available on Council’s website
100% A suite of integrated corporate plans that meet legislative requirements developed and maintained
Ensure alignment of annual Operational Plan, business plans, budgets and other new plans with Directions and Strategies from the Community Strategic Plan
Long Term Integrated Planning and Consultation
Community strategic plan revised every four years
June 2017
Review Community Strategic Plan, Resourcing Strategy as required
Director C&TSDMG&IP
Strategic asset management plan, environmental action plan, workforce plan and long term financial plan revised regularly
LTFP annuallySAMP June 2017EAP June 2017WFP June 2017
Develop a Delivery Program for each new CouncilDevelop an annual Operational Plan for adoption by Council annually
Delivery Program and Operational Plan adopted by Council
Operational Plan – annuallyDelivery Program – June 2017
Regular reporting to Council on progress with implementation of integrated corporate plans
Prepare reports on progress with Delivery Program deliverablesReport to Council on progress every six months
Long Term Integrated Planning and Consultation
Six monthly reports provided to Council on progress with Delivery Program
100%
Report to outgoing Council on quadruple bottom line outcomes
Director C&TSDMG&IP
Report to outgoing Council Council report - June 2016High standard document for community – September 2016

67 Waverley Council 2013–14 Annual Report
SECTION 3 – MEASURING OUR PROGRESS
Strategy: G1b Promote and embed good governance and corruption prevention practices in operational activities
Deliverable Actions Sub service/ Reporting Officer Measure Target Progress Comment Regular ethics and Code of Conduct training provided for Councillors and staff
Provide ethics and Code of Conduct training to Councillors
Governance Number of ethics and Code of Conduct training events provided annually to Councillors
Two Provide ethics and EEO training to all new employees
DM G&IPDM HR/OD
Percentage of new employees who undertake ethics and EEO training within three months of commencement
90%
Provide EEO refresher training to all existing employees
Percentage of staff who complete refresher training every three years
90% Internal audit function supported and operating effectively and efficiently
Implement internal audit program
Governance Internal audit program adopted and implemented
Annually Provide support to Audit Committee
GMUDM G&IP
Support provided 100% Review internal audit program Program reviewed and adopted Annually Audit Committee Report to Council
Report adopted by Council Bi-annually Audit Committee meetings are conducted regularly
Meetings held to adopted schedule
Five per year Strategy: G1c Our leaders advocate on our behalf to promote our area’s interests and win resources
Deliverable Actions Sub service/ Reporting Officer Measure Target Progress Comment Mayor’s role in advocating the provision of resources for the Waverley local government area
Attendance at inter-government activities
MGMU Number of inter-government activities attended per year
At least 2 per year Regional collaboration/advocacy undertaken by the Mayoral Office
Regional collaboration/advocacy activities undertaken per year
At least 2 per year
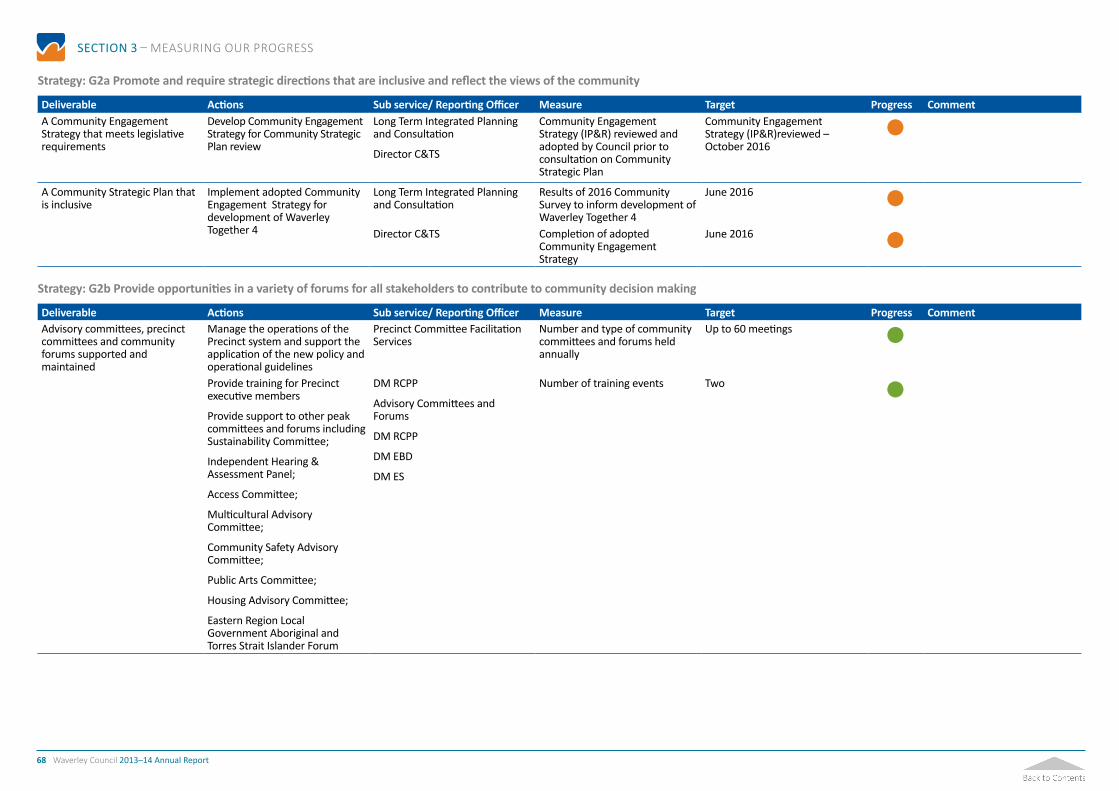
68 Waverley Council 2013–14 Annual Report
SECTION 3 – MEASURING OUR PROGRESS
Strategy: G2a Promote and require strategic directions that are inclusive and reflect the views of the community
Deliverable Actions Sub service/ Reporting Officer Measure Target Progress Comment A Community Engagement Strategy that meets legislative requirements
Develop Community Engagement Strategy for Community Strategic Plan review
Long Term Integrated Planning and Consultation
Director C&TS
Community Engagement Strategy (IP&R) reviewed and adopted by Council prior to consultation on Community Strategic Plan
Community Engagement Strategy (IP&R)reviewed – October 2016
A Community Strategic Plan that is inclusive
Implement adopted Community Engagement Strategy for development of Waverley Together 4
Long Term Integrated Planning and Consultation
Results of 2016 Community Survey to inform development of Waverley Together 4
June 2016 Director C&TS Completion of adopted
Community Engagement Strategy
June 2016
Strategy: G2b Provide opportunities in a variety of forums for all stakeholders to contribute to community decision making
Deliverable Actions Sub service/ Reporting Officer Measure Target Progress Comment Advisory committees, precinct committees and community forums supported and maintained
Manage the operations of the Precinct system and support the application of the new policy and operational guidelines
Precinct Committee Facilitation Services
Number and type of community committees and forums held annually
Up to 60 meetings
Provide training for Precinct executive members
Provide support to other peak committees and forums including Sustainability Committee;
Independent Hearing & Assessment Panel;
Access Committee;
Multicultural Advisory Committee;
Community Safety Advisory Committee;
Public Arts Committee;
Housing Advisory Committee;
Eastern Region Local Government Aboriginal and Torres Strait Islander Forum
DM RCPP
Advisory Committees and Forums
DM RCPP
DM EBD
DM ES
Number of training events Two

69 Waverley Council 2013–14 Annual Report
SECTION 3 – MEASURING OUR PROGRESS
Deliverable Actions Sub service/ Reporting Officer Measure Target Progress Comment A website that supports community comment and engagement and includes a ‘Have a Say’ portal
Place draft policy and plans on website for community comment during exhibition period
ALL Percentage of draft policy and plans placed on website
100% Promote consultation events through ‘Have a Say’ portal
MGMU Percentage of consultation events posted on website
100% Place Precinct agenda and minutes on website
Advisory committees and Forums DM RCPP
Percentage of minutes and agendas on website
100%
Strategy: G2c Promote and advocate communications that are targeted, accessible and clearly branded
Deliverable Actions Sub service/ Reporting Officer Measure Target Progress Comment A regular professionally produced and interesting community newsletter
Theme identified and material collected for quarterly community newsletterNewsletter produced and distributed
MGMUMGMU
Percentage increase in number of respondents that report receiving and reading Council’s community newsletter
Benchmarking exercise to be undertaken Benchmarking to be
undertaken
Council’s Communications Plan & Community Engagement Strategy developed and implemented
Development and implementation of the Communications Plan and Community Engagement Strategy
MGMU Communications Plan and Community Engagement Strategy developed
June 2014
Communication provided in different formats and community languages including provision of language aide scheme and access to Telephone Interpreter Service (TIS)
Provide a language aide service Multicultural Services Number of languages aides supported
Seven Support access to the Telephone Interpreter Service
DM RCPP Number of promotions and feedback sessions with targeted staff
Two Social media and other communications channels improved to maximise the effectiveness of two-way communications between Council and the community, and to enhance service satisfaction.
Development and monitoring of social media sites by Council
MGMU Usage levels of Council social media sites in web reports
Quarterly

70 Waverley Council 2013–14 Annual Report
SECTION 3 – MEASURING OUR PROGRESS
Strategy: G3a Promote and advocate systems and procedures that support good customer service
Deliverable Actions Sub service/ Reporting Officer Measure Target Progress Comment Customer service training provided to staff
Provide customer service training to all new staff
Human Resources Percentage of new staff trained in customer service within three months of joining Council
90% Provide customer service refresher training to all existing staff
DM HR/OD Percentage of existing staff that complete refresher training every three years
90% Training in systems and processes that support customer service provided to identified staff
Undertake a skills assessment of identified staff
Develop training programs on customer service systems and processes
Human Resources
DM HR/OD
Percentage of identified staff trained in customer service systems and processes compared to number that need to be trained
100%
Deliver training programs on customer service systems and processes
Investigate & implement customer centric customer request management system that will allow monitoring of Council service standards and promote improved customer responsiveness
DM LCS System implemented as per agreed timeline
June 2014
Business process and information systems enhanced in accordance with the Business and Information Systems Steering Committee plan
Business and Information Systems Plan developed
Dir C&TS Percentage of activities in the Business and Information Systems Plan implemented annually
100%
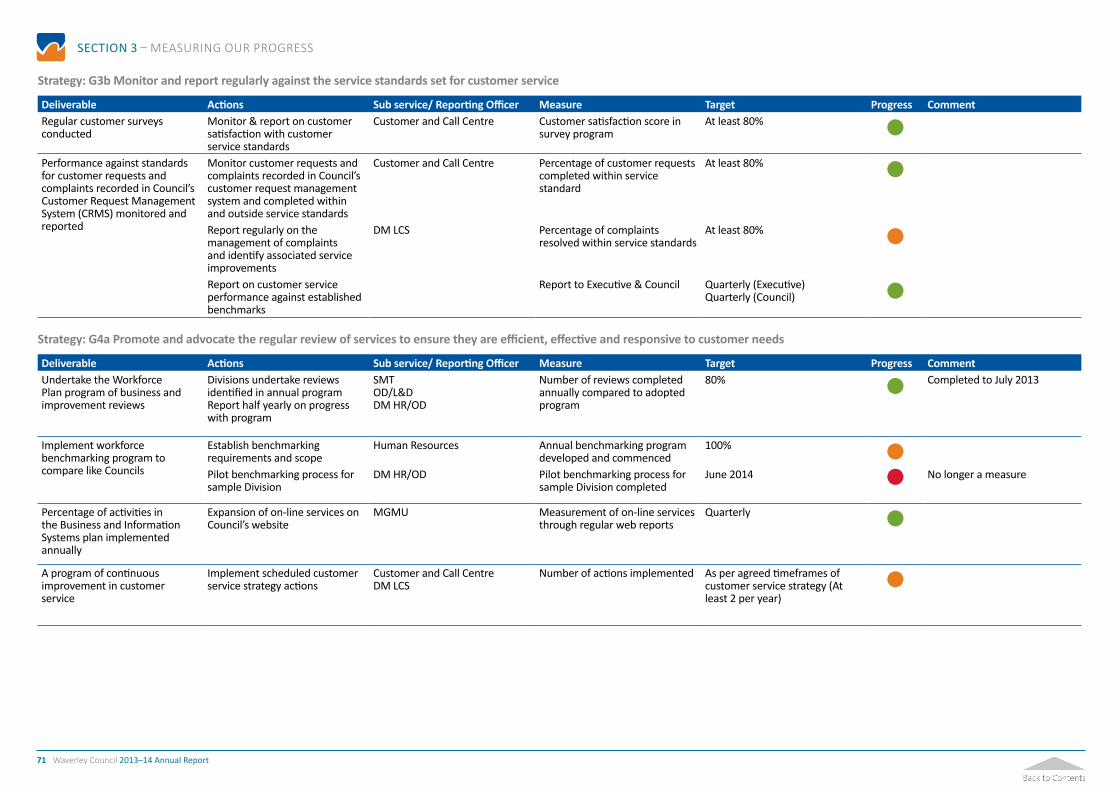
71 Waverley Council 2013–14 Annual Report
SECTION 3 – MEASURING OUR PROGRESS
Strategy: G3b Monitor and report regularly against the service standards set for customer service
Deliverable Actions Sub service/ Reporting Officer Measure Target Progress Comment Regular customer surveys conducted
Monitor & report on customer satisfaction with customer service standards
Customer and Call Centre Customer satisfaction score in survey program
At least 80% Performance against standards for customer requests and complaints recorded in Council’s Customer Request Management System (CRMS) monitored and reported
Monitor customer requests and complaints recorded in Council’s customer request management system and completed within and outside service standards
Customer and Call Centre Percentage of customer requests completed within service standard
At least 80%
Report regularly on the management of complaints and identify associated service improvements
DM LCS Percentage of complaints resolved within service standards
At least 80%
Report on customer service performance against established benchmarks
Report to Executive & Council Quarterly (Executive)Quarterly (Council)
Strategy: G4a Promote and advocate the regular review of services to ensure they are efficient, effective and responsive to customer needs
Deliverable Actions Sub service/ Reporting Officer Measure Target Progress Comment Undertake the Workforce Plan program of business and improvement reviews
Divisions undertake reviews identified in annual programReport half yearly on progress with program
SMTOD/L&DDM HR/OD
Number of reviews completed annually compared to adopted program
80% Completed to July 2013
Implement workforce benchmarking program to compare like Councils
Establish benchmarking requirements and scope
Human Resources Annual benchmarking program developed and commenced
100% Pilot benchmarking process for sample Division
DM HR/OD Pilot benchmarking process for sample Division completed
June 2014 No longer a measure
Percentage of activities in the Business and Information Systems plan implemented annually
Expansion of on-line services on Council’s website
MGMU Measurement of on-line services through regular web reports
Quarterly
A program of continuous improvement in customer service
Implement scheduled customer service strategy actions
Customer and Call CentreDM LCS
Number of actions implemented As per agreed timeframes of customer service strategy (At least 2 per year)

72 Waverley Council 2013–14 Annual Report
SECTION 3 – MEASURING OUR PROGRESS
Strategy: G4b Provide a range of efficient and effective corporate support services
Deliverable Actions Sub service/ Reporting Officer Measure Target Progress Comment Professional and timely support and assistance to Councillors and meetings of Council and Council committees
Provide agenda and minutes for meetings of Council and Council’s standing committees
Provide staff for meetings of Council and Council’s standing committees
Councillor SupportGovernance
Percentage of minutes and agenda for Council and Council committees meet service standards set
95%
Provide support to Councillors to enable them to effectively carry out their official duties
Provide assistance and advice to Councillors on governance matters
DM G&IP Percentage of requests from Councillors completed within 7 days of receipt
95%
Council’s vehicle fleet and plant maintained
Manage Council’s vehicle fleet and equipment including fleet and equipment replacement and disposal
Fleet Management Percentage of Council’s vehicle fleet and plant available for use daily
90%
Provide repairs and servicing for Council’s vehicle fleet and equipment
DM B&S Fleet whole of life costs, downtime costs, maintenance records and repair times
Equal to Industry Standards Computer and communications network availability ensured
Provide a computer network that supports the work of Council
Maintain Council’s computer network
IT and Telecommunications Computer network availability (excluding planned downtime)
95%
Provide a communications network that supports the work of Council
Maintain Council’s communications network
DM FISS Phone system availability (excluding planned downtime)
95%
An efficient and effective payroll service
Produce weekly payroll and pay staff
Human Resources Staff paid on time 100% Process information including timesheets and leave forms
DM HR/OD Staff paid accurately 98% Efficient and effective corporate procurement services
Coordinate tendering across Council
Provide advice on purchasing
Undertake audits of compliance with Council’s purchasing policy
PurchasingDM FISS
Number of audits of purchasing conducted annually
At least 12
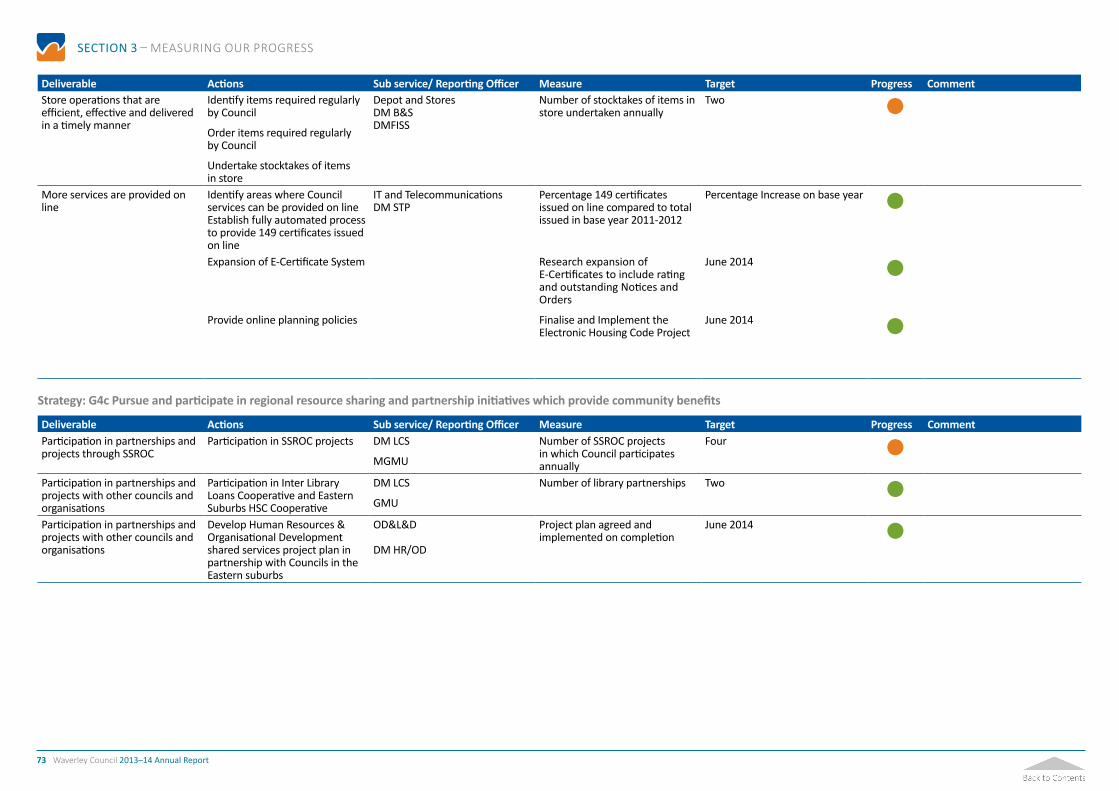
73 Waverley Council 2013–14 Annual Report
SECTION 3 – MEASURING OUR PROGRESS
Deliverable Actions Sub service/ Reporting Officer Measure Target Progress Comment Store operations that are efficient, effective and delivered in a timely manner
Identify items required regularly by Council
Order items required regularly by Council
Undertake stocktakes of items in store
Depot and StoresDM B&SDMFISS
Number of stocktakes of items in store undertaken annually
Two
More services are provided on line
Identify areas where Council services can be provided on lineEstablish fully automated process to provide 149 certificates issued on line
IT and TelecommunicationsDM STP
Percentage 149 certificates issued on line compared to total issued in base year 2011-2012
Percentage Increase on base year
Expansion of E-Certificate System Research expansion of E-Certificates to include rating and outstanding Notices and Orders
June 2014
Provide online planning policies Finalise and Implement the Electronic Housing Code Project
June 2014
Strategy: G4c Pursue and participate in regional resource sharing and partnership initiatives which provide community benefits
Deliverable Actions Sub service/ Reporting Officer Measure Target Progress Comment Participation in partnerships and projects through SSROC
Participation in SSROC projects DM LCS
MGMU
Number of SSROC projects in which Council participates annually
Four Participation in partnerships and projects with other councils and organisations
Participation in Inter Library Loans Cooperative and Eastern Suburbs HSC Cooperative
DM LCS
GMU
Number of library partnerships Two Participation in partnerships and projects with other councils and organisations
Develop Human Resources & Organisational Development shared services project plan in partnership with Councils in the Eastern suburbs
OD&L&D
DM HR/OD
Project plan agreed and implemented on completion
June 2014

74 Waverley Council 2013–14 Annual Report
SECTION 3 – MEASURING OUR PROGRESS
Strategy: G4d Actively engage in industry continuous improvement and reform with government and private sector partners to seek long term community benefit
Deliverable Actions Sub service/ Reporting Officer Measure Target Progress Comment Development of Strategic Service Management Planning
Trial the development of case study Strategic Service Management Plans on a progressive basis
Dir C&TS Number of Strategic Service Management Plans developed per year
At least 1 per year
Strategy: G5a Promote and advocate the provision of financial reporting systems in an accurate, timely, transparent and honest manner to ensure sustainability of public assets and resources
Deliverable Actions Sub service/ Reporting Officer Measure Target Progress Comment Financial advice and coordination to ensure Council meets overall budget performance targets provided
Manage Council’s financial performance to achieve targets set
Financial Management Annual budget targets met or exceeded
100% Conduct and report on quarterly reviews of budget performance
DM FISS Number of green lights on Local Government Finance Health Check Indicators
At least seven Ensure year end accounts are completed
Annual financial audit completed and reported on time
October annually Issue rates notices quarterly and collect rates levied
Rate notices issued in accordance with legislative timetable
100% Achieve a return on Council’s cash investments
Rates outstanding as a percentage of rates collected
Less than 3.5% Rate of return on cash exceeds UBS Warburg AUD Bank Bill Index
100%
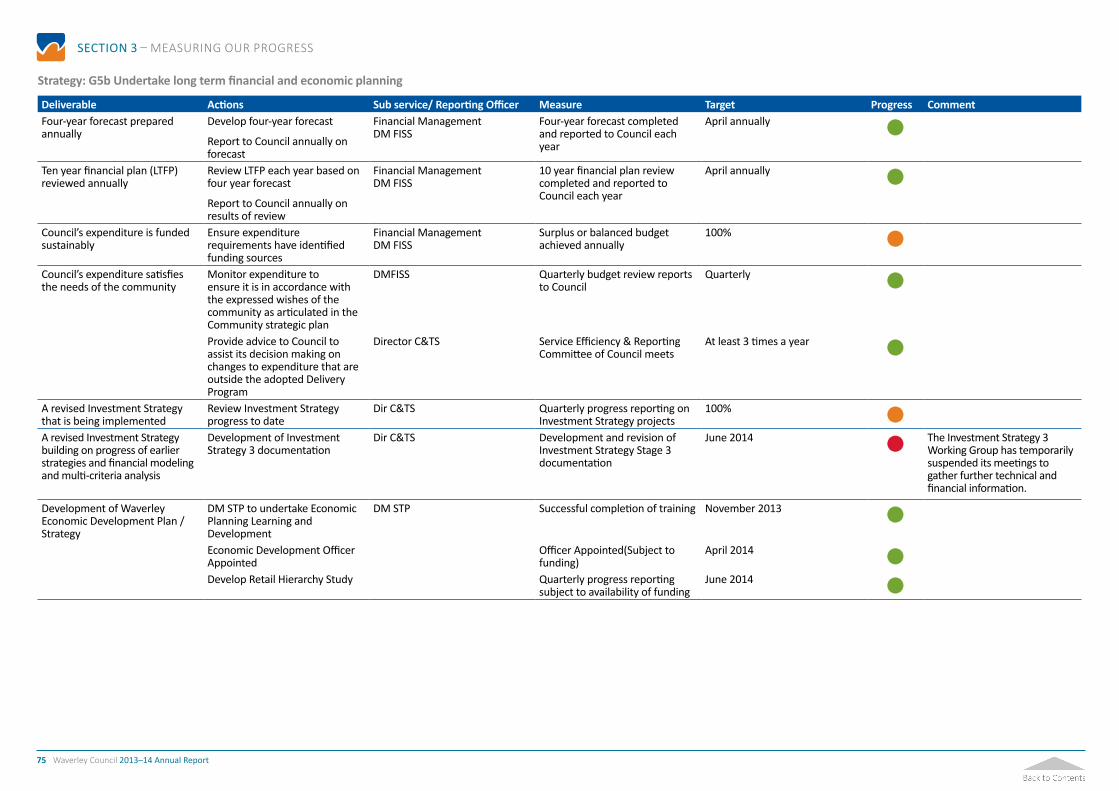
75 Waverley Council 2013–14 Annual Report
SECTION 3 – MEASURING OUR PROGRESS
Strategy: G5b Undertake long term financial and economic planning
Deliverable Actions Sub service/ Reporting Officer Measure Target Progress Comment Four-year forecast prepared annually
Develop four-year forecast
Report to Council annually on forecast
Financial ManagementDM FISS
Four-year forecast completed and reported to Council each year
April annually Ten year financial plan (LTFP) reviewed annually
Review LTFP each year based on four year forecast
Report to Council annually on results of review
Financial ManagementDM FISS
10 year financial plan review completed and reported to Council each year
April annually
Council’s expenditure is funded sustainably
Ensure expenditure requirements have identified funding sources
Financial ManagementDM FISS
Surplus or balanced budget achieved annually
100% Council’s expenditure satisfies the needs of the community
Monitor expenditure to ensure it is in accordance with the expressed wishes of the community as articulated in the Community strategic plan
DMFISS Quarterly budget review reports to Council
Quarterly
Provide advice to Council to assist its decision making on changes to expenditure that are outside the adopted Delivery Program
Director C&TS Service Efficiency & Reporting Committee of Council meets
At least 3 times a year
A revised Investment Strategy that is being implemented
Review Investment Strategy progress to date
Dir C&TS Quarterly progress reporting on Investment Strategy projects
100% A revised Investment Strategy building on progress of earlier strategies and financial modeling and multi-criteria analysis
Development of Investment Strategy 3 documentation
Dir C&TS Development and revision of Investment Strategy Stage 3 documentation
June 2014 The Investment Strategy 3 Working Group has temporarily suspended its meetings to gather further technical and financial information.
Development of Waverley Economic Development Plan / Strategy
DM STP to undertake Economic Planning Learning and Development
DM STP Successful completion of training November 2013 Economic Development Officer Appointed
Officer Appointed(Subject to funding)
April 2014 Develop Retail Hierarchy Study Quarterly progress reporting
subject to availability of fundingJune 2014

76 Waverley Council 2013–14 Annual Report
SECTION 3 – MEASURING OUR PROGRESS
Strategy: G5c Promote the establishment and maintenance of commercial business operations that contribute to Waverley’s financial sustainability
Deliverable Actions Sub service/ Reporting Officer Measure Target Progress Comment Budgeted financial performance for all commercial leases met or exceeded
Manage the leasing Council’s commercial property portfolio
Property Management
Senior Facilities Manager
Performance of Council’s business activities against budget targets
=/>budgeted financial performance for all commercial leases
Budgeted financial performance for Cemetery business operations met or exceeded
Manage Council’s cemetery business unit
Waverley and South Head Cemetery Services
Cemetery Manager
Performance of Council’s business activities against budget targets
=/>budgeted financial performance for cemetery business operations
Budgeted financial performance for Council car park business operations met or exceeded
Manage Council’s car parks Off Street Parking Services
Parking Business Manager
Performance of Council’s business activities against budget targets
=/>budgeted financial performance for Council car parks operations
Budgeted financial performance for commercial waste collection and recycling service met or exceeded
Manage Council’s commercial waste and recycling service
Commercial Waste Services
DM B&S
Performance of Council’s business activities against budget targets
=/>budgeted financial performance for commercial waste operations
Strategy: G6a Regularly revise Council’s Strategic Asset Management Plans and integrate with financial planning processes
Deliverable Actions Sub service/ Reporting Officer Measure Target Progress Comment Cost effective Strategic Asset Management Plans (SAMPs) that are compliant with legislative requirements
Updated assessment of assets incorporated into preparation of SAMP4
Asset Management Services
DM TS
Report on assets during term of Council
April 2016
Long Term Financial Plans (LTFPs) that reflect the full assessed cost of adopted Asset Management Plans
Incorporate asset management funding assessments into 4 year Delivery Program and 10 year financial plan (LTFP)
Report to Council at least annually on asset management funding
Financial Management;
Asset Management Services
DM FISS
DM TS
Asset maintenance and renewal estimates are shown in Long Term Financial Plans and reported to Council each year
April annually

77 Waverley Council 2013–14 Annual Report
SECTION 3 – MEASURING OUR PROGRESS
Strategy: G6b Implement adopted Asset Management Plans
Deliverable Actions Sub service/ Reporting Officer Measure Target Progress Comment A program of capital works developed and implemented
Capital works program developed
Capital Works Program Planning Capitol works program adopted by Council
June 2014 Adopted and funded capital works program implemented
DM TS Percentage of adopted projects delivered within approved budget as amended by Council in quarterly reviews
100%
Progress with capital works program reported to Council quarterly
Percentage of adopted projects delivered on time
80% An annual asset maintenance program
Annual asset maintenance program developed
Adopted and funded asset maintenance program implemented
Asset Management Planning;
Asset Design Services
DM TS
DM BSP
Finished cost and time to complete compared to agreed program, budget and timetable
80% of program cost within + or - 10% of agreed budget and completed within 6 months of agreed timetable
Delivery of annual maintenance program
Progress with annual asset maintenance program reported to Council quarterly
Kerb and Gutter Construction Grant (Urban Local Roads)
Kerb and Gutter Construction
Roads Construction & Upgrades
Stormwater drainage construction & upgrades
The proportion of assets in Condition Ratings 1, 2 and 3
Increases until adopted targets for the condition of assets in WT3 are achieved (subject to available funding)
An annual asset maintenance program
Cemetery infrastructure backlog renewals
Asset Management Planning;
Asset Design Services
The proportion of assets in Condition Ratings 1, 2 and 3
Increases until adopted targets for the condition of assets in WT3 are achieved (subject to available funding)
Deferred pending outcomes from Waverley Cemetery Vision Working Group.
Public toilets upgrade DM TS
DM M&C
DM BSP
Finished cost and time to complete compared to agreed program, budget and timetable
Cost within + or - 10% of agreed budget and completed within 6 months of agreed timetable

78 Waverley Council 2013–14 Annual Report
SECTION 3 – MEASURING OUR PROGRESS
Strategy: G6c Implement the adopted Asset Management Continuous Improvement Plan
Deliverable Actions Sub service/ Reporting Officer Measure Target Progress Comment On-track delivery of 80% of scheduled activities in the adopted Asset Management Continuous Improvement Plan each year
Progress with scheduled activities monitored quarterly
Progress against benchmarks for asset management assessed annually
Asset Management
Program Planning
DM TS
Ongoing improvement in self-assessed scores on meeting agreed Business Excellence Framework (BEF) benchmarks for asset management
Steady increase compared to SAMP3 (self assessed score between 150 –199, indicating Competence in Asset Management)
Strategy: G7a Provide a safer environment by implementing specific risk management practices
Deliverable Actions Sub service/ Reporting Officer Measure Target Progress Comment Operational risk processes and strategies developed
Development of Risk Registers to manage individual risks as per the Risk Management Framework
Risk and Insurance Management Number of Registers developed per year
At least 1 register per year
Establishing baseline key measures for public liability and insurance claims
Risk and Safety Manager Developing baseline key measures for public liability and insurance claims
June 2014 Review of Contractor Management processes across the Departments
Review and gap analysis complete
June 2014 Developing and implementing a Disaster Recovery Plan
Working groups held with significant operational sites across Council
Risk and Safety Manager Number of workshops held per annum
At least 5 Project held over to 2014 – 2015 due to IT and other systems’ review as well as to be captured within the Organisational Risk Management Project commencing April 2014
Business Continuity Committee meets on a regular basis to review and update draft Business Continuity Plans
Number of meetings per annum At least 3
Strategy: G7b Maintain safe workplaces
Deliverable Actions Sub service/ Reporting Officer Measure Target Progress Comment Number of lost time injuries and incidents reduced
Review and revise Claims and Rehabilitation Procedures and tools
Risk and Insurance Management Revision of the rehabilitation procedures and tools completed
December 2013 Monitor and report on lost time injuries, OH&S incidents and time to complete corrective actions
Risk and Safety Manager Percentage reduction in lost time injuries
5% Percentage reduction in incidents 5% Percentage of corrective actions raised that are closed
60%

79 Waverley Council 2013–14 Annual Report
SECTION 3 – MEASURING OUR PROGRESS
Strategy: G8a Promote and advocate the improved management of, and access to, information across Council
Deliverable Actions Sub service/ Reporting Officer Measure Target Progress Comment Records management and information access services provided
Maintain Council’s records management system
Provide records management services
Provide advice and training in the use of Council’s records management system
Audit and report on compliance with the use of Council’s records management system
Records and Public Information Services
DM G&IP
Percentage of staff who comply with Council’s Records Management Policy
90%
Compliance with Government Information (Public Access) and Privacy and Personal Information Protection Acts
Develop and implement program for compliance with Government Information (Public Access) Act
Provide access to information under Government Information (Public Access) Act (the GIPA Act)
Manage requests and privacy complaints under Privacy and Personal Information Protection Act (the PPIP Act)
Records and Public Information Services
DM G&IP
Percentage of applications under GIPA and PPIP Acts processed annually in accordance with legislative timeframe
100%
Effectiveness of web site monitored
Maintain Council’s web site
Monitor and report on use of web site
IT & MGMU
DM FISS
Percentage increase in number of visits to web site each year
10% Geographic information system (GIS) across Council maintained
Maintain and update Council’s geographic information (GIS) system
GIS Team Software and mapping database updates completed annually
100% Other projects have taken priority
Provide a publicly accessible digital mapping system
DM STP Increase in number of users accessing the mapping website from base year 2010-11
Increases annually

80 Waverley Council 2013–14 Annual Report
SECTION 3 – MEASURING OUR PROGRESS
Strategy: G8b Promote and advocate the provision of statutory, financial and management information and reporting on time and with a high degree of accuracy
Deliverable Actions Sub service/ Reporting Officer Measure Target Progress Comment All reports required by legislation or requested by Government departments and agencies provided
Complete Operational Plan as required by legislation
Complete and submit Annual Report by due date
Submit annual audited financial accounts to DLG by due date
Provide Companion Animal reporting as required
Governance
MGMU
DM G&IP
DM FISS
DM C
Percentage of reports required by legislation provided on time and in required format
100%
Annual reports on key council’s plans and policies completed
Report on access and equity policies in Council’s Annual Report
DMG&IP
DM RCPP
Information for Annual Report provided
September 2013
Strategy: G9a Attract and retain highly skilled employees who take pride in delivering exceptional service to achieve the community’s vision
Deliverable Actions Sub service/ Reporting Officer Measure Target Progress Comment Council’s Workforce Plan implemented
Undertake the activities scheduled in Council’s Workforce Plan
Human Resources
DM HR/OD
Percentage of activities from Workforce Plan completed annually
80% Recruitment process managed to limit the length of time to fill vacant positions
Undertake recruitment in accordance with guidelines
Monitor recruitment process to identify issues or delays that may increase time to fill vacant positions
Respond to any issues or delays identified
Human Resources
DM HR/OD
Recruitment cycle time 6 weeks or less
Work towards achieving employer of choice status
Scope requirements and undertake gap analysis to achieve employer of choice status
Prioritise key employer of choice projects in working towards the development of long-term employer of choice strategy
DM HR/OD Achievement of milestones along the path towards employer of choice status
80% Explored by HR/OD and put on hold by previous DM due to two changes in the Executive layer – not timely.

81 Waverley Council 2013–14 Annual Report
SECTION 3 – MEASURING OUR PROGRESS
Strategy: G9b Create a positive performance culture that builds skills in alignment with Council’s Mission and Values
Deliverable Actions Sub service/ Reporting Officer Measure Target Progress Comment Learning and Development (Training) Plan programs delivered
Implementation of Learning & Development Plan
Implement Learning & Development Plan
Human Resources
DM HR/OD
Percentage of scheduled components of Training Plan delivered annually
80%
Seek feedback on Plan to assist in development of next Plan
Participants satisfaction score on training evaluation
85% Program of internal customer service surveys continued
Implement annual program
Develop and implement improvement plans
Human Resources
DM HR/OD
Score achieved on internal customer service surveys compared to previous rating and overall rating before or by the 3rd re-take
Each survey has 5% improvement on previous rating
Monitor progress with improvement plans
Overall target 75% + before or by the 3rd re-take Computer services section did
not complete surveys. Business Excellence survey program with staff continued
Undertake survey
Report results
Human Resources
DM HR/OD
Score achieved on each retake of Business Excellence survey and pulse surveys
Each survey or area of focus has 5% improvement on previous rating
New leadership introducing a new survey tool
Identify possible areas of improvement
Complete pulse survey March 2014
Leadership Development Senior Management Team participate in development program
OD/L&DDM HR/OD
Improve rating in Business Excellence pulse survey for those areas who did not achieve the previous target
March 2014 New leadership introducing a new survey tool
Participation in the LGMA Mentoring Programme
Uptake in Mentees from last year 5% increase Participation in the LGMA Management Challenge
Waverley team established and complete the challenge
July 2014

82 Waverley Council 2013–14 Annual Report
SECTION 4 – MEETING OUR STATUTORY REQUIREMENTS
Waverley Council developed an Environmental Action Plan (EAP2) in 2009, which forms part of Council’s Resourcing Strategy. This Resourcing Strategy informs Waverley Together 3 and Council’s Delivery Program.
The process assumes it is not necessary to have all assets in top condition all at the same time, and there are acceptable intervals for asset renewal which will deliver both asset and financial sustainability.
The process has resulted in substantially lower assessed costs for backlog and future infrastructure renewal programs and increased community satisfaction about the levels of service they can expect and when. Because this process sets a base for the minimum investment necessary, it also allows customer choice without increasing risk that may arise from continued asset degradation.
Annual Reports since 2005/2006 have included detailed explanations of the development of the methodology and the derivation of the financial results. Prior to implementing the new method Waverley Council was reporting cost estimates of $93.2 million to bring the five biggest categories of assets to a satisfactory standard and another $8.7 million per annum to keep them there. By implementing and refining the new method progressively over five years, we are now able to report substantial drops in those estimates (demonstrated on the next page).
Environmental ACTION PLAN 2
Our Strategic Asset Management Plans (SAMP) provides a more accurate approach to assessing the cost of asset management and setting priorities for expenditure. Assets in Waverley are now rated in the SAMPs according to the following condition hierarchy:
Condition 1: Good condition
Condition 2: Minor deterioration
Condition 3: Medium deterioration
Condition 4: Major deterioration
Condition 5: Unserviceable
The methodology used to develop accurate estimates of costs to bring assets to a satisfactory standard, and keep them there, has been progressively developed since SAMP1 was released in 2006. In 2010, in recognition of this work and methodology, Waverley Council won the Federal Government’s National Award for Local Government in Asset and Financial Management.
A complete description of this method is provided in SAMPs 1-4 at www.waverley.nsw.gov.au/council/plans,_policies_and_reports
In summary, the method involves:
• Gradually building up an accurate picture of the current condition of assets and developing estimates for restoring different proportions of them to top condition in defined cycles; and then
• Checking with the community – using simple pictures – about what proportion of each asset category they really want to see in top condition at any one time.
Condition of Public Works
State of the Environment Report

83 Waverley Council 2013–14 Annual Report
SECTION 4 – MEETING OUR STATUTORY REQUIREMENTS
Asset maintenance costs reported June 2004
Asset Group Cost to bring to a satisfactory condition Cost to maintain at a satisfactory standardRoads $31,950,000 $2,555,000Footpaths $12,950,000 $1,850,000Kerbs & Gutters $5,900,000 $1,180,000Stormwater Assets $37,200,000 $1,800,000Buildings $5,235,000 $1,353,000Total $93,235,000 $8,738,000
Asset maintenance costs reported June 2014
Asset Group Cost to bring to a satisfactory condition Cost to maintain at a satisfactory standardRoads $1,852,000 $1,720,000Footpaths $8,455,000 $1,519,000Kerbs & Gutters $0 $1,519,000Stormwater Assets $0 $300,000Buildings $4,476,000 $7,298,000Total $14,783,000 $12,356,000
As shown in the above tables, much progress has been made to fill the backlog of infrastructure work required. For more information on Council asset conditions, please see the most recent Strategic Asset Management Plan (SAMP4) which can be found at www.waverley.nsw.gov.au/council/plans_policies_and_reports.

84 Waverley Council 2013–14 Annual Report
SECTION 4 – MEETING OUR STATUTORY REQUIREMENTS
In the period July 2013 to June 2014, Council spent a total of $613,816.88 on legal expenses (legal representation plus consultants) relating to planning matters under the provisions of the Environmental Planning and Assessment Act 1979. During the year, 20 new appeals were commenced in the Land and Environment Court with four appeals being discontinued. The result of the matters determined is set out below:
Land and Environment Court:
Appeals upheld with conditions .............................. 12
S34 Agreements ......................................................... 4
Appeals dismissed ...................................................... 2
Legal proceedings for debt recovery of rates and chargesIn 2013-14, Council spent $41,575.80 on legal and professional costs associated with debt recovery of rates and charges.
Land and Environment Court Class 1 Appeals to the Land and Environment Court 2013-14
Property Issue Comment
58 Queens Park Road Queens Park
Class 1 – Deemed refusal - Amended plans for ground floor extension, replace existing rear double garage, first floor addition, swimming pool and cabana
Appeal upheld with conditions
4 Bon Accord Avenue Bondi Junction
Class 1 – s96- Hardstand parking space, internal alterations & rear bi-fold doors to dwelling
Delete 2(g): The hardstand car space to Bon Accord Avenue and all associated works are not approved and are to be deleted
DBU: Approval with hardstand carspace
DCC: Deleted carspace
s34 Agreement between the parties
Beach Road Hotel
99 – 111 Glenayr Avenue Bondi Beach
Class 1 – Council’s refusal to issue a Building Certificate for alterations including timber terracing to the courtyard, timber panelling to existing fence and removal of a masonry wall
Appeal upheld
135 Newland Street Queens Park
Class 1 – Refusal - Conversion of rear lane garage and attic into secondary dwelling
DBU: Approval
DCC: Refused
Appeal upheld with conditions
Legal proceedings taken or against Council
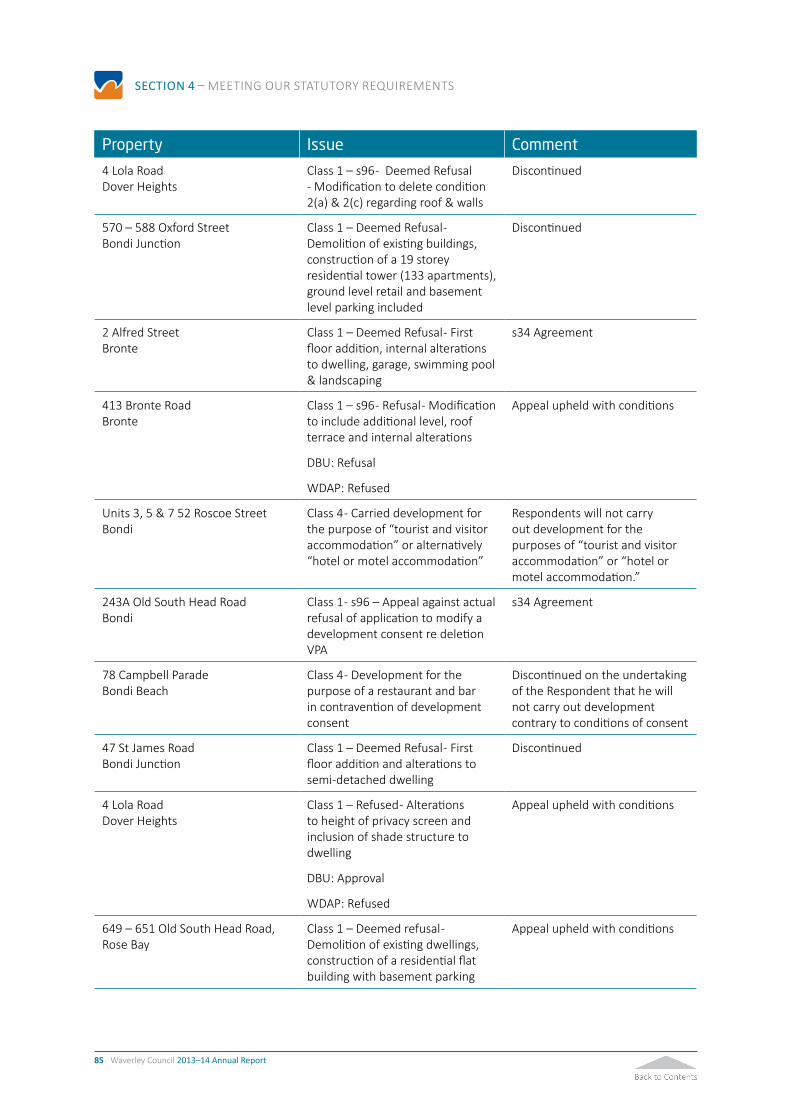
85 Waverley Council 2013–14 Annual Report
SECTION 4 – MEETING OUR STATUTORY REQUIREMENTS
Property Issue Comment
4 Lola Road Dover Heights
Class 1 – s96 - Deemed Refusal - Modification to delete condition 2(a) & 2(c) regarding roof & walls
Discontinued
570 – 588 Oxford Street Bondi Junction
Class 1 – Deemed Refusal - Demolition of existing buildings, construction of a 19 storey residential tower (133 apartments), ground level retail and basement level parking included
Discontinued
2 Alfred Street Bronte
Class 1 – Deemed Refusal - First floor addition, internal alterations to dwelling, garage, swimming pool & landscaping
s34 Agreement
413 Bronte Road Bronte
Class 1 – s96 - Refusal - Modification to include additional level, roof terrace and internal alterations
DBU: Refusal
WDAP: Refused
Appeal upheld with conditions
Units 3, 5 & 7 52 Roscoe Street Bondi
Class 4 - Carried development for the purpose of “tourist and visitor accommodation” or alternatively “hotel or motel accommodation”
Respondents will not carry out development for the purposes of “tourist and visitor accommodation” or “hotel or motel accommodation.”
243A Old South Head Road Bondi
Class 1 - s96 – Appeal against actual refusal of application to modify a development consent re deletion VPA
s34 Agreement
78 Campbell Parade Bondi Beach
Class 4 - Development for the purpose of a restaurant and bar in contravention of development consent
Discontinued on the undertaking of the Respondent that he will not carry out development contrary to conditions of consent
47 St James Road Bondi Junction
Class 1 – Deemed Refusal - First floor addition and alterations to semi-detached dwelling
Discontinued
4 Lola Road Dover Heights
Class 1 – Refused - Alterations to height of privacy screen and inclusion of shade structure to dwelling
DBU: Approval
WDAP: Refused
Appeal upheld with conditions
649 – 651 Old South Head Road, Rose Bay
Class 1 – Deemed refusal - Demolition of existing dwellings, construction of a residential flat building with basement parking
Appeal upheld with conditions

86 Waverley Council 2013–14 Annual Report
SECTION 4 – MEETING OUR STATUTORY REQUIREMENTS
Property Issue Comment
22 Boundary Street Bronte
Class 1 – Deemed Refusal - Modification to include a partial second floor, swimming pool, window reconfiguration and alterations to approved dwelling
s34(3)(b) Agreement
253 – 255 Oxford Street Bondi Junction
Class 1 – Deemed Refusal - Demolition of building, construction of a 20 storey mixed use building with affordable housing component, basement carpark and ground floor retail
Appeal upheld with conditions
22 – 26 Bronte Road Bondi Junction (AKA 6A Gray Street)
Class 1 – Refusal - Modification to approved trading hours of brothel to allow a change of closure from 12midnight to 2am, seven days a week (10/12/13: one year trial to 1am 7 days)
s34 Agreement
15 Thompson Street Tamarama
Class 1 – Deemed Refusal - Demolition of dwelling, construction of a 2 storey dwelling with double garage and swimming pool
LEC Part heard

87 Waverley Council 2013–14 Annual Report
SECTION 4 – MEETING OUR STATUTORY REQUIREMENTS
Council’s policy on expenses and the provision of facilities for use by Councillors was revised in October 2013 and came into effect in November 2013. Under the provisions of this policy, Council provides the following reimbursements and facilities to Councillors:
• Maximum reimbursement of $344 per month for communication and multimedia devices, including a $111 per month provision for data management for tablet devices and app subscriptions
• Reimbursement for registration, travel and accommodation costs to attend conferences, seminars or for other official council business
• Reimbursement of reasonable costs incurred for the care of their children, elderly, disabled or sick
• Insurance cover for personal injury, professional indemnity and public liability
• Legal indemnity to cover reasonable legal expenses in relation to proceedings arising out of their role/responsibilities as a councillor
• Reimbursement for the purchase of computer/telecommunications hardware and/or home office equipment up to a maximum retail value of $8,206 (inc. GST) per electoral term.
Councillors also receive the benefit of the following:
• Use of official stationery and access to Council’s photocopiers and fax machines to discharge their Council functions
• Word processing of official correspondence, subject to the prior approval of the General Manager
• Postage of official correspondence
• Meals on evenings of Council and Committee meetings
• Access to a shared workstation with phone and a printer at Council Chambers.
In addition to the facilities provided to Councillors, the Mayor is entitled to receive the benefit of:
• Use of a Council vehicle
• Secretarial and administrative assistance relating to the discharge of his/her civic functions
• A mobile phone.
In 2013-14, Mayoral and Councillor fees and expenses were as follows:
Councillor Fees $209,880.00 (including Deputy Mayor)
Mayoral Fees $38,160.00
Councillor Expenses and Facilities Costs $113,307.09
Councillor expenses and facilities costs included the following:
Office equipmentRental $0.00
Minor equipment $0.00
Councillor equipment $12,377.28
Landline/Internet Access $15,905.09
Computer Leases and Purchase $0.00
Maintenance $4,788.95
Total $33,071.32
Telephone callsMobile $9,302.25
Landline $4,191.71
Total $13,493.96
Other costsConferences and Seminars $12,446.91
Training Expenses $3,500.00
Interstate Visits $0.00
Overseas Visits $4,444.24
Spouse Expenses $0.00
Child Care $0.00
Travel Costs/taxi fares $9,653.89 (including vehicle running)
Legal costs $21,483
Total $51,528.04
Mayoral and Councillor Fees and Charges
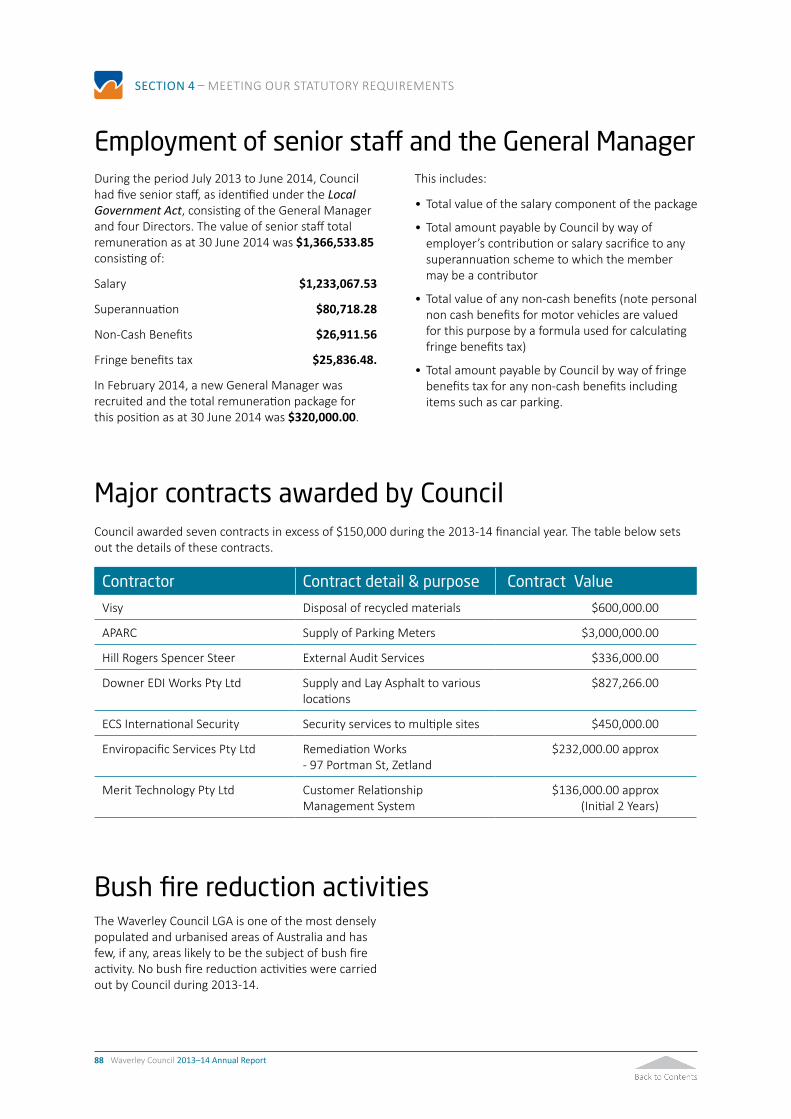
88 Waverley Council 2013–14 Annual Report
SECTION 4 – MEETING OUR STATUTORY REQUIREMENTS
During the period July 2013 to June 2014, Council had five senior staff, as identified under the Local Government Act, consisting of the General Manager and four Directors. The value of senior staff total remuneration as at 30 June 2014 was $1,366,533.85 consisting of:
Salary $1,233,067.53
Superannuation $80,718.28
Non-Cash Benefits $26,911.56
Fringe benefits tax $25,836.48.
In February 2014, a new General Manager was recruited and the total remuneration package for this position as at 30 June 2014 was $320,000.00.
This includes:
• Total value of the salary component of the package
• Total amount payable by Council by way of employer’s contribution or salary sacrifice to any superannuation scheme to which the member may be a contributor
• Total value of any non-cash benefits (note personal non cash benefits for motor vehicles are valued for this purpose by a formula used for calculating fringe benefits tax)
• Total amount payable by Council by way of fringe benefits tax for any non-cash benefits including items such as car parking.
Employment of senior staff and the General Manager
Major contracts awarded by CouncilCouncil awarded seven contracts in excess of $150,000 during the 2013-14 financial year. The table below sets out the details of these contracts.
Contractor Contract detail & purpose Contract Value
Visy Disposal of recycled materials $600,000.00
APARC Supply of Parking Meters $3,000,000.00
Hill Rogers Spencer Steer External Audit Services $336,000.00
Downer EDI Works Pty Ltd Supply and Lay Asphalt to various locations
$827,266.00
ECS International Security Security services to multiple sites $450,000.00
Enviropacific Services Pty Ltd Remediation Works - 97 Portman St, Zetland
$232,000.00 approx
Merit Technology Pty Ltd Customer Relationship Management System
$136,000.00 approx (Initial 2 Years)
The Waverley Council LGA is one of the most densely populated and urbanised areas of Australia and has few, if any, areas likely to be the subject of bush fire activity. No bush fire reduction activities were carried out by Council during 2013-14.
Bush fire reduction activities

89 Waverley Council 2013–14 Annual Report
SECTION 4 – MEETING OUR STATUTORY REQUIREMENTS
Engaging with our community – Council’s Multicultural Advisory Committee (MAC)
Community members, service providers, staff and Councillors meet quarterly to give feedback and advice on multicultural affairs. They discuss how the strategies in Council’s Cultural Diversity Policy and Action Plan can be actioned.
This year, the MAC provided input into Council’s Global Table event; discussed the Library’s 2014 Jewish Storytelling Project; supported ideas of documenting post war settlement experiences by interviewing some of our seniors’ group members and talked about the possibility of starting a non English book club.
The MAC was inspired by contributions from our guest speakers Simon Chan, local resident and recipient of the NSW Premier’s Multicultural Award and Ernie Friedlander, who spoke about his involvement in and support of B’Nai B’Rith and Harmony Walk.
Access and equity for multicultural communities – updates and highlights
Demonstrating leadership and
commitment through our Cultural
Diversity Policy
Employing a Multicultural
Community Worker
Working in partnership with
the community on programs and
events
Achieving active representation
through our Multicultural Advisory
Committee
Providing a language support program in seven languages by trained Council staff
Translating key information
Producing a service directory
Maintaining extensive community language collections in the library
In 2011, the most common countries of birth after Australia (51% of our population) were England (7.8%),
South Africa (4.3%), New Zealand 3%, Ireland (2.2%), USA (1.2%) and Israel (1.1%).
Since 2006, the proportion of our overseas born residents increased from 34.2% to 37.4%
(24,000 residents), a higher increase than experienced by Greater Sydney.
The largest proportion of overseas born residents lived in Rose Bay (45.2%).
Bondi Beach was home to the largest number (4,160) of overseas born residents.
Of the 5,050 migrants who have settled in Waverley since 2008, 65.3% were skilled
migrants, 34.3% came as family members and 0.4% were humanitarian entrants.
70.5% of us speak English at home while 29.2% speak a language other than English. Russian is
spoken by 1,630 people or 2.6% of our residents, compared to 0.4% in Greater Sydney. 1.6% speak Hebrew,
1.4% Italian, 1.3% French and 1.3% Spanish.
The three areas with the highest concentration of Russian speakers were Rose Bay (4.4%), Bondi (4.0%) and
Vaucluse (3.6%).
Arriving between 2006 and 2011, 27.6% or 6,630 of our overseas born population had been living here for only
a short while. This is nearly double the percentage of migrants who arrived in the previous 5-year period.
Waverley’s Jewish community of 10,880 residents makes up 17.1% of our total population - nearly double the proportion of Jewish people in the Eastern suburbs (9.5%) and significantly larger compared to Greater Sydney’s 0.9%.
4.3% of our residents were born in South Africa compared to 0.8% in Greater Sydney.
The suburb with the highest proportion of South African born residents was Dover Heights (14.2%)
Between 2006-11, the number of non religious persons experienced the greatest change (+4,492). 24.2% of
Waverley residents said they were not religious compared to 17.6% in Greater Sydney.
We value and support our culturally diverse community by...
Waverley LGAA snapshot of our culturally diverse community
Actioning Waverley’s Cultural Diversity Policy 2010-2014A review of our plan has shown that we are performing well on most of our targets and have progressed strategies addressing the following key objectives:
• Leadership
• Community Harmony
• Planning and Engagement
• Access and Equity
• Economic and Cultural Opportunities
We will be updating our policy in the coming year to reflect and better respond to organisational and community changes.

90 Waverley Council 2013–14 Annual Report
SECTION 4 – MEETING OUR STATUTORY REQUIREMENTS
Supporting Organisational DiversityStaff ProfileWaverley Council has a diverse workforce. 15 per cent of staff speak a language other than English as their first language.
The Equal Employment Opportunity Management Plan 2012-16Following the development of Council’s Equal Employment Opportunity Management Plan 2012-16 (EEO Plan) in 2012, various actions addressing multicultural engagement and diversity across Council’s workforce will be implemented over the next three years.
EEO and Professional Development As part of our corporate induction program, staff members participated in training on EEO, harassment and bullying prevention during 2013-14.
Managers and supervisors were given the opportunity to update their knowledge and skills of EEO and merit based selection as part of recruitment training.
Cultural awareness trainingCouncil has developed a comprehensive package of information and resources to equip new staff members with the knowledge and skills they need to show professionalism and care in their interactions with socially and culturally diverse customers. Employees participated in Council’s Working with Difference workshop which includes a two hour training component on cultural awareness.
The Working with Difference handbook was updated with information on Waverley’s demographic profile and diverse Jewish community. A calendar of multicultural days of significance was also produced to assist Council staff when planning events, programs and activities.
Communications At regular intervals during the year, the Mayor’s column was translated and placed in the Horizon (Russian) Community Newspaper. Media releases were also shared with Russian and Jewish newspapers. Key points from Waverley’s community newsletter Waverley in Focus were translated into Hungarian, Chinese, Spanish, Greek and Russian.
We continue to maintain a pool of seven accredited language aides across six languages, to improve communications with our non-English speaking customers. Our language aides can assist Waverley residents who wish to communicate in Cantonese, Mandarin, Japanese, Russian, Portuguese and Spanish.
The Community Relations Commission is currently reviewing the Community Language Allowance Scheme (CLAS) and we will await the Commission’s advice about the future of this scheme which enables Council’s staff members to be accredited as Language Aides.
The Translating and Interpreting Service (TIS) was again used by Council and requests for assistance were made for Italian, Japanese, Polish and Russian.
Waverley Housing for Older People (WHOP) Program Council’s WHOP program assists eligible older residents in our community by providing secure affordable housing in various locations. Our tenants in the program come from diverse backgrounds with 31 per cent of tenants being Russian, 10 per cent Ukrainian, and 23 per cent being of another non-English speaking background.

91 Waverley Council 2013–14 Annual Report
SECTION 4 – MEETING OUR STATUTORY REQUIREMENTS
Public ProgramsSchool Holiday Programs Council’s School Holiday program runs four times a year and attracts over 400 participants to each program. Diverse, culturally rich programs are provided for children aged 3-14 years of age including African Drumming, Brazilian Dance, South American Music and Tie-dying with Indigenous artist Helena Grieger.
External Events hireSome of the cultural groups and events Bondi Pavilion staff have supported or facilitated this year include:
• Brazilian International Capoeira grading The Sydney Tango Salon Festival
• Tibetan Monks workshops, talks, seminars and healings.
• Jewish festival ‘Shir Madness’
• Nepalese group meditation and healing ceremony ‘Sing Bowl’
Over 40 Bar and Bat Mitzvahs were also held at The Pavlion.
Waverley LibraryWaverley Library has continued to offer a varied and interesting program of activities and cultural events that appeal to all age groups.
The Library holds an impressive collection of non English resources and offers a total of 7122 ‘all language’ items, which include adult and junior books, CDs and DVDs. These cover a range of languages including French, Chinese, Russian, Japanese, Hungarian, Italian and Polish. In response to customer requests, the Library now subscribes to the Chinese newspaper Sing Tao.
EventsGlobal TableIn May 2014, Council re launched Global Table. Held in Oxford St Mall, Bondi Junction, the event attracted a huge crowd and the day was filled with multicultural food, entertainment and music from around the globe.
Harmony Week21 March marks the annual United Nations Day for the elimination of racism. This year we celebrated Harmony Day by inviting the community to enjoy Colourfest – a short film festival held at the theatrette.
Council also promoted the message Everybody Belongs in various ways and staff at the Mill Hill Centre enjoyed a Harmony Day luncheon in support of the Day’s theme.
Russian Victory DayEach year on 9 May, Waverley Council and guests gather in Waverley Park at the cenotaph to mark the anniversary of the Russian victory against Nazi Germany in World War Two. It is a significant day for the Russian community in Sydney.
ChanukahA Chanukah ceremony was held in December 2013. The Mayor invited local community leaders and members of the Jewish community to celebrate this important day with us.
Festival of the WindsThe skies came alive in September 2013 with hundreds of kites of all shapes and sizes from local and international kite-makers and flyers. This event attracted over 40,000 people and was complimented by a dynamic multicultural entertainment program in the Bondi Pavilion Courtyard Amphitheatre, including groups from Mongolia, Greece, Indonesia, Sri Lanka, Africa and Indigenous Australia. As well as music and dance, multicultural foods were on offer from from Turkey, Mexico, Germany, Portugal, China, Malaysia and France.

92 Waverley Council 2013–14 Annual Report
SECTION 4 – MEETING OUR STATUTORY REQUIREMENTS
Harmony Day is about celebrating diversity, reflecting on Australian society, sharing stories and welcoming new faces. Waverley Council will be showing six short captivating films focusing on migrant stories of social inclusion and identity. Book your free tickets now at eventbrite.com.au or call 9386 7777.
Multicultural Short Film Festival
Harmony Day COLOURFEST
FREE community event
Waverley Library – more than just books!32–48 Denison Street Bondi Junction NSW 2022 | Telephone 9386 7777
Email [email protected] | www.waverley.nsw.gov.au/library
Waverley Library TheateretteFriday 21 March | 6pm
Waverley Council’s Multicultural Advisory Committee presents six short films
Colourfest Short Film Festival
Chanukah Russian Victory Day
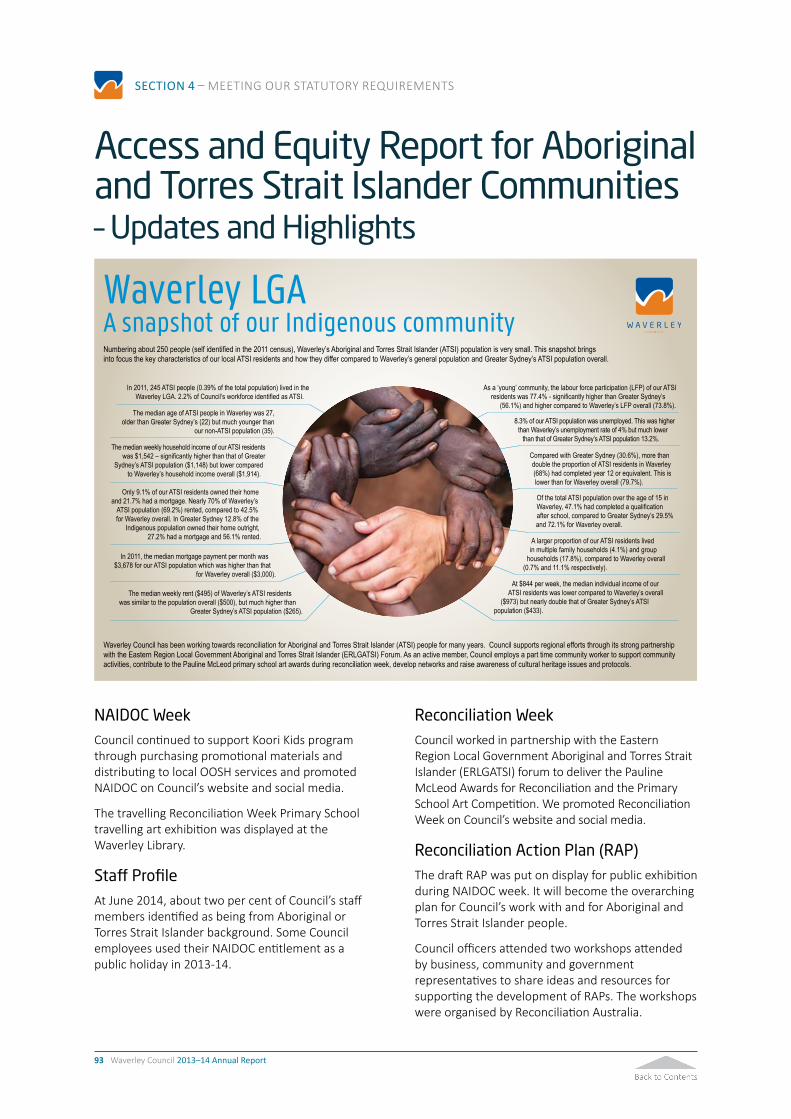
93 Waverley Council 2013–14 Annual Report
SECTION 4 – MEETING OUR STATUTORY REQUIREMENTS
NAIDOC Week Council continued to support Koori Kids program through purchasing promotional materials and distributing to local OOSH services and promoted NAIDOC on Council’s website and social media.
The travelling Reconciliation Week Primary School travelling art exhibition was displayed at the Waverley Library.
Staff ProfileAt June 2014, about two per cent of Council’s staff members identified as being from Aboriginal or Torres Strait Islander background. Some Council employees used their NAIDOC entitlement as a public holiday in 2013-14.
Reconciliation WeekCouncil worked in partnership with the Eastern Region Local Government Aboriginal and Torres Strait Islander (ERLGATSI) forum to deliver the Pauline McLeod Awards for Reconciliation and the Primary School Art Competition. We promoted Reconciliation Week on Council’s website and social media.
Reconciliation Action Plan (RAP)The draft RAP was put on display for public exhibition during NAIDOC week. It will become the overarching plan for Council’s work with and for Aboriginal and Torres Strait Islander people.
Council officers attended two workshops attended by business, community and government representatives to share ideas and resources for supporting the development of RAPs. The workshops were organised by Reconciliation Australia.
Access and Equity Report for Aboriginal and Torres Strait Islander Communities – Updates and Highlights
In 2011, 245 ATSI people (0.39% of the total population) lived in the Waverley LGA. 2.2% of Council’s workforce identified as ATSI.
The median age of ATSI people in Waverley was 27, older than Greater Sydney’s (22) but much younger than
our non-ATSI population (35).
The median weekly household income of our ATSI residents was $1,542 – significantly higher than that of Greater
Sydney’s ATSI population ($1,148) but lower compared to Waverley’s household income overall ($1,914).
Only 9.1% of our ATSI residents owned their home and 21.7% had a mortgage. Nearly 70% of Waverley’s
ATSI population (69.2%) rented, compared to 42.5% for Waverley overall. In Greater Sydney 12.8% of the
Indigenous population owned their home outright, 27.2% had a mortgage and 56.1% rented.
The median weekly rent ($495) of Waverley’s ATSI residents was similar to the population overall ($500), but much higher than
Greater Sydney’s ATSI population ($265).
In 2011, the median mortgage payment per month was $3,678 for our ATSI population which was higher than that
for Waverley overall ($3,000).
As a ‘young’ community, the labour force participation (LFP) of our ATSI residents was 77.4% - significantly higher than Greater Sydney’s
(56.1%) and higher compared to Waverley’s LFP overall (73.8%).
8.3% of our ATSI population was unemployed. This was higher than Waverley’s unemployment rate of 4% but much lower
than that of Greater Sydney’s ATSI population 13.2%.
Compared with Greater Sydney (30.6%), more than double the proportion of ATSI residents in Waverley (68%) had completed year 12 or equivalent. This is lower than for Waverley overall (79.7%).
Of the total ATSI population over the age of 15 in Waverley, 47.1% had completed a qualification after school, compared to Greater Sydney’s 29.5% and 72.1% for Waverley overall.
A larger proportion of our ATSI residents lived in multiple family households (4.1%) and group
households (17.8%), compared to Waverley overall (0.7% and 11.1% respectively).
At $844 per week, the median individual income of our ATSI residents was lower compared to Waverley’s overall
($973) but nearly double that of Greater Sydney’s ATSI population ($433).
Waverley LGAA snapshot of our Indigenous communityNumbering about 250 people (self identified in the 2011 census), Waverley’s Aboriginal and Torres Strait Islander (ATSI) population is very small. This snapshot brings into focus the key characteristics of our local ATSI residents and how they differ compared to Waverley’s general population and Greater Sydney’s ATSI population overall.
Waverley Council has been working towards reconciliation for Aboriginal and Torres Strait Islander (ATSI) people for many years. Council supports regional efforts through its strong partnership with the Eastern Region Local Government Aboriginal and Torres Strait Islander (ERLGATSI) Forum. As an active member, Council employs a part time community worker to support community activities, contribute to the Pauline McLeod primary school art awards during reconciliation week, develop networks and raise awareness of cultural heritage issues and protocols.

94 Waverley Council 2013–14 Annual Report
SECTION 4 – MEETING OUR STATUTORY REQUIREMENTS
The following contributions and donations were made by Council during 2013-14.
Community Grants
Anglesea Street Communal Garden $2,200.00
ATSI Forum $2,500.00
Australian Kite Flyers Society $8,000.00
Banksia Foundation $572.73
Bondi Beach Cottage $7,450.00
Bondi Beach Public School $3,000.00
Bondi Community Street Project $45,600.00
Bondi Food Collective $1,000.00
Bondi Golf and Diggers Club $3,000.00
Bondi Outreach Project $2,740.00
Bondi Sings Inc $2,600.00
Bondi Toy Library $23,000.00
Bondi Writers Group $1,000.00
Bronte Public School – Ramp Up Cycling $1,101.00
Caretakers Cottage $625.00
Chapel By the Sea $2,750.00
Cosmic Wheel $3,000.00
Eastern Area Tenants Services $15,600.00
Eastern Suburbs Cricket Club $5,000.00
Flickerfest Pty Ltd $3,000.00
Good Start Early Learning – Little Environmentalists $2,995.20
Junction House $36,400.00
Life Education NSW $1,500.00
Mindfields $340.00
Norman Andrews House $35,000.00
NSW Friendship Circle $3,000.00
Works carried out on private landCouncil undertook the following work on Private land during 2013-14:
• Cleaning 296 sewer chokes as a result of Council owned trees
• Removing 1375.5 square metres of graffiti from fences, gates, garage doors and walls. 375 reports were acted upon.
Contributions and Donations

95 Waverley Council 2013–14 Annual Report
SECTION 4 – MEETING OUR STATUTORY REQUIREMENTS
NSW State Emergency Service $20,105.32
Randwick / Waverley Community Transport $16,870.00
Responsible Runners $400.00
Sculpture by the Sea $15,250.00
Sculpture by the Sea – Mayoral Prize $5,000.00
Tamarama Rock Surfers $37,500.00
The Junction Neighbourhood Centre $17,108.00
Transition Bondi – Blue Starfish Workshop $2,350.00
Waterford Pre-School $2,000.00
Waverley / Randwick Philharmonic Society $3,700.00
Waverley Action for Youths Services (WAYS) $68,000.00
Waverley Art Prize – various recipients $6.500.00
Waverley Bondi Beach Band $4,000.00
Waverley Historical Society $750.00
Waverley OOSH $2,362.00
Waverley Woollahra Arts Centre $3,000.00
Waverley Youth $3,000.00
Waverley Youth Art Award (various recipients) $3,450.00
WAYS – Youth Week Program $3,000.00
Wee Care Kindergarten $1,400.00
Yeshiva Synagogue $3,000.00
Total Community Grants $425,225.75
Surf Club Grants
Bondi Surf Club $15,000.00
Bronte Surf Club $15,000.00
North Bondi Surf Club $15,000.00
Tamarama Surf Club $27,500.00
Total Surf Club Grants $72,500.00

96 Waverley Council 2013–14 Annual Report
SECTION 4 – MEETING OUR STATUTORY REQUIREMENTS
Human Resources ReportThe Equal Employment Opportunity Management Plan 2012-16During 2011-12 the Equal Employment Opportunity Management Plan 2012-16 (EEO) was adopted by Council following an extensive consultation process. The plan is required under legislation and contains initiatives to be implemented over the next three years.
In line with the integrated planning framework, the initiatives identified in the EEO Management Plan for 2012-16 will be adapted and incorporated into the Workforce Plan 2014 - 2024.
Components of the EEO Management Plan 2012-2016(a) Enhancing understanding of EEO and Discrimination Issues, and
(b) Supporting implementation of EEO in the Workplace
In 2013-2014 the following actions were undertaken to support implementation of EEO in the workplace and to ensure that managers, supervisors and employees understood the importance of EEO:
STRATEGY PROGRESS
To ensure that all new employees attend EEO Awareness Training where applicable to their role
At the end of June 2014, 27 employees at Council had completed the Working with Difference course which incorporates a two hour session on Cultural Diversity training.
Provide mandatory refresher training for all existing employees in EEO/Harassment and Bullying Prevention
At the end of June 2014, 57 employees at Council had completed refresher training in EEO/Harassment and Bullying Prevention.
To provide Council induction programs on a regular basis for all new employees, providing information on employment conditions, EEO and other important issues
Council’s induction program covering discrimination, diversity and access issues was held on the following dates:
• 10 October 2013
• 5 March 2014
Recruitment and Selection training incorporating EEO awareness
Recruitment and Selection training session held on 10 occasions incorporating EEO and discrimination awareness for Managers and Supervisors.

97 Waverley Council 2013–14 Annual Report
SECTION 4 – MEETING OUR STATUTORY REQUIREMENTS
(c) EEO reporting and access to Employment Conditions
To effectively monitor EEO implementation we need to ensure that access to conditions of employment across Council is equitable:
STRATEGY PROGRESS
All EEO data for employees to be recorded in CHRIS, when provided through the application process
Ongoing
EEO Management Plan is to report on employment status, age and income profile for all employees, as a comparison of males and females
Data indicates:
Females comprise 43 per cent of all employees at Council.
55 per cent of these female employees are in the 30-50 age group
The greatest proportion of female employees (12 per cent) of all employees are aged 30-40 years
EEO Management Plan is to report on proportion of employees who identify as being from Aboriginal and Torres Strait Islander descent and access to cultural leave
At June 2014, just under 1.9 per cent (13 employees) of Council’s workforce of 681 people identified themselves as being from Aboriginal or Torres Strait Islander background.
4 Council employees used their NAIDOC entitlement as a public holiday in the 12 months to 30 June 2014.
Literacy support to be provided whenever necessary for employees from non-English speaking backgrounds
Literacy support provided for employees from culturally and linguistically diverse backgrounds via accredited language aides and interpreters when required.
Provision of a minimum of eight child care places for children (aged zero -- three years) of Waverley Council employees
Ongoing
Where practicable, Council premises and facilities are accessible to employees with Disabilities
Ongoing
Provide reasonable adjustments to allow a person with individual needs to be accommodated in the workplace whether based on Disability or Carers or Family Responsibilities
Ongoing
All position descriptions and selection criteria to be reviewed prior to advertising to ensure they comply with EEO principles and are non-discriminatory
Ongoing
Council to provide multiple options for accessing information about positions advertised
Ongoing
Where job applicant indicates that they have a specific need prior to interview, HR Representative to facilitate reasonable adjustments to accommodate
Ongoing
Pre-employment assessments monitored to ensure appropriate assessment of reasonable adjustments considered in the application process
Ongoing

98 Waverley Council 2013–14 Annual Report
SECTION 4 – MEETING OUR STATUTORY REQUIREMENTS
STRATEGY PROGRESS
To provide accurate information to employees about access to leave for parental purposes, and their rights before, during and after pregnancy. To provide accurate information to employees about access to leave for carer responsibilities
Ongoing
The position of Garden Labourer in Waverley Park is identified as a designated Disability position.
Employee in place
(d) Number of employees at management levels split by gender as at 30 June 2014
Salary Group Management Level Male 2014 Female 2014
M to P
Q to U
Executive Team
Middle Managers
Senior Manager
Executive Team
63
19
3
63
13
2
Key human resources activities and achievements completed this reporting period include:• implementation of the first stage of Waverley
Performance policy implementation, • a new program to develop a collaborative platform
with the Unions, • the first stage of Waverley Performance branding
exercise, • preparation and implementation of the first stages
of Waverley Council’s New Directions Program• implementation of programs to manage the
relocation of employees from Zetland Depot to the new Alexandria Depot
• Waverley Performance created a Draft Workforce Plan for 2014 – 2017 which will be consulted on and finalised in early 2014 – 2015.
Statutory human resources activities including policy review and recruitment were delivered consistent with the workforce plan, associated legislation and best practice principles.
Safety & Risk Management Activities 2013 – 2014Direction: G7 - In service delivery of sound safety and risk management practices are maintained to protect the community and service agency staff
G7a Provide a safer environment by implementing specific risk management practices
G7b Maintain safe workplaces
Safety Management System
During 2012 – 2013, the Risk & Safety Team improved accessibility of Council’s Safety Management System by developing an online document controlled system within TRIM. This was created to meet the requirements of AS/NZS 4801 for Safety Management Systems and the National Audit Tool for Self Insurance. The seven Key Elements incorporating streamlined policies, procedures, tools and forms replaced an outdated paper system. This was implemented and utilised from 1 July 2013.
To ensure accessibility of the system for the various sites and workforces which had no access to TRIM, the Risk & Safety Team also created an intranet space and made the endorsed WHS policies, procedures, tools and forms available.
Nearly 400 staff participated in workshops or toolbox talks for the consultation of key policies and procedures contained within the new Safety Management System. The Executive Leadership Team endored the following:
• WHS Policy
• Injury Management Policy
• Leadership and Accountability Procedure
• Consultation and Communication Procedure
• Health and Safety Representative and Workplace Safety Officer Procedure
Human Resources activities undertaken by Council during 2013-2014

99 Waverley Council 2013–14 Annual Report
SECTION 4 – MEETING OUR STATUTORY REQUIREMENTS
Work Health and Safety InductionsAlong with improving the WHS component of the corporate induction, new employee pack documentation was created to support a more thorough site safety induction process, which includes a tailored approach by the relevant Supervisor for each new starter, with documents as follows:
• Employee WHS Guide
• Site Safety Induction Checklist
• Ergonomic Self Assessment
• Pause and Break Exercises
• Employee Safety Working Outdoors
Risk & Safety TrainingThe Risk & Safety Team worked with teams across Council in organising and/or delivering 100 training programs and initiatives to over 850 staff, including:
• Introduction to Risk Management
• First Aid & Fire Warden training and evacuation
• Working near overhead powerlines
• Construction Induction – White Card
• Blue, Yellow Red and Orange Cards for Traffic Management
• Handling Dangerous Dogs
• Mental Health in the Workplace
• Safe Work Method Statement on the job training
• Chemical Use
• Asbestos Awareness
• Safety Management System Implementation workshops
Risk Management Activities2013-2014 saw the commencement of the organisation wide project of developing and implementing an Enterprise Risk Management Framework, System and Policy which will be known as WERMS (Waverley Enterprise Risk Management System).
Though the project will be finalised in 2014 -2015 the following activities were undertaken as progress:
1. Draft Risk Management Framework and Policy created for consultation
2. Two ½ day Introduction to Risk Management training courses conducted and undertaken by 42 key stakeholders
3. TRIM records managed system created for WERMS files and archiving of all risk data.
In addition to WERMS, draft Disaster Recovery and Business Continuity Plans were collated from across the various sites. Completion of these plans is dependent on the IT Recovery Plan and the project as a whole will be consulted on and finalised in 2014 – 2015.
Injury ManagementThe most impressive results which confirm improvement in the organisation’s safety culture can be demonstrated by the considerable reduction in the Workers’ Compensation Premium. This has decreased by $1.2 million dollars since the 2011-2012 financial year.
In comparison to the 2012-2013 financial year, 2013-2014 has produced additional positive results as follows:
• number of claims have decreased by 60 per cent
• number of days lost as a whole have decreased by 73 per cent
• costs of claims have continued to decrease year on year with an additional reduction of $50k achieved this year
The total number of incidents reported increased by 135 per cent, which reflects the newly introduced Hazard and Incident Notification process, and improvement in the overall safety culture across Council.
Health & Wellbeing ProgramAs part of Council’s commitment to health and well being each month a new initiative was introduced and delivered with highlights as follows:
• 125 staff underwent blood pressure and pulse checks for Heart Health Month in August
• 23 Movember participants promoted awareness of mens’ health raising over $1,500 for Beyond Blue and the Prostate Cancer Foundation of Australia.
• 150 staff received Skin Checks for Sun Safety month in December
• 145 staff took up our annual Flu Vaccination Clinics in April
• The Risk and Safety Team and Mayoral Mavericks raised $2900 in support of Cancer Council for the Relay for Life in May.
• Since February 2014 over 120 staff took part in the 10 Week Challenge and ongoing fitness activities which included outdoor Personal Training, Yoga, Pilates, Tabata and beach fitness.

100 Waverley Council 2013–14 Annual Report
SECTION 4 – MEETING OUR STATUTORY REQUIREMENTS
External Bodies exercising Council FunctionsAt its meeting of 18 June 2013, Council formally adopted the new Waverley Development Assessment Panel and dissolved the former Development Control Committee (DCC) and the Independent Hearing & Assessment Panel (IHAP). The Panel replaces the former DCC and the IHAP, which will help streamline the planning process.
The Waverley Development Assessment Panel determines significant DAs in the Waverley LGA. This includes DAs where there are numerous objections, a conflict of interest or the development has a construction cost of $3 million or more.
The Panel is made up of a pool of planning experts, independent of Council, who meet monthly. It also means that Councillors will no longer be involved in the decision-making process for determining those DAs, allowing them more time to focus on strategic planning issues, such as the planning controls that underpin DA decisions.
The Waverley Development Assessment Panel is delegated by Council to exercise these functions.
Controlling Interests in CompaniesNIL
Partnerships, Cooperatives and Joint Ventures• Council is a member of the Southern Sydney
Regional Organisation of Councils (SSROC) and the Sydney Coastal Councils. SSROC is an association of 11 local councils in the southern area of Sydney. SSROC provides a forum for the councils to deal with issues they have in common, particularly those that cross boundaries. Key issues under consideration include planning, environment, transport, community development, sustainability, and local government management.
• Waverly Library is in a collaborative partnership with five SSROC libraries for the purchase of materials
• The Sydney Coastal Councils includes councils located on Sydney’s coastline and aims to promote co-ordination on issues relating to the urban coastal environment and waterways
• Waverley Council in conjunction with Woollahra and Randwick Councils run the Regional Ecofootprint Project which aims to deliver environmental projects within the region
• Council’s Library Services shares a document delivery van with all Libraries in the Sydney metropolitan area
• Council hosts the Eastern Region Local Government Aboriginal and Torres Strait Islander Forum, a coalition of 6 Councils, the City of Botany Bay, City of Sydney, Leichhardt, Randwick, Waverley and Woollahra
• Council has a partnership with the Uniting Church which provides a building, Norman Andrews House, through which the Church delivers services for homeless and disadvantaged people
• Waverley and Woollahra Council are in partnership to provide the State Emergency Service to the local community
• The Waverley Community Living Program (WCLP) provides independent living skills training and ‘transition’ support for adults with a mild intellectual disability. The project is funded by Waverley Council and the Department of Human Services (ADHC).
Other Regulatory InformationOverseas visits by StaffIn 2013-14 a total of $9,150.91 was spent on overseas travel for the Mayor and one Divisional Manager. On this occasion, it was to attend the World Cities Summit Mayors Forum in Signapore to give technical advice on environmental sustainability and to present on Council’s Green Infrastructure Project.

101 Waverley Council 2013–14 Annual Report
SECTION 4 – MEETING OUR STATUTORY REQUIREMENTS
The Government Information (Public Access) Act 2009 requires councils to prepare an annual report on their obligations under the Act. Set out on the following pages is a summary of Waverley Council’s access to information applications for 2013-14.
Details of the review carried out by the agency under Section 7 (3) of the Act during the reporting year and the details of any information made publicly available by the agency as a result of the review.
Under section 7 of the GIPA Act, agencies must review their programs for the release of government information to identify the kinds of information that can be made publicly available. This review must be undertaken at least once every 12 months.
Our agency’s program for the proactive release of information involves ongoing liaison with Council departments encouraging proactive release of information.
During the reporting period, we reviewed this program by an annual cross organisational communication seeking all departments to identify and release information proactively.
We released the following information proactively by regularly updating Council’s website to inform and keep the community abreast of issues that potentially may have a significant impact in the local government area as follows:
• West Oxford Street Precinct Plan, including collection of community comment
• Bondi Complete Streets Project, including collection of community comment
• Boot Factory
• Parking Meter Upgrades, including collection of community comment
• Waverley Cemetery Fence consultation, including collection of community comment
• Street Gardening Policy and guidelines, including collection of community comment
• Wellington Street Planning Proposal
• Bondi Park Fitness Station
• Tamarama Park Upgrade, including collection of community comment
• Bondi Plan of Management
• Amenities Building, Waverley Park
• South Bondi Toilet Block
• Waverley Development Control Plan Amendment 2, including collection of community comment.
• Waverley Development Control Plan Amendment 3, including collection of community comment.
• Waverley Economic Development Strategy
• Waverley Council’s Community Tenancy Policy, including collection of community comment.
• Watkins Street Conservation Area Heritage Study
• Yenda Avenue Conservation Area Heritage Study
• Waverley Light Rail Study
• Waverley Bike Plan
• Proposed Car Share Locations
• Residential Parking Scheme, including collection of community comment.
The total number of access applications received by the agency during the reporting year (including withdrawn applications but not including invalid applications)
Council received a total of 30 formal access applications (including withdrawn applications but not an invalid application) during the reporting year. Council also received 32 informal requests for information where applicants were automatically provided with the information requested.
The total number of refused applications for Schedule 1 information.
During the reporting period, our agency refused a total of 18 formal access applications because the information requested was information referred to in Schedule 1 to the GIPA Act. Of those applications, 1 was refused in full, and 17 were refused in part.
Government Information (Public Access) applications

102 Waverley Council 2013–14 Annual Report
SECTION 4 – MEETING OUR STATUTORY REQUIREMENTS
Table A: Number of applications by type of applicant and outcome*Access
granted in full
Access granted in
part
Access refused in
full
Information not held
Information already
available
Refuse to deal with
application
Refuse to confirm/
deny whether information is
held
Application withdrawn
Media 0 0 0 0 0 0 0 0Members of Parliament
0 1 1 0 0 0 0 0
Private sector business
0 2 0 0 0 0 0 0
Not for profit organisations or community groups
0 0 0 0 0 0 0 0
Members of the public (application by legal representative)
4 6 0 1 0 1 0 0
Members of the public (other)
7 8 0 0 0 0 0 0
*More than one decision can be made in respect of a particular access application. If so, a recording must be made in relation to each such decision. This also applies to Table B.
Table B: Number of applications by type of application and outcome
Access granted in full
Access granted in part
Access refused in full
Information not held
Information already
available
Refuse to deal with
application
Refuse to confirm/
deny whether information is
held
Application withdrawn
Personal information applications*
0 0 0 0 0 0 0 0
Access applications (other than personal information applications)
11 17 1 1 0 1 0 0
Access applications that are partly personal information applications and partly other
0 0 0 0 0 0 0 0
*A personal information application is an access application for personal information (as defined in clause 4 of Schedule 4 to the Act) about the applicant (the applicant being an individual).The total number of decisions in Table B should be the same as Table A.

103 Waverley Council 2013–14 Annual Report
SECTION 4 – MEETING OUR STATUTORY REQUIREMENTS
Table C: Invalid applications
Reason for invalidity Number of applications
Application does not comply with formal requirements (section 41 of the Act) 0
Application is for excluded information of the agency (section 43 of the Act) 0
Application contravenes restraint order (section 110 of the Act) 0
Total number of invalid applications received 0
Invalid applications that subsequently became valid applications 0
Amounts of Rates and Charges written off during the yearAn amount of $781,592 was written off as rates and charges during 2013-14. This included mandatory rebates of $692,449.15 (Section 575) and general rates and charges abandonment of $2,262.61 (Section 595).
Our debt recovery policy includes issuing Rate and Instalment Notices in accordance with the requirements of the Local Government Act. A reminder notice will be directed on any account with an unpaid balance after the final day for payment of the quarterly rate instalment. If the account, other than one held by an eligible pensioner, is still not finalised after the issue of the Reminder Notice a Notice of Overdue Account is sent.
Accounts with an unpaid balance, where no mutually agreed arrangement has been negotiated, are referred to the Council’s debt recovery agency. The debt recovery agency issues a Notice of Legal Action and if the account remains unpaid a Statement of Liquidated Claim is sought. For the 2013-14 financial year, Council spent $41,575.80 on legal and professional costs associated with debt recovery of rates and charges.
Compliance with and effect of Planning Agreements in force as at 30 June 2014There were no Voluntary Planning Agreements in force during 2013-14.
Activities during the year relating to enforcing and ensuring compliance with the Companion Animals Act and RegulationsDuring 2013-14 Waverley Council undertook the following activities in relation to enforcing the Companion Animal Act and Regulations.
Complaints Received:Barking Dogs 121
Animal attacks 42
Unleashed animals 48
Animals in a prohibited place 15
Infringements Issued:396 companion animal infringements were issued
Notices/Orders Issued:Nil
Seized Animals140 animals were seized
Trends in Companion Animal compliance are set out overleaf.

104 Waverley Council 2013–14 Annual Report
SECTION 4 – MEETING OUR STATUTORY REQUIREMENTS
Companion Animals Graphs
200
150
100
50
0
185 170 136 114 140 140
2008/09
2009/10
2010/11
2011/12
2012/13
2013/14
Animals siezed
200
150
100
50
0
137 146 154 124 127 121
2008/09
2009/10
2010/11
2011/12
2012/13
2013/14
Barking Dog Complaints
400
300
200
100
0
32 114 220 50 59 396
2008/09
2009/10
2010/11
2011/12
2012/13
2013/14
Infringements issued
6050403020100
39 40 38 52 41 48
2008/09
2009/10
2010/11
2011/12
2012/13
2013/14
Complaints about unleashed animals
20
10
0
9 8 16 7 6 15
2008/09
2009/10
2010/11
2011/12
2012/13
2013/14
Complaints about animalsin a prohibited place
50403020100
39 35 44 50 35 42
2008/09
2009/10
2010/11
2011/12
2012/13
2013/14
Complaints about animal attacks

105 Waverley Council 2013–14 Annual Report
SECTION 4 – MEETING OUR STATUTORY REQUIREMENTS
Protected DisclosuresThere were no public interest disclosures received by Waverley Council in 2013-14.
Council has a public interest disclosures policy in place, called the Internal Reporting Policy, which was revised in November 2013.
Council has taken the following action to ensure staff awareness responsibilities under section 6E(1)(b) of the Act:
• a revised policy was adopted to ensure compliance with all aspects of the Act
• the revised policy has been placed on Council’s intranet and internet
• briefings are provided to all new staff as part of the induction process
• work groups within the council have been briefed on the new provisions as part of staff training
• a public interest disclosures brochure is available.
Privacy and Personal Information managementCouncil adopted a revised Privacy Management Plan in June 2013 and is available on Council’s website. Three privacy management complaints were received in 2013-14.
Gift Registers InformationBoth the number and value of gifts recorded in 2013-14 decreased compared to 2012-13. In 2013-14 188 gifts were recorded with an assessed value of $3620 compared to 269 gifts with an assessed value of $4205.65 which were recorded in 2012-13.
Department Number of Gifts
Nominal Value
General Managers Unit
11 $445.00
Corporate & Technical Services
2 $65.00
Community & Recreation Services
131 $1,244.00
Planning & Environmental Services
0 $-
Public Works & Services
2 $45.00
Councillors 42 $1,821.00
TOTAL 188 $3,620.00
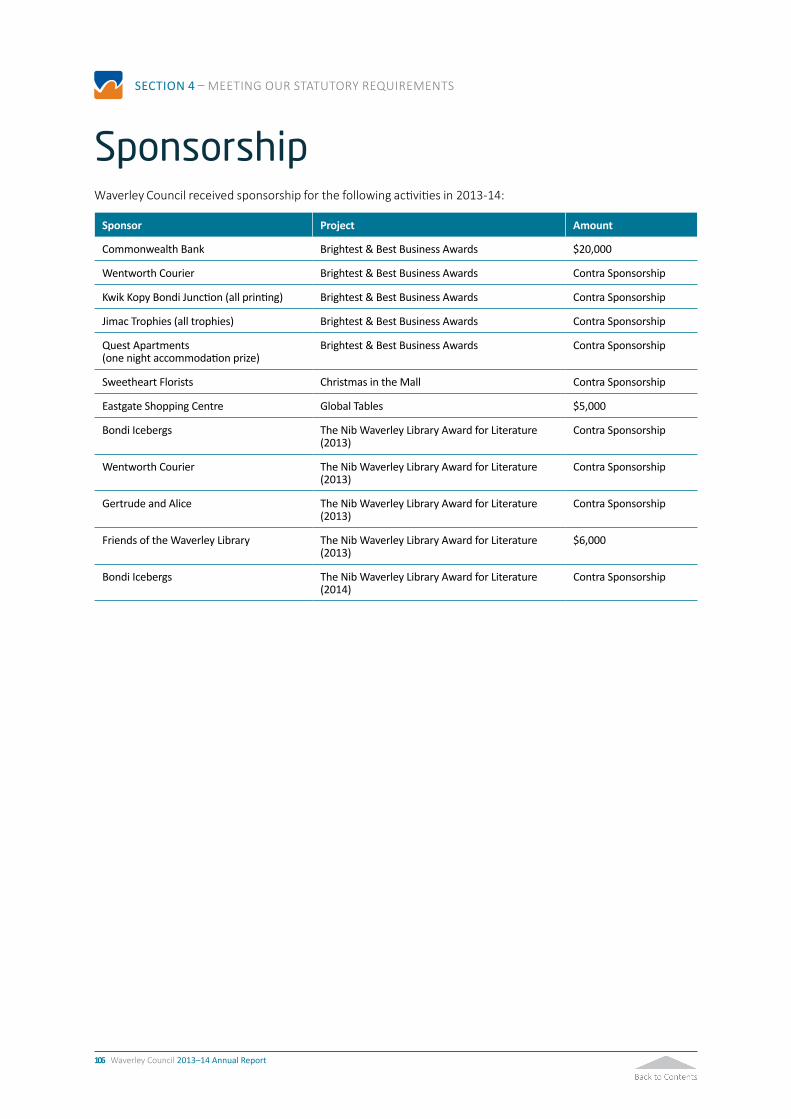
106 Waverley Council 2013–14 Annual Report
SECTION 4 – MEETING OUR STATUTORY REQUIREMENTS
SponsorshipWaverley Council received sponsorship for the following activities in 2013-14:
Sponsor Project Amount
Commonwealth Bank Brightest & Best Business Awards $20,000
Wentworth Courier Brightest & Best Business Awards Contra Sponsorship
Kwik Kopy Bondi Junction (all printing) Brightest & Best Business Awards Contra Sponsorship
Jimac Trophies (all trophies) Brightest & Best Business Awards Contra Sponsorship
Quest Apartments (one night accommodation prize)
Brightest & Best Business Awards Contra Sponsorship
Sweetheart Florists Christmas in the Mall Contra Sponsorship
Eastgate Shopping Centre Global Tables $5,000
Bondi Icebergs The Nib Waverley Library Award for Literature (2013)
Contra Sponsorship
Wentworth Courier The Nib Waverley Library Award for Literature (2013)
Contra Sponsorship
Gertrude and Alice The Nib Waverley Library Award for Literature (2013)
Contra Sponsorship
Friends of the Waverley Library The Nib Waverley Library Award for Literature (2013)
$6,000
Bondi Icebergs The Nib Waverley Library Award for Literature (2014)
Contra Sponsorship

for the financial year ending 30 June 2014
IncorporatingGeneral Purpose Financial StatementsSpecial Purpose Financial Statements
Special Schedules
Annual Financial Statements

Waverley Council GENERAL PURPOSE FINANCIAL STATEMENTS for the year ended 30 June 2014
"We are united by a common passion for ourbeautiful home between the city and the sea."

Financial Statements 2014
page 1
Waverley Council
General Purpose Financial Statements for the financial year ended 30 June 2014
Contents
1. Understanding Council's Financial Statements
2. Statement by Councillors & Management
3. Primary Financial Statements:
- Income Statement- Statement of Comprehensive Income- Statement of Financial Position- Statement of Changes in Equity- Statement of Cash Flows
4. Notes to the Financial Statements
5. Independent Auditor's Reports:
- On the Financial Statements (Sect 417 [2]) - On the Conduct of the Audit (Sect 417 [3])
Overview
(i) These financial statements are General Purpose Financial Statements and cover the consolidated operationsfor Waverley Council.
(ii) Waverley Council is a body politic of NSW, Australia - being constituted as a Local Government areaby proclamation and is duly empowered by the Local Government Act (LGA) 1993 of NSW.
Council's Statutory Charter is detailed in Paragraph 8 of the LGA and includes giving Council;
the ability to provide goods, services & facilities, and to carry out activities appropriate to the current & futureneeds of the local community and of the wider public,
the responsibility for administering regulatory requirements under the LGA and
a role in the management, improvement and development of the resources in the area.
A description of the nature of Council's operations and its principal activities are provided in Note 2(b).
(iii) All figures presented in these financial statements are presented in Australian Currency.
(iv) These financial statements were authorised for issue by the Council on 28 October 2014.Council has the power to amend and reissue these financial statements.
Page
4
67
5
2
3
8
9
8082
Financial Statements 2014_
Waverley Council Notes to the Financial Statements for the financial year ended 30 June 2014 Understanding Council's Financial Statements
page 2
Introduction Each year, individual Local Governments across NSW are required to present a set of audited financial statements to their Council & Community. What you will find in the Statements The financial statements set out the financial performance, financial position & cash flows of Council for the financial year ended 30 June 2014. The format of the financial statements is standard across all NSW Councils and complies with both the accounting & reporting requirements of Australian Accounting Standards and requirements as set down by the Office of Local Government. About the Councillor/Management Statement The financial statements must be certified by Senior staff as "presenting fairly" the Council's financial results for the year, and are required to be adopted by Council - ensuring both responsibility for & ownership of the financial statements. About the Primary Financial Statements The financial statements incorporate 5 "primary" financial statements: 1. The Income Statement
Summarises Council's financial performance for the year, listing all income & expenses. This statement also displays Council's original adopted budget to provide a comparison between what was projected and what actually occurred. 2. The Statement of Comprehensive Income
Primarily records changes in the fair values of Council's Infrastructure, Property, Plant & Equipment. 3. The Statement of Financial Position
A 30 June snapshot of Council's financial position indicating its Assets, Liabilities and “Net Wealth”. 4. The Statement of Changes in Equity
The overall change for the year (in dollars) of Council's "Net Wealth".
5. The Statement of Cash Flows
Indicates where Council's cash came from and where it was spent. This statement also displays Council's original adopted budget to provide a comparison between what was projected and what actually occurred.
About the Notes to the Financial Statements The Notes to the financial statements provide greater detail and additional information on the 5 primary financial statements. About the Auditor's Reports Council's financial statements are required to be audited by external accountants (that generally specialize in Local Government). In NSW, the Auditor provides 2 audit reports: 1. An opinion on whether the financial statements
present fairly the Council's financial performance & position, &
2. Their observations on the conduct of the Audit
including commentary on the Council's financial performance & financial position.
Who uses the Financial Statements ? The financial statements are publicly available documents & must be presented at a Council meeting between 7 days & 5 weeks after the date of the Audit Report. Submissions from the public can be made to Council up to 7 days subsequent to the public presentation of the financial statements. Council is required to forward an audited set of financial statements to the Office of Local Government. More information… A review of Council's financial performance and position for the 13/14 financial year can be found at Note 28 of the financial statements.

Financial Statements 2014
This Statement should be read in conjunction with the accompanying Notes. page 4
Waverley Council
Income Statement for the financial year ended 30 June 2014
$ '000
Income from Continuing OperationsRevenue:Rates & Annual ChargesUser Charges & FeesInterest & Investment RevenueOther RevenuesGrants & Contributions provided for Operating Purposes 2
Grants & Contributions provided for Capital PurposesOther Income:Net gains from the disposal of assetsNet Share of interests in Joint Ventures & AssociatedEntities using the equity method
Total Income from Continuing Operations
Expenses from Continuing OperationsEmployee Benefits & On-CostsBorrowing CostsMaterials & ContractsDepreciation & AmortisationImpairmentOther ExpensesNet Losses from the Disposal of Assets
Total Expenses from Continuing Operations
Operating Result from Continuing Operations
Discontinued Operations
Net Profit/(Loss) from Discontinued Operations
Net Operating Result for the Year
Net Operating Result attributable to CouncilNet Operating Result attributable to Non-controlling Interests
Net Operating Result for the year before Grants andContributions provided for Capital Purposes
Original Budget as approved by Council - refer Note 16Financial Assistance Grants for 13/14 are lower, reflecting a timing difference due to a change in how the grant is paid - refer Note 3 (e)2
19
4a
4d
-
115,462
50,682
-
194 17,301 15,715
10,340
-
4e1,561
Budget 1
-
-
4c
3e,f
21,230
10,340
10,340
21,175
4d
5
4b
24
5
28,222 2,647
23,211 7,108
2,637 18,946
54,229
-
123,078
6,786 6,802
189
2014
2,270
2,000
31,114
17,897 6,166
3b
Notes
3a
3d3c
3e,f
45,447
1
45,528
-
43,528
45,528
210 19,253
52,595
-
-
111,961
45,528
-
157,489
54,498
16,311 -
21,689
-
113,026
10,052
10,052
-
10,052
105,122
Actual 2013
3,538
-
47,283
17,898 -
17,974
Actual 2014
189
9,865
52,867 31,977
187

Financial Statements 2014
This Statement should be read in conjunction with the accompanying Notes. page 5
Waverley Council
Statement of Comprehensive Income for the financial year ended 30 June 2014
$ '000
Net Operating Result for the year (as per Income statement)
Other Comprehensive Income:
Amounts which will not be reclassified subsequently to the Operating Result Gain (loss) on revaluation of I,PP&ETotal Items which will not be reclassified subsequentlyto the Operating Result
Amounts which will be reclassified subsequently to the Operating Resultwhen specific conditions are metNil
Total Other Comprehensive Income for the year
Total Comprehensive Income for the Year
Total Comprehensive Income attributable to CouncilTotal Comprehensive Income attributable to Non-controlling Interests
Notes
20b (ii)
2014
-
10,052
10,052
-
10,052
-
Actual
50,303
-
2013
50,303
10,340
- 50,303
60,643
60,643
Actual
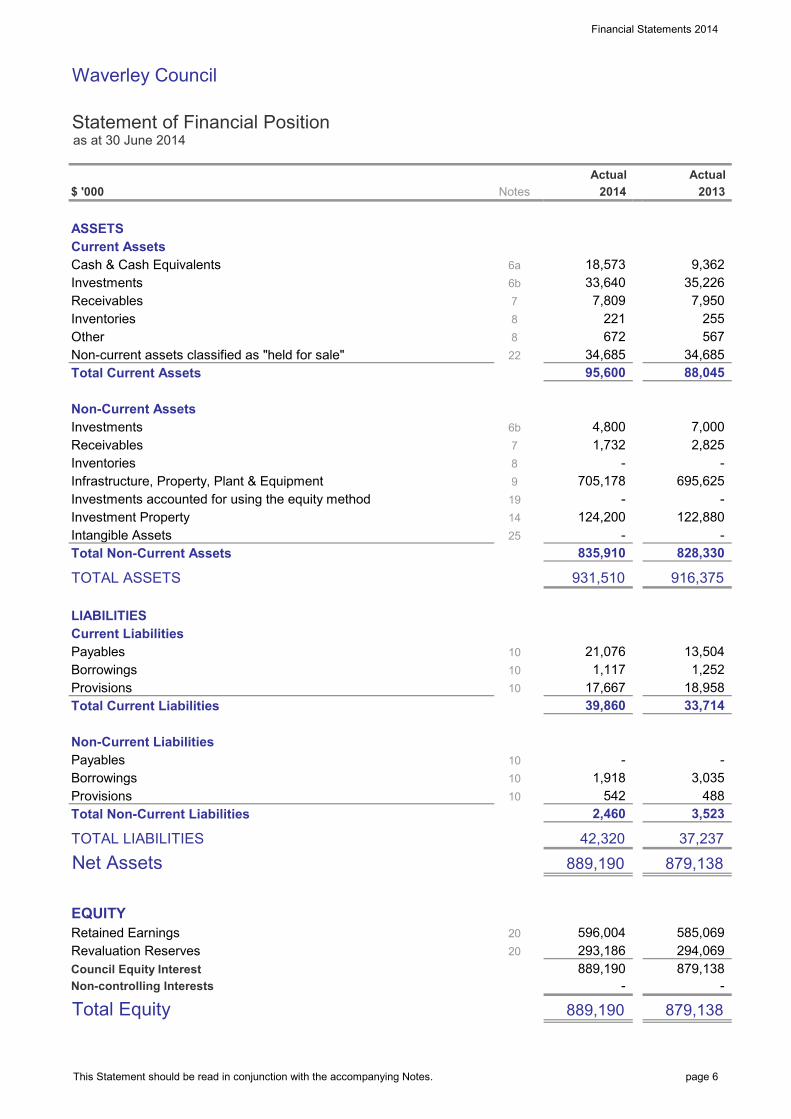
Financial Statements 2014
This Statement should be read in conjunction with the accompanying Notes. page 6
Waverley Council
Statement of Financial Position as at 30 June 2014
$ '000
ASSETSCurrent AssetsCash & Cash EquivalentsInvestmentsReceivablesInventoriesOtherNon-current assets classified as "held for sale"Total Current Assets
Non-Current AssetsInvestmentsReceivablesInventoriesInfrastructure, Property, Plant & EquipmentInvestments accounted for using the equity methodInvestment PropertyIntangible AssetsTotal Non-Current Assets
TOTAL ASSETS
LIABILITIESCurrent LiabilitiesPayablesBorrowingsProvisionsTotal Current Liabilities
Non-Current LiabilitiesPayablesBorrowingsProvisionsTotal Non-Current Liabilities
TOTAL LIABILITIES
Net Assets
EQUITYRetained EarningsRevaluation ReservesCouncil Equity InterestNon-controlling Interests
Total Equity
6b
8
7
Notes
889,190 -
-
8
931,510
21,076
6b
8
10
95,600
2014
835,910
10
10
20
10
20
1,117
889,190
879,138
585,069
-
889,190
88,045
7,000
-
1,732
42,320
Actual
7
14199
33,640
39,860
-
596,004
2,460 3,523
37,237
33,714
542
879,138
294,069
3,035
828,330
-
916,375
13,504
-
1,252 18,958 17,667
9,362 35,226
7,809
25
10
879,138
293,186
10
567 34,685
221 255
695,625
34,685
4,800
- -
1,918 488
2013Actual
22
6a 18,573
- 122,880
705,178
672
2,825
124,200
7,950

Financial Statements 2014
This Statement should be read in conjunction with the accompanying Notes. page 7
Waverley Council
Statement of Changes in Equity for the financial year ended 30 June 2014
$ '000
Opening Balance (as per Last Year's Audited Accounts)
a. Correction of Prior Period Errorsb. Changes in Accounting Policies (prior year effects)
Revised Opening Balance (as at 1/7/13)
c. Net Operating Result for the Year
d. Other Comprehensive Income - Revaluations : IPP&E Asset Revaluation Rsve - Revaluations: Other Reserves - Transfers to Income Statement - Impairment (loss) reversal relating to I,PP&EOther Comprehensive Income
Total Comprehensive Income (c&d)
e. Distributions to/(Contributions from) Non-controlling Interests
f. Transfers between Equity
Equity - Balance at end of the reporting period
$ '000
Opening Balance (as per Last Year's Audited Accounts)
a. Correction of Prior Period Errorsb. Changes in Accounting Policies (prior year effects)
Revised Opening Balance (as at 1/7/12)
c. Net Operating Result for the Year
d. Other Comprehensive Income - Revaluations : IPP&E Asset Revaluation Rsve - Revaluations: Other Reserves - Transfers to Income Statement - Impairment (loss) reversal relating to I,PP&EOther Comprehensive Income
Total Comprehensive Income (c&d)
e. Distributions to/(Contributions from) Non-controlling Interests
f. Transfers between Equity
Equity - Balance at end of the reporting period
Earnings
Non-
Notes
2014
- 20b (ii)
20b (ii)
- 20 (c)
-
585,069
-
10,052
585,069 - 20 (d)
-
10,052
20b (ii)
2013
- 10,340
572,875
- 245,620
245,709 (89)
20 (d) -
Earnings (Refer 20b)
(1,854)
-
- -
Interest
- - -
50,303 -
50,303
-
-
-
-
50,303 60,643
20b (ii)
20b (ii)
20b (ii)
-
879,138
10,340
20b (ii)
294,069
Retained
20b (ii) -
Notes
572,875
20 (c) -
- 883
596,004
-
585,069 294,069 -
- -
1,854 - - -
-
879,138
(Refer 20b)
879,138
879,138 -
- -
10,052
- -
-
- -
- -
-
-
-
-
- 294,069
-
- -
-
-
889,190
- -
(89)
Equity
50,303
818,495
-
-
818,584
818,495 -
(89)
-
-
50,303
-
-
-
-
-
-
-
-
879,138 -
-
-
10,052
879,138
Equity
-
Interest
889,190
-
Council controllingInterest
- - -
- - -
-
- -
50,303 -
60,643 -
-
-
Interest
-
10,340
Non-
10,052
10,052
-
Retained Reserves Total
Total
293,186
(883)
Reserves Council controlling
-
50,303
10,340
818,584
-
-

Financial Statements 2014
This Statement should be read in conjunction with the accompanying Notes. page 8
Waverley Council
Statement of Cash Flows for the financial year ended 30 June 2014
$ '000
Cash Flows from Operating ActivitiesReceipts:Rates & Annual ChargesUser Charges & FeesInvestment & Interest Revenue ReceivedGrants & ContributionsBonds, Deposits & Retention amounts receivedOtherPayments:Employee Benefits & On-CostsMaterials & ContractsBorrowing CostsBonds, Deposits & Retention amounts refundedOtherNet Cash provided (or used in) Operating Activities
Cash Flows from Investing ActivitiesReceipts:Sale of Investment SecuritiesSale of Real Estate AssetsSale of Infrastructure, Property, Plant & EquipmentDeferred Debtors ReceiptsPayments:Purchase of Investment SecuritiesPurchase of Infrastructure, Property, Plant & EquipmentNet Cash provided (or used in) Investing Activities
Cash Flows from Financing ActivitiesReceipts:Proceeds from Borrowings & AdvancesPayments:Repayment of Borrowings & AdvancesNet Cash Flow provided (used in) Financing Activities
Net Increase/(Decrease) in Cash & Cash Equivalents
plus: Cash & Cash Equivalents - beginning of year
Cash & Cash Equivalents - end of the year
Additional Information:
plus: Investments on hand - end of year
Total Cash, Cash Equivalents & Investments
Please refer to Note 11 for additional cash flow information
(227) (213) (214) (19,998) (55,576)
(23,868) 11b
28
57,013
38,440
(19,787)
-
18,573
9,362
9,211
(1,252)
51,588
9,362
(1,400)
20,824
1,100
(11,462)
42,226
(29,750)
167 -
10,315
30,250 19,528
10,136 66,150 -
(22,819) (32,090)
2,500
(1,252)
(53,255)
11,174
Budget
52,525
- 8,315
2014
31,098 2,262
(22,210)
(1,252)
45,000
17,776
-
-
15,011 (21,273)
11a63,322
(670)
3,458
63,992
(19,139)
11a
4,710
(37,091)
23 447
(27,495)
-
(24,093) (62,034)
Actual
8,234 228
34,409
(21,573)
2,391 30,082 2,640
(51,944)
21,207
13,952
47,019
(19,389)
18,751
(248) (186)
Notes
52,900
20132014Actual
6b

Financial Statements 2014
page 9
Waverley Council
Notes to the Financial Statements for the financial year ended 30 June 2014
Contents of the Notes accompanying the Financial Statements
Details
Summary of Significant Accounting PoliciesCouncil Functions / Activities - Financial InformationCouncil Functions / Activities - Component DescriptionsIncome from Continuing OperationsExpenses from Continuing OperationsGains or Losses from the Disposal of AssetsCash & Cash Equivalent AssetsInvestmentsRestricted Cash, Cash Equivalents & Investments - DetailsReceivablesInventories & Other AssetsInfrastructure, Property, Plant & EquipmentExternally Restricted Infrastructure, Property, Plant & EquipmentInfrastructure, Property, Plant & Equipment - Current Year ImpairmentsPayables, Borrowings & ProvisionsDescription of (and movements in) ProvisionsStatement of Cash Flows - Additional InformationCommitments for ExpenditureStatement of Performance Measures:13a (i) Local Government Industry Indicators (Consolidated)13a (ii) Local Government Industry Graphs (Consolidated)Investment PropertiesFinancial Risk ManagementMaterial Budget VariationsStatement of Developer ContributionsContingencies and Other Liabilities/Assets not recognisedControlled Entities, Associated Entities & Interests in Joint VenturesEquity - Retained Earnings and Revaluation Reserves
Financial Result & Financial Position by Fund"Held for Sale" Non Current Assets & Disposal GroupsEvents occurring after the Reporting DateDiscontinued OperationsIntangible AssetsReinstatement, Rehabilitation & Restoration LiabilitiesFair Value Measurement
Additional Council Disclosures
Financial ReviewCouncil Information & Contact Details
n/a - not applicable
2(a)
32(b)
6(b)
5
44
39
4042
49
47
48
45
28
23
26
Note
22
14
10(a)10(b)
17
6(a)
4
6(c)
9(c)
11
24
Page
1
25
19
1516
20
21
53
52
46
47 n/a
18
1213
10282932
78
9(a)9(b)
29
36
40
50
64
57
79
69 n/a
69 n/a
78
68
27 70
54
69 n/a
56
66 n/a
61
69 n/a
63
67 n/a
66

Financial Statements 2014_
Waverley Council Notes to the Financial Statements for the financial year ended 30 June 2014 Note 1. Summary of Significant Accounting Policies
page 10
The principal accounting policies adopted by Council in the preparation of these consolidated financial statements are set out below in order to assist in its general understanding. Under Australian Accounting Standards (AASBs), accounting policies are defined as those specific principles, bases, conventions, rules and practices applied by a reporting entity (in this case Council) in preparing and presenting its financial statements. (a) Basis of preparation (i) Background These financial statements are general purpose financial statements which have been prepared in accordance with; Australian Accounting Standards and Australian
Accounting Interpretations issued by the Australian Accounting Standards Board,
the Local Government Act (1993) & Regulation,
and the Local Government Code of Accounting
Practice and Financial Reporting. For the purpose of preparing these financial statements, Council has been deemed to be a not-for-profit entity. (ii) Compliance with International Financial Reporting Standards (IFRSs) Because AASBs are sector neutral, some standards either:
(a) have local Australian content and prescription that is specific to the Not-For-Profit sector (including Local Government) which are not in compliance with IFRS’s, or
(b) specifically exclude application by Not for Profit entities.
Accordingly in preparing these financial statements and accompanying notes, Council has been unable to comply fully with International Accounting Standards, but has complied fully with Australian Accounting Standards.
Under the Local Government Act (LGA), Regulations and Local Government Code of Accounting Practice & Financial Reporting, it should be noted that Councils in NSW only have a requirement to comply with AASBs. (iii) New and amended standards adopted by Council During the current year, the following relevant standards became mandatory for Council and have been adopted: AASB 13 Fair Value Measurement AASB 119 Employee Benefits AASB 13 Fair Value Measurement has not affected the assets or liabilities which are to be measured at fair value, however it provides detailed guidance on how to measure fair value in accordance with the accounting standards. It introduces the concept of highest and best use for non-financial assets and has caused the Council to review their valuation methodology. The level of disclosures regarding fair value have increased significantly and have been included in the financial statements at Note 27. AASB 119 Employee Benefits introduced revised definitions for short-term employee benefits. Whilst the Council has reviewed the annual leave liability to determine the level of annual leave which is expected to be paid more than 12 months after the end of the reporting period, there has been no effect on the amounts disclosed as leave liabilities since Council’s existing valuation policy was to discount annual leave payable more than 12 months after the end of the reporting period to present values. (iv) Early adoption of Accounting Standards Council has not elected to apply any pronouncements before their operative date in the annual reporting period beginning 1 July 2013. Refer further to paragraph (ab) relating to a summary of the effects of Standards with future operative dates.

Financial Statements 2014_
Waverley Council Notes to the Financial Statements for the financial year ended 30 June 2014 Note 1. Summary of Significant Accounting Policies
page 11
(v) Basis of Accounting These financial statements have been prepared under the historical cost convention except for: (i) certain financial assets and liabilities at fair
value through profit or loss and available-for-sale financial assets which are all valued at fair value,
(ii) the write down of any Asset on the basis of Impairment (if warranted) and
(iii) certain classes of non current assets (eg.
Infrastructure, Property, Plant & Equipment and Investment Property) that are accounted for at fair valuation.
The accrual basis of accounting has also been applied in their preparation. (vi) Changes in Accounting Policies Council’s accounting policies have been consistently applied to all the years presented, unless otherwise stated. There have also been no changes in accounting policies when compared with previous financial statements unless otherwise stated. (vii) Critical Accounting Estimates The preparation of financial statements requires the use of certain critical accounting estimates (in conformity with AASBs). Accordingly this requires management to exercise its judgement in the process of applying the Council's accounting policies. Estimates and judgements are continually evaluated and are based on historical experience and other factors, including expectations of future events that may have a financial impact on Council and that are believed to be reasonable under the circumstances. Critical accounting estimates and assumptions Council makes estimates and assumptions concerning the future. The resulting accounting estimates will, by definition, seldom equal the related actual results.
The estimates and assumptions that have a significant risk of causing a material adjustment to the carrying amounts of assets and liabilities within the next financial year are set out below: (i) Estimated fair values of investment properties
(ii) Estimated fair values of infrastructure, property,
plant and equipment.
(iii) Estimated remediation provisions.
Critical judgements in applying Council's accounting policies (i) Impairment of Receivables - Council has made
a significant judgement about the impairment of a number of its receivables in Note 7.
(ii) Projected Section 94 Commitments - Council
has used significant judgement in determining future Section 94 income and expenditure in Note 17.
(b) Revenue recognition Council recognises revenue when the amount of revenue can be reliably measured, it is probable that future economic benefits will flow to it and specific criteria have been met for each of the Council’s activities as described below. Council bases any estimates on historical results, taking into consideration the type of customer, the type of transaction and the specifics of each arrangement. Revenue is measured at the fair value of the consideration received or receivable. Revenue is measured on major income categories as follows: Rates, Annual Charges, Grants and Contributions Rates, annual charges, grants and contributions (including developer contributions) are recognised as revenues when the Council obtains control over the assets comprising these receipts. Control over assets acquired from rates and annual charges is obtained at the commencement of the rating year as it is an enforceable debt linked to the

Financial Statements 2014_
Waverley Council Notes to the Financial Statements for the financial year ended 30 June 2014 Note 1. Summary of Significant Accounting Policies
page 12
rateable property or, where earlier, upon receipt of the rates. A provision for the impairment on rates receivables has not been established as unpaid rates represent a charge against the rateable property that will be recovered when the property is next sold. Control over granted assets is normally obtained upon their receipt (or acquittal) or upon earlier notification that a grant has been secured, and is valued at their fair value at the date of transfer. Revenue from Contributions is recognised when the Council either obtains control of the contribution or the right to receive it, (i) it is probable that the economic benefits comprising the contribution will flow to the Council and (ii) the amount of the contribution can be measured reliably. Where grants or contributions recognised as revenues during the financial year were obtained on condition that they be expended in a particular manner or used over a particular period and those conditions were undischarged at balance date, the unused grant or contribution is disclosed in Note 3(g). Note 3(g) also discloses the amount of unused grant or contribution from prior years that was expended on Council’s operations during the current year. The Council has obligations to provide facilities from contribution revenues levied on developers under the provisions of S94 of the EPA Act 1979. Whilst Council generally incorporates these amounts as part of a Development Consents Order, such developer contributions are only recognised as income upon their physical receipt by Council, due to the possibility that individual Development Consents may not be acted upon by the applicant and accordingly would not be payable to Council. Developer contributions may only be expended for the purposes for which the contributions were required but the Council may apply contributions according to the priorities established in work schedules. A detailed Note relating to developer contributions can be found at Note 17.
User Charges, Fees and Other Income User charges, fees and other income (including parking fees and fines) are recognised as revenue when the service has been provided, the payment is received, or when the penalty has been applied, whichever first occurs. A provision for the impairment of these receivables is recognised when collection in full is no longer probable. A liability is recognised in respect of revenue that is reciprocal in nature to the extent that the requisite service has not been provided as at balance date. Sale of Infrastructure, Property, Plant and Equipment The profit or loss on sale of an asset is determined when control of the asset has irrevocably passed to the buyer. Interest and Rents Rental income is accounted for on a straight-line basis over the lease term. Interest Income from Cash & Investments is accounted for using the effective interest rate at the date that interest is earned. Other Income Other income is recorded when the payment is due, the value of the payment is notified or the payment is received, whichever occurs first. (c) Principles of Consolidation These financial statements incorporate (i) the assets and liabilities of Council and any entities (or operations) that it controls (as at 30 June 2014) and (ii) all the related operating results (for the financial year ended the 30th June 2014). The financial statements also include Council’s share of the assets, liabilities, income and expenses of any Jointly Controlled Operations under the appropriate headings. In the process of reporting on Council’s activities as a single unit, all inter-entity year end balances and
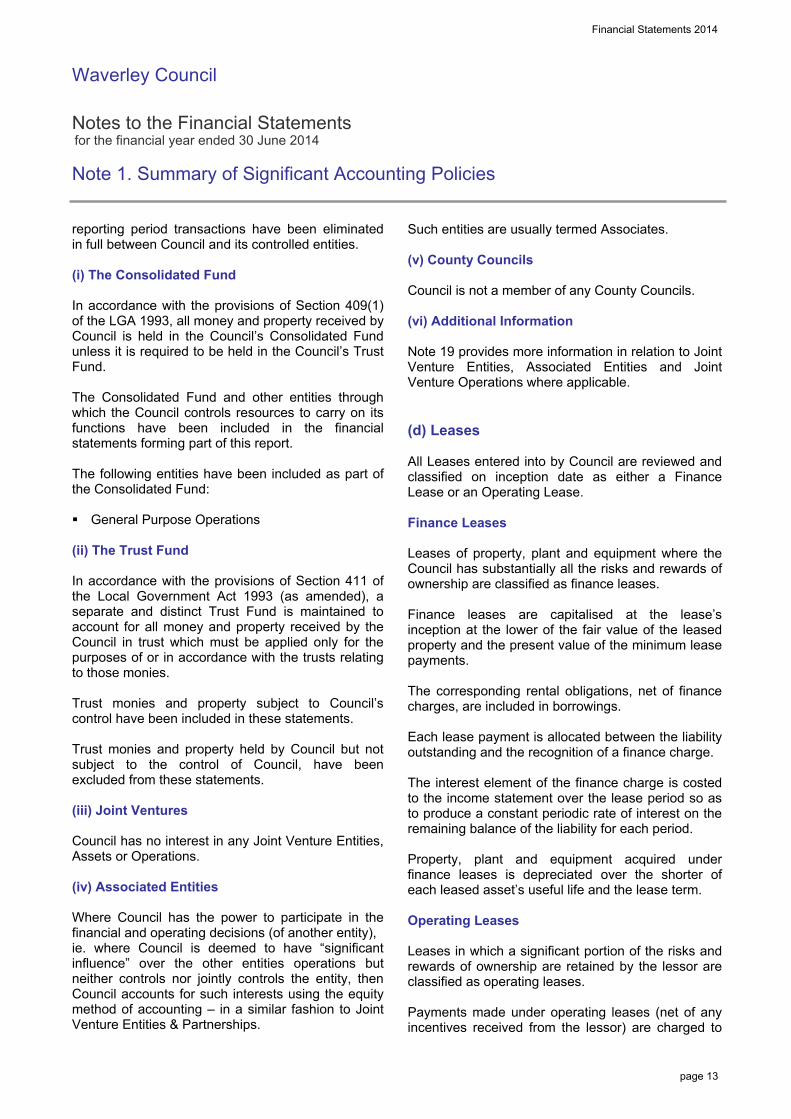
Financial Statements 2014_
Waverley Council Notes to the Financial Statements for the financial year ended 30 June 2014 Note 1. Summary of Significant Accounting Policies
page 13
reporting period transactions have been eliminated in full between Council and its controlled entities. (i) The Consolidated Fund In accordance with the provisions of Section 409(1) of the LGA 1993, all money and property received by Council is held in the Council’s Consolidated Fund unless it is required to be held in the Council’s Trust Fund. The Consolidated Fund and other entities through which the Council controls resources to carry on its functions have been included in the financial statements forming part of this report. The following entities have been included as part of the Consolidated Fund: General Purpose Operations (ii) The Trust Fund In accordance with the provisions of Section 411 of the Local Government Act 1993 (as amended), a separate and distinct Trust Fund is maintained to account for all money and property received by the Council in trust which must be applied only for the purposes of or in accordance with the trusts relating to those monies. Trust monies and property subject to Council’s control have been included in these statements. Trust monies and property held by Council but not subject to the control of Council, have been excluded from these statements. (iii) Joint Ventures Council has no interest in any Joint Venture Entities, Assets or Operations. (iv) Associated Entities Where Council has the power to participate in the financial and operating decisions (of another entity), ie. where Council is deemed to have “significant influence” over the other entities operations but neither controls nor jointly controls the entity, then Council accounts for such interests using the equity method of accounting – in a similar fashion to Joint Venture Entities & Partnerships.
Such entities are usually termed Associates. (v) County Councils Council is not a member of any County Councils. (vi) Additional Information Note 19 provides more information in relation to Joint Venture Entities, Associated Entities and Joint Venture Operations where applicable. (d) Leases All Leases entered into by Council are reviewed and classified on inception date as either a Finance Lease or an Operating Lease. Finance Leases Leases of property, plant and equipment where the Council has substantially all the risks and rewards of ownership are classified as finance leases. Finance leases are capitalised at the lease’s inception at the lower of the fair value of the leased property and the present value of the minimum lease payments. The corresponding rental obligations, net of finance charges, are included in borrowings. Each lease payment is allocated between the liability outstanding and the recognition of a finance charge. The interest element of the finance charge is costed to the income statement over the lease period so as to produce a constant periodic rate of interest on the remaining balance of the liability for each period. Property, plant and equipment acquired under finance leases is depreciated over the shorter of each leased asset’s useful life and the lease term. Operating Leases Leases in which a significant portion of the risks and rewards of ownership are retained by the lessor are classified as operating leases. Payments made under operating leases (net of any incentives received from the lessor) are charged to

Financial Statements 2014_
Waverley Council Notes to the Financial Statements for the financial year ended 30 June 2014 Note 1. Summary of Significant Accounting Policies
page 14
the income statement on a straight-line basis over the period of the lease. Lease income from operating leases is recognised in income on a straight-line basis over the lease term. (e) Cash and Cash Equivalents For Statement of Cash Flows (and Statement of Financial Position) presentation purposes, cash and cash equivalents includes; cash on hand, deposits held at call with financial institutions, other short-term, highly liquid investments with
original maturities of three months or less that are readily convertible to known amounts of cash and which are subject to an insignificant risk of changes in value, and
bank overdrafts. Bank overdrafts are shown within borrowings in current liabilities on the balance sheet but are incorporated into Cash & Cash Equivalents for presentation of the Cash Flow Statement. (f) Investments and Other Financial Assets Council (in accordance with AASB 139) classifies each of its investments into one of the following categories for measurement purposes: financial assets at fair value through profit or
loss, loans and receivables, held-to-maturity investments, and available-for-sale financial assets. Each classification depends on the purpose/intention for which the investment was acquired & at the time it was acquired. Management determines each Investment classification at the time of initial recognition and re-evaluates this designation at each reporting date.
(i) Financial assets at fair value through profit or loss Financial assets at fair value through profit or loss include financial assets that are “held for trading”. A financial asset is classified in the “held for trading” category if it is acquired principally for the purpose of selling in the short term. Derivatives are classified as held for trading unless they are designated as hedges. Assets in this category are primarily classified as current assets as they are primarily held for trading &/or are expected to be realised within 12 months of the balance sheet date. (ii) Loans and receivables Loans and receivables are non derivative financial assets with fixed or determinable payments that are not quoted in an active market. They arise when the Council provides money, goods or services directly to a debtor with no intention (or in some cases ability) of selling the resulting receivable. They are included in current assets, except for those with maturities greater than 12 months after the balance sheet date which are classified as non-current assets. (iii) Held-to-maturity investments Held-to-maturity investments are non-derivative financial assets with fixed or determinable payments and fixed maturities that the Council’s management has the positive intention and ability to hold to maturity. In contrast to the “Loans & Receivables” classification, these investments are generally quoted in an active market. Held-to-maturity financial assets are included in non-current assets, except for those with maturities less than 12 months from the reporting date, which are classified as current assets.
Financial Statements 2014_
Waverley Council Notes to the Financial Statements for the financial year ended 30 June 2014 Note 1. Summary of Significant Accounting Policies
page 15
(iv) Available-for-sale financial assets Available-for-sale financial assets are non-derivatives that are either designated in this category or not classified in any of the other categories. Investments must be designated as available-for-sale if they do not have fixed maturities and fixed or determinable payments and management intends to hold them for the medium to long term. Accordingly, this classification principally comprises marketable equity securities, but can include all types of financial assets that could otherwise be classified in one of the other investment categories. They are generally included in non-current assets unless management intends to dispose of the investment within 12 months of the balance sheet date or the term to maturity from the reporting date is less than 12 months. Financial Assets – Reclassification Council may choose to reclassify a non-derivative trading financial asset out of the held-for-trading category if the financial asset is no longer held for the purpose of selling it in the near term. Financial assets other than loans and receivables are permitted to be reclassified out of the held-for-trading category only in rare circumstances arising from a single event that is unusual and highly unlikely to recur in the near term. Council may also choose to reclassify financial assets that would meet the definition of loans and receivables out of the held-for-trading or available-for-sale categories if it has the intention and ability to hold these financial assets for the foreseeable future or until maturity at the date of reclassification. Reclassifications are made at fair value as of the reclassification date. Fair value becomes the new cost or amortised cost as applicable, and no reversals of fair value gains or losses recorded before reclassification date are subsequently made. Effective interest rates for financial assets reclassified to loans and receivables and held-to-maturity categories are determined at the reclassification date. Further increases in estimates of cash flows adjust effective interest rates prospectively.
General Accounting & Measurement of Financial Instruments: (i) Initial Recognition Investments are initially recognised (and measured) at fair value, plus in the case of investments not at “fair value through profit or loss”, directly attributable transactions costs Purchases and sales of investments are recognised on trade-date - the date on which the Council commits to purchase or sell the asset. Financial assets are derecognised when the rights to receive cash flows from the financial assets have expired or have been transferred and the Council has transferred substantially all the risks and rewards of ownership. (ii) Subsequent Measurement Available-for-sale financial assets and financial assets at fair value through profit and loss are subsequently carried at fair value. Loans and receivables and held-to-maturity investments are carried at amortised cost using the effective interest method. Realised and unrealised gains and losses arising from changes in the fair value of the financial assets classified as “fair value through profit or loss” category are included in the income statement in the period in which they arise. Unrealised gains and losses arising from changes in the fair value of non monetary securities classified as "available-for-sale" are recognised in equity in the available-for-sale investments revaluation reserve. When securities classified as "available-for-sale" are sold or impaired, the accumulated fair value adjustments are included in the income statement as gains and losses from investment securities. Impairment Council assesses at each balance date whether there is objective evidence that a financial asset or group of financial assets is impaired. A financial asset or a group of financial assets is impaired and impairment losses are incurred only if

Financial Statements 2014_
Waverley Council Notes to the Financial Statements for the financial year ended 30 June 2014 Note 1. Summary of Significant Accounting Policies
page 16
there is objective evidence of impairment as a result of one or more events that occurred after the initial recognition of the asset (a ‘loss event’) and that loss event (or events) has an impact on the estimated future cash flows of the financial asset or group of financial assets that can be reliably estimated. In the case of equity securities classified as available-for-sale, a significant or prolonged decline in the fair value of a security below its cost is considered in determining whether the security is impaired. If any such evidence exists for available-for-sale financial assets, the cumulative loss - measured as the difference between the acquisition cost and the current fair value, less any impairment loss on that financial asset previously recognised in profit and loss - is removed from equity and recognised in the income statement. Impairment losses recognised in the income statement on equity instruments are not reversed through the income statement. If there is evidence of impairment for any of Council’s financial assets carried at amortised cost (eg. loans and receivables), the amount of the loss is measured as the difference between the asset’s carrying amount and the present value of estimated future cash flows (excluding future credit losses that have not been incurred) discounted at the financial asset’s original effective interest rate. The carrying amount of the asset is reduced and the amount of the loss is recognised in profit or loss. If a loan or held-to-maturity investment has a variable interest rate, the discount rate for measuring any impairment loss is the current effective interest rate determined under the contract. As a practical expedient, the group may measure impairment on the basis of an instrument’s fair value using an observable market price. (iii) Types of Investments Council has an approved Investment Policy in order to undertake its investment of money in accordance with (and to comply with) Section 625 of the Local Government Act and S212 of the LG (General) Regulation 2005.
Investments are placed and managed in accordance with the Policy and having particular regard to authorised investments prescribed under the Ministerial Local Government Investment Order. Council maintains its investment Policy in compliance with the Act and ensures that it or its representatives exercise care, diligence and skill that a prudent person would exercise in investing Council funds. Council amended its policy following revisions to the Ministerial Local Government Investment Order arising from the Cole Inquiry recommendations. Certain investments that Council holds are no longer prescribed (eg. managed funds, CDOs, and equity linked notes), however they have been retained under grandfathering provisions of the Order. These will be disposed of when most financially advantageous to Council. (g) Fair value estimation The fair value of financial assets and financial liabilities must be estimated for recognition and measurement or for disclosure purposes. The fair value of financial instruments traded in active markets is based on quoted market prices at the balance sheet date. The fair value of financial instruments that are not traded in an active market is determined using valuation techniques. Council uses a variety of methods and makes assumptions that are based on market conditions existing at each balance date. Quoted market prices or dealer quotes for similar instruments are used for long-term debt instruments held. If the market for a financial asset is not active (and for unlisted securities), the Council establishes fair value by using valuation techniques. These include reference to the fair values of recent arm’s length transactions, involving the same instruments or other instruments that are substantially the same, discounted cash flow analysis, and option pricing models refined to reflect the issuer’s specific circumstances.

Financial Statements 2014_
Waverley Council Notes to the Financial Statements for the financial year ended 30 June 2014 Note 1. Summary of Significant Accounting Policies
page 17
The nominal value less estimated credit adjustments of trade receivables and payables are assumed to approximate their fair values. The fair value of financial liabilities for disclosure purposes is estimated by discounting the future contractual cash flows at the current market interest rate that is available to the Council for similar financial instruments. (h) Receivables Receivables are initially recognised at fair value and subsequently measured at amortised cost, less any provision for impairment. Receivables (excluding Rates & Annual Charges) are generally due for settlement no more than 30 days from the date of recognition. The collectibility of receivables is reviewed on an ongoing basis. Debts which are known to be uncollectible are written off in accordance with Council’s policy. A provision for impairment (ie. an allowance account) relating to receivables is established when there is objective evidence that the Council will not be able to collect all amounts due according to the original terms of each receivable. The amount of the provision is the difference between the asset’s carrying amount and the present value of estimated future cash flows, discounted at the effective interest rate. Impairment losses are recognised in the Income Statement within other expenses. When a receivable for which an impairment allowance had been recognised becomes uncollectible in a subsequent period, it is written off against the allowance account. Subsequent recoveries of amounts previously written off are credited against other expenses in the income statement.
(i) Inventories Raw Materials and Stores, Work in Progress and Finished Goods Raw materials and stores, work in progress and finished goods in respect of business undertakings are all stated at the lower of cost and net realisable value. Cost comprises direct materials, direct labour and an appropriate proportion of variable and fixed overhead expenditure, the latter being allocated on the basis of normal operating capacity. Costs are assigned to individual items of inventory on the basis of weighted average costs. Net realisable value is the estimated selling price in the ordinary course of business less the estimated costs of completion and the estimated costs necessary to make the sale. Inventories held in respect of non-business undertakings have been valued at cost subject to adjustment for loss of service potential. Land Held for Resale/Capitalisation of Borrowing Costs Land held for resale is stated at the lower of cost and net realisable value. Cost is assigned by specific identification and includes the cost of acquisition, and development and borrowing costs during development. When development is completed borrowing costs and other holding charges are expensed as incurred. Borrowing costs included in the cost of land held for resale are those costs that would have been avoided if the expenditure on the acquisition and development of the land had not been made. Borrowing costs incurred while active development is interrupted for extended periods are recognised as expenses.

Financial Statements 2014_
Waverley Council Notes to the Financial Statements for the financial year ended 30 June 2014 Note 1. Summary of Significant Accounting Policies
page 18
(j) Infrastructure, Property, Plant and Equipment (I,PP&E) Acquisition of assets Council’s non current assets are continually revalued (over a 5 year period) in accordance with the fair valuation policy as mandated by the Office of Local Government. At balance date, the following classes of I,PP&E were stated at their Fair Value; - Investment Properties – refer Note 1(p), - Water and Sewerage Networks
(Internal Valuation)
- Operational Land (External Valuation)
- Buildings – Specialised/Non Specialised (External Valuation)
- Plant and Equipment
(as approximated by depreciated historical cost)
- Roads Assets incl. roads, bridges & footpaths (Internal Valuation)
- Drainage Assets (Internal Valuation) - Bulk Earthworks (Internal Valuation)
- Community Land (Internal Valuation)
- Land Improvements
(as approximated by depreciated historical cost)
- Other Structures (as approximated by depreciated historical cost)
- Other Assets (as approximated by depreciated historical cost)
Initial Recognition On initial recognition, an assets cost is measured at its fair value, plus all expenditure that is directly attributable to the acquisition. Where settlement of any part of an asset’s cash consideration is deferred, the amounts payable in the future are discounted to their present value as at the date of recognition (ie. date of exchange) of the asset to arrive at fair value.
The discount rate used is the Council’s incremental borrowing rate, being the rate at which a similar borrowing could be obtained from an independent financier under comparable terms and conditions. Where infrastructure, property, plant and equipment assets are acquired for no cost or for an amount other than cost, the assets are recognised in the financial statements at their fair value at acquisition date - being the amount that the asset could have been exchanged between knowledgeable willing parties in an arm’s length transaction. Subsequent costs Subsequent costs are included in the asset’s carrying amount or recognised as a separate asset, as appropriate, only when it is probable that future economic benefits associated with the item will flow to Council and the cost of the item can be measured reliably. All other repairs and maintenance are charged to the income statement during the financial period in which they are incurred. Asset Revaluations (including Indexation) In accounting for Asset Revaluations relating to Infrastructure, Property, Plant & Equipment: Increases in the combined carrying amounts of
asset classes arising on revaluation are credited to the asset revaluation reserve.
To the extent that a net asset class increase
reverses a decrease previously recognised via the profit or loss, then increase is first recognised in profit or loss.
Net decreases that reverse previous increases of
the same asset class are first charged against revaluation reserves directly in equity to the extent of the remaining reserve attributable to the asset, with all other decreases charged to the Income statement.
Water and sewerage network assets are indexed annually between full revaluations in accordance with the latest indices provided in the NSW Office of Water - Rates Reference Manual. For all other assets, Council assesses at each reporting date whether there is any indication that a

Financial Statements 2014_
Waverley Council Notes to the Financial Statements for the financial year ended 30 June 2014 Note 1. Summary of Significant Accounting Policies
page 19
revalued asset’s carrying amount may differ materially from that which would be determined if the asset were revalued at the reporting date. If any such indication exists, Council determines the asset’s fair value and revalues the asset to that amount. Full revaluations are undertaken for all assets on a 5 year cycle. Capitalisation Thresholds Items of infrastructure, property, plant and equipment are not capitalised unless their cost of acquisition exceeds the following; Land - council land 100% Capitalised - open space 100% Capitalised - land under roads (purchases after 30/6/08) 100% Capitalised Plant & Equipment Office Furniture > $2,000 Office Equipment > $2,000 Other Plant &Equipment > $2,000 Buildings & Land Improvements Park Furniture & Equipment > $20,000 Building - construction/extensions 100% Capitalised - renovations > $50,000 Other Structures > $20,000 Stormwater Assets Drains & Culverts > $20,000 Other > $20,000 Transport Assets Road construction & reconstruction > $20,000 Reseal/Re-sheet & major repairs: > $20,000 Bridge construction & reconstruction > $20,000 Depreciation Depreciation on Council's infrastructure, property, plant and equipment assets is calculated using the straight line method in order to allocate an assets cost (net of residual values) over its estimated useful life.
Land is not depreciated. Estimated useful lives for Council's I,PP&E include: Plant & Equipment - Office Equipment 5 to 10 years - Office furniture 10 to 20 years - Computer Equipment 4 years - Vehicles & /Road Making equip. 5 to 8 years - Other plant and equipment 5 to 15 years Other Equipment - Playground equipment 5 to 15 years - Benches, seats etc 10 to 20 years Buildings - Buildings : Masonry 50 to 100 years - Buildings : Other 20 to 40 years Stormwater Drainage - Drains 80 to 100 years - Culverts 50 to 80 years Transportation Assets - Sealed Roads : Surface 20 years - Sealed Roads : Structure 50 years - Unsealed roads 20 years - Bridge : Concrete 100 years - Bridge : Other 20 to 75 years - Road Pavements 60 years - Kerb, Gutter & Paths 40 years Other Infrastructure Assets - Bulk earthworks Infinite All asset residual values and useful lives are reviewed and adjusted (if appropriate), at each reporting date. An asset’s carrying amount is written down immediately to its recoverable amount if the asset’s carrying amount is greater than its estimated recoverable amount – refer Note 1(s) on Asset Impairment. Disposal and De-recognition An item of property, plant and equipment is derecognised upon disposal or when no further
Financial Statements 2014_
Waverley Council Notes to the Financial Statements for the financial year ended 30 June 2014 Note 1. Summary of Significant Accounting Policies
page 20
future economic benefits are expected from its use or disposal. Any gain or loss arising on derecognition of the asset (calculated as the difference between the net disposal proceeds and the carrying amount of the asset) is included in Council’s Income Statement in the year the asset is derecognised. (k) Land Land (other than Land under Roads) is in accordance with Part 2 of Chapter 6 of the Local Government Act (1993) classified as either Operational or Community. This classification of Land is disclosed in Note 9(a). (l) Land under roads Land under roads is land under roadways and road reserves including land under footpaths, nature strips and median strips. Council has elected not to recognise land under roads acquired before 1 July 2008 in accordance with AASB 1051. Land under roads acquired after 1 July 2008 is recognised in accordance with AASB 116 – Property, Plant and Equipment. (m) Intangible Assets IT Development and Software Costs incurred in developing products or systems and costs incurred in acquiring software and licenses that will contribute to future period financial benefits through revenue generation and/or cost reduction are capitalised to software and systems. Costs capitalised include external direct costs of materials and service, direct payroll and payroll related costs of employees’ time spent on the project. Amortisation is calculated on a straight line bases over periods generally ranging from 3 to 5 years.
IT development costs include only those costs directly attributable to the development phase and are only recognised following completion of technical feasibility and where Council has an intention and ability to use the asset. (n) Crown Reserves Crown Reserves under Council’s care and control are recognised as assets of the Council. While ownership of the reserves remains with the Crown, Council retains operational control of the reserves and is responsible for their maintenance and use in accordance with the specific purposes to which the reserves are dedicated. Improvements on Crown Reserves are also recorded as assets, while maintenance costs incurred by Council and revenues relating the reserves are recognised within Council’s Income Statement. Representations are currently being sought across State and Local Government to develop a consistent accounting treatment for Crown Reserves across both tiers of government. (o) Rural Fire Service assets Under section 119 of the Rural Fires Act 1997, “all fire fighting equipment purchased or constructed wholly or from money to the credit of the Fund is to be vested in the council of the area for or on behalf of which the fire fighting equipment has been purchased or constructed”. At present, the accounting for such fire fighting equipment is not treated in a consistent manner across all Councils. Until such time as discussions on this matter have concluded and the legislation changed, Council will continue to account for these assets as it has been doing in previous years, which is to incorporate the assets, their values and depreciation charges within these financial statements.

Financial Statements 2014_
Waverley Council Notes to the Financial Statements for the financial year ended 30 June 2014 Note 1. Summary of Significant Accounting Policies
page 21
(p) Investment property Investment property comprises land &/or buildings that are principally held for long-term rental yields, capital gains or both that is not occupied by Council. Investment property is carried at fair value, representing an open-market value determined annually by external valuers. Annual changes in the fair value of Investment Properties are recorded in the Income Statement as part of “Other Income”. Full revaluations are carried out every three years with an appropriate index utilised each year in between the full revaluations. The last full revaluation for Council’s Investment Properties was dated 30/06/2013. (q) Provisions for close down, restoration and for environmental clean up costs – including Tips and Quarries Close down, Restoration and Remediation costs include the dismantling and demolition of infrastructure, the removal of residual materials and the remediation of disturbed areas. Estimated close down and restoration costs are provided for in the accounting period when the obligation arising from the related disturbance occurs, whether this occurs during the development or during the operation phase, based on the net present value of estimated future costs. Provisions for close down and restoration costs do not include any additional obligations which are expected to arise from future disturbance. Costs are estimated on the basis of a closure plan. The cost estimates are calculated annually during the life of the operation to reflect known developments, eg updated cost estimates and revisions to the estimated lives of operations, and are subject to formal review at regular intervals. Close down, Restoration and Remediation costs are a normal consequence of tip and quarry operations, and the majority of close down and restoration
expenditure is incurred at the end of the life of the operations. Although the ultimate cost to be incurred is uncertain, Council estimates the respective costs based on feasibility and engineering studies using current restoration standards and techniques. The amortisation or ‘unwinding’ of the discount applied in establishing the net present value of provisions is charged to the income statement in each accounting period. This amortisation of the discount is disclosed as a borrowing cost in Note 4(b). Other movements in the provisions for Close down, Restoration and Remediation costs including those resulting from new disturbance, updated cost estimates, changes to the estimated lives of operations and revisions to discount rates are capitalised within property, plant and equipment. These costs are then depreciated over the lives of the assets to which they relate. Where rehabilitation is conducted systematically over the life of the operation, rather than at the time of closure, provision is made for the estimated outstanding continuous rehabilitation work at each balance sheet date and the cost is charged to the income statement. Provision is made for the estimated present value of the costs of environmental clean up obligations outstanding at the balance sheet date. These costs are charged to the income statement. Movements in the environmental clean up provisions are presented as an operating cost, except for the unwind of the discount which is shown as a borrowing cost. Remediation procedures generally commence soon after the time the damage, remediation process and estimated remediation costs become known, but may continue for many years depending on the nature of the disturbance and the remediation techniques. As noted above, the ultimate cost of environmental remediation is uncertain and cost estimates can vary in response to many factors including changes to the relevant legal requirements, the emergence of new

Financial Statements 2014_
Waverley Council Notes to the Financial Statements for the financial year ended 30 June 2014 Note 1. Summary of Significant Accounting Policies
page 22
restoration techniques or experience at other locations. The expected timing of expenditure can also change, for example in response to changes in quarry reserves or production rates. As a result there could be significant adjustments to the provision for close down and restoration and environmental clean up, which would affect future financial results. Specific Information relating to Council's provisions relating to Close down, Restoration and Remediation costs can be found at Note 26. (r) Non-Current Assets (or Disposal Groups) “Held for Sale” & Discontinued Operations Non-current assets (or disposal groups) are classified as held for sale and stated at the lower of either (i) their carrying amount and (ii) fair value less costs to sell, if their carrying amount will be recovered principally through a sale transaction rather than through continuing use. The exception to this is plant and motor vehicles which are turned over on a regular basis. Plant and motor vehicles are retained in Non Current Assets under the classification of Infrastructure, Property, Plant and Equipment - unless the assets are to be traded in after 30 June and the replacement assets were already purchased and accounted for as at 30 June. For any assets or disposal groups classified as Non-Current Assets “held for sale”, an impairment loss is recognised at any time when the assets carrying value is greater than its fair value less costs to sell. Non-current assets “held for sale” are not depreciated or amortised while they are classified as “held for sale”. Non-current assets classified as “held for sale” are presented separately from the other assets in the balance sheet. A Discontinued Operation is a component of Council that has been disposed of or is classified as “held for sale” and that represents a separate major line of
business or geographical area of operations, is part of a single co-ordinated plan to dispose of such a line of business or area of operations, or is a subsidiary acquired exclusively with a view to resale. The results of discontinued operations are presented separately on the face of the income statement. (s) Impairment of assets All Council's I,PP&E is subject to an annual assessment of impairment. Assets that are subject to amortisation are reviewed for impairment whenever events or changes in circumstances indicate that the carrying amount may not be recoverable. An impairment loss is recognised for the amount by which the asset’s carrying amount exceeds its recoverable amount. The recoverable amount is the higher of an asset’s fair value less costs to sell and value in use. Where an asset is not held principally for cash generating purposes (for example Infrastructure Assets) and would be replaced if the Council was deprived of it then depreciated replacement cost is used as value in use, otherwise value in use is estimated by using a discounted cash flow model. Non-financial assets (other than goodwill) that suffered a prior period impairment are reviewed for possible reversal of the impairment at each reporting date. Goodwill & other Intangible Assets that have an indefinite useful life and are not subject to amortisation are tested annually for impairment. (t) Payables These amounts represent liabilities and include goods and services provided to the Council prior to the end of financial year which are unpaid. The amounts for goods and services are unsecured and are usually paid within 30 days of recognition.

Financial Statements 2014_
Waverley Council Notes to the Financial Statements for the financial year ended 30 June 2014 Note 1. Summary of Significant Accounting Policies
page 23
(u) Borrowings Borrowings are initially recognised at fair value, net of transaction costs incurred. Borrowings are subsequently measured at amortised cost. Amortisation results in any difference between the proceeds (net of transaction costs) and the redemption amount being recognised in the Income Statement over the period of the borrowings using the effective interest method. Borrowings are removed from the balance sheet when the obligation specified in the contract is discharged, cancelled or expired. Borrowings are classified as current liabilities unless the Council has an unconditional right to defer settlement of the liability for at least 12 months after the balance sheet date. (v) Borrowing costs Borrowing costs are expensed. (w) Provisions Provisions for legal claims, service warranties and other like liabilities are recognised when: Council has a present legal or constructive
obligation as a result of past events; it is more likely than not that an outflow of
resources will be required to settle the obligation; and
the amount has been reliably estimated. Provisions are not recognised for future operating losses. Where there are a number of similar obligations, the likelihood that an outflow will be required in settlement is determined by considering the class of obligations as a whole.
A provision is recognised even if the likelihood of an outflow with respect to any one item included in the same class of obligations may be small. Provisions are measured at the present value of management’s best estimate of the expenditure required to settle the present obligation at the reporting date. The discount rate used to determine the present value reflects current market assessments of the time value of money and the risks specific to the liability. The increase in the provision due to the passage of time is recognised as interest expense. (x) Employee benefits (i) Short Term Obligations Short term employee benefit obligations include liabilities for wages and salaries (including non-monetary benefits), annual leave and vesting sick leave expected to be wholly settled within the 12 months after the reporting period. Leave liabilities are recognised in the provision for employee benefits in respect of employees’ services up to the reporting date with other short term employee benefit obligations disclosed under payables. These provisions are measured at the amounts expected to be paid when the liabilities are settled. All other short-term employee benefit obligations are presented as payables. Liabilities for non vesting sick leave are recognised at the time when the leave is taken and measured at the rates paid or payable, and accordingly no Liability has been recognised in these reports. Wages & salaries, annual leave and vesting sick leave are all classified as Current Liabilities. (ii) Other Long Term Obligations The liability for all long service and annual leave in respect of services provided by employees up to the reporting date (which is not expected to be wholly settled within the 12 months after the reporting

Financial Statements 2014_
Waverley Council Notes to the Financial Statements for the financial year ended 30 June 2014 Note 1. Summary of Significant Accounting Policies
page 24
period) are recognised in the provision for employee benefits. These liabilities are measured at the present value of the expected future payments to be made using the projected unit credit method. Consideration is given to expected future wage and salary levels, experience of employee departures and periods of service. Expected future payments are then discounted using market yields at the reporting date based on national government bonds with terms to maturity and currency that match as closely as possible the estimated future cash outflows. Due to the nature of when and how Long Service Leave can be taken, all Long Service Leave for employees with 4 or more years of service has been classified as Current, as it has been deemed that Council does not have the unconditional right to defer settlement beyond 12 months – even though it is not anticipated that all employees with more than 4 years service (as at reporting date) will apply for and take their leave entitlements in the next 12 months. (iii) Retirement benefit obligations All employees of the Council are entitled to benefits on retirement, disability or death. Council contributes to various defined benefit plans and defined contribution plans on behalf of its employees. Defined Benefit Plans A liability or asset in respect of defined benefit superannuation plans would ordinarily be recognised in the balance sheet, and measured as the present value of the defined benefit obligation at the reporting date plus unrecognised actuarial gains (less unrecognised actuarial losses) less the fair value of the superannuation fund’s assets at that date and any unrecognised past service cost. The present value of the defined benefit obligation is based on expected future payments which arise from membership of the fund to the reporting date, calculated annually by independent actuaries using the projected unit credit method. Consideration is given to expected future wage and salary levels,
experience of employee departures and periods of service. However, when this information is not reliably available, Council can account for its obligations to defined benefit plans on the same basis as its obligations to defined contribution plans – i.e. as an expense when they become payable. Council is party to an Industry Defined Benefit Plan under the Local Government Superannuation Scheme, named the “Local Government Superannuation Scheme – Pool B” This Scheme has been deemed to be a “multi employer fund” for the purposes of AASB 119. Sufficient information is not available to account for the Scheme as a defined benefit plan (in accordance with AASB 119) because the assets to the scheme are pooled together for all Councils. The last valuation of the Scheme was performed by Mr Martin Stevenson BSc, FIA, FIAA on 20th February 2013 and covers the period ended 30 June 2018. However the position is monitored annually and the Actuary has estimated that as at 30 June 2014 the prior period deficit still exists. Effective from 1 July 2009, employers are required to contribute additional contributions to assist in extinguishing this deficit. The amount of employer contributions to the defined benefit section of the Local Government Superannuation Scheme and recognised as an expense and disclosed as part of Superannuation Expenses at Note 4(a) for the year ending 30 June 2014 was $ 620,156. The amount of additional contributions included in the total employer contribution advised above is $2,480,624. The share of this deficit that can be broadly attributed to Council is estimated to be in the order of $1,271,530 as at 30 June 2014. Council’s share of that deficiency cannot be accurately calculated as the Scheme is a mutual arrangement where assets and liabilities are pooled together for all member councils.
Financial Statements 2014_
Waverley Council Notes to the Financial Statements for the financial year ended 30 June 2014 Note 1. Summary of Significant Accounting Policies
page 25
For this reason, no liability for the deficiency has been recognised in these financial statements. Council has, however, disclosed a contingent liability in Note 18 to reflect the possible obligation that may arise should the Scheme require immediate payment to correct the deficiency. Defined Contribution Plans Contributions to Defined Contribution Plans are recognised as an expense as they become payable. Prepaid contributions are recognised as an asset to the extent that a cash refund or a reduction in the future payments is available. (iv) Employee Benefit On-Costs Council has recognised at year end the aggregate on-cost liabilities arising from employee benefits, and in particular those on-cost liabilities that will arise when payment of current employee benefits is made in future periods. These amounts include Superannuation and Workers Compensation expenses which will be payable upon the future payment of certain Leave Liabilities accrued as at 30/6/14. (y) Self insurance Council does not self insure. (z) Allocation between current and non-current assets & liabilities In the determination of whether an asset or liability is classified as current or non-current, consideration is given to the time when each asset or liability is expected to be settled. The asset or liability is classified as current if it is expected to be settled within the next 12 months, being the Council’s operational cycle. Exceptions In the case of liabilities where Council does not have the unconditional right to defer settlement beyond 12 months (such as vested long service leave), the
liability is classified as current even if not expected to be settled within the next 12 months. In the case of inventories that are “held for trading”, these are also classified as current even if not expected to be realised in the next 12 months. (aa) Taxes The Council is exempt from both Commonwealth Income Tax and Capital Gains Tax. Council does however have to comply with both Fringe Benefits Tax and Goods and Services Tax (GST). Goods & Services Tax (GST) Income, expenses and assets are all recognised net of the amount of GST, except where the amount of GST incurred is not recoverable from the Australian Tax Office (ATO). In these circumstances the GST is recognised as part of the cost of acquisition of the asset or as part of the revenue / expense. Receivables and payables within the Balance Sheet are stated inclusive of any applicable GST. The net amount of GST recoverable from or payable to the ATO is included as a current asset or current liability in the Balance Sheet. Operating cash flows within the Cash Flow Statement are on a gross basis, ie. they are inclusive of GST where applicable. Investing and Financing cash flows are treated on a net basis (where recoverable form the ATO), ie. they are exclusive of GST. Instead, the GST component of investing and financing activity cash flows which are recoverable from or payable to the ATO are classified as operating cash flows. Commitments and contingencies are disclosed net of the amount of GST recoverable from (or payable to) the ATO.

Financial Statements 2014_
Waverley Council Notes to the Financial Statements for the financial year ended 30 June 2014 Note 1. Summary of Significant Accounting Policies
page 26
(ab) New accounting standards and interpretations Certain new (or amended) accounting standards and interpretations have been published that are not mandatory for reporting periods ending 30 June 2014. Council has not adopted any of these standards early. Council’s assessment of the impact of these new standards and interpretations is set out below. Applicable to Local Government with implications: AASB 9 Financial Instruments, associated standards, AASB 2010-7 Amendments to Australian Accounting Standards arising from AASB 9 and AASB 2012-6 Amendments to Australian Accounting Standards – Mandatory Effective Date of AASB 9 and transitional disclosures and AASB 2013-9 Amendments to Australian Accounting Standards – Conceptual Framework, Materiality and Financial Instruments (effective from 1 January 2017) AASB 9 Financial Instruments addresses the classification, measurement and de-recognition of financial assets and financial liabilities. The standard is not applicable until 1 January 2015 but is available for early adoption. When adopted, the standard will affect in particular Council’s accounting for its available-for-sale financial assets, since AASB 9 only permits the recognition of fair value gains and losses in other comprehensive income if they relate to equity investments that are not held for trading. Fair value gains and losses on available-for-sale debt investments, for example, will therefore have to be recognised directly in profit or loss although there is currently a proposal by the IASB to introduce a Fair value through Other Comprehensive Income category for debt instruments. There will be no impact on Council’s accounting for financial liabilities, as the new requirements only affect the accounting for financial liabilities that are designated at fair value through profit or loss and Council does not have any such liabilities.
The de-recognition rules have been transferred from AASB 139 Financial Instruments: Recognition and Measurement and have not been changed. The Council has not yet fully assessed the impact on the reporting financial position and performance on adoption of AASB 9. Applicable to Local Government but no implications for Council; AASB 2013-3 Amendments to AASB 136 Recoverable Amount Disclosures for Non-Financial Assets (effective for 30 June 2015 Financial Statements) There are no changes to reported financial position or performance from AASB 2013 – 3, however additional disclosures may be required. Applicable to Local Government but not relevant to Council at this stage; AASB 10 Consolidated Financial Statements, AASB 11 Joint Arrangements, AASB 12 Disclosure of Interests in Other Entities, revised AASB 127 Separate Financial Statements and AASB 128 Investments in Associates and Joint Ventures and AASB 2011-7 Amendments to Australian Accounting Standards arising from the Consolidation and Joint Arrangements Standards (effective for 30 June 2015 Financial Statements for not-for-profit entities) This suite of five new and amended standards address the accounting for joint arrangements, consolidated financial statements and associated disclosures. AASB 10 replaces all of the guidance on control and consolidation in AASB 127 Consolidated and Separate Financial Statements, and Interpretation 12 Consolidation – Special Purpose Entities. The core principle that a consolidated entity presents a parent and its subsidiaries as if they are a single economic entity remains unchanged, as do the mechanics of consolidation. However, the standard introduces a single definition of control that applies to all entities. It focuses on the need to have both power and rights or exposure to variable returns.

Financial Statements 2014_
Waverley Council Notes to the Financial Statements for the financial year ended 30 June 2014 Note 1. Summary of Significant Accounting Policies
page 27
Power is the current ability to direct the activities that significantly influence returns. Returns must vary and can be positive, negative or both. Control exists when the investor can use its power to affect the amount of its returns. There is also new guidance on participating and protective rights and on agent/principal relationships. Council does not expect the new standard to have a significant impact on its composition. AASB 11 introduces a principles based approach to accounting for joint arrangements. The focus is no longer on the legal structure of joint arrangements, but rather on how rights and obligations are shared by the parties to the joint arrangement. Based on the assessment of rights and obligations, a joint arrangement will be classified as either a joint operation or a joint venture. Joint ventures are accounted for using the equity method, and the choice to proportionately consolidate will no longer be permitted. Parties to a joint operation will account their share of revenues, expenses, assets and liabilities in much the same way as under the previous standard. AASB 11 also provides guidance for parties that participate in joint arrangements but do not share joint control. Council's investment in the joint venture partnership will be classified as a joint venture under the new rules. As Council already applies the equity method in accounting for this investment, AASB 11 will not have any impact on the amounts recognised in its financial statements. AASB 12 sets out the required disclosures for entities reporting under the two new standards, AASB 10 and AASB 11, and replaces the disclosure requirements currently found in AASB 127 and AASB 128. Application of this standard by Council will not affect any of the amounts recognised in the financial
statements, but will impact the type of information disclosed in relation to Council's investments. Amendments to AASB 128 provide clarification that an entity continues to apply the equity method and does not remeasure its retained interest as part of ownership changes where a joint venture becomes an associate, and vice versa. The amendments also introduce a “partial disposal” concept. Council is still assessing the impact of these amendments. Council does not expect to adopt the new standards before their operative date. They would therefore be first applied in the financial statements for the annual reporting period ending 30 June 2015. Not applicable to Local Government per se; None There are no other standards that are “not yet effective” and expected to have a material impact on Council in the current or future reporting periods and on foreseeable future transactions. (ac) Rounding of amounts Unless otherwise indicated, amounts in the financial statements have been rounded off to the nearest thousand dollars. (ad) Comparative Figures To ensure comparability with the current reporting period’s figures, some comparative period line items and amounts may have been reclassified or individually reported for the first time within these financial statements and/or the notes. (ae) Disclaimer Nothing contained within these statements may be taken to be an admission of any liability to any person under any circumstance.

Waverley Council
Notes to the Financial Statements for the financial year ended 30 June 2014
Note 2(a). Council Functions / Activities - Financial Information
9,748
179 - - 31,218 31,531
(1,081) 622 683 41,455 38,269 (170) 3,117 2,553 6,875 6,908
- - - 7 930 1,909 20,026 27,709
- 3 60 83 Cemetery Services 1,185 1,350 1,331 1,082 1,249 1,152 103 101 Beach Services, Maintenance & Safety 720 694 641 3,416 3,594 3,449 (2,696) (2,900)
Child Care Services 6,283 6,800 5,558 5,987 6,400 5,728 296 400 Community Services 842 1,052 863 2,116 2,175 1,944 (1,274) (1,123)
Cultural Services 384 441 375 1,702 3,346 2,960 (1,318) (2,905) Corporate Support Services 44,950 44,806 40,777 12,030 9,605 8,355 32,920 35,201
6,573 Customer Services & Communication 15 11 11 1,076 1,257 1,111 (1,061) (1,246) (1,100) - - 8 3 Development, Building & Health Services 4,284 6,972 8,435 8,346 9,249 8,688 (4,062) (2,277)
438 Emergency Management Services 35 29 111 126 132 140 (91) (103) (29) - - - Environmental Services 371 658 354 69
10 138 -
154 1,424 1,589 1,320 (1,053) (931)
93 - - 15 Library Services 226 336 262 4,125 4,089
Governance, Integrated Planning & Community Engagement 66 2 89 4,514 4,609 4,915 (4,448) (4,607)
13,317 10,928 Parks Services & Maintenance 176 341 166 4,938 6,534
175 178 29,984 31,404 24,573 11,581 10,589 10,650 15,232 16,160 13,923 2 -
103,773 801 947 763 549 687 79 252 118
106,547
1,087 960 5 244 (363) (5)
3,772 (3,809) (3,851)
24,679 1,632 296 362 (45) - - -
16,821 62 (1,409) 110 114 7,512
1,566
51,267 12,365 12,489 25,836 22,607
3 47 465 725 807 (405) (692) 130
6,155 (4,762) (6,193)
- - - 260 - - - Place Management 842
Traffic & Transport Services - - 156 363
Asset Management Services
Regulatory Services 1,572 1,928 1,587 1,276 Social & Affordable Housing 865 900 828 515
Recreation Services 60 33
Parking Services 26,813 26,749
Urban Open Space Maintenance & Accessibility 184 278 260 3,993 4,129 Waste Services 16,349 16,532 15,802 16,287 17,941
157,489 Total Functions & Activities 115,462 111,961 113,026 123,078 916,375 931,510
(6,975) 759 1,169 652,603 623,870
(3,512) - - - 10
- 156 - 79 22,002 -
6,192 10,340 45,528 6,972
25,431
-
20 -
(3,899) (3,753) (4,826)
32,422
(2,808)
(1,019) 105,122
19,464
4,168
10,052
350 (187) (132)
(760)
(5,989)
(3,906)
(1,166)
(253)
(2,585)
(10,242)
(88)
Actual Actual Actual 2014 2013
$ '000 Income, Expenses and Assets have been directly attributed to the following Functions / Activities.Details of these Functions/Activities are provided in Note 2(b).
Income from Continuing Operations
Expenses from Continuing Operations
Total Assets held (Current &
Non-current) Functions/Activities
20142013Actual Actual Actual
Grants included in Income from Continuing Operations
Budget 2014
Original Actual
Operating Result from Continuing Operations
Original Budget
page 28
20142014Actual
Original
Financial Statem
ents 2014
2014Actual
2013Actual
2013 20142014 2013Budget
Financial Statements 2014
page 29
Waverley Council
Notes to the Financial Statements for the financial year ended 30 June 2014
Note 2(b). Council Functions / Activities - Component Descriptions
Details relating to the Council's functions / activities as reported in Note 2(a) are as follows:
Asset Management Services
Beach Services, Maintenance & Safety
Cemetery Services
Childcare Services
Community Services
Corporate Support Services
Cultural Services
Customer Services & Communication
Development, Building & Health Services
This service includes a range of professional support services for financial planning and management,workforce planning, organisational development and performance management, business systemsimprovement, risk management and insurance, procurement, telecommunications and IT and special projects tosupport the Executive in customer service and organisational review.
Council provides and supports a range of activities that celebrate and strengthen an appreciation or our culturalheritage and diversity.
This area is responsible for ensuring that customer service is provided in a professional, friendly and timely way,and that our community is informed about Council's plans, initiatives, services and activities.
This service involves preparing new Local Environmental Plans, Development Control Plans and PlanningStrategies relating to future land use planning and heritage conservation.
It also assesses and determines development applications in accordance with the EP&A Act and providesCouncil with a digital mapping service.
This service includes planning for renewal of assets, financial management and project delivery of works on vitalinfrastructure. The Service contributes to every aspect of Council's operations, to our ability to deliver ourservices cost effectively and to the community's social, environmental and economic well being.
This service includes beach safety, beach maintenance and cleaning and also supports voluntary surf lifesavingclubs.
This service currently includes interment of ashes and remains at two sites, Waverley and South Head.Waverley Cemetery is a fully operational Cemetery with sales in excess of $1million per annum.
Providing quality, affordable long day care and family day care for children aged 0-5 as well as parentingprograms and counselling for families.
Council provides a range of community services within Waverley in addition to supporting a broad range ofcommunity organisations. Our services and support for other groups and agencies ensure that the communityhas access to relevant, accessible and affordable facilities, spaces, programs and activities.

Financial Statements 2014
page 30
Waverley Council
Notes to the Financial Statements for the financial year ended 30 June 2014
Note 2(b). Council Functions / Activities - Component Descriptions (continued)
Details relating to the Council's functions / activities as reported in Note 2(a) are as follows:
Emergency Management Services
Environmental Services
Governance, Integrated Planning & Community Engagement
Library Services
Parking Services
Parks Services & Maintenance
Place Management
Recreation Services
Bondi Beach and Bondi Junction are important places for Waverley residents and for the wider Sydneycommunity. They contain a world famous beach and one of Sydney's most vibrant retail precincts and play asignificant role in delivering recreational and commercial experiences to the region. A Place Managementapproach has been adopted to allow Council to give special focus to these areas, as well as ensuring that oursmaller retail villages continue thrive.
An ongoing challenge for the Place Managers is to find the right balance between the needs of visitors, residentsand the business sector.
This includes all aspects of sport and active leisure, from broad LGA-wide planning, through to the detaileddesign and construction of specific facilities. A newly emerging area is sports facilities management,programming and maintenance.
This is a growing service area covering all aspects of the aquatic, biological and air enviroments. Its sub-services are specifically geared to meet the requirements of our Environmental Action Plan 2 (EAP2) adopted inFebruary 2010. EAP2 is a key element of Waverley's resourcing strategy for Waverley Togethor 2.
This service is designed to ensure we can engage with our community in an open and responsive way,discussing and making decisions with them about their future on the basis of sound and balanced judgementand policies. It also ensures that we can be properly held to account for planning decisions and for theefficiency and effectiveness of the services we deliver.
The Library offers information, recreation and entertainment as well as opportunities for people to train, learn orsimply interact with neighbours and friends. The Library is a major education and community capacity buildingresource.
This service provides substantial community safety and amenity by ensuring that our very limited supply ofpublic parking opportunities (limited relative to demand) is shared fairly by all. This service is more effectivelydelivered if its implemented in close conjunction with Environmental Services and Traffic and TransportServices.
This service maintains and cares for Council's 99 parks. The park and reserves are divided into a numberofcategories including regional parks, coastal reserves, small parks, pocket parks, linkages and remnantvegetation.
Waverley and Woollahra have a joint relationship in funding and supporting the local SES unit and it is arequirement under the NSW State Emergency Act.
Financial Statements 2014
page 31
Waverley Council
Notes to the Financial Statements for the financial year ended 30 June 2014
Note 2(b). Council Functions / Activities - Component Descriptions (continued)
Details relating to the Council's functions / activities as reported in Note 2(a) are as follows:
Regulatory Services
Social & Affordable Housing
Traffic & Transport Services
Urban Open Space Maintenance & Accessibility
Waste Services
This service maintains the roads, footpaths, drains, trees and grass along the 123.46 km of local and regionalroads within Waverley Council.
This service provides waste and recycling collection services to 28,500 residential properties as well as acommercial collection to businesses within Waverley Council.
In the summer season there is an increased demand for this service due to the large influx of visitors. Core areas of focus are:
Monitoring building sites to ensure adequate pollution control is in place Ensuring companion animals are effectively and responsibly managed and cared for in accordance with the Companion Animals Act and Regulation Providing education material and information to the public investigating reports of abandoned vehicles and removing them in accordance with Impounding Act The quantitative volume of noise, time, place and the frequency of the noise
This service includes creating and managing secure housing for local people on very low incomes in addition toproviding medium term accomodation at subsidised rents to those on low-to-middle income levels.
This service helps ensure that traffic flows as smoothly, efficiently and safely in Waverley as is possible, giventhe very small amount of road space we have to share, relative to the very high demand of the residents andvisitors who use it.
The service also functions to help provide as many alternatives as possible to private car use including planningand design of pedestrian and cycling routes, and negotiation with the community and other levels of governmentfor improved traffic and parking distribution systems such as residential preferred parking schemes.

Financial Statements 2014
page 32
Waverley Council
Notes to the Financial Statements for the financial year ended 30 June 2014
Note 3. Income from Continuing Operations
$ '000
(a) Rates & Annual Charges
Ordinary RatesResidentialBusinessTotal Ordinary Rates
Special RatesNil
Annual Charges (pursuant to s.496, s.496A, s.496B, s.501 & s.611)Domestic Waste Management ServicesSection 611 ChargesTotal Annual ChargesTOTAL RATES & ANNUAL CHARGES
Council has used 2012 year valuations provided by the NSW Valuer General in calculating its rates.
(b) User Charges & Fees
Specific User Charges (per s.502 - Specific "actual use" charges)Waste Management Services (non-domestic)
Total User Charges
Other User Charges & Fees(i) Fees & Charges - Statutory & Regulatory Functions (per s.608)Hoarding/Crane PermitsPlanning & Building RegulationSection 149 Certificates (EPA Act)Section 603 CertificatesTotal Fees & Charges - Statutory/Regulatory
(ii) Fees & Charges - Other (incl. General User Charges (per s.608)Admission & Service FeesBus Shelter FeesCar Parking FeesCar Parking Meter IncomeCemeteriesChild CareLeaseback Fees - Council VehiclesPark RentsRestoration ChargesRoad Opening PermitsTemporary Truck Zone PermitOtherTotal Fees & Charges - OtherTOTAL USER CHARGES & FEES
257
979
1,295 842
142 139 1,271 1,232 7,071 5,765 8,939 7,307
46 109 1,166
974 141
2,016
3,703 135
3,062
Notes 2014
42
2013
2,235
Actual
28,295 11,022
Actual
34,738
47,283
2,235
1,880 233 107
25,039 9,699
39,317
12,503
2,423 2,423
46 13,504
12,545
2,998 1,232
28,222 31,977 22,925
859 590
3,679 142
13,550 52,867
963
1,280
869
883 25,851

Financial Statements 2014
page 33
Waverley Council
Notes to the Financial Statements for the financial year ended 30 June 2014
Note 3. Income from Continuing Operations (continued)
$ '000
(c) Interest & Investment Revenue (incl. losses)
Interest & Dividends - Interest on Overdue Rates & Annual Charges (incl. Special Purpose Rates)
- Interest earned on Investments (interest & coupon payment income)
Fair Value Adjustments - Fair Valuation movements in Investments (at FV or Held for Trading)TOTAL INTEREST & INVESTMENT REVENUE
Interest Revenue is attributable to:Unrestricted Investments/Financial Assets:Overdue Rates & Annual Charges (General Fund)
General Council Cash & InvestmentsRestricted Investments/Funds - External:Development Contributions - Section 94Domestic Waste Management operationsTotal Interest & Investment Revenue Recognised
(d) Other Revenues
Fair Value Adjustments - Investment PropertiesRental Income - Investment PropertiesRental Income - Other Council PropertiesEx Gratia RatesFinesFines - ParkingLegal Fees Recovery - Rates & Charges (Extra Charges)
Legal Fees Recovery - OtherInsurance Claim RecoveriesRecycling Income (non domestic)
Sale of Abandoned VehiclesSales - GeneralOtherTOTAL OTHER REVENUE
2,210 1,320
103
2,199
2,637
2,062
69
23
112
274
56
4
5,057
42
3,716
11
108
2,647
2,647
10,738
15
Actual Notes 2013
Actual
108 2,271
1
507
115 11,173
3,780
25
21
35
23,211
14
2014
330 268
2,637
112
65 203
1 247
14
146
2,195
2,314
348
18,946 341

Financial Statements 2014
page 34
Waverley Council
Notes to the Financial Statements for the financial year ended 30 June 2014
Note 3. Income from Continuing Operations (continued)
$ '000
(e) Grants
General Purpose (Untied)Financial Assistance - General Component
Financial Assistance - Local Roads Component
Pensioners' Rates Subsidies - General Component
Total General Purpose
1 The Financial Assistance Grant for 13/14 reflects a one off reduction due to the fact that this grant is no longer being paid in advance by up to 50% as has occurred in previous years - it does not represent a loss of income but is instead a timing difference.
Specific PurposePensioners' Rates Subsidies: - Domestic Waste ManagementAged CareChild CareCommunity CareEmployment & Training ProgramsEnvironmental ProtectionLibraryLibrary - per capitaRecreation & CultureStreet LightingTransport (Roads to Recovery)
Transport (Other Roads & Bridges Funding)
OtherTotal Specific PurposeTotal Grants
Grant Revenue is attributable to:- Commonwealth Funding- State Funding- Other Funding
1
1
401
203
-
-
922
-
170
190
-
-
Capital
190
-
138
165
521
Capital
-
-
2013
922
-
922
-
-
20
- 554
-
-
190
190
207 - - -
2014
-
2013
-
69
Operating 2014
-
721
6 -
114 - -
206
6,050 287
-
110 -
3,952
2,816
6,002
643
4,867
2,947
622
- 405
1,486
- -
2,098
2,552 -
-
Operating
-
- 40 -
103
354
172 -
47 48 130
208 1,135 -
329
3,117
6,002
212 40
172
6,050
2,700
-
128
2
-
2,973

Financial Statements 2014
page 35
Waverley Council
Notes to the Financial Statements for the financial year ended 30 June 2014
Note 3. Income from Continuing Operations (continued)
$ '000
(f) Contributions
Developer Contributions:(s93 & s94 - EP&A Act, s64 of the LGA):S 93F - Contributions using Planning AgreementsS 94A - Fixed Development Consent LeviesTotal Developer Contributions
Other Contributions:Car ParkingCommunity ServicesDedications (other than by S94)
DrainageKerb & GutterOther Councils - Joint Works/ServicesPavingRecreation & CultureRoads & BridgesOtherTotal Other ContributionsTotal Contributions
TOTAL GRANTS & CONTRIBUTIONS
$ '000
(g) Restrictions relating to Grants and Contributions
Certain grants & contributions are obtained by Council on conditionthat they be spent in a specified manner:
Unexpended at the Close of the Previous Reporting Periodadd: Grants & contributions recognised in the current period but not yet spent:less: Grants & contributions recognised in a previous reporting period now spent:
Net Increase (Decrease) in Restricted Assets during the Period
Unexpended and held as Restricted Assets
Comprising: - Specific Purpose Unexpended Grants - Developer Contributions - Other Contributions
12 228 - -
2014
4,943
-
- -
3,483
-
Actual
6,550
4,708
2014
5,038
-
- -
2013
-
3,616
2013
7,446
-
-
Capital
-
4,347
426
-
10,288
10,288
7,108
4,482
9,675
6,802
2,964
-
2013
-
9,865
5,880
1,154
5,880
-
(226)
470
7,446
7,446
4,637
Capital
445
-
1,533
-
7
Operating
17 -
43
2,842
Actual
416
95
(774)
-
-
288
2014
-
Operating
-
76 2
6
- -
10
1,058
2
1
- -
116
95
6,786
784 82 552
1,058
- 322
784
9,427

Financial Statements 2014
page 36
Waverley Council
Notes to the Financial Statements for the financial year ended 30 June 2014
Note 4. Expenses from Continuing Operations
$ '000
(a) Employee Benefits & On-Costs
Salaries and WagesTravellingEmployee Leave Entitlements (ELE)
SuperannuationWorkers' Compensation InsuranceFringe Benefit Tax (FBT)
Training Costs (other than Salaries & Wages)
OtherTotal Employee Costsless: Capitalised CostsTOTAL EMPLOYEE COSTS EXPENSED
Number of "Equivalent Full Time" Employees at year end
(b) Borrowing Costs
(i) Interest Bearing Liability CostsInterest on OverdraftInterest on LoansInterest on Building DepositsTotal Interest Bearing Liability Costs Expensed
(ii) Other Borrowing CostsNilTOTAL BORROWING COSTS EXPENSED
(c) Materials & Contracts
Raw Materials & ConsumablesContractor & Consultancy CostsContractor & Consultancy Costs (Temporary Staff)
Auditors Remuneration (1)
Infringement Notice Contract Costs (SEINS)Legal Expenses: - Legal Expenses: Planning & Development - Legal Expenses: OtherOperating Leases: - Operating Lease Rentals: Minimum Lease Payments (2)
Other (Fuel & Gas)Total Materials & Contractsless: Capitalised CostsTOTAL MATERIALS & CONTRACTS
3 4
649 1,031
(22,811)
1,772
188
194
54,229
126
1,490
50,682
992
19,097
(300)
56
230
4,739
14,501
37,905 157
4,857
Actual
(197)
Actual
8,774
183
4,923
2
50,879
-
295
601
54,529 160
2013
251
186
189
17,301 17,974
480
1,171
1,681
194
25,237
1,322
51
40,586
Notes 2014
40,776 (22,802)
40,112
1,509
582
2,591
5,609
161
189
2,635
386
689
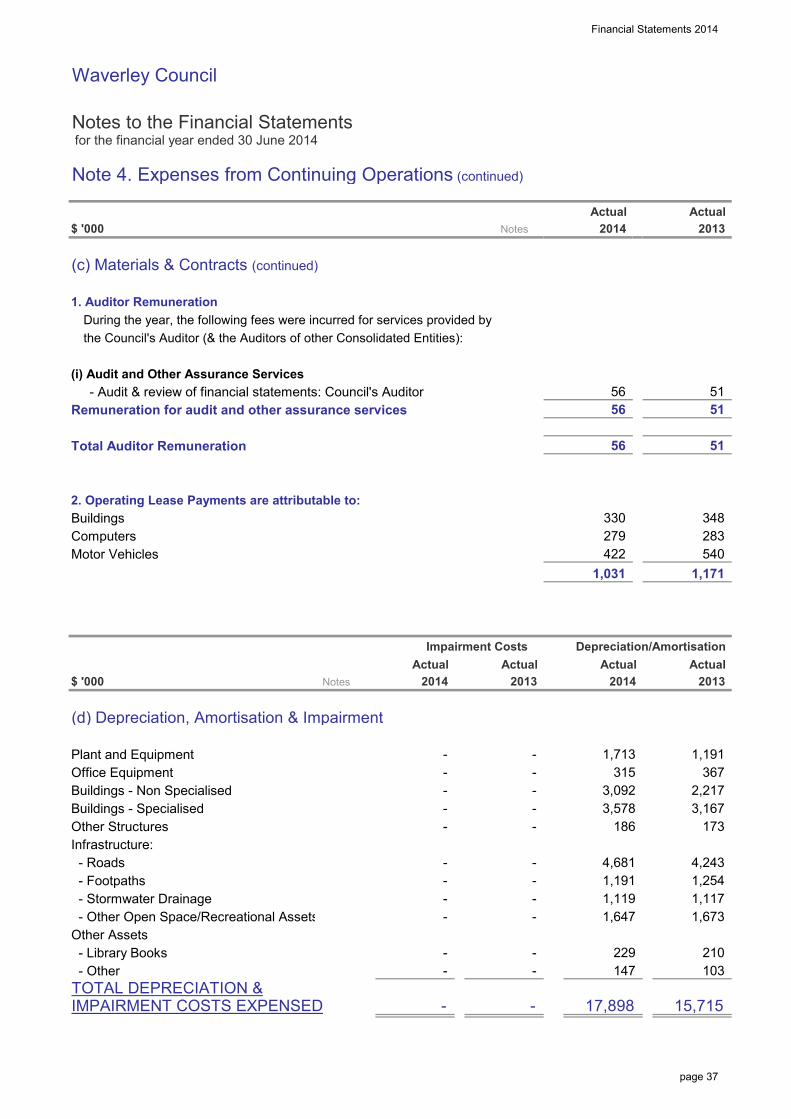
Financial Statements 2014
page 37
Waverley Council
Notes to the Financial Statements for the financial year ended 30 June 2014
Note 4. Expenses from Continuing Operations (continued)
$ '000
(c) Materials & Contracts (continued)
1. Auditor Remuneration During the year, the following fees were incurred for services provided by the Council's Auditor (& the Auditors of other Consolidated Entities):
(i) Audit and Other Assurance Services - Audit & review of financial statements: Council's AuditorRemuneration for audit and other assurance services
Total Auditor Remuneration
2. Operating Lease Payments are attributable to:BuildingsComputersMotor Vehicles
$ '000
(d) Depreciation, Amortisation & Impairment
Plant and EquipmentOffice EquipmentBuildings - Non SpecialisedBuildings - SpecialisedOther StructuresInfrastructure: - Roads - Footpaths - Stormwater Drainage - Other Open Space/Recreational AssetsOther Assets - Library Books - OtherTOTAL DEPRECIATION &IMPAIRMENT COSTS EXPENSED
2,217
Actual
3,092
283 348
422
4,243
1,117
103
Actual
540
367
56 51
186
330
2013
Actual 2014 2013
4,681
173
1,191 1,254
315
1,673
Actual 2014
1,713
17,898
Notes
15,715
229
1,647
1,191
210
3,167
1,119
1,171
279
1,031
51
51
Actual
-
Notes
-
-
-
- -
-
-
-
- - -
-
-
Actual Depreciation/Amortisation
3,578
56
56
-
2014
-
2013
-
-
- -
147
-
-
Impairment Costs
- -
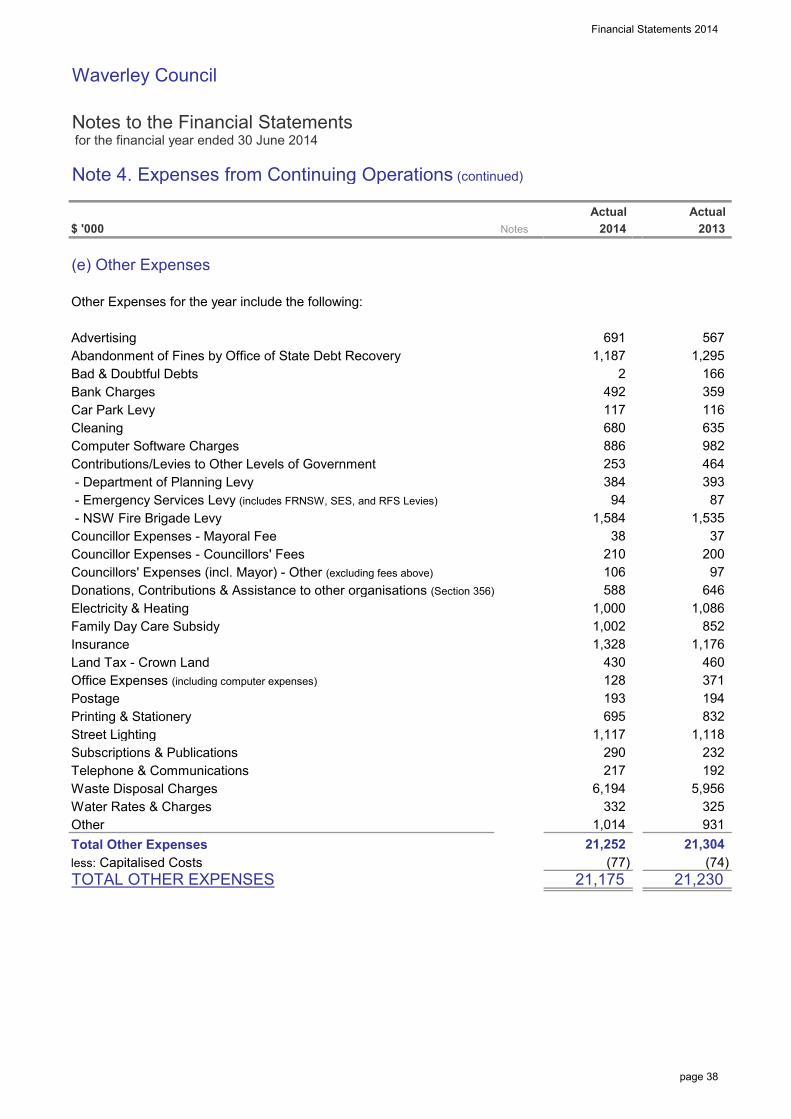
Financial Statements 2014
page 38
Waverley Council
Notes to the Financial Statements for the financial year ended 30 June 2014
Note 4. Expenses from Continuing Operations (continued)
$ '000
(e) Other Expenses
Other Expenses for the year include the following:
AdvertisingAbandonment of Fines by Office of State Debt RecoveryBad & Doubtful DebtsBank ChargesCar Park LevyCleaningComputer Software ChargesContributions/Levies to Other Levels of Government - Department of Planning Levy - Emergency Services Levy (includes FRNSW, SES, and RFS Levies)
- NSW Fire Brigade LevyCouncillor Expenses - Mayoral FeeCouncillor Expenses - Councillors' FeesCouncillors' Expenses (incl. Mayor) - Other (excluding fees above)
Donations, Contributions & Assistance to other organisations (Section 356)
Electricity & HeatingFamily Day Care SubsidyInsuranceLand Tax - Crown LandOffice Expenses (including computer expenses)
PostagePrinting & StationeryStreet LightingSubscriptions & PublicationsTelephone & CommunicationsWaste Disposal ChargesWater Rates & ChargesOtherTotal Other Expensesless: Capitalised CostsTOTAL OTHER EXPENSES
393
166 1,187 1,295
117 116
1,002 852
37
430 460
Actual 2013
21,230
325
200
87
194
646
232
2014
492
1,086
106
1,535
(74)
1,118
931
97
5,956
21,175
695
217
193
21,304
567
192
1,176
832
371
982 253
1,117
359
680
1,584
886 464
Actual
635
94
(77)
210
1,014 332
588
6,194
384
21,252
1,328
290
1,000
128
691
Notes
38
2

Financial Statements 2014
page 39
Waverley Council
Notes to the Financial Statements for the financial year ended 30 June 2014
Note 5. Gains or Losses from the Disposal of Assets
$ '000
Plant & EquipmentProceeds from Disposal - Plant & Equipmentless: Carrying Amount of P&E Assets Sold / Written OffNet Gain/(Loss) on Disposal
InfrastructureProceeds from Disposal - Infrastructureless: Carrying Amount of Infrastructure Assets Sold / Written OffNet Gain/(Loss) on Disposal
Financial Assets*Proceeds from Disposal / Redemptions / Maturities - Financial Assetsless: Carrying Amount of Financial Assets Sold / Redeemed / MaturedNet Gain/(Loss) on Disposal
Non Current Assets Classified as "Held for Sale"Proceeds from Disposal - Non Current Assets "Held for Sale"less: Carrying Amount of 'Held for Sale' Assets Sold / Written OffNet Gain/(Loss) on Disposal
NET GAIN/(LOSS) ON DISPOSAL OF ASSETS
(299)
2013Actual
545
-
(299)
10,270
(10,136)
-
-
-
10,136
(57)
(10,270)
-
(85)
2014
189 (1,561)
488
(1,533) (1,643)
(66,150)
-
110
-
66,150
Actual
57
(28)
Notes

Financial Statements 2014
page 40
Waverley Council
Notes to the Financial Statements for the financial year ended 30 June 2014
Note 6a. - Cash Assets and Note 6b. - Investments
$ '000
Cash & Cash Equivalents (Note 6a)Cash on Hand and at BankCash-Equivalent Assets1
- Deposits at Call- Managed Funds- Short Term Deposits
Total Cash & Cash Equivalents
Investments (Note 6b)- Long Term Deposits- NCD's, FRN's (with Maturities > 3 months)
- Growth SecuritiesTotal InvestmentsTOTAL CASH ASSETS, CASHEQUIVALENTS & INVESTMENTS
1 Those Investments where time to maturity (from date of purchase) is < 3 mths.
Cash, Cash Equivalents & Investments wereclassified at year end in accordance withAASB 139 as follows:
Cash & Cash Equivalentsa. "At Fair Value through the Profit & Loss"
Investmentsa. "At Fair Value through the Profit & Loss"- "Held for Trading"b. "Held to Maturity"c. "Loans & Receivables"d. "Available for Sale"Investments
Refer to Note 27 - Fair Value Measurement for information regarding the fair value of investments held.
-
7,000 -
- 7,000
-
7,000
Non Current
-
Actual 2013
- 7,000
-
7,000
-
-
4,800
3,476
874
- 1,860
-
-
31,750
Actual
- -
4,800
Actual Non Current
5,854
8,715 23,000
1,616
-
35,226
2014
33,640
7,189
18,573
950 6,510
23,000
33,640
6(b-i)
6(b-iv) - - -
-
-
1,925
6(b-iii)
18,573
-
10,640
-
4,800
- 31,750
-
6(b-ii)
52,213
9,362
44,588
2,400
2013
Current
-
9,362
158
4,800
35,226
4,000
4,800
-
Notes
2014Actual
Current

Financial Statements 2014
page 41
Waverley Council
Notes to the Financial Statements for the financial year ended 30 June 2014
Note 6b. Investments (continued)
$ '000
Note 6(b-i)Reconciliation of Investments classified as"At Fair Value through the Profit & Loss"Balance at the Beginning of the YearRevaluations (through the Income Statement)AdditionsDisposals (sales & redemptions)
Balance at End of Year
Comprising:- NCD's, FRN's (with Maturities > 3 months)- Growth Securities
Total
Note 6(b-ii)Reconciliation of Investmentsclassified as "Held to Maturity"Balance at the Beginning of the YearAdditionsDisposals (sales & redemptions)
Transfers between Current/Non CurrentBalance at End of Year
Comprising:- Long Term Deposits
Total
Note 6(b-iii)Reconciliation of Investmentsclassified as "Loans & Receivables"Nil
Note 6(b-iv)Reconciliation of Investmentsclassified as "Available for Sale"Nil
-
-
- -
Actual 2013
-
7,000
(66,150)
23,000
23,000
Non Current
7,000
-
-
7,000
4,000
3,000 22,750
1,616
(3,000)
7,000
-
(6,000)
4,800
31,750
-
12,000
-
(4,136)
2014
Current Actual
Current
1,925
Actual
3,476
6,834
23,000
10,640
-
330
10,640
53,400 31,750
8,715 -
3,476
-
3,476 - 1,860
2013
268 -
Actual 2014
Non Current
-
-
-
7,344
(4,000)
-
7,000
-
4,800
3,000
31,750 31,750
4,800
1,800

Financial Statements 2014
page 42
Waverley Council
Notes to the Financial Statements for the financial year ended 30 June 2014
Note 6c. Restricted Cash, Cash Equivalents & Investments - Details
$ '000
Total Cash, Cash Equivalentsand Investments
attributable to:External Restrictions (refer below)
Internal Restrictions (refer below)
Unrestricted
$ '000
Details of Restrictions
External Restrictions - Included in LiabilitiesNil
External Restrictions - OtherDeveloper Contributions - General (D)Specific Purpose Unexpended Grants (F)Domestic Waste Management (G)OtherExternal Restrictions - OtherTotal External Restrictions
D Development contributions which are not yet expended for the provision of services and amenities in accordancewith contributions plans (refer Note 17).
F Grants which are not yet expended for the purposes for which the grants were obtained. (refer Note 1) G Water, Sewerage, Domestic Waste Management (DWM) & other Special Rates/Levies/Charges are externally
restricted assets and must be applied for the purposes for which they were raised.
2014 Closing Transfers from
- 41,536
44,588
7,000
6,427
Opening
470
Actual
(25) 6,550
Restrictions
- 52,213
3,856
2014
3,112
(2,596) 13,400
1,563
10,577 5,419
- 416 13,400
2014
10,577
Current
8,600
Balance
3,131 -
5,419
2,077
4,800 52,213
426
4,800
- 4,800
Transfers to
Non Current Actual
7,000
-
Non Current
20132013Actual
44,588
Current Actual
Balance
7,000
Restrictions
34,584 3,577
445 (1,582)
9,427
(2,596) (10)
(979)

Financial Statements 2014
page 43
Waverley Council
Notes to the Financial Statements for the financial year ended 30 June 2014
Note 6c. Restricted Cash, Cash Equivalents & Investments - Details (continued)
$ '000
Internal RestrictionsPlant & Vehicle ReplacementInfrastructure ReplacementEmployees Leave EntitlementCarry Over WorksDeposits, Retentions & BondsIT Equipment & UpgradeInsurance ClaimsParking MetersParking - Off-StreetStreet Tree (Sewer) Aerial BuildingAffordable HousingSocial HousingFuture Capital WorksUnexpended LoansCemetery FundsInvestment StrategyLooking Good Election OtherTotal Internal Restrictions
TOTAL RESTRICTIONS
251
- 1,271
1,191
1,072 607
3,919
3,110 4,796 -
(2,076)
4,445
Restrictions
- 134
330
(1)
(2,098)
(8,345) (217)
252
-
(134)
- (197)
1,823 -
281
-
(46) 6,886
165 -
75
3,035
-
2,637 905
(3,770) 750
474
2014
1,027 1,970
Closing
(784)
Restrictions Transfers to
Balance
1,727
Balance
6,988
249 1,141
1,360 34,584
54,936
- 25,945
15,634
200
(18,993)
59
1,704
45,161
(1,110) 250 41,536
(21,589)
566 4,092
468 1,459
1,625
855
2,357 5,117 900
-
31,364
3,891
200
175
130
-
252
8,646
Opening
533
(215)
- 81
Transfers from

Financial Statements 2014
page 44
Waverley Council
Notes to the Financial Statements for the financial year ended 30 June 2014
Note 7. Receivables
$ '000
PurposeRates & Annual ChargesInterest & Extra ChargesUser Charges & FeesCapital Debtors (being sale of assets)
- Sale of LandAccrued Revenues - Interest on Investments - Other Income AccrualsGovernment Grants & SubsidiesDeferred DebtorsNet GST ReceivableParking FinesTotal
less: Provision for ImpairmentUser Charges & FeesParking FinesTotal Provision for Impairment - Receivables
TOTAL NET RECEIVABLES
Externally Restricted ReceivablesDomestic Waste ManagementTotal External RestrictionsInternally Restricted ReceivablesNilUnrestricted ReceivablesTOTAL NET RECEIVABLES
Notes on Debtors above:(i) Rates & Annual Charges Outstanding are secured against the property.
(ii) Doubtful Rates Debtors are provided for where the value of the property is less than the debt outstanding. An allowance for other doubtful debts is made when there is objective evidence that a receivable is impaired.
(iii) Interest was charged on overdue rates & charges at 9.00% (2013 10.00%).Generally all other receivables are non interest bearing.
(iv) Please refer to Note 15 for issues concerning Credit Risk and Fair Value disclosures.
(2,184) (2,184) -
Notes
231
852
Current
3,339
2013Current Non Current
149 824
52
-
4,144
-
2,672
23
Non Current
500
32
-
290
490
-
(2,184)
311
- - 1,977
7,950
7,876
595
7,809
800 -
3,620 -
113 536
(67)
974
500
7,809
127
2014
229
401
1,732
-
-
-
3,054
2,825
153 536
7,414
153
(67)
113 595
-
67
-
-
7,214
32
-
211
1,286
1,619 1,732
7,950
(88) (2,184)
324
3,916 8,038
(88)
2,825
5,009
-
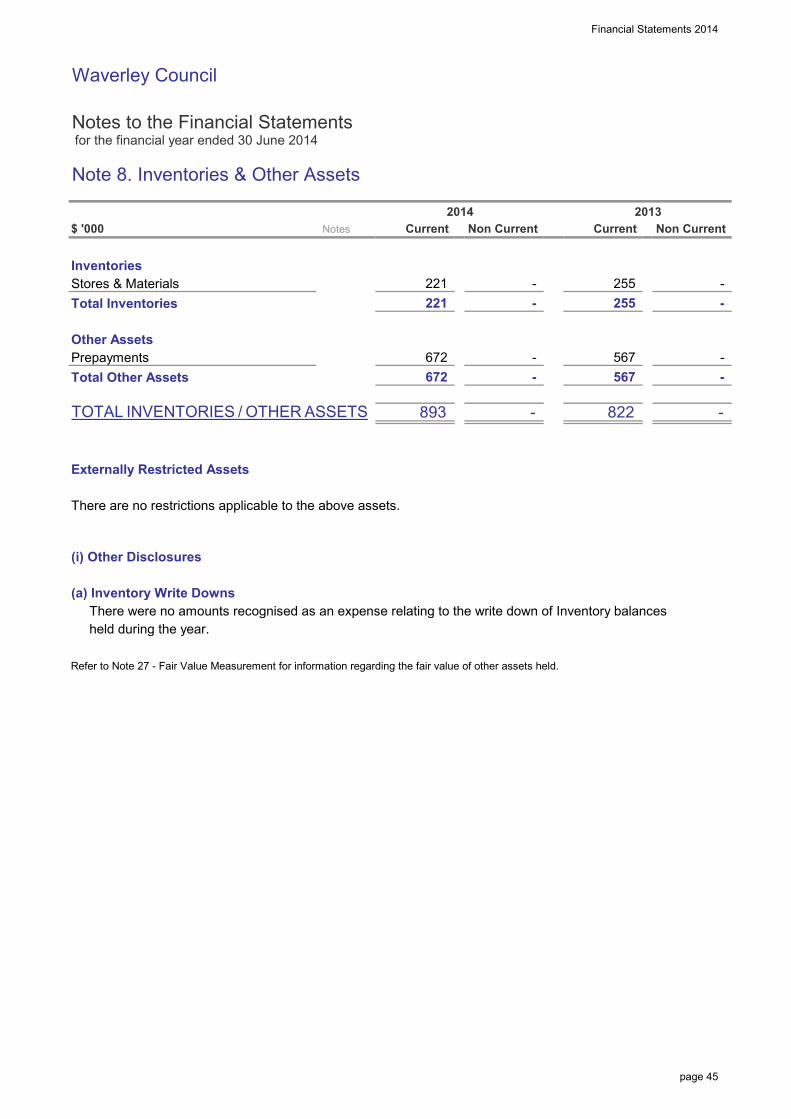
Financial Statements 2014
page 45
Waverley Council
Notes to the Financial Statements for the financial year ended 30 June 2014
Note 8. Inventories & Other Assets
$ '000
InventoriesStores & MaterialsTotal Inventories
Other AssetsPrepaymentsTotal Other Assets
TOTAL INVENTORIES / OTHER ASSETS
Externally Restricted Assets
There are no restrictions applicable to the above assets.
(i) Other Disclosures
(a) Inventory Write DownsThere were no amounts recognised as an expense relating to the write down of Inventory balances held during the year.
Refer to Note 27 - Fair Value Measurement for information regarding the fair value of other assets held.
Non Current
- 672
2013
893
Current
672 567
Current
-
- 255
822
Non Current
-
Notes
-
221 221
-
2014
-
-
-
-
255
567

Waverley Council
Notes to the Financial Statements for the financial year ended 30 June 2014
Note 9a. Infrastructure, Property, Plant & Equipment
At At Carrying At At Carrying
$ '000 Cost Fair Value Dep'n Impairment Value Cost Fair Value Dep'n Impairment Value
Capital Work in Progress 3,707 - - - 3,707 11,063 - (118) (2,153) - 12,499 - - - 12,499 Plant & Equipment - 16,630 8,229 - 8,401 1,168 (85) (1,713) - 1 - 17,302 9,530 - 7,772 Office Equipment - 8,844 7,596 - 1,248 165 - (315) - 23 - 9,025 7,904 - 1,121 Land: - Operational Land - 69,893 - - 69,893 - (329) - - - - 69,564 - - 69,564 - Community Land - 145,835 - - 145,835 - - - - - - 145,835 - - 145,835 Buildings - Non Specialised - 104,573 33,907 - 70,666 1,158 - (3,092) - - - 105,733 37,001 - 68,732 Buildings - Specialised - 105,587 48,747 - 56,840 6,796 (1,334) (3,578) 1,182 - - 109,193 49,287 - 59,906 Other Structures - 11,399 5,920 - 5,479 101 - (186) 65 - - 18,305 12,846 - 5,459 Infrastructure: - Roads - 310,076 133,752 - 176,324 6,100 - (4,563) 22 - - 342,770 164,887 - 177,883 - Footpaths - 42,612 14,277 - 28,335 1,451 - (1,191) 89 - - 44,151 15,467 - 28,684 - Stormwater Drainage - 111,518 38,287 - 73,231 256 - (1,119) 129 - - 111,903 39,406 - 72,497 - Other Open Space/Recreational Assets - 84,604 33,313 - 51,291 200 - (1,647) 16 - - 51,507 1,647 - 49,860 Other Assets: - Library Books - 7,381 6,197 - 1,184 211 - (229) - (14) - 2,887 1,735 - 1,152 - Other - 4,849 1,658 - 3,191 530 - (147) 650 (10) - 6,022 1,808 - 4,214 TOTAL INFRASTRUCTURE,PROPERTY, PLANT & EQUIP.
Additions to Buildings & Infrastructure Assets are made up of Asset Renewals ($9,711) and New Assets ($11,772).Renewals are defined as the replacement of existing assets (as opposed to the acquisition of new assets).
Refer to Note 27 - Fair Value Measurement for information regarding the fair value of other Infrastructure, Property, Plant & Equipment.
as at 30/6/2014
Asset Additions
WDVof Asset
Disposals
Depreciation Expense Accumulated
3,707 1,023,801 331,883 - 695,625
as at 30/6/2013Asset Movements during the Reporting Period
AccumulatedWIP
Transfers
Adjustments
& Transfers
29,199 (1,748) (17,898) -
page 46
Financial Statem
ents 2014
12,499 1,034,197 341,518 - - 705,178

Financial Statements 2014
page 47
Waverley Council
Notes to the Financial Statements for the financial year ended 30 June 2014
Note 9b. Externally Restricted Infrastructure, Property, Plant & Equipment
Note 9c. Infrastructure, Property, Plant & Equipment - Current Year Impairments
Council has recognised no impairment losses during the reporting period nor reversed any prior period losses.
2013
8,772 4,577
Actual
3,389
Actual
4,195 5,383 8,772
Carrying ValueCost
AtCarrying Value
At A/Dep &Fair ValueFair Value Impairm'tImpairm't
8,772 - 4,195 3,389 3,389 4,195 4,577 -
TOTAL RESTRICTED I,PP&E
Domestic Waste Management8,772 5,383
$ '000
Class of Asset
Actual
At A/Dep &At2014
- Total DWM
Cost
-
Actual
Plant & Equipment5,383 8,772 -
- 8,772 4,577

Financial Statements 2014
page 48
Waverley Council
Notes to the Financial Statements for the financial year ended 30 June 2014
Note 10a. Payables, Borrowings & Provisions
$ '000
PayablesGoods & Services - operating expenditureGoods & Services - capital expenditurePayments Received In AdvanceAccrued Expenses: - Borrowings - Salaries & Wages - Other Expenditure AccrualsSecurity Bonds, Deposits & RetentionsBuilders DepositsOtherTotal Payables
BorrowingsLoans - Secured 1
Total Borrowings
ProvisionsEmployee Benefits;Annual LeaveSick LeaveLong Service LeaveGratuitiesTime Off in LieuTotal Provisions
Total Payables, Borrowings & Provisions
(i) Liabilities relating to Restricted Assets
Externally Restricted AssetsDomestic Waste ManagementLiabilities relating to externally restricted assets
Internally Restricted AssetsNil
Total Liabilities relating to restricted assetsTotal Liabilities relating to Unrestricted AssetsTOTAL PAYABLES, BORROWINGS & PROVISIONS
1. Loans are secured over the General Rating Income of Council Disclosures on Liability Interest Rate Risk Exposures, Fair Value Disclosures & Security can be found in Note 15.
895 210
8,540
38,965
210
3,523
129
129
1,705
755
3,523
2013
33,714
129
Current
283 18,958
895
33,714
210 33,504
895
1,252
13,504
1,918 3,035
-
2014
-
3,097
- 25
1,009 -
1,002
- 39
-
-
-
-
Non Current
1,252
4,939
3,394 2,460
542
Current
542
1,117
8,413
755
39,860
- 21,076
1,918
39,860
5,979
3,035
6,639 - -
37
17,667
-
1,117
- -
-
929 - 8,995
2013Non Current
1,424 2,816
Current
-
-
215
- -
Notes Non Current
313 741
-
-
- 2,939 488
- 2,704
-
488
2,460
Non Current
- 2,257
-
288 -
Current 2014
1,320
-
755
4,921
1,341

Financial Statements 2014
page 49
Waverley Council
Notes to the Financial Statements for the financial year ended 30 June 2014
Note 10a. Payables, Borrowings & Provisions (continued)
$ '000
(ii) Current Liabilities not anticipated to be settled within the next 12 months
The following Liabilities, even though classified as current, are not expectedto be settled in the next 12 months.
Provisions - Employees BenefitsPayables - Security Bonds, Deposits & Retentions
Note 10b. Description of and movements in Provisions
a. Employees Leave Entitlements & On-Costs represents those benefits accrued and payable and an estimate of thosethat will become payable in the future as a result of past service.
2013
17,288
Actual
-
7,431 18,197
- -
12,749
ClosingBalance
as at 30/6/14
2,704 4,921
10,766
Remeasurement effects due to
Discounting
-
- -
18,209
-
-
(489) Other Leave (enter deta
19,446 4,372 (5,609) Gratuities (911) 2,257 (5)
288 1,341
TOTAL
Decrease due to Payments
Additional Provisions
OpeningBalance
as at 1/7/13
4,539
2013
- Annual LeaveSick Leave 1,125 Long Service Leave
2,939 2,471
(1,360) 9,028
Actual
416
Class of Provision
365
(2,489)
- (360) 283 -
Unused amounts reversed
2014
2014
4,939
8,955 -
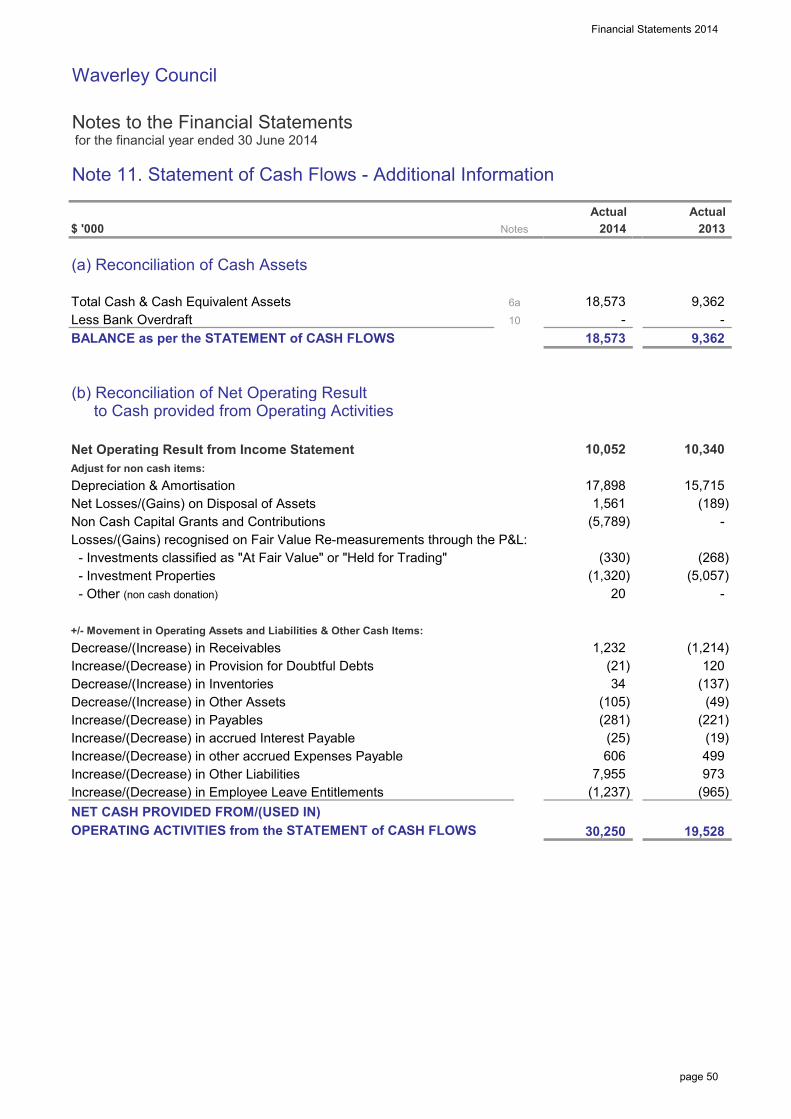
Financial Statements 2014
page 50
Waverley Council
Notes to the Financial Statements for the financial year ended 30 June 2014
Note 11. Statement of Cash Flows - Additional Information
$ '000
(a) Reconciliation of Cash Assets
Total Cash & Cash Equivalent AssetsLess Bank OverdraftBALANCE as per the STATEMENT of CASH FLOWS
(b) Reconciliation of Net Operating Result to Cash provided from Operating Activities
Net Operating Result from Income StatementAdjust for non cash items:Depreciation & AmortisationNet Losses/(Gains) on Disposal of AssetsNon Cash Capital Grants and ContributionsLosses/(Gains) recognised on Fair Value Re-measurements through the P&L: - Investments classified as "At Fair Value" or "Held for Trading" - Investment Properties - Other (non cash donation)
+/- Movement in Operating Assets and Liabilities & Other Cash Items:Decrease/(Increase) in ReceivablesIncrease/(Decrease) in Provision for Doubtful DebtsDecrease/(Increase) in InventoriesDecrease/(Increase) in Other AssetsIncrease/(Decrease) in PayablesIncrease/(Decrease) in accrued Interest PayableIncrease/(Decrease) in other accrued Expenses PayableIncrease/(Decrease) in Other LiabilitiesIncrease/(Decrease) in Employee Leave EntitlementsNET CASH PROVIDED FROM/(USED IN)OPERATING ACTIVITIES from the STATEMENT of CASH FLOWS
Actual
9,362
(105) (281)
Notes
30,250
606
18,573
Actual
(5,057)
2013
-
499 (25)
(965)
1,561
10,052
120
-
(221)
(137) (21)
(1,320)
(19)
-
15,715
20
(1,214)
(268)
2014
9,362
10,340
18,573
(330)
17,898 (189)
973
19,528
(5,789)
7,955
1,232
6a
10 -
(1,237)
(49) 34

Financial Statements 2014
page 51
Waverley Council
Notes to the Financial Statements for the financial year ended 30 June 2014
Note 11. Statement of Cash Flows - Additional Information (continued)
$ '000
(c) Non-Cash Investing & Financing Activities
S94 Contributions "in kind"Other DedicationsTotal Non-Cash Investing & Financing Activities
(d) Financing Arrangements
(i) Unrestricted access was available at balance date to the following lines of credit:
Bank Overdraft Facilities (1)
Credit Cards / Purchase CardsTotal Financing Arrangements
1. The Bank overdraft facility may be drawn at any time and may be terminated by the bank without notice.
Interest rates on overdrafts are Interest Rates on Loans & Other Payables are disclosed in Note 15.
(ii) Secured Loan Liabilities
Loans are secured by a mortgage over future years Rate Revenue only.
Notes
275
250
2014
4,943
Actual
-
Actual 2013
25
5,789
275 25
250
- -
846

Financial Statements 2014
page 52
Waverley Council
Notes to the Financial Statements for the financial year ended 30 June 2014
Note 12. Commitments for Expenditure
$ '000
(a) Capital Commitments (exclusive of GST)
Capital expenditure committed for at the reporting date but notrecognised in the financial statements as liabilities:
Property, Plant & EquipmentBuildingsPlant & EquipmentInfrastructureTotal Commitments
These expenditures are payable as follows:Within the next yearTotal Payable
Sources for Funding of Capital Commitments:Unrestricted General FundsFuture Grants & ContributionsSect 64 & 94 Funds/ReservesUnexpended GrantsExternally Restricted ReservesInternally Restricted ReservesUnexpended LoansTotal Sources of Funding
(b) Finance Lease Commitments
Nil
(c) Operating Lease Commitments (Non Cancellable)
a. Commitments under Non Cancellable Operating Leases at the Reporting date, but not recognised as Liabilities are payable:
Within the next yearLater than one year and not later than 5 yearsLater than 5 yearsTotal Non Cancellable Operating Lease Commitments
b. Non Cancellable Operating Leases include the following assets: Motor Vehicles - $682k, and IT equipment - $134k. Contingent Rentals may be payable depending on the condition of items or usage during the term of the leases, average 4 years
Conditions relating to Operating Leases:- All Operating Lease Agreements are secured only against the Leased Asset.- No Lease Agreements impose any financial restrictions on Council regarding future debt etc.
190
10
474
1,396
13,264
91 350 105
-
11,113 11,113
-
518
-
816
332
11,113
13,135 -
-
181 520
11,113
13,264
8,337
Actual
8,977
2014Notes
109
13,264
2013Actual
24
1,714
269
13,264
249
-
1,062
12,563

Financial Statements 2014
page 53
Waverley Council
Notes to the Financial Statements for the financial year ended 30 June 2014
Note 13a(i). Statement of Performance Measurement - Indicators (Consolidated)
$ '000
Local Government Industry Indicators - Consolidated
1. Operating Performance RatioTotal continuing operating revenue (1)
(excl. Capital Grants & Contributions) - Operating ExpensesTotal continuing operating revenue (1)
(excl. Capital Grants & Contributions)
2. Own Source Operating Revenue RatioTotal continuing operating revenue (1)
(less ALL Grants & Contributions)
Total continuing operating revenue (1)
3. Unrestricted Current RatioCurrent Assets less all External Restrictions (2)
Current Liabilities less Specific Purpose Liabilities (3, 4)
4. Debt Service Cover RatioOperating Result (1) before capital excluding interestand depreciation / impairment / amortisation (EBITDA)
Principal Repayments (from the Statement of Cash Flows)
+ Borrowing Interest Costs (from the Income Statement)
5. Rates, Annual Charges, Interest & Extra Charges Outstanding PercentageRates, Annual and Extra Charges OutstandingRates, Annual and Extra Charges Collectible
6. Cash Expense Cover RatioCurrent Year's Cash and Cash Equivalentsincluding All Term DepositsPayments from cash flow of operating andfinancing activities
Notes
(1) Excludes fair value adjustments and reversal of revaluation decrements, net gain/(loss) on sale of assets and net share of interests in joint ventures.(2) Refer Notes 6-8 inclusive. Also excludes any Real Estate & Land for resale not expected to be sold in the next 12 months(3) Refer to Note 10(a).(4) Refer to Note 10(a)(ii) - excludes all payables & provisions not expected to be paid in the next 12 months (incl. ELE).
2012
54,336
5.18 4.35
2.71%
6.39
4.16 : 1
5.63 5.95
1,275
104,777 121,428
18,185
-8.38%
2014
x128,238
46,373
2.35%
87.35%86.29%
4.83
1,441
86,405
111,563
2.43%
8.74
20,768
2014 2013
12.62
88.13%
Amounts Prior Periods
-1.92%
Indicator
98 0.09%

Financial Statements 2014
page 54
Waverley Council
Notes to the Financial Statements for the financial year ended 30 June 2014
Note 13a(ii). Local Government Industry Indicators - Graphs (Consolidated)
―― Minimum -4.00%
Source for Benchmark: Code of Accounting Practice and Financial Reporting
―― Minimum 60.00%
Source for Benchmark: Code of Accounting Practice and Financial Reporting
―― Minimum 1.50
Source for Benchmark: Code of Accounting Practice and Financial Reporting
Commentary on 2013/14 Result
This ratio compares favourably with the 2012/13 NSW Group 2 Councils average of
-1.7%, and compares well with Tcorp benchmark of greater than >-4%, and
compares well with OLG benchmark of greater than 0%
2013/14 Ratio 86.29%
Commentary on 2013/14 Result
To assess the adequacy of working capital and its ability to satisfy obligations in the short term for
the unrestricted activities of Council.
Purpose of Unrestricted Current
Ratio
This ratio measures Council’s
achievement of containing operating expenditure within operating revenue.
Purpose of Operating
Performance Ratio
This ratio indicates that Waverley Council has sufficient liquid assests on hand to
meet short term obligations as they fall due and compares favourably with the 2012/13 NSW Group 2 Councils average of 3.1 : 1
This ratio measures fiscal flexibility. It is
the degree of reliance on external funding
sources such as operating grants &
contributions.
Purpose of Own Source Operating
Revenue Ratio
This measure show that shows Waverley Council is less reliant on external funding sources, and compares well against the
2012/13 NSW Group 2 Councils average of 73% and favourably with Tcorp benchmark
of greater than 60%.
2013/14 Ratio 0.09%
2013/14 Ratio 4.16 : 1
Commentary on 2013/14 Result
4.35
5.18
4.16
0.0
1.0
2.0
3.0
4.0
5.0
6.0
2012 2013 2014
Rat
io :
1
3. Unrestricted Current Ratio
-8.38%
-1.92%
0.09%
-9%
-8%
-7%
-6%
-5%
-4%
-3%
-2%
-1%
0%
1%
2012 2013 2014
Rat
io %
1. Operating Performance Ratio
88.13% 87.35% 86.29%
0%
20%
40%
60%
80%
100%
2012 2013 2014
Rat
io %
2. Own Source Operating Revenue Ratio
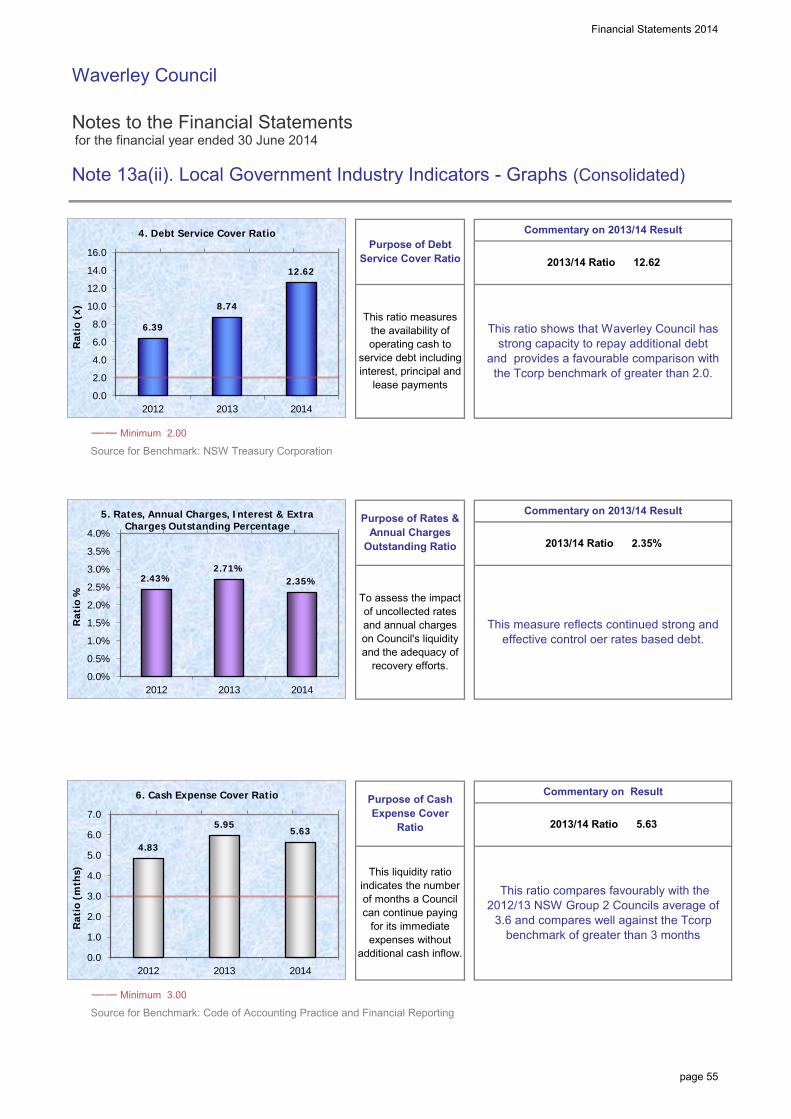
Financial Statements 2014
page 55
Waverley Council
Notes to the Financial Statements for the financial year ended 30 June 2014
Note 13a(ii). Local Government Industry Indicators - Graphs (Consolidated)
―― Minimum 2.00
Source for Benchmark: NSW Treasury Corporation
―― Minimum 3.00
Source for Benchmark: Code of Accounting Practice and Financial Reporting
Purpose of Cash Expense Cover
Ratio
Commentary on Result
2013/14 Ratio 5.63
This liquidity ratio indicates the number of months a Council can continue paying
for its immediate expenses without
additional cash inflow.
Purpose of Rates & Annual Charges
Outstanding Ratio
Commentary on 2013/14 ResultPurpose of Debt
Service Cover Ratio
This measure reflects continued strong and effective control oer rates based debt.
Commentary on 2013/14 Result
2013/14 Ratio 2.35%
This ratio measures the availability of operating cash to
service debt including interest, principal and
lease payments
To assess the impact of uncollected rates and annual charges on Council's liquidity and the adequacy of
recovery efforts.
This ratio compares favourably with the 2012/13 NSW Group 2 Councils average of
3.6 and compares well against the Tcorp benchmark of greater than 3 months
This ratio shows that Waverley Council has strong capacity to repay additional debt
and provides a favourable comparison with the Tcorp benchmark of greater than 2.0.
2013/14 Ratio 12.62
2.43% 2.71%
2.35%
0.0%
0.5%
1.0%
1.5%
2.0%
2.5%
3.0%
3.5%
4.0%
2012 2013 2014
Rat
io %
5. Rates, Annual Charges, Interest & Extra Charges Outstanding Percentage
6.39
8.74
12.62
0.0
2.0
4.0
6.0
8.0
10.0
12.0
14.0
16.0
2012 2013 2014
Rat
io (
x)
4. Debt Service Cover Ratio
4.83
5.95 5.63
0.0
1.0
2.0
3.0
4.0
5.0
6.0
7.0
2012 2013 2014
Rat
io (
mth
s)
6. Cash Expense Cover Ratio

Financial Statements 2014
page 56
Waverley Council
Notes to the Financial Statements for the financial year ended 30 June 2014
Note 14. Investment Properties
$ '000
(a) Investment Properties at Fair value
Investment Properties on Hand
Reconciliation of Annual Movement:Opening Balance- Net Gain/(Loss) from Fair Value AdjustmentsCLOSING BALANCE - INVESTMENT PROPERTIES
(b) Valuation Basis
The basis of valuation of Investment Properties is Fair Value, being the amounts for which the properties couldbe exchanged between willing parties in arms length transaction, based on current prices in an active marketfor similar properties in the same location and condition and subject to similar leases.
The 2014 revaluations were based on Independent Assessments made by:Scott Fullarton Valuations Pty Ltd (ACN 003 683 878), Registered Valuer No. VAL2144.
(c) Leasing Arrangements
Details of leased Investment Properties are as follows;
Future Minimum Lease Payments receivable under non-cancellableInvestment Property Operating Leases not recognised in theFinancial Statements are receivable as follows:Within 1 yearLater than 1 year but less than 5 yearsTotal Minimum Lease Payments Receivable
(d) Investment Property Income & Expenditure - summary
Rental Income from Investment Properties:- Minimum Lease Payments- Other IncomeDirect Operating Expenses on Investment Properties:- that generated rental income- that did not generate rental incomeNet Revenue Contribution from Investment Propertiesplus:
Fair Value Movement for yearTotal Income attributable to Investment Properties
Refer to Note 27- Fair Value Measurement for information regarding the fair value of investment properties held.
122,880
2,552
124,200
2,210
3,204
2,199
5,057 8,261
2014
4,593
1,543
5,057
4,374
2,844
(1,972) (243)
Actual
1,009
Notes 2013
1,320
3,273
2,338 2,036
124,200
Actual
122,880
3,289
(1,625)
1,320 122,880
117,823
(225)

Financial Statements 2014
page 57
Waverley Council
Notes to the Financial Statements for the financial year ended 30 June 2014
Note 15. Financial Risk Management
$ '000
Risk Management
Council's activities expose it to a variety of financial risks including (1) price risk, (2) credit risk, (3) liquidity riskand (4) interest rate risk.
The Council's overall risk management program focuses on the unpredictability of financial markets and seeksto minimise potential adverse effects on the financial performance of the Council.
Council does not engage in transactions expressed in foreign currencies and is therefore not subject to foreigncurrency risk.
Financial risk management is carried out by Council's Finance Section under policies approved by the Council.
A comparison by category of the carrying amounts and fair values of Council's Financial Assets & FinancialLiabilities recognised in the financial statements is presented below.
Financial AssetsCash and Cash EquivalentsInvestments - "Held for Trading" - "Held to Maturity"ReceivablesTotal Financial Assets
Financial LiabilitiesPayablesLoans / AdvancesTotal Financial Liabilities
Fair Value is determined as follows:
- Cash & Cash Equivalents, Receivables, Payables - are estimated to be the carrying value which approximates mkt value.
- Borrowings & Held to Maturity Investments - are based upon estimated future cash flows discounted by the current market interest rates applicable to assets & liabilities with similar risk profiles, unless quoted market prices are available.
- Financial Assets classified (i) "at fair value through profit & loss" or (ii) Available for Sale - are based upon quoted market prices (in active markets for identical investments) at the reporting date or independent valuation.
Refer to Note 27 - Fair Value Measurement for information regarding the fair value of financial assets & liabilities
10,775 66,554
20,763 3,035
38,750
16,789 23,798 16,789
18,573
2013
3,476
4,287
10,775 62,363 62,363
9,541
12,502
2014
9,541 66,554
Fair Value 2013
12,502
9,362
3,035 4,287
9,362
10,640
Carrying Value
3,476
2014
27,800 10,640
27,800
18,573
38,750
23,798
20,763
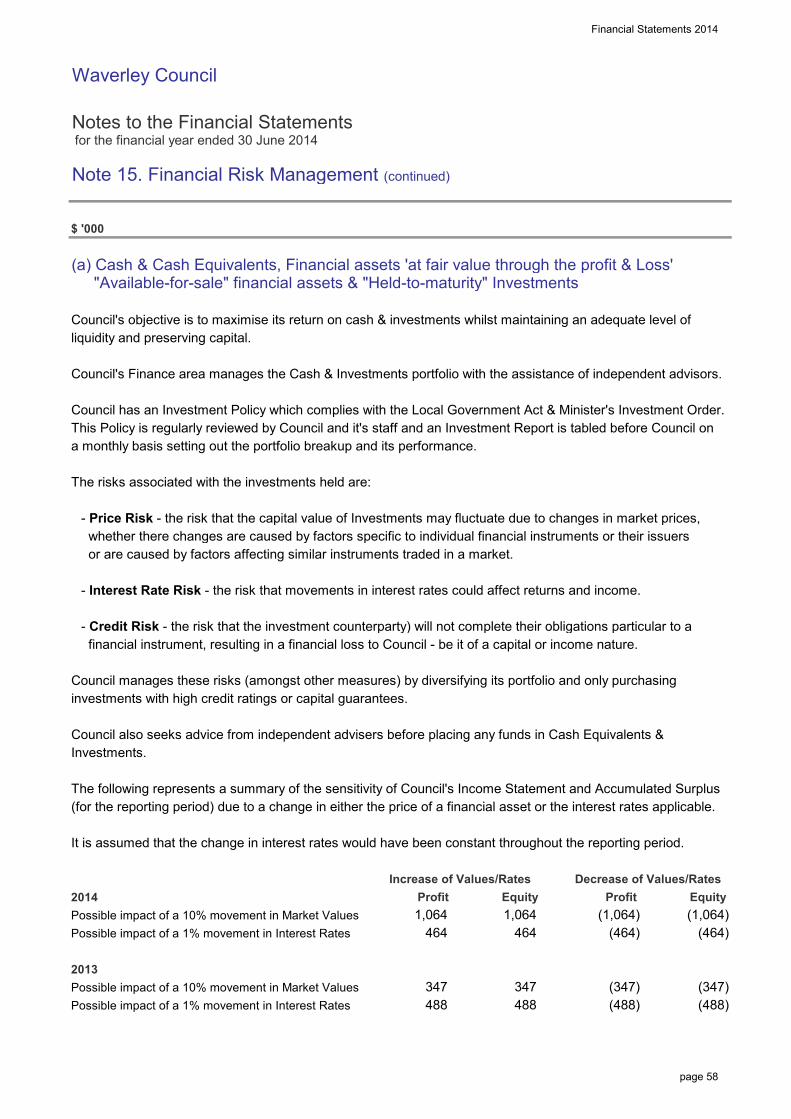
Financial Statements 2014
page 58
Waverley Council
Notes to the Financial Statements for the financial year ended 30 June 2014
Note 15. Financial Risk Management (continued)
$ '000
(a) Cash & Cash Equivalents, Financial assets 'at fair value through the profit & Loss' "Available-for-sale" financial assets & "Held-to-maturity" Investments
Council's objective is to maximise its return on cash & investments whilst maintaining an adequate level ofliquidity and preserving capital.
Council's Finance area manages the Cash & Investments portfolio with the assistance of independent advisors.
Council has an Investment Policy which complies with the Local Government Act & Minister's Investment Order.This Policy is regularly reviewed by Council and it's staff and an Investment Report is tabled before Council ona monthly basis setting out the portfolio breakup and its performance.
The risks associated with the investments held are:
- Price Risk - the risk that the capital value of Investments may fluctuate due to changes in market prices, whether there changes are caused by factors specific to individual financial instruments or their issuers or are caused by factors affecting similar instruments traded in a market.
- Interest Rate Risk - the risk that movements in interest rates could affect returns and income.
- Credit Risk - the risk that the investment counterparty) will not complete their obligations particular to a financial instrument, resulting in a financial loss to Council - be it of a capital or income nature.
Council manages these risks (amongst other measures) by diversifying its portfolio and only purchasinginvestments with high credit ratings or capital guarantees.
Council also seeks advice from independent advisers before placing any funds in Cash Equivalents &Investments.
The following represents a summary of the sensitivity of Council's Income Statement and Accumulated Surplus(for the reporting period) due to a change in either the price of a financial asset or the interest rates applicable.
It is assumed that the change in interest rates would have been constant throughout the reporting period.
2014Possible impact of a 10% movement in Market ValuesPossible impact of a 1% movement in Interest Rates
2013Possible impact of a 10% movement in Market ValuesPossible impact of a 1% movement in Interest Rates (488)
(1,064) 1,064 (464)
347
(1,064)
Increase of Values/Rates
347 488 488
(347) (347)
464 464
Decrease of Values/Rates
(488)
Profit Equity 1,064
Equity
(464)
Profit

Financial Statements 2014
page 59
Waverley Council
Notes to the Financial Statements for the financial year ended 30 June 2014
Note 15. Financial Risk Management (continued)
$ '000
(b) Receivables
Council's major receivables comprise (i) Rates & Annual charges and (ii) User Charges & Fees.
The major risk associated with these receivables is credit risk - the risk that debts due and payable to Councilmay not be repaid in full.
Council manages this risk by monitoring outstanding debt and employing stringent debt recovery procedures.It also encourages ratepayers to pay their rates by the due date through incentives.
Credit risk on rates and annual charges is minimised by the ability of Council to secure a charge over the landrelating to the debts - that is, the land can be sold to recover the debt. Council is also able to charge intereston overdue rates & annual charges at higher than market rates which further encourages the payment of debt.
There are no significant concentrations of credit risk, whether through exposure to individual customers,specific industry sectors and/or regions.
The level of outstanding receivables is reported to Council monthly and benchmarks are set and monitored foracceptable collection performance.
Council makes suitable provision for doubtful receivables as required and carries out credit checks on mostnon-rate debtors.
There are no material receivables that have been subjected to a re-negotiation of repayment terms.
A profile of Council's receivables credit risk at balance date follows:
(i) Ageing of Receivables - %Current (not yet overdue)Overdue
(ii) Ageing of Receivables - valueCurrent (not yet overdue)Past due by up to 30 daysPast due between 31 and 60 daysPast due between 61 and 90 daysPast due by more than 90 days
(iii) Movement in Provision for Impairment of ReceivablesBalance at the beginning of the year+ new provisions recognised during the year- amounts already provided for & written off this yearBalance at the end of the year
(43) 163
1,114 11,933 1,081
2,272 2
2014
10,711
7,587
139
-
2013
- 304
2,152
Charges Charges
64%
2014
Annual
36%
-
88%12%
Other
12%
975 -
56%44%
Receivables
197
2013
100%
962
4,434 4,346
Rates & Annual
- - 300
(23)
Other
100%
Rates &
119
2014
88%
Receivables
100%
-
100%
- -
2013
5,476
2,251 2,272

Financial Statements 2014
page 60
Waverley Council
Notes to the Financial Statements for the financial year ended 30 June 2014
Note 15. Financial Risk Management (continued)
$ '000
(c) Payables & Borrowings
Payables & Borrowings are both subject to liquidity risk - the risk that insufficient funds may be on hand to meetpayment obligations as and when they fall due.
Council manages this risk by monitoring its cash flow requirements and liquidity levels and maintaining anadequate cash buffer.
Payment terms can (in extenuating circumstances) also be extended & overdraft facilities utilised as required.
The contractual undiscounted cash outflows (ie. principal and interest) of Council's Payables & Borrowings areset out in the maturity table below:
$ '000
Trade/Other PayablesLoans & AdvancesTotal Financial Liabilities
Trade/Other PayablesLoans & AdvancesTotal Financial Liabilities
Borrowings are also subject to interest rate risk - the risk that movements in interest rates could adverselyaffect funding costs & debt servicing requirements. Council manages this risk through the diversification ofborrowing types, maturities & interest rate structures.
The following interest rates were applicableto Council's Borrowings at balance date:
Trade/Other PayablesLoans & Advances - Fixed Interest Rate
12,502
Cash
4,287
12,502
414
-
3,035 414
-
667
1-2 Yrs
2014
-
Outflows
2013
2014-
-
15,634
-
- 5,129
maturity > 5 Yrs4-5 Yrs
20,763
15,634
837
837
-
6,246
23,798 6.0% 4,287 6.0%
payable in:Values2-3 Yrs
Carrying
20,763
3-4 Yrs
Total
16,789
837
-
-
1,117
≤ 1 Yearto no
Subject
1,117 -
667
23,798
4,287
3,035
Value
1,252 -
6,988
6,988 6,766
- 5,514 -
1,117
2013
0.0%
Interest RateInterest RateCarrying
-
-
Average
16,789
Average
-
12,502 3,035
Actual
ValueCarrying
16,789
-
837 414
667
20,763 0.0%
23,798 667 414
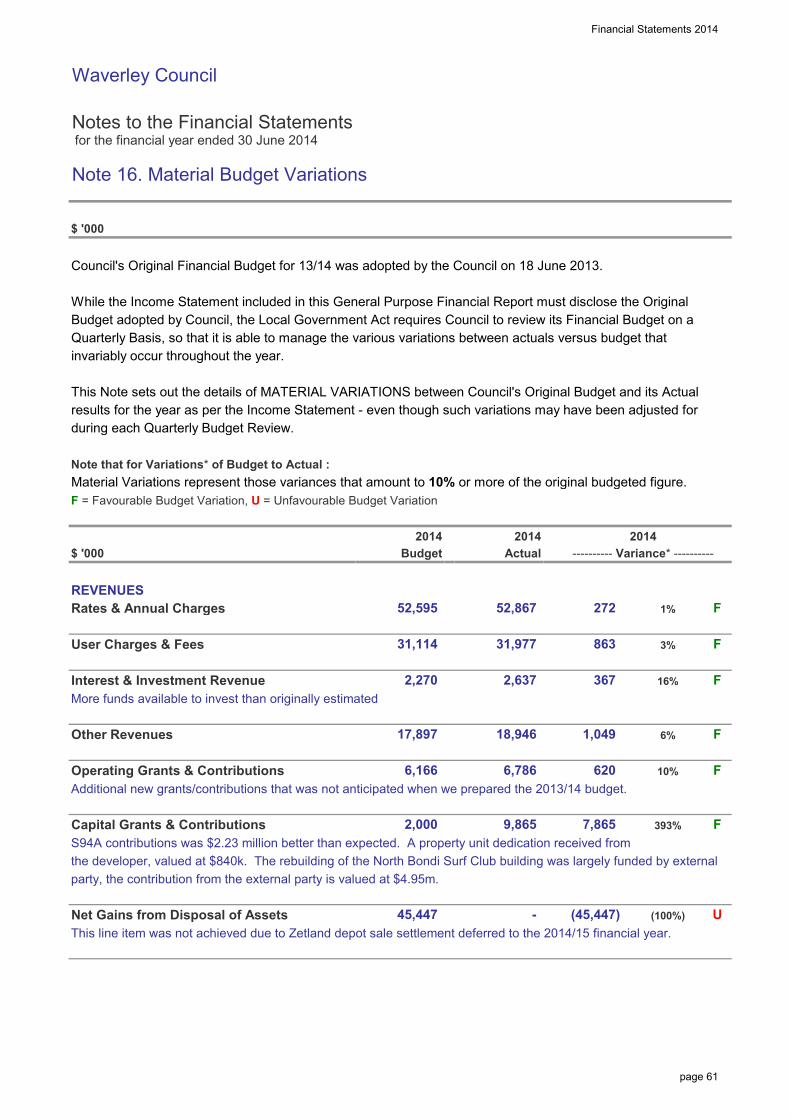
Financial Statements 2014
page 61
Waverley Council
Notes to the Financial Statements for the financial year ended 30 June 2014
Note 16. Material Budget Variations
$ '000
Council's Original Financial Budget for 13/14 was adopted by the Council on 18 June 2013.
While the Income Statement included in this General Purpose Financial Report must disclose the OriginalBudget adopted by Council, the Local Government Act requires Council to review its Financial Budget on aQuarterly Basis, so that it is able to manage the various variations between actuals versus budget thatinvariably occur throughout the year.
This Note sets out the details of MATERIAL VARIATIONS between Council's Original Budget and its Actualresults for the year as per the Income Statement - even though such variations may have been adjusted forduring each Quarterly Budget Review.
Note that for Variations* of Budget to Actual :Material Variations represent those variances that amount to 10% or more of the original budgeted figure.F = Favourable Budget Variation, U = Unfavourable Budget Variation
$ '000
REVENUESRates & Annual Charges
User Charges & Fees
Interest & Investment RevenueMore funds available to invest than originally estimated
Other Revenues
Operating Grants & ContributionsAdditional new grants/contributions that was not anticipated when we prepared the 2013/14 budget.
Capital Grants & ContributionsS94A contributions was $2.23 million better than expected. A property unit dedication received from the developer, valued at $840k. The rebuilding of the North Bondi Surf Club building was largely funded by external party, the contribution from the external party is valued at $4.95m.
Net Gains from Disposal of AssetsThis line item was not achieved due to Zetland depot sale settlement deferred to the 2014/15 financial year.
U
F
(45,447) (100%)
620 10%
F
1,049
F2,000
45,447
6,166
-
393%9,865
6,786
6% F
367 16%
17,897 18,946
2014Budget
2,637
52,867
F
2014---------- Variance* ----------
272
2014
F
7,865
3%
52,595
31,114
2,270
31,977
Actual
1%
863

Financial Statements 2014
page 62
Waverley Council
Notes to the Financial Statements for the financial year ended 30 June 2014
Note 16. Material Budget Variations (continued)
$ '000
EXPENSESEmployee Benefits & On-Costs
Borrowing Costs
Materials & Contracts
Depreciation & Amortisation
Other Expenses
Net Losses from Disposal of AssetsThe primary cause was the writing off of the North Bondi Surf Club building to make way for a new building. The written down value of building demolished are not included in the budget.
Budget Variations relating to Council's Cash Flow Statement include:
Cash Flows from Operating ActivitiesThe cash received from Fees & Charge and Grants & Contributions were better than anticipated by $6.19 million.Bonds & Deposit received was $8 million higher than expected.
Cash Flows from Investing Activities
Cash Flows from Financing ActivitiesThe Original budget included a new borrowing for a Cemetery project, however, this project was deferred. No additional borrowings were incurred in the 2013/14 finanical year.
(136.2%)
3.4%
(1,252)
(19,139) (648)
514
15,011 30,250
U3,458
U(19,787)
(4,710)
21,175
-
15,239 F101.5%
2%
U1,561
17,974
0%(1,561)
16,311 U17,898
F
189
2014
21,689 F
2014
1,279
269 54,229
Actual
10%
7%19,253
210
Budget
54,498
2014
F
(10%)(1,587)
---------- Variance* ----------
0%
21 F

Waverley Council
Notes to the Financial Statements for the financial year ended 30 June 2014
Note 17. Statement of Developer Contributions
$ '000
Council recovers contributions, raises levies & enters into planning agreements on development works that are subject to a development consent issued by Council.All contributions must be spent/utilised for the specific purpose they were levied and any interest applicable to unspent funds must be attributed to remaining funds.
The following tables detail the receipt, interest and use of the above contributions & levies and the value of all remaining funds which are "restricted" in their future use.
SUMMARY OF CONTRIBUTIONS & LEVIES
S94A LEVIES - UNDER A PLAN
Roads
Financial Statem
ents 2014
3,483 -
65 (791) -
467 (791) 65 -
Interestreceived during the Year
3,483
PURPOSE OpeningYearNon Cash in Year
Contributions
Cash467
-
page 63
Total
Balance
846
846
-
-
in Year
65
467
(791)
6,083
YearCash
3,483
(979) 65
Non CashPURPOSE Opening
Balance
Contributionsreceived during the Year
Interest Expenditureearned
-
during
65 3,224 -
6,203 (188) -
Held as
(791)
InternalRestricted
(to)/from
Held asduring (under)
Projections
Future
-
earned BorrowingExpenditure
- - 3,224
3,224
Funding
Internal
Asset income due/(payable)(to)/from
Over orExp
stilloutstanding
RestrictedInternal
Borrowings
3,791 6,550
Total S94 Revenue Under Plans
Total Contributions
S94A Levies - under a Plan
S93F Planning Agreements
- 467 3,483
308
28,550
28,550
9,427 - - -
18,744
Asset
- -
incomeBorrowing
25,326 3,224
25,326
CumulativeProjections
24,947
-
-
due/(payable)
Future
-
Exp
still
InternalOver or
outstandingBorrowings(under)
Funding
-
-
Cumulative

Financial Statements 2014
page 64
Waverley Council
Notes to the Financial Statements for the financial year ended 30 June 2014
Note 18. Contingencies & Other Assets/Liabilities Not Recognised
$ '000
The following assets and liabilities do not qualify for (ii) StateCover Limitedrecognition in the Statement of Financial Position, buttheir knowledge & disclosure is considered relevant Council is a member of StateCover Mutual Limitedto the users of Council's Financial Report. and holds a partly paid share in the entity.
StateCover is a company providing workersLIABILITIES NOT RECOGNISED: compensation insurance cover to the NSW Local
Government Industry and specifically Council.1. Guarantees
Council has a contingent liability to contribute further(i) Defined Benefit Superannuation equity in the event of the erosion of the Company's Contribution Plans capital base as a result of the company's past
performance and/or claims experience or as a resultCouncil participates in an employer sponsored of any increased prudential requirements from APRA.Defined Benefit Superannuation Scheme, and makescontributions as determined by the Superannuation These future equity contributions would be requiredScheme's Trustees. to maintain the company’s minimum level of Net
Assets in accordance with its Licence Requirements.Member Councils bear responsibility of ensuring thereare sufficient funds available to pay out the required (iii) Other Guaranteesbenefits as they fall due.
Council has provided no other Guarantees other thanThe Schemes most recent full actuarial review those listed above.indicated that the Net Assets of the Scheme werenot sufficient to meet the accrued benefits of theSchemes Defined Benefit member category with 2. Other Liabilitiesmember Councils required to make significantlyhigher contributions in future years. (i) Third Party Claims
The Local Government Superannuation Scheme The Council is involved from time to time in varioushowever is unable to provide Council with an accurate claims incidental to the ordinary course of businessestimate of its share of the net deficit and accordingly including claims for damages relating to its services.Council has not recorded any net liability from it'sDefined Benefit Scheme obligations in accordance Council believes that it is appropriately coveredwith AASB 119. for all claims through its Insurance Coverage and
does not expect any material liabilities to eventuate.Future contributions made to the defined benefitscheme to rectify the net deficit position will be Council levies Section 94/94A Contributions uponrecognised as an expense when they become various development across the Council area throughpayable - similar to the accounting for Defined the required Contributions Plans.Contributions Plans.
As part of these Plans, Council has received fundsfor which it will be required to expend the monies in
Financial Statements 2014
page 65
Waverley Council
Notes to the Financial Statements for the financial year ended 30 June 2014
Note 18. Contingencies & Other Assets/Liabilities Not Recognised (continued)
$ '000
LIABILITIES NOT RECOGNISED (continued): recognised, but the amount of further costscannot be known until the appeals are determined.
2. Other Liabilities (continued)3. Remediation costs associated with the sale of
accordance with those Plans. the Waverley Portman Depot
As well, these Plans indicate proposed future The sale of the land is contingent on Council carrying expenditure to be undertaken by Council, which will out remediation works to the site prior to contract be funded by making levies and receipting funds in completion. The remediation work will be at council'sfuture years or where a shortfall exists by the use of expense and includes the removal and clearance ofCouncil's General Funds. the improvements, fixtures, rubble and debris. The
costs of such work can not be reliably measured at theThese future expenses do not yet qualify as liabilities time completing these financial statements.as of the Reporting Date, but represent Council'sintention to spend funds in the manner and timingset out in those Plans. ASSETS NOT RECOGNISED:
(ii) Potential Land Acquisitions due to Planning (i) Affordable HousingRestrictions imposed by Council
Under Council's Development Consent Policy 1Council has classified a number of privately owned (DCP1) developers can if they wish for gain increasedland parcels as Local Open Space or Bushland. floor space ratio.
As a result, where notified in writing by the various To offset the increased floor space ratio the developerowners, Council will be required to purchase these makes available to council Affordable Housing for lowland parcels. to moderate income persons.
At reporting date, reliable estimates as to the value Council and the applicant enter into a Deed ofof any potential liability (& subsequent land asset) Agreement to offer council a unit or units in eitherfrom such potential acquisitions has not been perpetuity or fixed periods of time.possible.
These units are managed by a Community(iii) Legal Expenses Organisation identified by Council. Affordable Housing
units offered to council in perpetuity are recognised asCourt's normal practice that parties bear their own an asset while those fixed for periods of time are notunder the Environmental Planning & Assessment Act recognised in council's accounts.(as amended). Pursuant to that act, certain persons aggrieved by a planning decision of the Council may (ii) Land Under Roadsappeal to the Land & Environment Court. It is theCourt's normal practice that parties bear their own As permitted under AASB 1051, Council has electedlegal costs. not to bring to account Land Under Roads that it
owned or controlled up to & including 30/6/08.At reporting date, all known costs have been

Financial Statements 2014
page 66
Waverley Council
Notes to the Financial Statements for the financial year ended 30 June 2014
Note 19. Controlled Entities, Associated Entities & Interests in Joint Ventures
$ '000
Council has no interest in any Controlled Entities, Associated Entities or Joint Ventures.
Note 20. Equity - Retained Earnings and Revaluation Reserves
$ '000
(a) Retained Earnings
Movements in Retained Earnings were as follows:Balance at beginning of Year (from previous years audited accounts)
a. Net Operating Result for the Yearb. Transfers between EquityBalance at End of the Reporting Period
(b) Reserves
(i) Reserves are represented by:
- Infrastructure, Property, Plant & Equipment Revaluation ReserveTotal
(ii) Reconciliation of movements in Reserves:
Infrastructure, Property, Plant & Equipment Revaluation Reserve- Opening Balance- Revaluations for the year- Transfer to Retained Earnings for Asset disposals- Correction of Prior Period Errors- Balance at End of Year
TOTAL VALUE OF RESERVES
(iii) Nature & Purpose of Reserves
Infrastructure, Property, Plant & Equipment Revaluation Reserve- The Infrastructure, Property, Plant & Equipment Revaluation Reserve is used to record increments/decrements of Non Current Asset values due to their revaluation.
293,186 294,069
585,069
293,186
294,069
Actual 2014
1,854
20(c) -
883 10,052
Notes
585,069
294,069
245,709
293,186
Actual
9(a)
572,875
50,303 -
596,004
10,340
(89) (1,854)
2013
(883)
294,069
293,186 294,069

Financial Statements 2014
page 67
Waverley Council
Notes to the Financial Statements for the financial year ended 30 June 2014
Note 20. Equity - Retained Earnings and Revaluation Reserves (continued)
$ '000
(c) Correction of Error/s relating to a Previous Reporting Period
Correction of errors as disclosed in last year's financial statements:
As part of the revaluation of the Building and Operation Land asset class, Council identified one residential unit building (91-93 O'Brien Street)had been incorrectly recognised as being co-owned by Council. This resulted in the carrying value for the Non-Specialised Building AssetClass being over stated. To correct this error the opening balance for the Infrastructure, Property, Plant & Equipment (IPP&E) asset class was decreased. This adjustment resulted in a decrease to the opening 1 July 2011 Retained Earnings Balance.
In accordance with AASB 108 - Accounting Policies, Changes inAccounting Estimates and Errors, the above Prior Period Errorshave been recognised retrospectively.
These amounted to the following Equity Adjustments:
- Adjustments to Opening Equity - 1/7/12 (relating to adjustments for the 30/6/12 reporting year end and prior periods)
- Adjustments to Closing Equity - 30/6/13 (relating to adjustments for the 30/6/13 year end)
Total Prior Period Adjustments - Prior Period Errors
(d) Voluntary Changes in Accounting Policies
Council made no voluntary changes in any accounting policies during the year.
Note 21. Financial Result & Financial Position by Fund
Council utilises only a General Fund for its operations.
(89)
- -
(89)
- (89)
20132014Notes
-
Actual Actual

Financial Statements 2014
page 68
Waverley Council
Notes to the Financial Statements for the financial year ended 30 June 2014
Note 22. "Held for Sale" Non Current Assets & Disposal Groups
$ '000
(i) Non Current Assets & Disposal Group Assets
Non Current Assets "Held for Sale"LandTotal Non Current Assets "Held for Sale"
Disposal Group Assets "Held for Sale"None
TOTAL NON CURRENT ASSETSCLASSIFIED AS "HELD FOR SALE"
(ii) Details of Assets & Disposal GroupsProceeds from above asset sale will be internally restricted to capital works projects including new/replacement Council Depot.
$ '000
(iii) Reconciliation of Non Current Assets "Held for Sale" & Disposal Groups - i.e. Discontinued Operations
Opening Balanceless: Carrying Value of Assets/Operations Sold
Balance still unsold after 12 months:Closing Balance of "Held for Sale"Non Current Assets & Operations
Refer to Note 27 - Fair Value Measurement for fair value measurement information.
- - -
- 34,685 - 34,685
- 34,685 -
34,685
34,685 -
20132014 2014 2013Current
-
Non Current
Disposal Groups
-
2014 2013
-
44,955
2013
-
34,685
-
34,685
34,685
34,685 (10,270)
34,685
2014Assets "Held for Sale"
- 34,685
CurrentNon Current
Financial Statements 2014
page 69
Waverley Council
Notes to the Financial Statements for the financial year ended 30 June 2014
Note 23. Events occurring after the Reporting Date
$ '000
Events that occur between the end of the reporting period (ending 30 June 2014) and the date when the financialstatements are "authorised for issue" have been taken into account in preparing these statements.
Council has adopted the date of receipt of the Auditors' Report as the applicable "authorised for issue" daterelating to these General Purpose Financial Statements.
Accordingly, the "authorised for issue" date is 28/10/14.
Events that occur after the Reporting Period represent one of two types:
(i) Events that provide evidence of conditions that existed at the Reporting Period
These financial statements (and the figures therein) incorporate all "adjusting events" that provided evidence ofconditions that existed at 30 June 2014.
(ii) Events that provide evidence of conditions that arose after the Reporting Period
Note 22 reflects non-current assets (Waverley Portman Depot) held for sale with a carrying amount of $34.685million. On 3 September 2013 a conditional contract for sale of the Waverley Portman Depot was executed for$82 million (ex GST) with settlement due in December 2014.
Council is unaware of any material or significant "non-adjusting events" that should be disclosed.
Note 24. Discontinued Operations
Council has not classified any of its Operations as "Discontinued".
Note 25. Intangible Assets
Intangible Assets represent identifiable non-monetary assets without physical substance.
Council is unaware of any control over Intangible Assets that warrant recognition in the Financial Statements,including either internally generated and developed assets or purchased assets.
Note 26. Reinstatement, Rehabilitation & Restoration Liabilities
Council has no outstanding obligations to make, restore, rehabilitate or reinstate any of its assets/operations.
Actual Actual
Actual Actual

Financial Statements 2014
page 70
Waverley Council
Notes to the Financial Statements for the financial year ended 30 June 2014
Note 27. Fair Value Measurement
$ '000
The Council measures the following asset and liability classes at fair value on a recurring basis:
- Infrastructure, Property, Plant and Equipment- Investment Property- Financial Assets
The fair value of assets and liabilities must be estimated in accordance with various Accounting Standards foreither recognition and measurement requirements or for disclosure purposes.
AASB 13 Fair Value Measurement requires all assets and liabilities measured at fair value to be assigned to a"level" in the fair value hierarchy as follows:
Level 1: Unadjusted quoted prices in active markets for identical assets or liabilities that the entity can access at the measurement date.
Level 2: Inputs other than quoted prices included within Level 1 that are observable for the asset or liability, either directly or indirectly.
Level 3: Inputs for the asset or liability that are not based on observable market data (unobservable inputs).
(1) The following table presents all assets and liabilities that have been measured & recognised at fair values:
2014
Recurring Fair Value Measurements
Financial AssetsInvestments- "Held for Trading"Total Financial Assets
Investment PropertiesInvestment PropertiesTotal Investment Properties
Infrastructure, Property, Plant & EquipmentBuildings - Non specialisedBuildings SpecialCommunity LandOperational LandFootpathsRoadsStormwater DrainageOffice Equipment & FurniturePlant & EquipmentOpen Space & RecreationLibrary Books and ResourcesOther StructureOther AssetsTotal Infrastructure, Property, Plant & Equipment
Fair Value Measurement HierarchyLevel 1 Level 2 Level 3 Total
Date Quoted Significant Significantof latest prices in observable unobservable
Valuation active mkts inputs inputs
30/6/14 - 10,640 10,640 - - 10,640 10,640
30/6/14 - 30,350 93,850 124,200
30/6/14 - - 68,732 68,732 30/6/14 - - 59,906 59,906 30/6/14 - - 145,835 145,835
- 30,350 93,850 124,200
30/6/14 - - 69,564 69,564 30/6/14 - - 28,684 28,684 30/6/14 - - 177,883 177,883 30/6/14 - - 72,497 72,497 30/6/14 - - 1,121 1,121 30/6/14 - - 7,772 7,772 30/6/14 - - 49,860 49,860 30/6/14 - - 1,152 1,152 30/6/14 - - 5,459 5,459 30/6/14 - - 4,214 4,214
- - 692,679 692,679

Financial Statements 2014_
Waverley Council Notes to the Financial Statements for the financial year ended 30 June 2014 Note 27. Fair Value Measurement (continued)
page 71
(2) Transfers between Level 1 & Level 2 Fair Value Hierarchies During the year, there were no transfers between Level 1 and Level 2 Fair Value hierarchies for recurring fair value measurements. (3) Valuation techniques used to derive Level 2 and Level 3 Fair Values Where Council is unable to derive Fair Valuations using quoted market prices of identical assets (ie. Level 1 inputs), Council instead utilises a spread of both observable inputs (Level 2 inputs) and unobservable inputs (Level 3 inputs). The Fair Valuation techniques Council has employed while utilising Level 2 and Level 3 inputs are as follows: Financial Assets At fair value through profit and loss are represented by Floating Rate Notes, Covered Bonds and Term Deposits. Council obtains valuations from its Investment Advisor on a monthly basis and at the end of each accounting period to ensure the financial statements reflect the most up to date valuation. The valuations of Floating Rate Notes are sourced base on mid-market prices. That is, valuations are marked at the mid-point of the bid and ask prices in the secondary market. This price represents a general market value for the asset. There has been no change to the valuation techniques during the reporting period. Investment Properties The valuation of Council’s investment properties was undertaken at June 2014 by Scott Fullarton Valuations Pty Ltd, FAPI, Certified Practising Valuer, Registration No. VAL2144. Investment properties such as commercial units, commercial terraces and retail shops have been valued as market value, having regard to the “highest and best use”, taking in consideration the criteria of physical possibility, legal permissibility and financial feasibility. Implied within these criteria is the recognition of the contribution of that specific use to community environment or to community development goals, in addition to wealth maximisation to the individual owner. The valuation technique utilised is Level 2 inputs (observable inputs), where applicable, included:
Current rental income Rent reviews Capitalisation rate Price per square metre Direct comparison to sales evidence Zoning Location Land area and configuration Planning controls
Other investment properties such as public car park and shopping centre office space have been valued using Cost approach with Level 3 valuation inputs. There has been no change to the valuation process during the reporting period.
Financial Statements 2014_
Waverley Council Notes to the Financial Statements for the financial year ended 30 June 2014 Note 27. Fair Value Measurement (continued)
page 72
Operational Land The asset class comprises all of Council’s land classified as Operational Land under the NSW Local Government Act 1993. The last valuation was undertaken at June 2013 and was performed by Scott Fullarton Valuations Pty Ld, FAPI, Certified Practising Valuer, Registration No. VAL2144. Operational land has been valued at market value, having regard to the “highest and best use”, after identifying all elements that would be taken into account by buyers and sellers in settling the price, including but not limited to:
The land’s description and/or dimensions; Planning and other constraints on development; and The potential for alternative use.
Sale prices of comparable land parcels in close proximity were adjusted for differences in key attributes such as size and configuration. The most significant inputs into this valuation approach are price per square metre. Since extensive professional judgements were required to determine the inputs these assets were classified as having been valued using Level 3 valuation input. There has been no change to the valuation process during the reporting period. Community Land Valuations of all Council’s Community Land and Council managed land were based on either the land value provided by the Valuer-General or an average unit rate based on land value for similar properties where the Valuer-General did not provide a land value having regard to the highest and best use for this land. As these rates were not considered to be observable market evidence they have been classified as Level 3. There has been no change to the valuation process during the reporting period. Buildings – Non Specialised and Specialised Council’s buildings were valued utilising the cost approach by Scott Fullarton Valuations Pty Ltd in June 2013. The approach estimated the replacement cost of each building and componentising of significant parts with different useful lives and taking into account a range of factors. The unit rates could be supported by market evidence (Level 2 inputs), other inputs (such as estimates of residual value, useful life and asset condition) required extensive professional judgement and impacted significantly on the final determination of fair value. As such, these assets have been valued using Level 3 inputs. There has been no change to the valuation process during the reporting period. Roads The roads asset class includes roads, defined as the trafficable portion of a road, between but not including the kerb and gutter. It also includes “other roads” assets including Bridges, Carparks, Kerb and Gutter and Traffic facilities. The ‘Cost Approach’ using Level 3 inputs was used to value the road carriageway and other road infrastructure. Valuations for the road carriageway, comprising surface, pavement and formation were based primarily on unit rates derived from the Councils schedule of rates tender. Other inputs (such as estimates pattern of consumption, residual value, asset condition and useful life) required extensive professional judgement and impacted significantly on the final determination of fair value. Additionally due to limitations in the historical records of very long lived assets there some uncertainty regarding the actual design,

Financial Statements 2014_
Waverley Council Notes to the Financial Statements for the financial year ended 30 June 2014 Note 27. Fair Value Measurement (continued)
page 73
specifications and dimensions of some assets. There has been no change to the valuation process during the reporting period. Footpaths The ‘Cost Approach’ using Level 3 inputs was used to value footpaths. Valuation for the footpath was based primarily on unit rates derived from the Councils schedule of rates tender. Other inputs (such as estimates pattern of consumption, residual value, asset condition and useful life) required extensive professional judgement and impacted significantly on the final determination of fair value. Additionally due to limitations in the historical records of very long lived assets there some uncertainty regarding the actual design, specifications and dimensions of some assets. There has been no change to the valuation process during the reporting period. Stormwater Drainage Assets within this class comprise pits, pipes, open channels, headwalls and various types of water quality devices. The ‘Cost Approach’ estimated the replacement cost for each asset by componentising the assets into significant parts with different useful lives and taking into account a range of factors. While the unit rates based on linear metres of certain diameter pipes and prices per pit on similar could be supported from market evidence (Level 2) other inputs )such as estimates of pattern of consumption, residual value, asset condition and useful life) required extensive professional judgement and impacted significantly on the final determination of fair value. Additionally due to limitations in the historical records of very long lived assets there is uncertainty regarding the actual design, specifications and dimensions of some assets. There has been no change to the valuation process during the reporting period. Plant & Equipment, Office Equipment and Furniture & Fittings Plant & Equipment, Office Equipment and Furniture & Fittings are valued at cost but are disclosed at fair value in the notes. The carrying amount of these assets is assumed to approximate fair value due to the nature of the items. Examples of assets within these classes are as follows:
Plant and Equipment Trucks, tractors, ride on mowers, street sweepers, earthmoving equipment, buses and motor vehicles
Office Equipment Refrigerators, electronic appliances, flat-screen monitors and computer equipment
Furniture & Fittings Chairs, desks and display systems.
The key unobservable inputs to the valuation are the remaining useful life and residual value. Council reviews the value of these assets against quoted prices for the gross current replacement cost of similar assets and by taking account of the pattern of consumption, estimated remaining useful life and the residual value. There has been no change to the valuation process during the reporting period.
Financial Statements 2014_
Waverley Council Notes to the Financial Statements for the financial year ended 30 June 2014 Note 27. Fair Value Measurement (continued)
page 74
Other Open Space / Recreational Assets Assets within this class comprise Soft Fall Surfaces, BBQs, Regional Sporting Facilities and Playgrounds. All assets in this class were valued in-house by experienced engineering & asset management staff. While some elements of gross replacement values could be supported from market evidence (Level 2 input) other inputs (such as estimates of pattern of consumption, residual value, asset condition and useful life) required extensive professional judgement and impacted significantly on the final determination of fair value. There has been no change to the valuation process during the reporting period. There has been no change to the valuation process during the reporting period. Library Books and Resources Library Books are valued at cost but are disclosed at fair value in the notes. The carrying amount of these assets is assumed to approximate fair value due to the nature of the items. Council reviews the value of these assets against quoted prices for the gross current replacement cost of similar assets and by taking account of the pattern of consumption, estimated remaining useful life and the residual value. There has been no change to the valuation process during the reporting period. Other Structures This asset class comprises Mall Light, Shade Structure, Flag Pole, Planter Boxes and Garden Beds. The cost approach has been utilised whereby the replacement cost was estimated for each asset by taking into account a range of factors. While some elements of gross replacement values could be supported from market evidence (Level 2 input) other inputs (such as estimates of pattern of consumption, residual value, asset condition and useful life) required extensive professional judgement and impacted significantly on the final determination of fair value. As such there assets were all classified as having been valued using Level 3 valuation inputs. There has been no change to the valuation process during the reporting period. Other Assets This asset class comprises trees and other miscellaneous assets. The cost approach has been utilised whereby the replacement cost was estimated for each asset by taking into account a range of factors. While some elements of gross replacement values could be supported from market evidence (Level 2 input) other inputs (such as estimates of pattern of consumption, residual value, asset condition and useful life) required extensive professional judgement and impacted significantly on the final determination of fair value. As such there assets were all classified as having been valued using Level 3 valuation inputs. There has been no change to the valuation process during the reporting period.

Financial Statements 2014
page 75
Waverley Council
Notes to the Financial Statements for the financial year ended 30 June 2014
Note 27. Fair Value Measurement (continued)
$ '000
(4). Fair value measurements using significant unobservable inputs (Level 3)
a. The following tables present the changes in Level 3 Fair Value Asset Classes.
Adoption of AASB 13Purchases (GBV)Disposals (WDV)Depreciation & ImpairmentFV Gains - Other Comprehensive Income
Closing Balance - 30/6/14
Adoption of AASB 13Transfers from/(to) another asset classPurchases (GBV)Disposals (WDV)Depreciation & Impairment
Closing Balance - 30/6/14
InvestmentProperties Buildings Land Total
- 89,920 127,506 215,728 433,154 - - 9,137 - 9,137 - - (1,334) (329) (1,663) - - (6,670) - (6,670) - 3,930 - - 3,930
- 93,850 128,639 215,399 437,888
Plant & OtherEquipment Infrastructure Assets Total
12,840 334,660 1,185 348,685 7 7 (14) -
2,514 8,427 211 11,152 (85) - - (85)
(2,174) (8,707) (229) (11,110)
- 13,102 334,387 1,153 348,642

Financial Statements 2014_
Waverley Council Notes to the Financial Statements for the financial year ended 30 June 2014 Note 27. Fair Value Measurement (continued)
page 76
4). Fair value measurements using significant unobservable inputs (Level 3) b. Significant unobservable valuation inputs used (for Level 3 asset classes) and their relationship to fair value. The following table summarises the quantitative information relating to the significant unobservable inputs used in deriving the various Level 3 Asset Class fair values. Financial Assets
Class
Fair Value
(30/6/14) $’000
Valuation Techniques
Unobservable Inputs
Range of Inputs (incl probable)
Relationship of unobservable inputs to Fair Value
Investments – At fair value through profit or loss
10,640 Cost Unit Price $0.70 to $1.00
Significant changes in the estimated unit price would result in significant changes to fair value measurement.
Investment Properties
Class
Fair Value
(30/6/14) $’000
Valuation Techniques
Unobservable Inputs
Range of Inputs (incl probable)
Relationship of unobservable inputs to Fair Value
Commercial Office, Retail and Carpark
93,850 Cost Estimated rental Value (rate per square metre)
Rental Yield
5%
Significant changes in the estimated rental value or yield would result in significant changes to fair value measurement
I,PP&E
Class
Fair Value
(30/6/14) $’000
Valuation Techniques
Unobservable Inputs
Range of Inputs (incl probable)
Relationship of unobservable inputs to Fair Value
Buildings 128,638 Cost Gross replacement cost
Asset Condition Remaining useful
life
Varies
Very Poor to Excellent 20 – 60 years
Significant changes in gross replacement value, asset condition or remaining useful life would result in significant changes to fair value measurement.
Community Land 145,835 Cost Price Per square metre
$2 – $2000 per square metre
Significant changes in price per square metre would result in significant changes to fir value measurement
Operational Land 69,564 Cost Price Per square metre
$ 600- $5,000 per square metre
Significant changes in price per square metre would result in significant changes to fir value measurement

Financial Statements 2014_
Waverley Council Notes to the Financial Statements for the financial year ended 30 June 2014 Note 27. Fair Value Measurement (continued)
page 77
Class
Fair Value
(30/6/14) $’000
Valuation Techniques
Unobservable Inputs
Range of Inputs (incl probable)
Relationship of unobservable inputs to Fair Value
Footpaths 28,684 Cost Gross replacement cost
Asset Condition Remaining useful
life
Varies
Very Poor to Excellent 25 – 100 years
Significant changes in gross replacement value, asset condition or remaining useful life would result in significant changes to fair value measurement.
Roads 177,883 Cost Gross replacement cost
Asset Condition Remaining useful
life
Varies
Very Poor to Excellent 25 – 100 years
Significant changes in gross replacement value, asset condition or remaining useful life would result in significant changes to fair value measurement.
Stormwater Drainage
72,497 Cost Gross replacement cost
Asset Condition Remaining useful
life
Varies
Very Poor to Excellent 25 – 100 years
Significant changes in gross replacement value, asset condition or remaining useful life would result in significant changes to fair value measurement.
Plant & Equipment 7,772 Cost Gross replacement cost
Remaining useful life
Varies
2 - 20 years
Significant changes in gross replacement value or remaining useful life would result in significant changes to fair value measurement.
Open Space & Recreation
49,860 Cost Gross replacement cost
Asset Condition Remaining useful
life
Varies
Very Poor to Excellent 10 – 100 years
Significant changes in gross replacement value, asset condition or remaining useful life would result in significant changes to fair value measurement.
Library Books and Resource
1,152 Cost Gross replacement cost
Remaining useful life
Varies
5 years
Significant changes in gross replacement value or remaining useful life would result in significant changes to fair value measurement.
Other Structures 5,459 Cost Gross replacement cost
Asset Condition Remaining useful
life
Varies
Very Poor to Excellent 10 – 100 years
Significant changes in gross replacement value, asset condition or remaining useful life would result in significant changes to fair value measurement.
Other Assets 4,214 Cost Gross replacement cost
Remaining useful life
Varies
2 - 20 years
Significant changes in gross replacement value or remaining useful life would result in significant changes to fair value measurement.
(5). Highest and best use All assets valued at fair value in this note are being used for their highest and best use.

Financial Statements 2014
page 78
Waverley Council
Notes to the Financial Statements for the financial year ended 30 June 2014
Note 28. Financial Review
$ '000
Key Financial Figures of Council over the past 5 years (consolidated)
Financial Performance Figures
Inflows:Rates & Annual Charges RevenueUser Charges RevenueInterest & Investment Revenue (Losses)Grants Income - Operating & CapitalTotal Income from Continuing Operations
Sale Proceeds from I,PP&ENew Loan Borrowings & Advances
Outflows:Employee Benefits & On-cost ExpensesBorrowing CostsMaterials & Contracts ExpensesTotal Expenses from Continuing Operations
Total Cash purchases of I,PP&ETotal Loan Repayments (incl. Finance Leases)
Operating Surplus/(Deficit) (excl. Capital Income)
Financial Position Figures
Current AssetsCurrent LiabilitiesNet Current Assets
Available Working Capital(Unrestricted Net Current Assets)
Cash & Investments - UnrestrictedCash & Investments - Internal RestrictionsCash & Investments - Total
Total Borrowings Outstanding(Loans, Advances & Finance Leases)
Total Value of I,PP&E (excl. Land & Earthworks)
Total Accumulated DepreciationIndicative Remaining Useful Life (as a % of GBV)
Source: Published audited financial statements of Council (current year & prior year)
2013 2012
401
-
10,529
91,542 19,188
46,949
47,283 36,737
2010
41,608
2,274
2011 2014
3,016
38,673 23,657 24,610
2,637 2,647
52,867 31,977 25,483
6,192 8,597 6,972 3,054
28,222
3,538 (4,588) 187
1,252 1,400
94
92,437
1,783
54,229
- 167
123,078
2,500 10,315
50,682
-
48,500
-
47,966
115,462 100,702
53
55,740 54,331 39,860
31,295 42,001
6,427 2,077
33,875
13,904 15,855 24,093 22,819
(9,697)
88,045 33,714
61%279,719
811,780 831,297
59% 59% 59% 60%
722,347
66,129 41,563
2012
742,996 756,362 313,736 297,513
4,287 3,187
341,518 331,883
27,491 32,981
4,372
45,356
2014 2013
95,600
12,502 9,152
6,227
1,377
2010
1,185
32,411 30,113 42,615
2011
3,041
32,254
(3,101)
26,638 5,503 4,174
1,045
43,168
5,717
41,536 34,584 57,013 51,588
3,035
36,245 48,220
1,345
16,232 189 194 246
17,974 17,301 15,762 327
98,631 105,122 100,376 113,026
6,238 93,857 7,238

Financial Statements 2014
page 79
Waverley Council
Notes to the Financial Statements for the financial year ended 30 June 2014
Note 29. Council Information & Contact Details
Principal Place of Business:Cnr. Paul St and Bondi RdBondi Junction NSW 2022
Contact DetailsMailing Address: Opening Hours:PO Box 9 Customer Service CentreBondi Junction NSW 1355 55 Spring Street, Bondi Junction
Monday to Friday 8:30am to 5:00pm
Telephone: 02 9369 8000 Internet: www.waverley.nsw.gov.auFacsimile: 02 9387 1820 Email: [email protected]
Officers Elected MembersGENERAL MANAGER MAYORAthanasios (Arthur) Kyron Sally Betts
RESPONSIBLE ACCOUNTING OFFICER COUNCILLORSFrancesco Rombola Clr Andrew Cusack
Clr Angela BurrillPUBLIC OFFICER Clr Bill MouroukasRobert Russo Clr Dominic Wy Kanak
Clr Ingrid StreweAUDITORS Clr John WakefieldHill Rogers Spencer Steer, Chartered Accountants Clr Joy ClaytonLevel 5, 1 Chifley Square, Sydney Clr Leon Goltsman
Clr Miriam Guttman-JonesClr Paula MasselosClr Tony Kay
Other InformationABN: 12 502 583 608
page 80

page 81
page 82

page 83

page 84

page 85
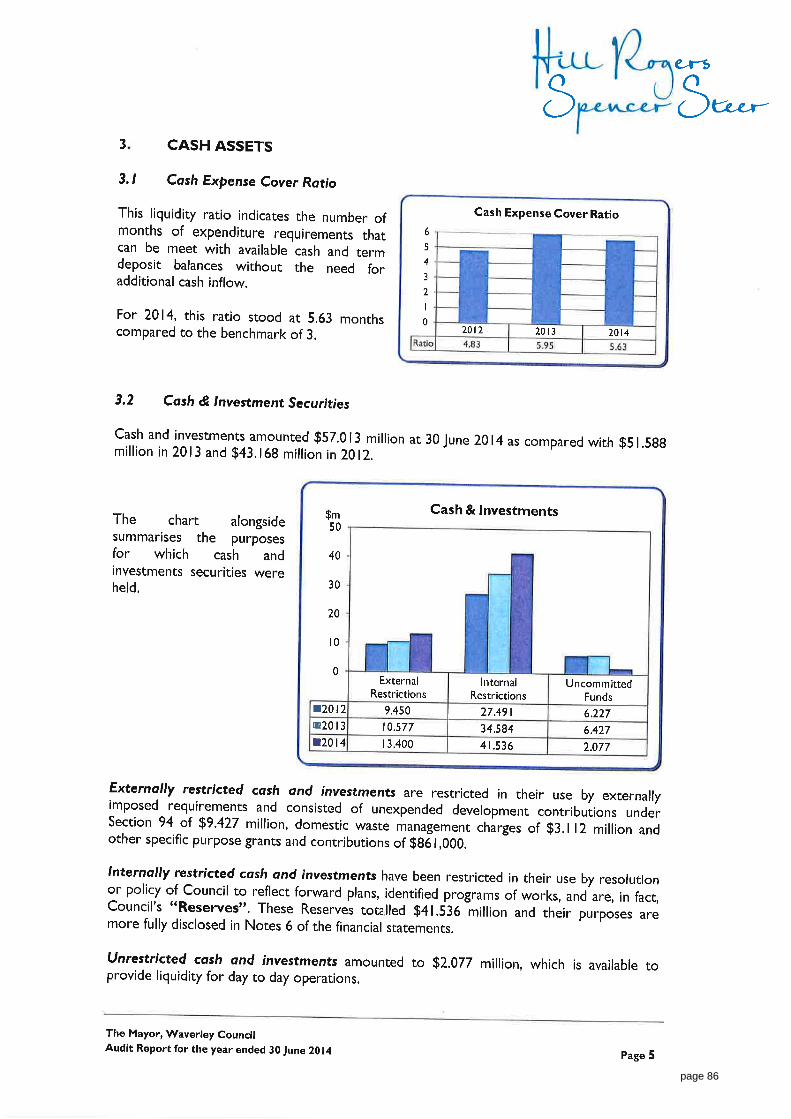
page 86
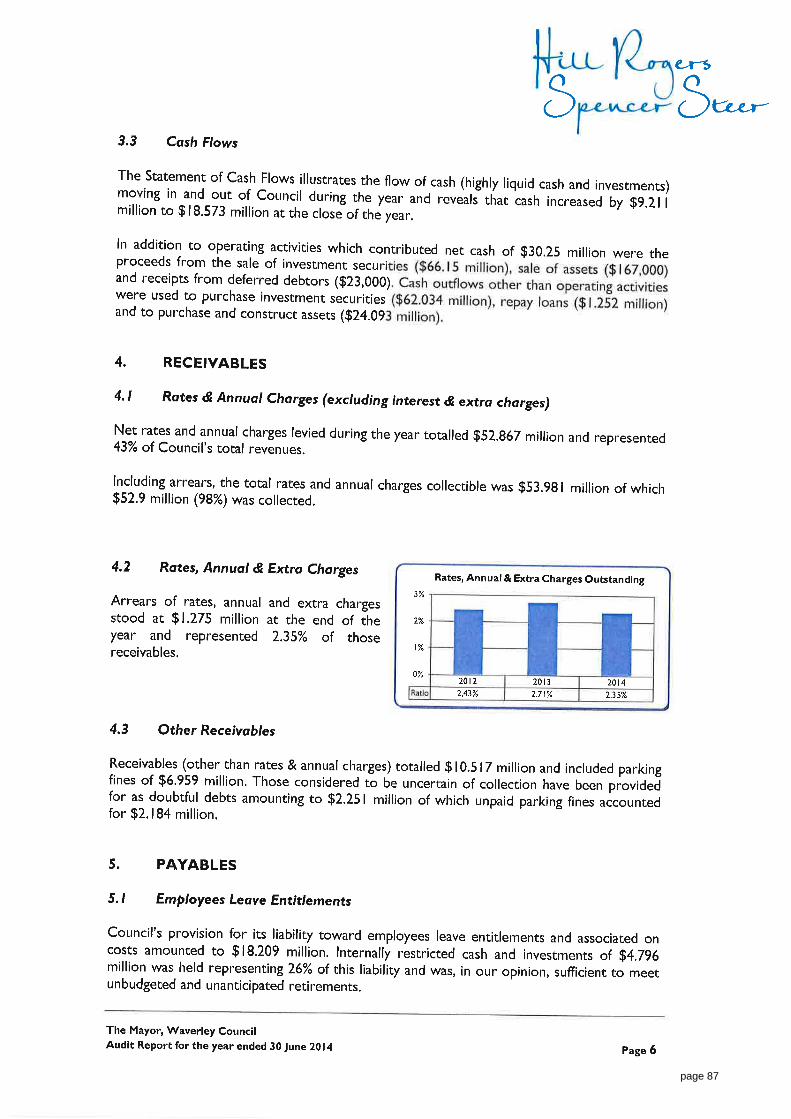
page 87

page 88

Waverley Council SPECIAL PURPOSE FINANCIAL STATEMENTS for the year ended 30 June 2014
"We are united by a common passion for ourbeautiful home between the city and the sea."

SPFS 2014
page 1
Waverley Council
Special Purpose Financial Statements for the financial year ended 30 June 2014
Contents
1. Statement by Councillors & Management
2. Special Purpose Financial Statements:
Income Statement - Water Supply Business ActivityIncome Statement - Sewerage Business ActivityIncome Statement - Other Business Activities
Statement of Financial Position - Water Supply Business ActivityStatement of Financial Position - Sewerage Business ActivityStatement of Financial Position - Other Business Activities
3. Notes to the Special Purpose Financial Statements
4. Auditor's Report
Background
These Special Purpose Financial Statements have been prepared for the use by both Council and the Division ofLocal Government in fulfilling their requirements under National Competition Policy.
The principle of competitive neutrality is based on the concept of a "level playing field" between persons/entitiescompeting in a market place, particularly between private and public sector competitors.
Essentially, the principle is that government businesses, whether Commonwealth, State or Local, should operatewithout net competitive advantages over other businesses as a result of their public ownership.
For Council, the principle of competitive neutrality & public reporting applies only to declared business activities.
These include (a) those activities classified by the Australian Bureau of Statistics as business activities beingwater supply, sewerage services, abattoirs, gas production and reticulation and (b) those activities with a turnoverof over $2 million that Council has formally declared as a Business Activity (defined as Category 1 activities).
In preparing these financial statements for Council's self classified Category 1 businesses and ABS definedactivities, councils must (a) adopt a corporatisation model and (b) apply full cost attribution including tax equivalentregime payments & debt guarantee fees (where the business benefits from councils borrowing position bycomparison with commercial rates).
n/a
Page
n/an/a3
2
(iv)
7
5n/a
(i)
(ii)
11
(iii)


SPFS 2014
page 3
Waverley Council
Income Statement of Council's Other Business Activities for the financial year ended 30 June 2014
$ '000
Income from continuing operationsAccess chargesUser chargesFeesInterestGrants and contributions provided for non capital purposesProfit from the sale of assetsOther incomeTotal income from continuing operations
Expenses from continuing operationsEmployee benefits and on-costsBorrowing costsMaterials and contractsDepreciation and impairmentLoss on sale of assetsCalculated taxation equivalentsDebt guarantee fee (if applicable)Other expensesTotal expenses from continuing operationsSurplus (deficit) from Continuing Operations before capital amounts
Grants and contributions provided for capital purposesSurplus (deficit) from Continuing Operations after capital amounts
Surplus (deficit) from discontinued operationsSurplus (deficit) from ALL Operations before taxless: Corporate Taxation Equivalent (30%) [based on result before capital]
SURPLUS (DEFICIT) AFTER TAX
plus Opening Retained Profitsplus/less: Prior Period Adjustmentsplus Adjustments for amounts unpaid:- Taxation equivalent payments- Debt guarantee fees- Corporate taxation equivalentadd:- Subsidy Paid/Contribution To Operationsless:- TER dividend paid- Dividend paidClosing Retained Profits
Return on Capital %Subsidy from Council
-
Actual
2,577
-
2,520 1,554 1,563
57
2,593
-
205 -
-
(3,865) -
n/a
2,766
-
-
205 57
- - - -
957
6,113 - -
n/a
Property Commercial Waste
124,258
374
-
-
117,899
-
2014Actual
2013Actual Actual
20132014
-
-
-
- -
-
- 32 2,577
-
-
-
-
7,022 - - - -
1,320
492
955
2,798
- -
591
40
57
923
-
-
3
4,879
-
49
8,574
- - -
- - -
150 -
-
1,008 36 37
2,418 770
10,992
1,796
5,985
- 5,985
-
5,985 -
117,899
- -
8,342
4,190
(1,796)
2,357 760
-
-
6,002
- 8,574
8,574 (2,572)
-
-
-
62 - - -
40
-
-
(20) (197)
- 17
-
2,572
-
- -
-
77 114 113,190
144
80.3%
122
585.7%-
114
-
205 (17) (62)
Category 1 Category 1

SPFS 2014
page 4
Waverley Council
Income Statement of Council's Other Business Activities for the financial year ended 30 June 2014
$ '000
Income from continuing operationsAccess chargesUser chargesFeesInterestGrants and contributions provided for non capital purposesProfit from the sale of assetsOther incomeTotal income from continuing operations
Expenses from continuing operationsEmployee benefits and on-costsBorrowing costsMaterials and contractsDepreciation and impairmentLoss on sale of assetsCalculated taxation equivalentsDebt guarantee fee (if applicable)Other expensesTotal expenses from continuing operationsSurplus (deficit) from Continuing Operations before capital amounts
Grants and contributions provided for capital purposesSurplus (deficit) from Continuing Operations after capital amounts
Surplus (deficit) from discontinued operationsSurplus (deficit) from ALL Operations before taxless: Corporate Taxation Equivalent (30%) [based on result before capital]
SURPLUS (DEFICIT) AFTER TAX
plus Opening Retained Profitsplus/less: Prior Period Adjustmentsplus Adjustments for amounts unpaid:- Taxation equivalent payments- Debt guarantee fees- Corporate taxation equivalentadd:- Subsidy Paid/Contribution To Operationsless:- TER dividend paid- Dividend paidClosing Retained Profits
Return on Capital %Subsidy from Council
-
0.6%
-
-
942
-
-
-
98
18,783
-
944 0.4%
180 104
1,151 1,247 104 180
54
(54) (31)
73
-
18,551
- -
- -
1,331 2 25
- -
180
- -
45 -
115
-
- -
74
1,232
2013Actual Actual
- 1,280
2014
-
Cemetery
-
61
614 -
-
- - -
- 448
69
640
1,351
377
-
18,292
104
126
18,551 (363) (412)
31
0 Category 2

SPFS 2014
page 5
Waverley Council
Statement of Financial Position - Council's Other Business Activities as at 30 June 2014
$ '000
ASSETSCurrent AssetsCash and cash equivalentsInvestmentsReceivablesInventoriesOtherNon-current assets classified as held for saleTotal Current Assets
Non-Current AssetsInvestmentsReceivablesInventoriesInfrastructure, property, plant and equipmentInvestments accounted for using equity methodInvestment propertyOtherTotal Non-Current AssetsTOTAL ASSETS
LIABILITIESCurrent LiabilitiesBank OverdraftPayablesInterest bearing liabilitiesProvisionsTotal Current Liabilities
Non-Current LiabilitiesPayablesInterest bearing liabilitiesProvisionsOther LiabilitiesTotal Non-Current LiabilitiesTOTAL LIABILITIESNET ASSETS
EQUITYRetained earningsRevaluation reservesCouncil equity interestNon-controlling equity interestTOTAL EQUITY
-
-
-
-
-
- -
-
-
-
245 -
-
- -
Actual 2014
- -
151
-
- -
50
110
77
-
104 114
-
57
- - - -
104
218
-
Actual
64 -
-
47
-
71
147
-
- -
118,170 124,200 124,445
-
65
-
- -
64
117,899
-
117,976 124,335
50
-
71
-
-
-
- -
-
147
35
-
-
118,170
-
124,200
-
118,220
- - -
-
35 - -
122
-
Property
-
-
110
-
-
Category 1
-
Actual
- 245
Commercial Waste
Category 1
-
2014
-
2013
151
Actual 2013
114
117,976
186
124,258
124,335 -
77
-
124,335 117,976 -
-
122 -
-
-
-
244
-
110
-
122
-
244
179
-
114 122
-
-
-
64
- -
114

SPFS 2014
page 6
Waverley Council
Statement of Financial Position - Council's Other Business Activities as at 30 June 2014
$ '000
ASSETSCurrent AssetsCash and cash equivalentsInvestmentsReceivablesInventoriesOtherNon-current assets classified as held for saleTotal Current Assets
Non-Current AssetsInvestmentsReceivablesInventoriesInfrastructure, property, plant and equipmentInvestments accounted for using equity methodInvestment propertyOtherTotal Non-Current AssetsTOTAL ASSETS
LIABILITIESCurrent LiabilitiesBank OverdraftPayablesInterest bearing liabilitiesProvisionsTotal Current Liabilities
Non-Current LiabilitiesPayablesInterest bearing liabilitiesProvisionsOther LiabilitiesTotal Non-Current LiabilitiesTOTAL LIABILITIESNET ASSETS
EQUITYRetained earningsRevaluation reservesCouncil equity interestNon-controlling equity interestTOTAL EQUITY
31,533
-
-
31,334
18,551 12,783
31,334
-
31,229
-
-
Actual Actual
Cemetery
- - 1,704 1,823
6
2013
29,823
- - -
-
-
29,395
Category 2
11
- - -
- -
2014
- 29,395
1,834
29,823
1,710
- -
- -
- -
- - -
- - -
199
- - 154 199 154
-
#VALUE!
- 199 154
31,075
31,075
12,783 18,292
- - 31,334 31,075
- -

SPFS 2014
page 7
Waverley Council
Special Purpose Financial Statements for the financial year ended 30 June 2014
Contents of the Notes accompanying the Financial Statements
Details
Summary of Significant Accounting Policies
Water Supply Business Best Practice Management disclosure requirements
Sewerage Business Best Practice Management disclosure requirements n/a3
Note Page
1
2
8
n/a

SPFS 2014_
Waverley Council Notes to the Special Purpose Financial Statements for the financial year ended 30 June 2014 Note 1. Significant Accounting Policies
page 8
These financial statements are a Special Purpose Financial Statements (SPFS) prepared for use by Council and the Office of Local Government. For the purposes of these statements, the Council is not a reporting not-for-profit entity. The figures presented in these special purpose financial statements, unless otherwise stated, have been prepared in accordance with: the recognition and measurement criteria of
relevant Australian Accounting Standards,
other authoritative pronouncements of the Australian Accounting Standards Board (AASB) &
Australian Accounting Interpretations.
The disclosures in these special purpose financial statements have been prepared in accordance with: the Local Government Act and Regulation, and the Local Government Code of Accounting
Practice and Financial Reporting. The statements are also prepared on an accruals basis, based on historic costs and do not take into account changing money values nor current values of non-current assets (except where specifically stated). Certain taxes and other costs (appropriately described) have been imputed for the purposes of the National Competition Policy. National Competition Policy Council has adopted the principle of ‘competitive neutrality’ to its business activities as part of the national competition policy which is being applied throughout Australia at all levels of government. The framework for its application is set out in the June 1996 Government Policy statement on the “Application of National Competition Policy to Local Government”. The “Pricing & Costing for Council Businesses A Guide to Competitive Neutrality” issued by the Office of Local Government in July 1997 has also been adopted.
The pricing & costing guidelines outline the process for identifying and allocating costs to activities and provide a standard of disclosure requirements. These disclosures are reflected in Council’s pricing and/or financial reporting systems and include taxation equivalents; council subsidies; return on investments (rate of return); and dividends paid. Declared Business Activities In accordance with Pricing & Costing for Council Businesses - A Guide to Competitive Neutrality, Council has declared that the following are to be considered as business activities: Category 1 (where gross operating turnover is over $2 million) a. Waverley Council Property Services
Comprising the whole of the operations and assets of the property services, commercial properties controlled by Waverley Council.
b. Waverley Council Trade Waste Services
Comprising the whole of the operations and assets of the commercial waste services which service the area of Waverley. This service collects and disposes of waste collected from commercial premises.
Category 2 (where gross operating turnover is less than $2 million) a. Waverley & South Head Cemeteries
Comprising the whole of the operations and assets of both the Waverley & South Head Cemeteries. This business operates from offices located at Waverley Cemetery dealing with maintenance, sales and burials.
Monetary Amounts Amounts shown in the financial statements are in Australian currency and rounded to the nearest one thousand dollars

SPFS 2014_
Waverley Council Notes to the Special Purpose Financial Statements for the financial year ended 30 June 2014 Note 1. Significant Accounting Policies
page 9
(i) Taxation Equivalent Charges Council is liable to pay various taxes and financial duties in undertaking its business activities. Where this is the case, they are disclosed in these statements as a cost of operations just like all other costs. However, where Council is exempt from paying taxes which are generally paid by private sector businesses (such as income tax), equivalent tax payments have been applied to all Council nominated business activities and are reflected in these financial statements. For the purposes of disclosing comparative information relevant to the private sector equivalent, the following taxation equivalents have been applied to all council nominated business activities (this does not include council’s non-business activities): Notional Rate Applied % Corporate Income Tax Rate – 30% Land Tax – The first $412,000 of combined land values attracts 0%. From $412,001 to $2,519,000 the rate is 1.6% + $100. For the remaining combined land value that exceeds $2,519,000, a premium marginal rate of 2.0% applies. Payroll Tax – 5.45% on the value of taxable salaries and wages in excess of $750,000. Income Tax An income tax equivalent has been applied on the profits of each reported Business Activity. Whilst income tax is not a specific cost for the purpose of pricing a good or service, it needs to be taken into account of in terms of assessing the rate of return required on capital invested. Accordingly, the return on capital invested is set at a pre-tax level (gain/(loss) from ordinary activities before capital amounts) as would be applied by a private sector competitor – that is, it should include a provision equivalent to the corporate income tax rate, currently 30%. Income Tax is only applied where a positive gain/(loss) from ordinary activities before capital amounts has been achieved.
Since this taxation equivalent is notional - that is, it is payable to the “Council” as the owner of business operations, it represents an internal payment and has no effect on the operations of the council. Accordingly, there is no need for disclosure of internal charges in Council's General Purpose Financial Statements. The rate applied of 30% is the equivalent company tax rate prevalent as at balance date. No adjustments have been made for variations that have occurred during the year. Local Government Rates & Charges A calculation of the equivalent rates and charges payable on all Category 1 businesses has been applied to all land assets owned or exclusively used by the Business Activity. Loan & Debt Guarantee Fees The debt guarantee fee is designed to ensure that council business activities face “true” commercial borrowing costs in line with private sector competitors. In order to calculate a debt guarantee fee, council has determined what the differential borrowing rate would have been between the commercial rate and the council’s borrowing rate for its business activities. (ii) Subsidies Government policy requires that subsidies provided to customers and the funding of those subsidies must be explicitly disclosed. Subsidies occur where council provides services on a less than cost recovery basis. This option is exercised on a range of services in order for council to meet its community service obligations. Accordingly, Subsidies disclosed (in relation to National Competition Policy) represents the difference between revenue generated from ‘rate of return’ pricing and revenue generated from prices set by the council in any given financial year. The overall effect of subsidies is contained within the Income Statement of each reported Business Activity.

SPFS 2014_
Waverley Council Notes to the Special Purpose Financial Statements for the financial year ended 30 June 2014 Note 1. Significant Accounting Policies
page 10
(iii) Return on Investments (Rate of Return) The Policy statement requires that councils with Category 1 businesses “would be expected to generate a return on capital funds employed that is comparable to rates of return for private businesses operating in a similar field”. Such funds are subsequently available for meeting commitments or financing future investment strategies. The Rate of Return on Capital is calculated as follows: Operating Result before Capital Income + Interest Expense
Written Down Value of I,PP&E as at 30 June As a minimum, business activities should generate a return equal to the Commonwealth 10 year bond rate which is 3.56% at 30/6/14. The actual rate of return achieved by each Business Activity is disclosed at the foot of each respective Income Statement. (iv) Dividends Council is not required to pay dividends to either itself (as owner of a range of businesses) or to any external entities.

page 11

page 12

Waverley Council SPECIAL SCHEDULES for the year ended 30 June 2014
"We are united by a common passion for ourbeautiful home between the city and the sea."

Special Schedules 2014
page 1
Waverley Council
Special Schedules for the financial year ended 30 June 2014
Contents
Special Schedules1
Net Cost of Services
Statement of Long Term Debt (all purposes)
Statement of Internal Loans (Sect. 410(3) LGA 1993)
Water Supply Operations - incl. Income StatementWater Supply - Statement of Financial Position
Sewerage Service Operations - incl. Income StatementSewerage Service - Statement of Financial Position
- Notes to Special Schedules No. 3 & 5
Report on Infrastructure Assets (as at 30 June 2014)
Financial Projections
Permissible Income Calculation
1 Special Schedules are not audited (with the exception of Special Schedule 9).
Background
These Special Schedules have been designed to meet the requirements of special purpose users such as;
the NSW Grants Commissionthe Australian Bureau of Statistics (ABS),the NSW Office of Water (NOW), andthe Office of Local Government (OLG).
The financial data is collected for various uses including;
the allocation of Financial Assistance Grants,the incorporation of Local Government financial figures in national statistics,the monitoring of loan approvals,the allocation of borrowing rights, andthe monitoring of the financial activities of specific services.
6- Special Schedule No. 7
n/a
n/a
(ii)
- Special Schedule No. 8
(i)
- Special Schedule No. 9 11
- Special Schedule No. 6
10
- Special Schedule No. 5 n/a
Page
2
4
n/a
- Special Schedule No. 1
- Special Schedule No. 2(a)5
- Special Schedule No. 4
- Special Schedule No. 2(b)
- Special Schedule No. 3n/a

Special Schedules 2014
page 2
Waverley Council
Special Schedule No. 1 - Net Cost of Services for the financial year ended 30 June 2014
$'000
Governance
Administration
Public Order and Safety
Beach ControlEnforcement of Local Govt. RegulationsAnimal ControlOtherTotal Public Order & Safety
Health
EnvironmentNoxious Plants and Insect/Vermin ControlOther Environmental ProtectionSolid Waste ManagementStreet CleaningDrainageStormwater ManagementTotal Environment
Community Services and EducationAdministration & EducationSocial Protection (Welfare)Aged Persons and DisabledChildren's ServicesTotal Community Services & Education
Housing and Community AmenitiesPublic CemeteriesPublic ConveniencesStreet LightingTown PlanningOther Community AmenitiesTotal Housing and Community Amenities
Expenses from. Continuing. Operations. Non Capital.
1,520
1
- -
Capital.
Income fromcontinuing operations
1,885
293
209 -
16,903
2,759
17,113
1,565
137 -
4,943
-
-
16 169
-
4,573
8,226 6,900
172
-
(153)
86 (134)
1,917 (965)
82
-
1,350
6,111
10,045
1,943
2,890
- - (4,184)
- (679)
-
972
48 -
6,943
Function or Activity
694
Fire Service Levy, Fire Protection, Emergency Services
3,432
6,818
1,137 7,293
Net Cost.of Services.
365 (2,738) (1,806)
(1,714)
(6,256) (268)
- - - -
(5) - -
(2,212)
-
43
6
1,979
10,504
134
1,325 -
4,637 -
9,997
1,264
3,543 1,714
16,273
23,369 268
4,637
-
-
- -
(77) -
(654)
1
751
(2,278)
77 1,630
-
-
-
(1,629)
(6)
630 -
-
- (1,356)
(3,542)
-

Special Schedules 2014
page 3
Waverley Council
Special Schedule No. 1 - Net Cost of Services (continued) for the financial year ended 30 June 2014
$'000
Recreation and CulturePublic LibrariesMuseumsArt GalleriesCommunity Centres and HallsPerforming Arts VenuesOther Performing ArtsOther Cultural ServicesSporting Grounds and VenuesSwimming PoolsParks & Gardens (Lakes)Other Sport and RecreationTotal Recreation and Culture
Mining, Manufacturing and ConstructionBuilding ControlOther Mining, Manufacturing & ConstructionTotal Mining, Manufacturing and Const.
Transport and CommunicationUrban Roads (UR) - LocalUrban Roads - RegionalSealed Rural Roads (SRR) - LocalSealed Rural Roads (SRR) - RegionalUnsealed Rural Roads (URR) - LocalUnsealed Rural Roads (URR) - RegionalBridges on UR - LocalBridges on SRR - LocalBridges on URR - LocalBridges on Regional RoadsParking AreasFootpathsAerodromesOther Transport & CommunicationTotal Transport and Communication
Economic AffairsCamping Areas & Caravan ParksOther Economic AffairsTotal Economic Affairs
Totals – FunctionsGeneral Purpose Revenues (2)
NET OPERATING RESULT (1)
(1) As reported in the Income Statement (2) Includes: Rates & Annual Charges (incl. Ex Gratia, excl. Water & Sewer), Non Capital General Purpose Grants, Interest on Investments (excl. Ext. Restricted Assets) & Interest on overdue Rates & Annual Charges
Income fromcontinuing operations
- - -
-
346
-
113,026
-
27,438 29,324
1,051 1,051
113,213
1,780
- -
42,899 113,026
1,780
-
70,314
- -
9,865
-
26,816
-
2 -
-
- 1,271
14,428
7 -
3,560 -
-
-
- -
205
Function or Activity
197
-
-
203
- - -
-
-
-
-
-
-
-
18
- -
80 21,769 457 53
1,621
-
938
920
- - - -
20
-
Non Capital.
-
Expenses from. Continuing. Operations.
9,299
1,550 162
4,098
-
607 -
- -
- -
9,443 1,235
-
197
272
-
(3,558)
(162)
- (3,491)
-
(20,068)
80 343
-
Capital.
-
-
-
-
- - -
9,865
- - - -
10,052
-
(32,847) 729
-
2,091 1,264
729
-
12,390
-
-
2
42,899
5,852 -
-
(5,506) -
331
-
(20)
(741)
(1,278)
(331)
Net Cost.of Services.
-
(723)
-
(18)
(8,005)
-
(404) (8,876)
Share of interests - joint ventures & associates using the equity method

Waverley Council
Special Schedule No. 2(a) - Statement of Long Term Debt (all purpose) for the financial year ended 30 June 2014
$'000
Notes: Excludes (i) Internal Loans & (ii) Principal Inflows/Outflows relating to Loan Re-Financing. This Schedule is prepared using the face value of debt obligations, rather than fair value (which are reported in the GPFS).page 4
Total Long Term Debt - -
Total Debt
-
4,287
-
- 1,252 -
- Deferred Payments
- -
1,252
-
3,035
- - - - -
- -
1,117
- - -
3,035
- - -
1,918
-
186 -
-
- Government Advances - Finance Leases -
- - - - -
- -
- - - -
1,252 3,035 Total Loans18
4,287 Other
- - - Other Long Term DebtRatepayers Advances - - -
- -
- -
-
-
- 1,252 - - -
1,252 - - - -
Treasury Corporation-
-
- 18
Public Subscription - -
- - - - -
-
Financial Institutions 1,252 3,017 4,269
- - - Other State Government - - -
- - -
Special S
chedules 2014
Transfers to Sinking
Funds
Principal outstandingInterest
applicable for Year TotalNon
Current
at the end of the year
-
-
- - -
-
- - - -
3,035
- -
1,117 1,900 3,017 -
-
- - -
- - -
Debt redemption during the year
From Revenue
Sinking Funds
-
1,117 - 18
186 -
186 -
1,918 18
-
-
-
-
Principal outstanding New Loans raised during
the year
at beginning of the year
Classification of DebtCurrent Non
Current Total
Loans (by Source)Commonwealth Government
Current
- - - - - - -

Waverley Council
Special Schedule No. 2(b) - Statement of Internal Loans [Section 410(3) LGA 1993] for the financial year ended 30 June 2014
$'000
Note: The summary of Internal Loans (above) represents the total of Council's Internal Loans categorised according to the borrower.
page 5
Summary of Internal Loans
Details of Individual Internal Loans
Principal Outstanding (Principal & Interest) at end of year
Sewer
Total repaid during the year Amount originally raised
Other
Borrower (by purpose)
GeneralWater
Domestic Waste Management
Special S
chedules 2014
2,815 336 2,129
Amount Principal Term
336
476
2.94%
Totals 2,815 336 2,129
Gas
Outstanding at end of year
Date ofBorrower Lender Dates of
(Princ. & Int.)
Total repaid during year
Maturity Interest raised Rate of Originally
(by purpose) (by purpose) Approval (years) Date RaisedMinister's
655 75 597
103 817
666
2,129
677 76 549
507
2,815
82 10 10
30/11/12
30/11/10
Management 12/01/11Waste 12/01/11
Totals12/01/11
4.83%
3.22%30/11/11
10
30/06/20
30/11/13
30/06/21 4.88% 30/06/22
General Domestic 12/01/11
30/06/2310

Waverley Council
Special Schedule No. 7 - Report on Infrastructure Assets as at 30 June 2014
$'000
11,109 46% 10% 2%206,567 3,801
42,684 0%- -
1,932 1,101 675
4,475
4,758 10,307
1,519
7,299
188
- 0%287 176
1,059 649 0%200
28,658
0.0%
30% 0%
6.8%
0.0%
1,398 857
3,151 0%
0%
288
1,436 -
128,638 0.0%
-
7,634
Kerb and Gutter
sub total
Sealed Roads Structure Footpaths
60%
43.0%
Other Road Assets
93.2%
11,174
0%38,288
- 6%
100%
100%
2%-
47,435 65,507
1,719
87% 13%16%
5
Council Public Halls
Other BuildingsSpecialised Buildings
3
Council Works Depot
6%32%
19.0%
0%0%
-
94%100%
Asset Category4
Annual Maintenance Down Value (WDV) (4)-Maintenance
satisfactory 21
-
Asset Class
84%
Council Offices /Administration Centres
to bring up to a Estimated cost
Actual (3)--Required (2)- Written
standard (1)_ 2013/14
186 303
Libraries
8,455
-
1,817 188
- 15 284
1,852 -
1,519 1,255
0.1%
0.0%
52% 35%0%
29.8%
5,459 30.0%43% 19% 8%5,459
1,817 288
Buildings
Sealed Roads Surface Roads
Other Structuressub total
Other Structures
sub total
13%12%
53,795 1%28,728
7.0% 1.4%61.7% Special S
chedules 2014
Assets in Condition as a % of WDV (4), (5)
812 1%3%
0%
8.0%
35%49%41%
100%
page 6
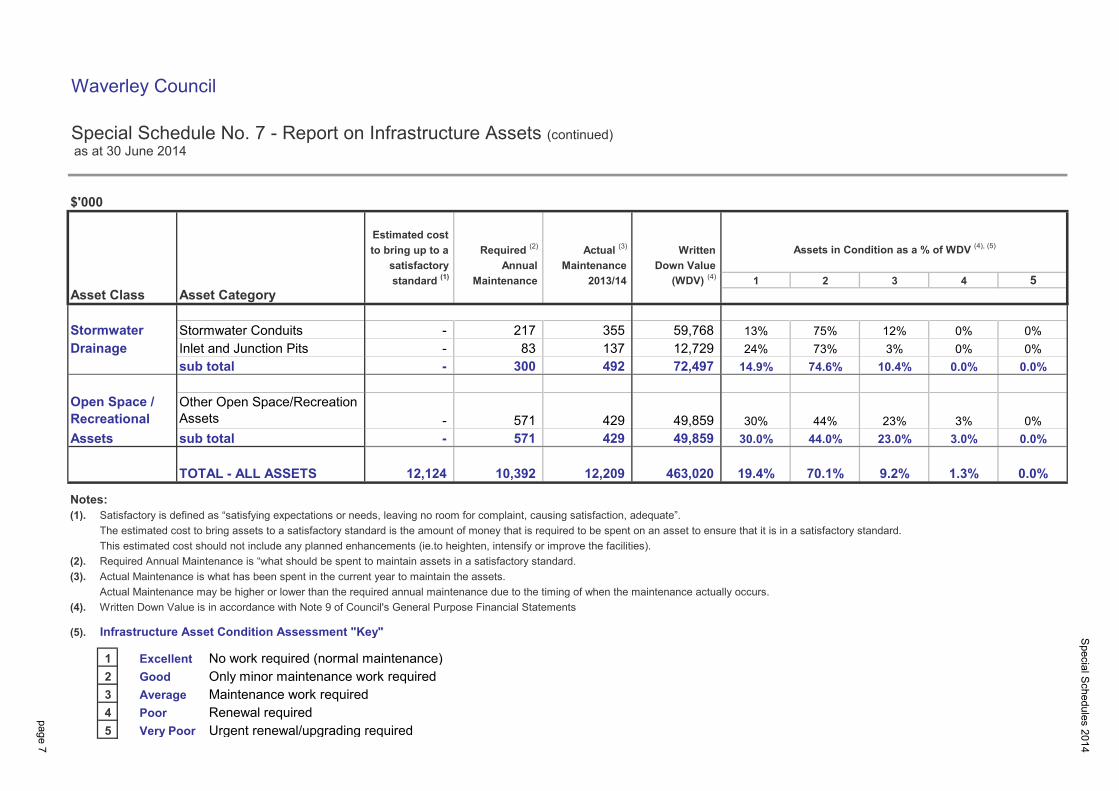
Waverley Council
Special Schedule No. 7 - Report on Infrastructure Assets (continued) as at 30 June 2014
$'000
Notes:(1). Satisfactory is defined as “satisfying expectations or needs, leaving no room for complaint, causing satisfaction, adequate”.
The estimated cost to bring assets to a satisfactory standard is the amount of money that is required to be spent on an asset to ensure that it is in a satisfactory standard.This estimated cost should not include any planned enhancements (ie.to heighten, intensify or improve the facilities).
(2). Required Annual Maintenance is “what should be spent to maintain assets in a satisfactory standard.(3). Actual Maintenance is what has been spent in the current year to maintain the assets.
Actual Maintenance may be higher or lower than the required annual maintenance due to the timing of when the maintenance actually occurs.(4). Written Down Value is in accordance with Note 9 of Council's General Purpose Financial Statements
(5). Infrastructure Asset Condition Assessment "Key"
Excellent No work required (normal maintenance) Condition Description here…Good Only minor maintenance work required Condition Description here…Average Maintenance work required Condition Description here…Poor Renewal required Condition Description here…Very Poor Urgent renewal/upgrading required Condition Description here…
page 7
Asset Class
5
-
-
Open Space / Recreational - 571
Stormwater
Written
4
21
72,497 sub total 14.9%
3
Other Open Space/Recreation Assets
0%
74.6% 0.0%10.4%492
Asset Category
Annual satisfactory standard (1)- Maintenance 52013/14
Maintenance
3%137 83 - 73%24%12,729 12%
Down Value
0%
Required (2)-to bring up to a
21 3(WDV) (4)-
0%
Actual (3)-Estimated cost
0%
0.0%300
355 217 13%0%
3%
Special S
chedules 2014
Assets sub total - 571 429 49,859 30.0% 44.0% 23.0% 3.0% 0.0%
789
Assets in Condition as a % of WDV (4), (5)
4
6
10
429 49,859 30% 44% 23%
Drainage Inlet and Junction PitsStormwater Conduits 75%59,768
TOTAL - ALL ASSETS 12,124 10,392 12,209 463,020 19.4% 70.1% 9.2% 1.3% 0.0%
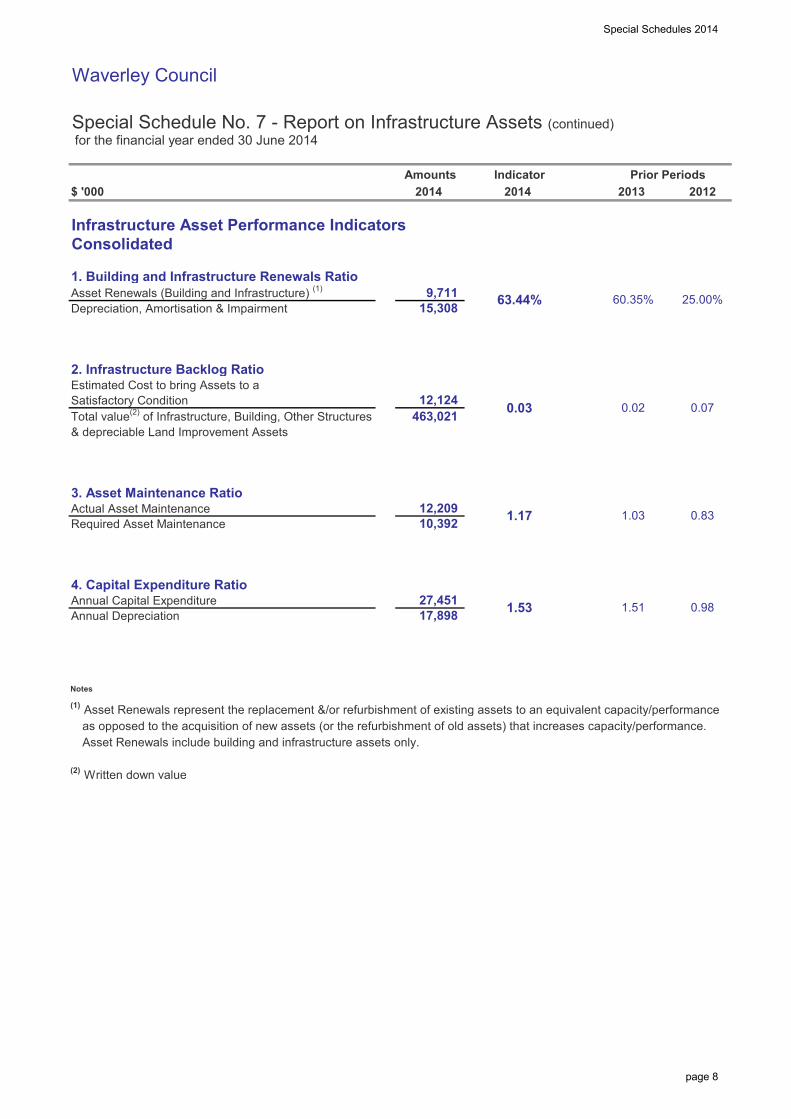
Special Schedules 2014
page 8
Waverley Council
Special Schedule No. 7 - Report on Infrastructure Assets (continued) for the financial year ended 30 June 2014
$ '000
Infrastructure Asset Performance IndicatorsConsolidated
1. Building and Infrastructure Renewals RatioAsset Renewals (Building and Infrastructure) (1)
Depreciation, Amortisation & Impairment
2. Infrastructure Backlog RatioEstimated Cost to bring Assets to aSatisfactory ConditionTotal value(2) of Infrastructure, Building, Other Structures& depreciable Land Improvement Assets
3. Asset Maintenance RatioActual Asset MaintenanceRequired Asset Maintenance
4. Capital Expenditure RatioAnnual Capital ExpenditureAnnual Depreciation
Notes
(1) Asset Renewals represent the replacement &/or refurbishment of existing assets to an equivalent capacity/performance
as opposed to the acquisition of new assets (or the refurbishment of old assets) that increases capacity/performance.
Asset Renewals include building and infrastructure assets only.
(2) Written down value
Amounts Indicator Prior Periods
12,124 0.03 0.02 0.07463,021
2014 2014 2013 2012
9,711 63.44% 60.35% 25.00%15,308
27,451 1.53 1.51 0.9817,898
12,209 1.17 1.03 0.8310,392
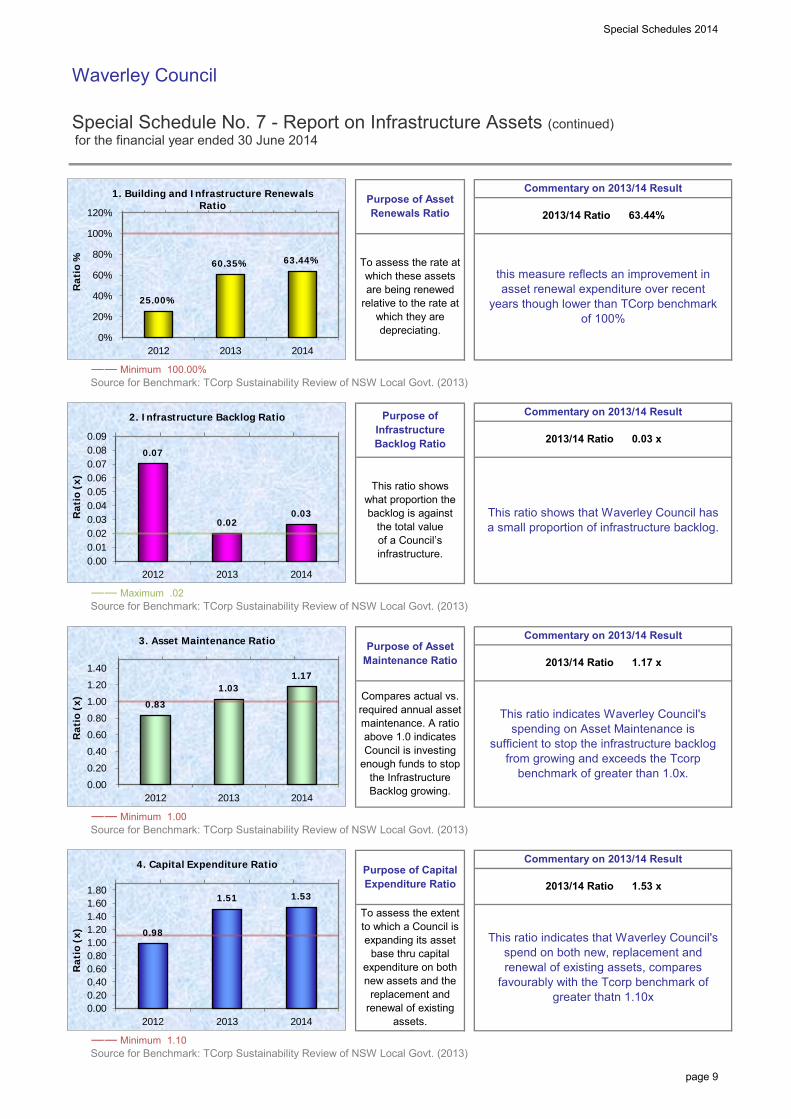
Special Schedules 2014
page 9
Waverley Council
Special Schedule No. 7 - Report on Infrastructure Assets (continued) for the financial year ended 30 June 2014
―― Minimum 100.00%Source for Benchmark: TCorp Sustainability Review of NSW Local Govt. (2013)
―― Maximum .02Source for Benchmark: TCorp Sustainability Review of NSW Local Govt. (2013)
―― Minimum 1.00Source for Benchmark: TCorp Sustainability Review of NSW Local Govt. (2013)
―― Minimum 1.10Source for Benchmark: TCorp Sustainability Review of NSW Local Govt. (2013)
Compares actual vs. required annual asset maintenance. A ratio above 1.0 indicates Council is investing
enough funds to stop the Infrastructure Backlog growing.
This ratio indicates Waverley Council's spending on Asset Maintenance is
sufficient to stop the infrastructure backlog from growing and exceeds the Tcorp
benchmark of greater than 1.0x.
Purpose of Asset Renewals Ratio
Commentary on 2013/14 Result
2013/14 Ratio 63.44%
To assess the rate at which these assets are being renewed
relative to the rate at which they are depreciating.
this measure reflects an improvement in asset renewal expenditure over recent
years though lower than TCorp benchmark of 100%
Purpose of Infrastructure Backlog Ratio
Commentary on 2013/14 Result
2013/14 Ratio 0.03 x
This ratio showswhat proportion the backlog is against
the total valueof a Council’s infrastructure.
This ratio shows that Waverley Council has a small proportion of infrastructure backlog.
Purpose of Asset Maintenance Ratio
Commentary on 2013/14 Result
2013/14 Ratio 1.17 x
Purpose of Capital Expenditure Ratio
Commentary on 2013/14 Result
2013/14 Ratio 1.53 x
To assess the extent to which a Council is expanding its asset
base thru capital expenditure on both new assets and the
replacement and renewal of existing
assets.
This ratio indicates that Waverley Council's spend on both new, replacement and renewal of existing assets, compares
favourably with the Tcorp benchmark of greater thatn 1.10x
0.83
1.03 1.17
0.00
0.20
0.40
0.60
0.80
1.00
1.20
1.40
2012 2013 2014
Rat
io (
x)
3. Asset Maintenance Ratio
25.00%
60.35% 63.44%
0%
20%
40%
60%
80%
100%
120%
2012 2013 2014
Rat
io %
1. Building and Infrastructure Renewals Ratio
0.07
0.02 0.03
0.000.010.020.030.040.050.060.070.080.09
2012 2013 2014
Rat
io (
x)
2. Infrastructure Backlog Ratio
0.98
1.51 1.53
0.000.200.400.600.801.001.201.401.601.80
2012 2013 2014
Rat
io (
x)
4. Capital Expenditure Ratio

Waverley Council
Special Schedule No. 8 - Financial Projections as at 30 June 2014
$'000
(i) OPERATING BUDGETIncome from continuing operationsExpenses from continuing operations
Operating Result from Continuing Operations
(ii) CAPITAL BUDGETNew Capital Works (2)
Replacement/Refurbishment of Existing AssetsTotal Capital Budget
Funded by:– Loans– Asset sales– Reserves– Grants/Contributions– Recurrent revenue– Other
Notes:(1) From 13/14 Income Statement.(2) New Capital Works are major non-recurrent projects, eg new Leisure Centre, new Library, new Swimming pool etc.(3) Financial projections should be in accordance with Council’s Integrated Planning and Reporting framework.
Special S
chedules 2014
page 10
22/23
157,511 149,704
7,807
1,950 22,790
- 24,740
- 23,178 35,181
-
- 2,135 3,289 9,663
- 15,087
- 14,840 4,635
15,523 4,832
21,402
Forecast(3)
- - -
8,947 4,209
Forecast(3)
21/22
154,563 145,346
9,217
100
24,740
- -
3,129 4,444
17,167
-
4,126 14,843
Forecast(3) Forecast(3)
23/24
161,223 153,174
8,049
100 14,987 15,087
-
20/21
148,606 141,552
7,054
12,050 23,131 35,181
23,078 23,178
-
1,000
35,998
Forecast(3)
19/20
143,863 136,762
7,101
13,900 26,727 40,627
1,000 -
19,157 5,394
15,076 -
40,627
Forecast(3)
18/19
139,849 132,275
7,574
12,050 23,948 35,998
39,972 - 44,623 -
36,513 51,208 - - - -
4,998 12,056
- 6,299 17,716 -
- 9,726 7,003
11,366 11,429
17,558 8,953
13,848 - -
30,808 27,822
1,000
39,972
13,110
51,208
21,918
- 44,623 36,513
- 3,088 500
4,500 - 7,248
20,400 12,150
123,078 216,511 119,785
7,050
99,431 10,749
128,111
11,093
124,935
- 33,978 29,463
113,026 117,080
10,052 12,346
- 10,645
17/18 Forecast(3)Forecast(3)
16/17
136,028 132,131 138,860
13/14 Forecast(3)
15/16 14/15 Forecast(3) Actual(1)

Special Schedules 2014
page 11
Waverley Council
Special Schedule No. 9 - Permissible Income Calculation for the financial year ended 30 June 2015
$'000
Notional General Income Calculation (1)
Last Year Notional General Income YieldPlus or minus Adjustments (2)
Notional General Income
Permissible Income Calculation
Special variation percentage (3)
or Rate peg percentageor Crown land adjustment incl. rate peg percentage
less expiring Special variation amountplus Special variation amount
or plus Rate peg amountor plus Crown land adjustment and rate peg amount
sub-total
plus (or minus) last year's Carry Forward Totalless Valuation Objections claimed in the previous yearsub-total
Total Permissible income
less Notional General Income YieldCatch-up or (excess) result
plus Income lost due to valuation objections claimed (4)
less Unused catch-up (5)
Carry forward to next year
Notes1 The Notional General Income will not reconcile with rate income in the financial statements in the
corresponding year. The statements are reported on an accrual accounting basis which include amountsthat relate to prior years' rates income.
2 Adjustments account for changes in the number of assessments and any increase or decrease in landvalue occurring during the year. The adjustments are called "supplementary valuations" as defined in theValuation of Land Act 1916.
3 The Special Variation Percentage is inclusive of the Rate Peg percentage and where applicable crown landadjustment.
4 Valuation objections are unexpected changes in land values as a result of land owners successfullyobjecting to the land value issued by the Valuer-General. Councils can claim the value of the income lostdue to valuation objections in any single year.
5 Unused catch-up amounts will be deducted if they are not caught up within 2 years. Usually councils willhave a nominal carry forward figure. These amounts can be adjusted for in setting the rates in a future year.
p
q = o - p
r
st = q + r - s
b
d
e
f
k = (c+g+h+i+j)
j = c x f
i = c x e
h = c x d
c
l
m
n = (l + m)
o = k + n
g
a
11 (7)
Calculation Calculation2013/14 2014/15
- -
11 (7)
- -
40,197 41,347
40,186 41,354
- - 20 11
4,432.38 -
20 11
- 929 - -
40,177 41,335
0.00% 0.00%
- -
12.40% 0.00%0.00% 2.30%
35,667 40,186 78 220
35,745 40,406

page 12

page 13

Waverley Council 55 Spring St, Bondi Junction, NSW 2022
PO Box 9 Bondi Junction NSW 1355
www.waverley.nsw.gov.au
Telephone enquiriesGeneral business 9369 8000
General fax 9387 1820
TTY/voice calls for hearing/speech impaired 133 677
After hours emergencies 9369 8000