no. 38/2017 performance of the thai banking system …€¦ · no. 38/2017 performance of the thai...
TRANSCRIPT

No. 38/2017
Performance of the Thai Banking System in the Second Quarter of 2017
Ms. Daranee Saeju, Senior Director, Financial Institutions Strategy Department, Bank of Thailand, reported on the Thai banking system’s performance in the second quarter of 2 0 1 7 that loan growth expanded mainly from corporate loans, with concentrations in certain large industries. Loan quality deteriorated, particularly from few large corporates. Meanwhile, net profit declined due to an increase in provisioning expense. However, the Thai banking system remained resilient with high level of loan loss provision and capital fund to support credit expansion as well as the continued economic recovery. Details are as follows.
Bank loan growth rose at 3.3% year-on-year in line with continuing economic expansion. Loan growth was driven mainly by large corporate loans in several industries. In addition, there was continual increase in business financing through debt and equity securities. As a result, combined financing through bank loans and debt securities grew at 5.2% year-on-year.
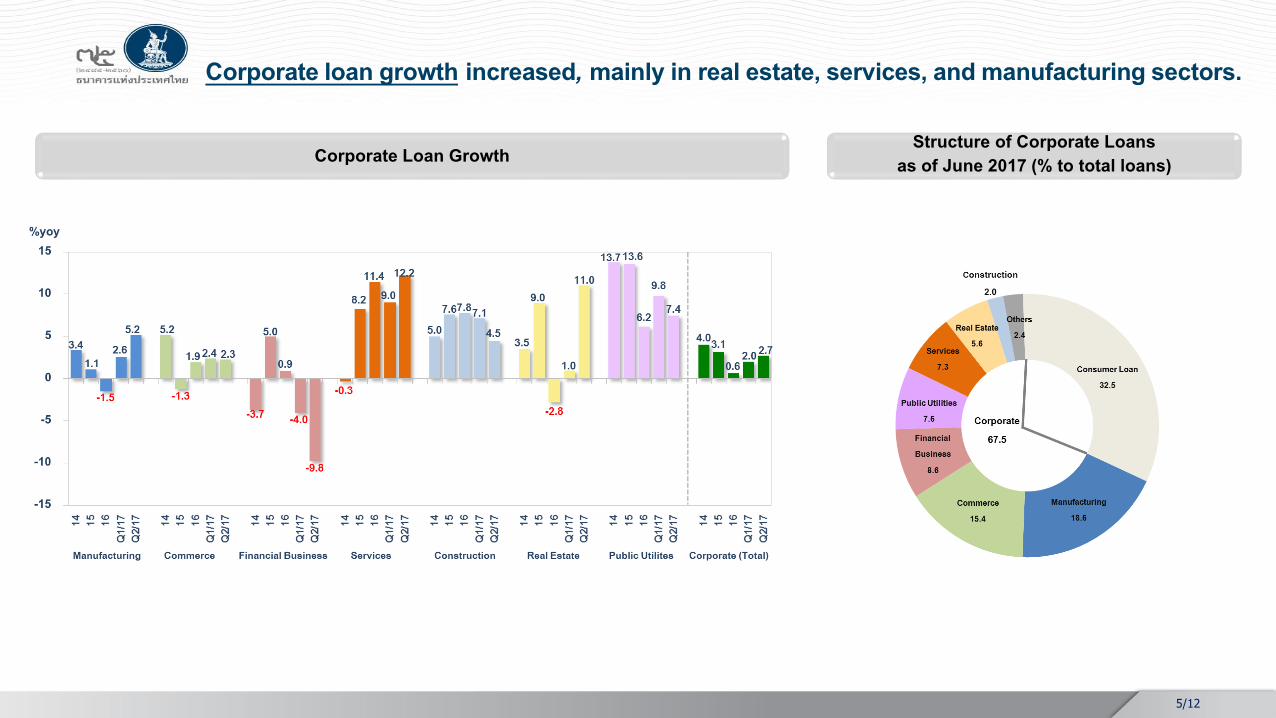
Corporate loan (67.5% of total loans) expanded at 2.7% year-on-year, driven mainly by large corporate loans. Loans to large corporate (excluding financial business) accelerated to 7.0%, mainly from real estate, export-related industries (e.g. electronics), street construction, and service sectors. Loans to SME (excluding financial business) continued to grow since the end of last year to 3.2% year-on-year, largely from accommodation and office building business.
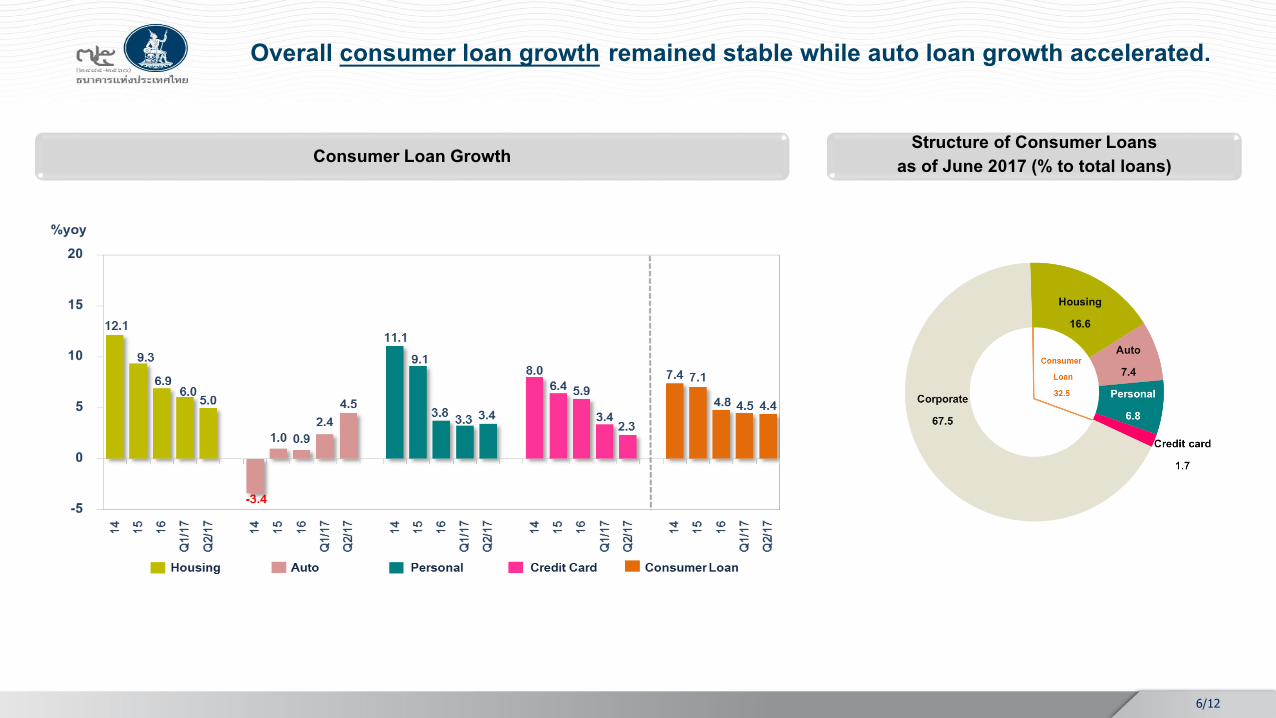
Consumer loan (32.5% of total loans) growth remained relatively stable at 4.4%, with continued acceleration in auto loan growth after the end of five-year holding period of the first car tax rebate scheme. Meanwhile, housing and credit card loan growth still decelerated.
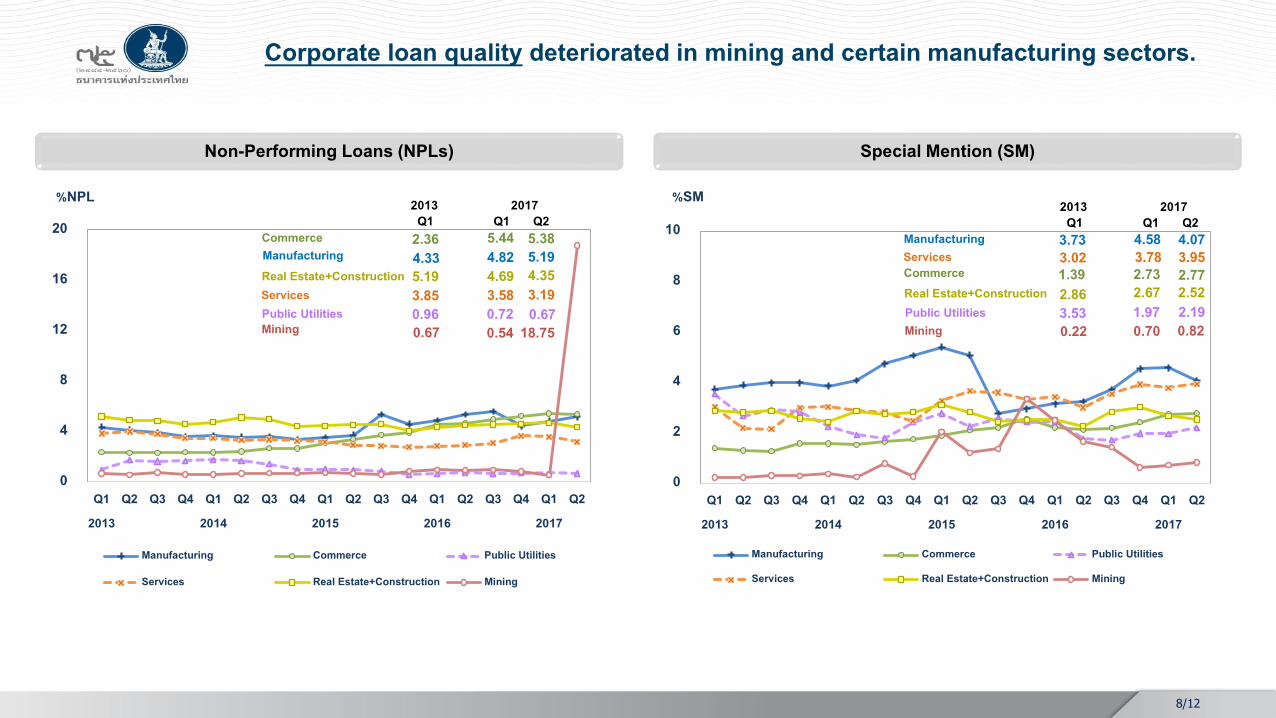
Loan quality of the banking system deteriorated mostly from few large corporates, while debt write-off significantly increased, resulting in the stable ratio of Gross Non-Performing Loans (NPLs) to total loan of 2.95%, compared to 2.94% last quarter. The increase in NPLs this quarter was owing mainly to large corporate loans in mining sector as well as some industries

affected by commodity prices. Likewise, NPLs of loans to small-sized SME continued to increase particularly in commerce and also some industrial sectors affected by commodity prices. However, the overall NPL ratio of SME loans started to decline from the reduction of NPLs in medium-sized SME. Consumer loan quality showed improvement in almost all loan types except for auto loans. Special mention loans (SMs: loans overdue above 1 month but not more than 3 months) to total loan ratio declined from last quarter to 2.54%, partly due to loan migration to NPL. Nevertheless, banks accumulated higher loan loss provision to cushion for loan quality deterioration, resulting in continued increase in banking system’s total provision to 561 billion baht and the ratio of actual to regulatory loan loss provision at 160.7%.
In the second quarter of 2017, the banking system recorded net profit of 49 billion baht, decreased from the same period last year as a consequence of increased provisioning expense to cushion for further loan quality deterioration. Thus, return on asset (ROA) declined to 1.1% from 1.16% last quarter while net interest margin (NIM) remained stable at 2.62% largely due to banks’ liability management.
Capital fund of the banking system remained high, with total of 2,369 billion baht, increased from appropriation of earnings and issuance of subordinated debts (Tier-2). Hence, capital adequacy ratio (BIS ratio) and common equity Tier-1 ratio (CET1 ratio) were at 17.9% and 15.2%, respectively.
Bank of Thailand August 11, 2017
Contact: Financial Performance and Loan Analysis Team Tel: +66 (0) 2283 5980 e-mail: FP&[email protected]

Performance of the Thai Banking System in the Second Quarter of 2017

Loan growth increased to a level comparable to GDP growth. Loan growth increased mainly from large corporate loans
in several industries.
Overall consumer loan growth remained stable while auto loan growth accelerated.
Loan quality deteriorated. NPL increased mostly from few large corporates,
whereas bank’s debt write-off increased, resulting in the ratio of NPL to total loan of 2.95%, compared to 2.94% last quarter.
Banks’ net profit declined. Net profit declined due to increased provisioning
expense to cushion for deterioration in loan quality.
Loan loss provision and capital fund remained high. Ratio of actual to regulatory loan loss provision was at
160.7%.
BIS ratio and Tier-1 ratio were at 17.9% and 15.2% respectively.
Overall Performance of the Thai Banking Systemin the Second Quarter of 2017
2/12

13.9
2.8 3.3
12.1
18.917.1
13.7
5.0 5.2
0
5
10
15
20
25
30
Q1 Q2 Q3 Q4 Q1 Q2 Q3 Q4 Q1 Q2 Q3 Q4 Q1 Q2 Q3 Q4 Q1 Q2 Q3 Q4 Q1 Q2
2012 2013 2014 2015 2016 2017
Real GDP Total Loan Bond* Total Loan and Bond*
%yoy
GDP and Loan Growth
*Debt securities include commercial paper and corporate bond issued by private sector.Source: Bank of Thailand
Bank loans and financing through debt securities expanded in line with continued economic expansion.
3/12
4/12
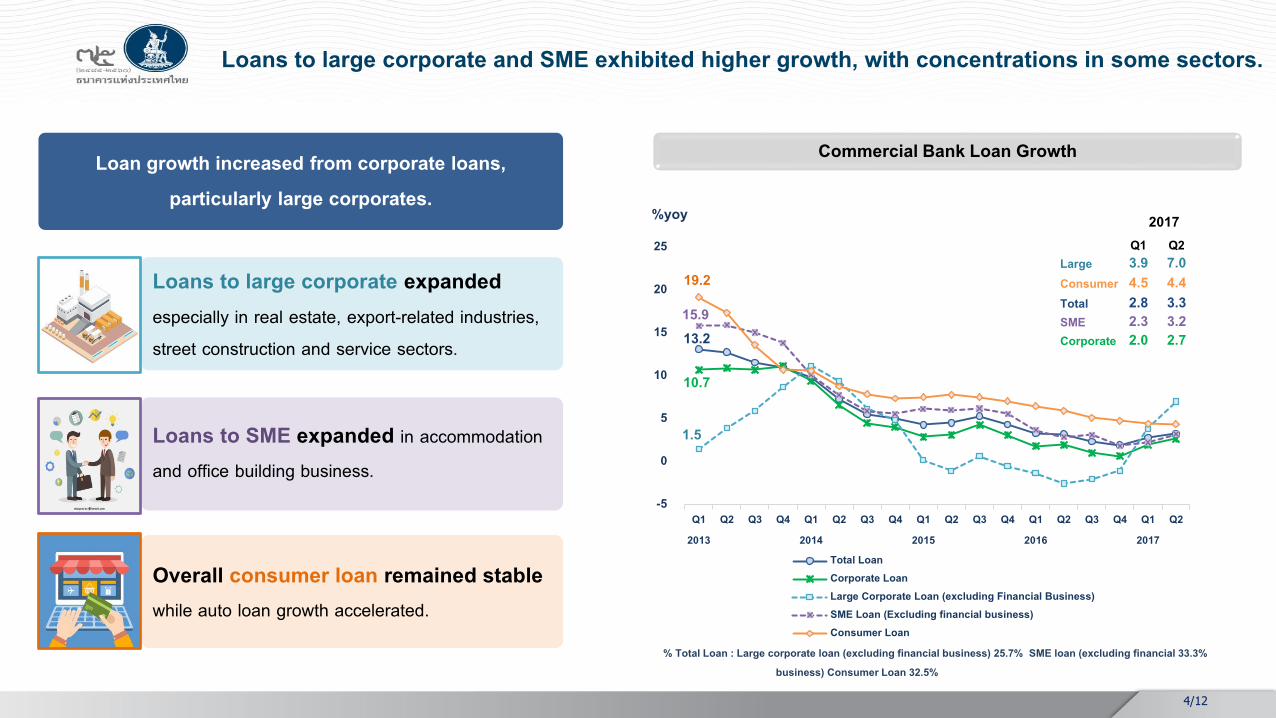
Loans to large corporate and SME exhibited higher growth, with concentrations in some sectors.
% Total Loan : Large corporate loan (excluding financial business) 25.7% SME loan (excluding financial 33.3% business) Consumer Loan 32.5%
Commercial Bank Loan Growth
Loans to large corporate expanded especially in real estate, export-related industries, street construction and service sectors.
Loans to SME expanded in accommodation and office building business.
Overall consumer loan remained stable while auto loan growth accelerated.
Loan growth increased from corporate loans,particularly large corporates.
13.2
10.7
1.5
15.9
19.2
-5
0
5
10
15
20
25
Q12013
Q2 Q3 Q4 Q12014
Q2 Q3 Q4 Q12015
Q2 Q3 Q4 Q12016
Q2 Q3 Q4 Q12017
Q2
Total LoanCorporate LoanLarge Corporate Loan (excluding Financial Business)SME Loan (Excluding financial business)Consumer Loan
%yoy 2017Q1 Q2
Large 3.9 7.0Consumer 4.5 4.4Total 2.8 3.3SME 2.3 3.2Corporate 2.0 2.7
5/12
Corporate loan growth increased, mainly in real estate, services, and manufacturing sectors.
Structure of Corporate Loans as of June 2017 (% to total loans)Corporate Loan Growth
6/12
Overall consumer loan growth remained stable while auto loan growth accelerated.
Structure of Consumer Loans as of June 2017 (% to total loans)Consumer Loan Growth

2.17
1.28
3.45
2.03
0
1
2
3
4
5
6
Q12013
Q2 Q3 Q4 Q12014
Q2 Q3 Q4 Q12015
Q2 Q3 Q4 Q12016
Q2 Q3 Q4 Q12017
Q2
%NPL to Total Loan %NPL to Large Corporate Loan%NPL SME Loan %NPL Consumer Loan
%NPL
7/12
Loan quality: NPL increased mostly from few large corporates.
Special Mention (SM)Non-Performaing Loans (NPLs)
2017
2.131.56
2.28
2.92
0
1
2
3
4
5
6
Q12013
Q2 Q3 Q4 Q12014
Q2 Q3 Q4 Q12015
Q2 Q3 Q4 Q12016
Q2 Q3 Q4 Q12017
Q2
%SM to Total Loan %SM Large Corporate Loan%SM SME Loan %SM Consumer Loan
%SM 2017Q1 Q2
SME 4.48 4.42Total 2.94 2.95Consumer 2.82 2.66Large 1.59 1.81
Q1 Q2Consumer 3.11 3.20Total 2.61 2.54SME 2.55 2.52Large 2.29 2.07
8/12
Corporate loan quality deteriorated in mining and certain manufacturing sectors.
Special Mention (SM)Non-Performing Loans (NPLs)
3.73 4.58 4.07
1.39 2.73 2.77
3.53 1.97 2.19
3.02 3.78 3.95
2.86 2.67 2.52
0.22 0.70 0.82
0
2
4
6
8
10
Q12013
Q2 Q3 Q4 Q12014
Q2 Q3 Q4 Q12015
Q2 Q3 Q4 Q12016
Q2 Q3 Q4 Q12017
Q2
Manufacturing Commerce Public Utilities
Services Real Estate+Construction Mining
%SM
4.33 4.82 5.192.36 5.44 5.38
0.96 0.72 0.673.85 3.58 3.195.19 4.69 4.35
0.67 0.54 18.75
0
4
8
12
16
20
Q12013
Q2 Q3 Q4 Q12014
Q2 Q3 Q4 Q12015
Q2 Q3 Q4 Q12016
Q2 Q3 Q4 Q12017
Q2
Manufacturing Commerce Public Utilities
Services Real Estate+Construction Mining
%NPL 2013 2017 Q1 Q1 Q2
Manufacturing
Public UtilitiesServices
Commerce
Real Estate+Construction
Mining
Manufacturing
Public Utilities
ServicesCommerceReal Estate+Construction
Mining
2013 2017 Q1 Q1 Q2

1.35
1.70 1.78
6.22
7.15 7.37
1.87
2.32 2.30
1.94
2.27 2.34
0
2
4
6
8
10
12
Q12013
Q2 Q3 Q4 Q12014
Q2 Q3 Q4 Q12015
Q2 Q3 Q4 Q12016
Q2 Q3 Q4 Q12017
Q2
Housing Auto Personal Credit Card
%SM
9/12
Consumer loan quality : NPL declined in almost all loan types except auto loans.
Special Mention (SM)Non-Performing Loans (NPLs)
2.34
3.23 3.06
1.52
1.63 1.66
1.96
2.83 2.60
2.46
4.09 3.43
0
2
4
6
8
10
Q12013
Q2 Q3 Q4 Q12014
Q2 Q3 Q4 Q12015
Q2 Q3 Q4 Q12016
Q2 Q3 Q4 Q12017
Q2
Housing Auto Personal Credit Card
%NPL 2017Q1 Q2
2017Q1 Q2
PersonalHousingCredit Card
AutoCredit CardPersonalAuto
Housing

10/12
Capital fundLoan loss provision
Loan loss provision and capital fund remained high.

11/12
The Thai banking system’s net profit declined due to increased provisioning expense.
Return on Asset, Return on Equity and Net Interest MarginProfitability

12/12
The Thai banking system has sufficient liquidity to facilitate credit expansion.
Liquidity Coverage Ratio (LCR) Loan to Deposit Ratio
96.5 96.2 97.1
80
85
90
95
100
105
9,000
10,000
11,000
12,000
13,000
Q12013
Q2 Q3 Q4 Q12014
Q2 Q3 Q4 Q12015
Q2 Q3 Q4 Q12016
Q2 Q3 Q4 Q12017
Q2
Deposit Loan L/D Ratio [RHS]
Billion Baht %
167.1 178.1
162.3
0
40
80
120
160
200
0
1,000
2,000
3,000
4,000
5,000
Jan2016
Mar May Jul Sep Nov Jan2017
Mar May
High-quality Liquid Assets (HQLA) LCR [RHS]
Billion Baht %
June