no. 73 - uni-giessen.de
TRANSCRIPT
No. 73
Psychological Prices of Branded Foods and Price Rigidity:
Evidence from German Scanner Data*
by Roland HERRMANN**
and Anke MÖSER***
Gießen, March 2004
* Financial support provided by Deutsche Forschungsgemeinschaft in the project “Intertemporal Price Formation in the Grocery-retailing Sector: Theory and Empirical Tests” (He 1419/8-1) is gratefully acknowledged. This project made it possible to use the scanner dataset on which the empirical analysis is based. Thanks are due to seminar participants in the Institute of Agricultural Policy and Market Research, University of Giessen, for very helpful comments on an earlier version and Simone THEUERKAUF for very helpful research assistance.
** Prof. Dr. Roland HERRMANN Dr. Anke MÖSER, Institute of Agricultural Policy and Market Research, University of Giessen, Senckenbergstr. 3, D-35390 Giessen, Germany. E-mail: [email protected]
*** Dr. Anke MÖSER, Institute of Nutritional Science, Nutrition Education and Consumer Behaviour, University of Giessen, Senckenbergstr. 3, D-35390 Giessen, Germany. E-mail: [email protected]
The series contains manuscripts in a preliminary form which are not yet published in a professional journal. Interested readers are welcome to direct criticisms and suggestions directly to the authors. Quotations should be cleared with the authors.
The "Discussion Papers in Agricultural Economics" are edited by: Institut für Agrarpolitik und Marktforschung, University of Giessen, Senckenbergstr. 3, D-35390 Giessen, Germany. Tel.: 0641/99-37020, Telefax: 0641/99-37029.

1 Introduction
There is increasing evidence from scanner data that branded foods in the grocery retailing sector contain a substantial amount of price rigidity (HERRMANN/MÖSER 2003). One of the many alternative explanations for price rigidity is the existence of psychological pricing points. The economic literature has been most hesitant against this theory and, in a survey, BLINDER et al. (1998) found no confirmation at all based on the views of business managers. In that study, however, retail trade is underrepresented. The theory of psychological pricing points continues to be an important concept for pricing in firms which directly sell to consumers. Empirical findings in various studies, e.g. in the early work by FRIEDMAN (1967) for food retailing, suggest that psychological prices are widely used in the retailing sector. Hence, it is the objective of this paper to elaborate to which extent psychological pricing plays a role in grocery retailing and whether it contributes to price rigidity of branded foods in Germany. The empirical analysis will be based on scanner data of weekly prices for 20 branded foods in Germany in the period 1996-99.
The paper is organized as follows. The literature on the theory and evidence of psychological pricing will be surveyed in Section 2. Then, the scanner data base is sketched in Section 3 and an overview of price rigidity in food markets is given. In Section 4, an empirical analysis of the importance of psychological pricing for branded foods follows. It will then be discussed in Section 5 whether psychological pricing is a main cause of food price rigidity. Conclusions are drawn and major results are summarized in Section 6.
2 Theory and Evidence of Psychological Pricing Points in the Literature
We have to distinguish the industrial organization (IO) and/or macroeconomic literature from the marketing literature on psychological pricing points. The treatment of the issue differs between the two branches of the literature. In the macroeconomic literature, the microeconomic foundation of macroeconomic behaviour is a central part. More specifically, sticky prices are crucial in Keynesian macroeconomics and many studies have dealt with the question whether prices in the economy are actually sticky and why. Here, psychological pricing points come into play as they can cause price rigidity. As psychological pricing points are an outcome of imperfect markets, authors from the IO literature have been interested, too, in psychological prices as determinant of price rigidity. The marketing literature differs from the IO and macroeconomic literature. Psychological prices are discussed there as to whether they are an adequate tool to realize firms’ profit objectives. The question is addressed, too, which kind of psychological prices performs best in terms of the marketing objectives.
2.1 The IO and macroeconomic literature
In the IO and/or macroeconomic literature on price rigidity, the theory of psychological pricing points has received some attention in the important book by BLINDER et al. (1998). BLINDER et al. surveyed decision-makers in firms on how they set prices and which explanations of price stickiness are important for their decisions. Psychological pricing points
1
has been one of twelve theories of price stickiness which was included: It is one of the few theories of nominal rigidity. According to the theory of psychological pricing points, nominal pricing points are psychologically so important to consumers that these react with a strong decrease in demand if prices go beyond the psychological pricing point. Firms following the theory of psychological prices would, thus, start from the presumption of a kinked demand curve – with several kinks at different pricing points – where demand is strongly elastic above the kinks. At each kink, it is then optimal to leave the price unchanged for at least some variation in marginal costs. Hence, psychological pricing points are a cause of price rigidity if firms are profit maximizers.
BLINDER et al. (1998) came up with some very interesting empirical conclusions. In general, the theory of psychological pricing points is ranked eight out of twelve theories – with a generally low score of agreement. However, the authors find a significantly stronger agreement for those firms selling directly to consumers. Psychological pricing points, as far as they are regarded as important, are also seen as a cause of price asymmetry. Pricing points are rather viewed as a wall against further price increases than as a general guideline where each price change implies a move on psychological pricing point to the next. Moreover, BLINDER et al. detect that those who think that quality is judged by price and who assess demand as elastic, rate psychological pricing points high, too.
There are some other studies commenting on the role of psychological pricing for price stickiness. KASHYAP (1995), in his often-cited study on warehouse catalogue prices, found that “being near a price point in the low inflation period reduced the probability of a price change” (p. 268). He found some limited evidence for psychological pricing points. KÖHLER (1996), in a business-survey study, reached conclusions similar to BLINDER et al. for Germany. The theory of psychological pricing points was not confirmed by most participants of the study. However, there is a substantial amount of uncertainty regarding customers’ reactions to price changes which may cause price stickiness. The uncertainty about psychological pricing points seems to be part of this general uncertainty (KÖHLER 1996, pp. 172-174). In a further study with German data, FENGLER and WINTER (2001) strongly confirm the relevance of psychological pricing points for coffee retail prices. The authors explore information of the Gesellschaft für Konsumforschung (GfK) consumer panel and show that 86 % of more than 14,000 purchases in 1995 were subject to psychological focal pricing (FENGLER/WINTER 2001, p. 100). Furthermore, it is elaborated that individual psychological prices matter for the dynamics of the general price adjustment.
2.2 The marketing literature
The marketing literature on psychological prices has a different focus compared to the IO literature. A major discussion exists on whether “psychological pricing”, “odd pricing” or “just-below-the-round-figure pricing” is justified from a marketing perspective or whether this pricing strategy leads to a major loss compared with even prices1. Of course, it is crucial for the answer to this question whether and how strongly consumers react to odd as opposed
1 See, e.g., BLATTBERG/NESLIN (1990, pp. 349 et seq.) for a survey of the importance of psychological pricing in retailers’ promotional acitivities.
2

to even prices. It is also important whether firms have full information on the behaviour of their customers or not.
In the German literature, KAAS and HAY (1984) showed that the firms’ decisions for odd rather than even prices may induce high aggregate losses, although the difference between 2.99 and 3.00 DM seems negligible. Based on their finding and a survey of the related literature on psychological pricing, GEDENK/SATTLER (1999) argued that the firms’ decisions may be justified under uncertainty. They agree that high losses may occur if existing price thresholds are ignored. Moreover, they derive that the error is many hundred times more severe, if existing price thresholds are ignored than if non-existing price thresholds are considered with a general pricing strategy ending at digit 9. Thus, firms suffering from uncertainty about their customers’ behaviour are better advised if they follow an odd-pricing strategy.
Some recent contributions in the marketing literature are based on explanations of price endings based on cognitive psychology. Furthermore, these theories are empirically tested and the sales effect of odd prices measured (STIVING/WINER 1997; SCHINDLER/KIBARIAN 1996; SCHINDLER/KIRBY 1997). A common result is that prices ending at digit 9 may raise sales. STIVING/WINER (1997) distinguish level and image effects for specific price endings. One level effect, also stressed by SCHINDLER/KIBARIAN (1995) and SCHINDLER/KIRBY (1997), is due to rounding down. Consumers are expected to round down prices and, thus, an incentive exists for firms to utilize just-below prices ending at digits 9 or 99. Another explanation for a level effect is left-to-right comparison. This implies that consumers tend to compare prices by considering the digits from left to right. Image effects mean that consumers attach a low- or high-price image or a low- or high-quality image to certain price endings, e.g. digit 9. Based on empirical results for tuna and yoghurt, STIVING and WINTER find that level and image effects do exist and market shares are affected by price endings. SCHINDLER and KIBARIAN show with an experiment that prices ending in the digits 99 rather than 00 increase consumer purchasing at a direct-mail women’s clothing retailer. SCHINDLER and KIRBY use a sample of retail price advertisements and find that 9-ending prices are overrepresented. They argue that the tendency of consumers to underestimate prices is responsible for this pattern and for a positive sales effect.
3 Data and Empirical Evidence on Price Rigidity
In this section, the scanner dataset is described and empirical findings on price rigidity for the 20 selected food brands are summarized. The evidence on price rigidity is based on these scanner data as is the evidence on psychological pricing in Section 4.
3.1 The Scanner Data
The quantitative analysis is based on a commercially available scanner data set provided by MADAKOM GmbH (MADAKOM 1999a). It captures scanner data from the German food-retailing sector for 144 weeks, i.e. the period from September 30, 1996, to June 28, 1999. Four types of retailing firms were selected for this study: (i) large consumer markets (1,500 to 5,000 m2 sales area); (ii) small consumer markets (800 to 1,499 m2 area); (iii) supermarkets
3
(400 to 799 m2) and (iv) discounters. A further selection criterion was that data were available for 100 consecutive weeks. 38 stores remained in the sample after applying this criterion as well as the rule that the regional distribution of stores should approximately picture the structure of the German food-retailing sector. Data for seven retailing companies were included, and the selection of brands covers breakfast products in the broadest sense.
The individual articles could be identified with their EAN codes. EAN codes contain 13 or 8 numbers which are printed on the product and they contain an identification of the manufacturer and the details of the product. Comprehensive information was available on the items. This information includes the quantity sold, the product price, the name of the product and the package size. Information on different promotion activities at the point of sale were available as well as a variable accounting for price discounts. Those price actions are measured as those prices which remain for four weeks or less by at least five percent below the normal price. After more than four weeks, such low prices are counted as normal price (MADAKOM 1999b).
It has to be stressed that this is a unique dataset at the individual retailers’ level. Substantial work in recent years is based on consumer panel data (e.g., FENGLER/WINTER 2001; LOY/WEISS 2003) which might include the customers’ switching from store to store and, thus, a different type of price rigidity2. The utilized scanner dataset covers the retailers’ pricing decisions irrespective of potential consumer switching between stores. However, as is in most comparable studies, the data do not include sociodemographic variables of consumers as these are typically not available in either retailer or consumer panels.
3.2 Empirical Evidence on Price Rigidity
Table 1 summarizes price rigidity of the selected food brands. The results are taken from HERRMANN/MOESER (2003), where the computations and the analysis are explained in much more detail. Price rigidity (PRIG) is measured as the mean duration of unchanged prices, following POWERS and POWERS (2001):
(1) PRIG = PCHww /
w stands for the number of weekly price observations, wPCH is the number of weeks with price changes.
The following results can be summarized:
1. There is a substantial degree of price rigidity at the retail level. There are brands where the mean duration of unchanged prices is as high as 53 weeks. If we compute the median of the medians for the 20 food brands, it is 18.9 weeks. Apparently, the median price rigidity indicates that prices of branded foods remain unchanged for 19 weeks.
2 Several U.S. studies are based on the so-called BLS data of the Bureau of Labor Statistics, e.g., BILS/KLENOW (2002). These data are the basis for the consumer price index and include prices on 70,000 to 80,000 non-housing goods and services per month, collected from around 22,000 outlets across 88 geographic areas. An information on “no price change” is also available that can be used as one indicator of price rigidity.
4
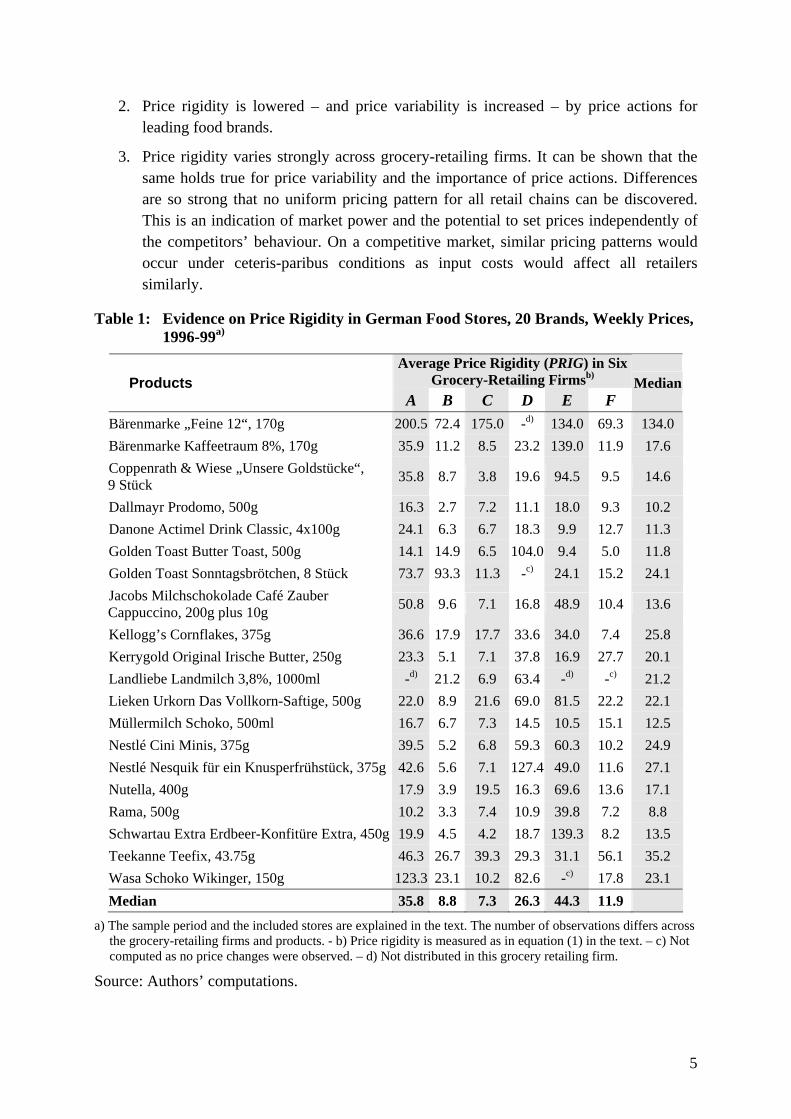
2. Price rigidity is lowered – and price variability is increased – by price actions for leading food brands.
3. Price rigidity varies strongly across grocery-retailing firms. It can be shown that the same holds true for price variability and the importance of price actions. Differences are so strong that no uniform pricing pattern for all retail chains can be discovered. This is an indication of market power and the potential to set prices independently of the competitors’ behaviour. On a competitive market, similar pricing patterns would occur under ceteris-paribus conditions as input costs would affect all retailers similarly.
Table 1: Evidence on Price Rigidity in German Food Stores, 20 Brands, Weekly Prices, 1996-99a)
Average Price Rigidity (PRIG) in Six Grocery-Retailing Firmsb)Products
A B C D E F Median
Bärenmarke „Feine 12“, 170g 200.5 72.4 175.0 -d) 134.0 69.3 134.0 Bärenmarke Kaffeetraum 8%, 170g 35.9 11.2 8.5 23.2 139.0 11.9 17.6 Coppenrath & Wiese „Unsere Goldstücke“, 9 Stück 35.8 8.7 3.8 19.6 94.5 9.5 14.6
Dallmayr Prodomo, 500g 16.3 2.7 7.2 11.1 18.0 9.3 10.2 Danone Actimel Drink Classic, 4x100g 24.1 6.3 6.7 18.3 9.9 12.7 11.3 Golden Toast Butter Toast, 500g 14.1 14.9 6.5 104.0 9.4 5.0 11.8 Golden Toast Sonntagsbrötchen, 8 Stück 73.7 93.3 11.3 -c) 24.1 15.2 24.1 Jacobs Milchschokolade Café Zauber Cappuccino, 200g plus 10g 50.8 9.6 7.1 16.8 48.9 10.4 13.6
Kellogg’s Cornflakes, 375g 36.6 17.9 17.7 33.6 34.0 7.4 25.8 Kerrygold Original Irische Butter, 250g 23.3 5.1 7.1 37.8 16.9 27.7 20.1 Landliebe Landmilch 3,8%, 1000ml -d) 21.2 6.9 63.4 -d) -c) 21.2 Lieken Urkorn Das Vollkorn-Saftige, 500g 22.0 8.9 21.6 69.0 81.5 22.2 22.1 Müllermilch Schoko, 500ml 16.7 6.7 7.3 14.5 10.5 15.1 12.5 Nestlé Cini Minis, 375g 39.5 5.2 6.8 59.3 60.3 10.2 24.9 Nestlé Nesquik für ein Knusperfrühstück, 375g 42.6 5.6 7.1 127.4 49.0 11.6 27.1 Nutella, 400g 17.9 3.9 19.5 16.3 69.6 13.6 17.1 Rama, 500g 10.2 3.3 7.4 10.9 39.8 7.2 8.8 Schwartau Extra Erdbeer-Konfitüre Extra, 450g 19.9 4.5 4.2 18.7 139.3 8.2 13.5 Teekanne Teefix, 43.75g 46.3 26.7 39.3 29.3 31.1 56.1 35.2 Wasa Schoko Wikinger, 150g 123.3 23.1 10.2 82.6 -c) 17.8 23.1 Median 35.8 8.8 7.3 26.3 44.3 11.9
a) The sample period and the included stores are explained in the text. The number of observations differs across the grocery-retailing firms and products. - b) Price rigidity is measured as in equation (1) in the text. – c) Not computed as no price changes were observed. – d) Not distributed in this grocery retailing firm.
Source: Authors’ computations.
5

4 Empirical Analysis of Psychological Pricing in German Grocery Retailing
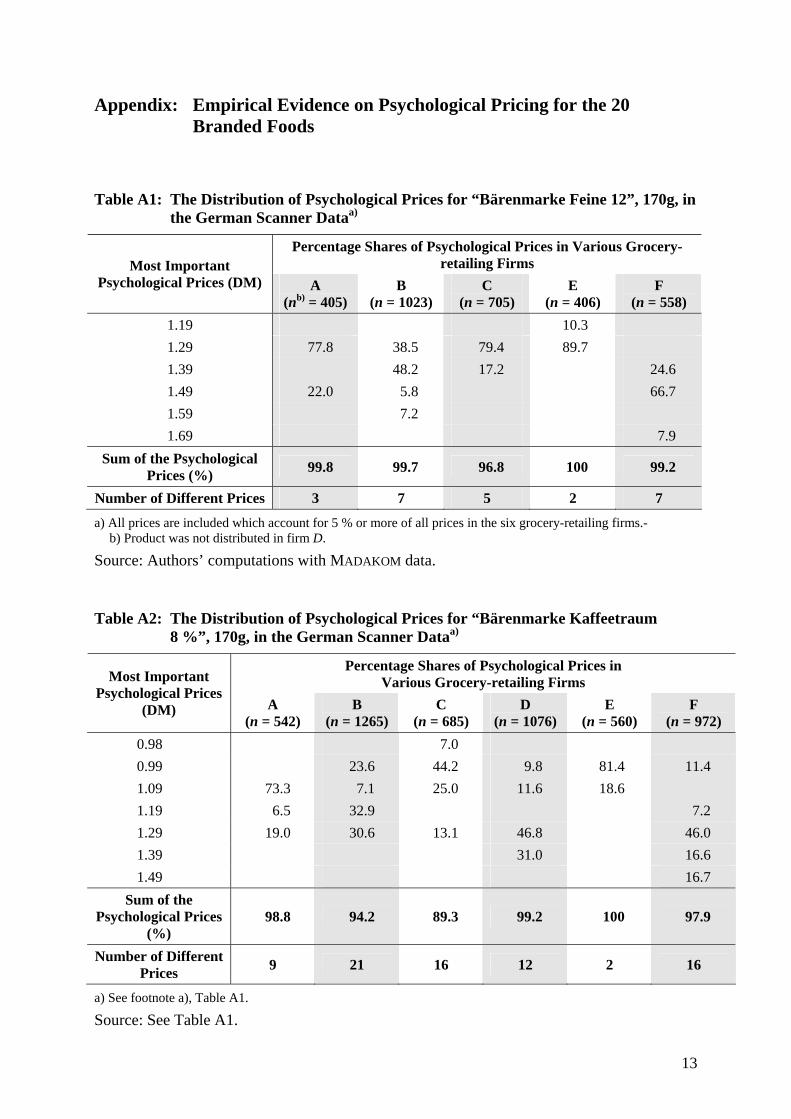
We investigate in this section how important psychological pricing actually is in grocery retailing and whether the statistical evidence is consistent with the presented hypotheses from cognitive psychology on the rightmost digits of observed prices. Like in the analysis of price rigidity, psychological pricing is analyzed for 20 branded food products in six different German grocery-retailing firms. We define psychological prices as those prices which are slightly below psychological pricing points, e.g. 0.49 DM, 0.99 DM or 4.99 DM.
In the Appendices A1 to A20, the most important psychological prices of the 20 brands are shown for all six grocery-retailing firms. Their relative importance for pricing decisions are revealed, too. In general, all individual psychological prices are covered there which represent 5 % or more of all observed prices in the respective firms.
In Table 2, concentration ratios are presented of the two most important psychological prices for all 20 products in the six firms. The CR2 values indicate the relative importance of these two prices in pricing decisions.
The results in the Appendix show that psychological prices for branded foods in Germany are extremely important. For eight out of 20 branded foods, five or less of the important psychological prices covered more than 90 % of all observed prices in all six grocery-retailing firms: Bärenmarke, Feine 12, 170g; Golden Toast Sonntagsbrötchen, 8 pieces; Kellogg’s Cornflakes, 375 g; Kerrygold Original Irische Butter, 250 g; Landliebe Landmilch, 1000 ml; Lieken Urkorn “Das Vollkorn-Saftige”, 500 g; Teekanne Teefix 43.75 g; Wasa Schoko Wikinger, 150 g. In additional eight cases, more than 90 % of all observed prices are captured by five or less important psychological prices in five of the six grocery-retailing firms: Bärenmarke Kaffeetraum 8 %, 170 g; Coppenrath & Wiese “Unsere Goldstücke”, 9 pieces; Danone Actimel Drink Classic, 4 x 100 g; Jacobs Café Zauber Cappuccino, 200 g plus 10 g Milchschokolade; Nestlé Cini Minis, 375 g; Nestlé Nesquik für ein Knusperfrühstück, 375 g; Nutella, 400g; Schwartau Extra Erdbeerkonfitüre, 450 g. And in all other cases, there are more than half of the grocery-retailing firms where five important psychological prices cover more than 90 % of all observed prices.
In all cases, the relative significance of the five most important psychological prices is very high. In no case it is less than 70 %. The lowest share was 71.1 % (Dallmayr Prodomo, firm B). In almost all cases it was higher than 80 % (114 of 117) and most often higher than 90 % (95 of 117 cases).
We know from U.S. studies that other price endings than digit 9 have some importance, especially digits 0 and 5 (SCHINDLER/KIRBY 1997). The Appendices A1 to A20 indicate that it is clearly the digit 9 which dominates as price ending for the selected German food brands. Table A21 presents only a few prices with other endings than digit 9 that reached 5 % or more of all observed prices in individual retailing firms. Only digits 5, 7 and 8 are somewhat important, but they must be regarded as exceptions rather than the rule. Firm-specific patterns are evident here, too. The price endings at digit 7 occurred – with one exception – only in the grocery-retailing firm F. In three cases, prices ended at digit 8 in firm C and gained some importance. In individual cases prices ending at digit 5 were important for four different
6

firms, but never for B and F. In two of these cases, a significant share of all observed prices were reached (28.4 % for the price 1.65 DM of Landliebe Landmilch and 23.1 % for the price 2.85 DM of Schwartau Erdbeerkonfitüre, both at firm D).
The descriptive statistics on the role of psychological prices suggest as a general result that level and image effects posited by cognitive psychology might exist. With regard to the level effects, the dominant influence of prices ending at digit 9 indicate that rounding down prices and left-to-right comparisons are consistent with the data.
Although it is clear from the Appendices that psychological prices are significant in all grocery-retailing firms and for all brands, there are substantial differences in the psychological-pricing strategies across brands and firms. Table 2 summarizes to which extent pricing is concentrated on the two most important psychological prices.
Table 2: Concentration Ratios of the Two Most Important Psychological Prices for 20 Brands in Six German Grocery-Retailing Firms (CR2), 1996-99
Grocery-Retailing Firms Products
A B C D E F Median
Bärenmarke „Feine 12“, 170g 99.8 86.7 96.8 n.d.b) 100 91.3 96.8 Bärenmarke Kaffeetraum 8%, 170g 92.3 63.5 69.2 77.8 100 62.7 73.5 Coppenrath & Wiese „Unsere Goldstücke“, 9 Stück 92.9 95.0 89.8 83.1 100 58.1 91.4
Dallmayr Prodomo, 500g 67.0 42.9 50.1 58.2 51.6 57.8 54.7
Danone Actimel Drink Classic, 4x100g 83.6 55.3 72.2 55.1 71.1 40.5 63.2 Golden Toast Butter Toast, 500g 76.3 66.0 83.1a) 99.0 93.5 58.9 79.7 Golden Toast Sonntagsbrötchen, 8 Stück 83.5 99.4 92.3 100 97.1a) 59.6 87.9 Jacobs Café Zauber Cappuccino, 200g plus 10g Milchschokolade 99.5 66.1 65.3 65.9 91.1 68.3 67.2
Kellogg’s Cornflakes, 375g 84.1 65.4 75.7 50.7 82.4 47.3 70.6 Kerrygold Original Irische Butter, 250g 98.3 65.3 77.9 81.9 97.0 50.7 79.9 Landliebe Landmilch 3,8%, 1000ml n.d.b) 96.6a) 91.1 99.2 n.d.b) 100 97.9 Lieken Urkorn Das Vollkorn-Saftige, 500g 87.7 55.6 88.7 99.3 99.4a) 56.9 88.2 Müllermilch Schoko, 500ml 73.5 46.6 69.6 82.7 95.0 36.2 71.6 Nestlé Cini Minis, 375g 98.8 83.0 81.6 85.3 99.1a) 87.8 86.6 Nestlé Nesquik für ein Knusperfrühstück, 375g 98.7 81.7 83.5 95.7 98.9a) 88.8 92.3
Nutella, 400g 83.6 56.9 75.2 72.4 98.3 72.7 74.0 Rama, 500g 91.1 60.6 87.5a) 83.4 99.1 58.4 85.5 Schwartau Extra Erdbeer-Konfitüre Extra, 450g 71.9 66.4 63.7 74.1 100 84.1 73.0
Teekanne Teefix, 43,75g 99.8 66.3 68.4 83.3 74.7 64.8 71.6 Wasa Schoko Wikinger, 150g 99.6 84.5 88.3 99.7 100a) 97.4 98.5 Median 91.1 66.1 79.8 83.1 98.3 61.2
a) Concentration ratio of the single most important psychological price. –b) Not distributed.
Source: Authors’ computations.
7

When we consider the median CR2 across brands for the individual grocery-retailing firms, the two most important psychological prices capture at least 61.2 % (firm F), but in four of the six firms 80 % or more. The highest median values are those for firms E (98.3 %) and A (91.1 %). These two firms do stick most to only a few psychological prices for a wide sample of food brands. Interestingly, the grocery-retailing firms A and E are also characterized by the highest price rigidity and the lowest number of price actions.
The median CR2 for the individual brands across the six firms differs strongly, too. However, it never falls below 50 %. The lowest median of CR2 is 54.7 % (Dallmayr Prodomo), followed by 63.2 % (Danone Actimel Drink Classic) and 67.2 % (Jacobs Café Zauber Capuccino). Two of these three products with the lowest CR2 are also among those three with the lowest price rigidity (Dallmayr Prodomo; Danone Actimal Drink Classic). The median CR2 is much higher for other products and is in three cases above 95 %: 98.5 % (Wasa Schoko Wikinger), 97.9 % (Landliebe Landmilch) and 96.8 % (Bärenmarke Feine 12). One of these brands, Bärenmarke Feine 12, also ranks highest among all 20 brands in terms of price rigidity.
These individual cases suggest already that the concentration on a few psychological prices in food retailing, as measured by CR2, might be associated positively with price rigidity (PRIG) and negatively with price instability (INST) and the number of price actions (ACTIONS). It is a further interesting question whether psychological pricing is more concentrated on just a few prices when the unit price of a brand (PRICE) is higher.
These hypotheses are tested first within a correlation analysis. All variables are measured on the basis of the scanner dataset, and only the 18 brands which are distributed in all firms are included. PRIG and CR2 are available from Tables 1 and 2 respectively. Data for the number of price actions (ACTIONS), on the average prices of the brands (PRICE) and on price instability (INST) are available from the authors upon request. The computation of price instability is based on the trend-corrected coefficient of variation as suggested by CUDDY and DELLA VALLE (1978).
Table 3: Correlation Coefficients Between the Concentration of Psychological Prices (CR2) and Other Variables, German Food Brands, All Firmsa)
Variables INST ACTIONS PRICE PRIG CR2 INST 1.000 ACTIONS 0.427*** 1.000 PRICE 0.222* 0.174 1.000 PRIG -0.492*** -0.459*** -0.071 1.000 CR2 -0.530*** -0.562*** -0.175 0.525*** 1.000 ***, **, * Statistically significant at the 99.9 %-, 99 %-, 95 %-level. a) The variables are defined in the text. Data for PRIG and CR2 are from Tables 1 and 2. Only those 18 brands
are included which are distributed in all firms (n = 108).
Source: Authors’ computations.
8

Table 3 presents the correlation results for the pooled dataset of 18 brands and six firms3. The Appendices A22 to A27 show the corresponding results for the individual firms. The major results of Table 3 are as follows:
1. There is some correlation between psychological-pricing strategies and the other variables. The concentration on a few psychological prices in food retailing is significantly stronger where price rigidity is higher and where price instability and the number of price actions are lower. It also seems that brands with a high per-unit price are associated with a lower CR2, but the correlation coefficient does not reach the 95 %-level of statistical significance.
2. Apart from psychological prices, the number of price actions is positively correlated with price instability and negatively with price rigidity. This general pattern is not only valid in the comprehensive dataset for all firms, but also for each individual firm as Appendices A22 to A27 reveal.
5 Psychological Pricing as One Determinant of Price Rigidity in German Grocery Retailing
Table 3 has shown that psychological-pricing strategies are correlated with price rigidity and with the number of price actions. Correlation, however, is not causality. From an industrial-organization perspective, the question arises whether the kind of psychological pricing leads to additional price rigidity. This question will be analyzed in the following. It has been elaborated in the literature that price promotions are a major component of retailers’ pricing strategies (HOSKEN/REIFFEN 2001) and a major determinant of food price variability (HERRMANN/MÖSER 2003). Moreover, differential firm strategies have also been identified in retailers’ price policies. In particular, an “everyday low price” (EDLP) strategy is adopted by some retailers and Hi-Lo pricing with a promotion-oriented strategy by others (HOCH/DRÈZE/PURK 1994). Firm strategies as well as the number of price promotions should affect price rigidity.
We model price rigidity across brands and firms within a regression analysis where we consider ACTIONS and firm-specific variables as main determinants of price rigidity. Additionally, the psychological-pricing strategy is included as explanatory variable by CR2. Several alternative model specifications are presented in Table A28. The major result of the analysis is that – apart from price promotions and firm-specific characteristics as introduced by dummy variables – psychological pricing contributes significantly to the explanation of price rigidity. The coefficient for the impact of CR2 on PRIG is positive in all model specifications. The change of the regression coefficients in Model 3 compared with Models 1 and 2 indicate the existence of some multicollinearity. However, both coefficients – for ACTIONS and CR2 – are statistically significant in Model 3. The regression coefficients 3 Here and in the following analysis in Section 5, the following assumption has been made. PRIG is set to 200 by assumption in those two cases where brands were distributed in all six firms but no price changes did occur in one of these firms: GoldenToast Sonntagsbrötchen/firm D; Wasa Schoko Wikinger/firm E. It would have been a distortion to leave the two cases with the highest price rigidity out. It would have been a distortion, too, to insert the value infinity which the equation (1) for PRIG yields in these two cases, if an infinitisemal value rather than zero is introduced for the number of price changes.
9

remain rather stable, too, when additional variables are included as in Models 4 and 5. Models 4 and 5 illustrate that the level of the unit price and intercept dummies for firms do not affect price rigidity when the number of sales and the psychological-pricing pattern are already taken into account. However, there are firm-specific effects of price actions on price rigidity for firms A, B and E which are at least significant at the 90 %-level.
If differential effects of sales on price rigidity are introduced in the regression model, the preferred specification is:
(2)
(3.31)2**0.7226
(-1.84)(2.67)ACTIONSDUMMY3096.1ACTIONSDUMMY**3236.0
)66.1()85.3()29.0(ACTIONSDUMMY7315.0ACTIONS***5440.07996.5EPRIG
[*]
[*]
CR
EB
A
⋅+
⋅⋅−⋅⋅+
−−−⋅−⋅−−=
( 2R = 0.36; F = 13.01***, n = 108)
EPRIG is the estimated value of price rigidity (PRIG); DUMMY A (DUMMY B, DUMMY C) are dummy variables for the grocery-retailing firms A (B, C) with 1 for the respective firm and 0 otherwise. Other variables are defined as before; ***, **, *, [*] indicate the 99.9 %-, 99 %-, 95 %-, 90 %-levels of statistical significance.
Equation (2) indicates that (i) the marginal impact of one additional retail sale on price rigidity in the reference group,
i.e. firms C, D and F, is a negative one with a decrease of 0.54 in the number of weeks with unchanged prices;
(ii) this negative marginal impact of an additional retail sale is even stronger in firms A and E, by 0.73 and 1.31 weeks respectively, but weaker in firm B, by 0.32 weeks;
(iii) an increase in CR2, i.e. the share of the two most important psychological prices in price-setting, by one percentage point raises the number of weeks with unchanged prices by 0.72.
We can conclude that an increasing number of price promotions makes food prices less rigid. This effect is particularly strong in retailing firms with a relatively low number of price actions (firms A and E) and weakest in the firm with the highest number of price actions (firm B). Moreover, psychological pricing of retailers does affect food price rigidity, too.
6 Summary and Conclusions
It was the objective of this paper to elaborate in how far psychological pricing plays a role in grocery retailing and whether it contributes to price rigidity of branded foods in Germany. For this purpose, a large scanner dataset is exploited.
In the explanation of price stickiness, economists and many business managers do not rank the marketing argument of psychological pricing points very highly. Despite this, the analysis shows that psychological pricing points are extremely important in German food retailing. When prices of 20 food brands are investigated at the point of sale across 38 stores for 144 weeks in the period 1996-99, it is striking that prices ending at digit 9 are by far most
10

important. Moreover, there is often a strong concentration in pricing on only a few psychological prices. This concentration is clearly higher for firms with an EDLP compared to a HiLo strategy and it differs across brands. The CR5 of the five most important psychological prices is in all cases remarkable: It never falls below 70 % of al prices and ranges above 90 % in roughly four out of five cases.
Moreover, psychological pricing seems to be one major determinant of price rigidity in German grocery retailing. Prices of branded foods are surprisingly sticky given the high variability of agricultural commodity prices in food retailing. Apparently, prices do not change much – apart from sales – and if they do, they tend to move from one psychological price to the next. Regression results show that price rigidity is higher for products where concentration on a few psychological prices is more important. It is lower for products with a high number of price discounts. Additionally, price rigidity as well as the CR2 for the most important psychological prices differs widely across firms – i.e., grocery retailers do not follow one uniform pricing strategy.
There are interesting questions remaining for future research. It is not transparent why exactly psychological pricing points are viewed as important by grocery retailers. Survey results, similar to those by BLINDER et al. but within the retailing sector, could solve this puzzle.
Furthermore, it is most likely that there are other determinants of price rigidity in grocery retailing than the importance of sales, psychological prices, and firm-specific effects. It remains a challenge to collect additional data, e.g. on the competitive situation or on menu costs, in order to test for other theories of price rigidity, too.
Literature
BILS, M. and P. J. KLENOW (2002), Some Evidence on the Importance of Sticky Prices. (NBER Working Paper 9069), National Bureau of Economic Research, Cambridge, Mass.
BLATTBERG, R. C. AND S. A. NESLIN (1990), Sales Promotion. Concepts, Methods, and Strategies. Prentice Hall: Upper Saddle River, NJ.
BLINDER, A. S. E. R. D. CANETTI, D. E. LEBOW and J. B. RUDD (1998), Asking About Prices. A New Approach to Understanding Price Stickiness. New York: Russell Sage Foundation.
CUDDY, J. D. A. and P. A. DELLA VALLE (1978), Measuring the Instability of Time Series Data. “Oxford Bulletin of Economics and Statistics”, Vol. 40, No. 1, pp. 79-85.
FENGLER, M. and J. WINTER (2001), Price-Setting and Price-Adjustment Behavior for Fast-Moving Consumer Goods. In: PAPASTEFANOU, G., P. SCHMIDT, A. BÖRSCH-SUPAN, H. LÜDTKE and U. OLTERSDORF (eds.), Social and Economic Research with Consumer Panel Data. (ZUMA Spezial Band 7), Zentrum für Umfragen, Methoden und Analysen (ZUMA), Mannheim, pp. 95-113.
FRIEDMAN, L. (1967), Psychological Pricing in the Food Industry. In: PHILLIPS, A. and O. E. WILLIAMSON (eds.), Prices: Issues in Theory, Practice, and Public Policy. Philadelphia, PA: University of Pennsylvania Press, pp. 187-201.
11

GEDENK, K. and H. SATTLER (1999), Preisschwellen und Deckungsbeitrag – Verschenkt der Handel große Potentiale? „Zeitschrift für betriebswirtschaftliche Forschung“, Vol. 51, No. 1, pp. 33-59.
HERRMANN, R. and A. MÖSER (2003), Price Variability or Rigidity in the Food-retailing Sector? Theoretical Analysis and Evidence from German Scanner Data. Contributed Paper, 25th International Conference of the International Association of Agricultural Economists, Durban, South Africa, 16-22 August.
HOCH, S. J., X. DRÈZE and M. E. PURK (1994), EDLP, Hi-Lo, and Margin Arithmetic. “Journal of Marketing”, Vol. 58, pp. 16-27.
HOSKEN, D. and D. REIFFEN (2001), Multiproduct Retailers and the Sale Phenomenon. “Agribusiness – An International Journal”, Vo. 17, No. 1, pp. 115-137.
KAAS, K. P. and C. HAY (1984), Preisschwellen bei Konsumgütern – eine theoretische und empirische Analyse. „Zeitschrift für betriebswirtschaftliche Forschung (ZfbF)“, Vol. 36, pp. 333-346.
KASHYAP, A. K. (1995), Sticky Prices: New Evidence from Retail Catalogs. “The Quarterly Journal of Economics”, Vol. 110, No. 1, pp. 245-274.
KÖHLER, A. G. (1996), Nominale Preisrigiditäten auf Gütermärkten. Eine empirische Überprüfung neukeynesianischer Erklärungsansätze. (CIRET Studien 51), Munich.
LOY, J.-P. and C. WEISS (2003), Staggering and Synchronisation of Pricing Behaviour: New Evidence from German Food Retailers. “Agribusiness – An International Journal”, Vol. 18, No. 4, S. 437-457.
MADAKOM GMBH (ed.) (1999a), Madakom Pool für Scannerdaten. Cologne: July 29.
MADAKOM GMBH (1999b), Written information by Mr. T. Bartram. August 17.
POWERS, E. T. and N. J. POWERS (2001), The Size and Frequency of Price Changes: Evidence from Grocery Stores. “Review of Industrial Organization”, Vol. 18, No. 4, pp. 397-416.
SCHINDLER, R. M. and T. M. KIBARIAN (1996), Increased Consumer Sales Response Through Use of 99-Ending Prices. “Journal of Retailing”, Vol. 72, No. 2, pp. 187-199.
SCHINDLER, R. M. and P. N. KIRBY (1997), Patterns of Rightmost Digits Used in Advertised Prices: Implications for Nine-Ending Effects. “Journal of Consumer Research”, Vol. 24, No. 2, pp. 192-201.
STIVING, M. and R. S. WINER (1997), An Empirical Analysis of Price Endings with Scanner Data. “Journal of Consumer Research”, Vol. 24, No.1, pp. 57-67.
12
Appendix: Empirical Evidence on Psychological Pricing for the 20 Branded Foods
Table A1: The Distribution of Psychological Prices for “Bärenmarke Feine 12”, 170g, in the German Scanner Dataa)
Percentage Shares of Psychological Prices in Various Grocery-retailing Firms Most Important
Psychological Prices (DM) A (nb) = 405)
B (n = 1023)
C (n = 705)
E (n = 406)
F (n = 558)
1.19 10.3 1.29 77.8 38.5 79.4 89.7 1.39 48.2 17.2 24.6 1.49 22.0 5.8 66.7 1.59 7.2 1.69 7.9
Sum of the Psychological Prices (%) 99.8 99.7 96.8 100 99.2
Number of Different Prices 3 7 5 2 7
a) All prices are included which account for 5 % or more of all prices in the six grocery-retailing firms.- b) Product was not distributed in firm D.
Source: Authors’ computations with MADAKOM data.
Table A2: The Distribution of Psychological Prices for “Bärenmarke Kaffeetraum 8 %”, 170g, in the German Scanner Dataa)
Percentage Shares of Psychological Prices in Various Grocery-retailing Firms Most Important
Psychological Prices (DM) A
(n = 542) B
(n = 1265) C
(n = 685) D
(n = 1076) E
(n = 560) F
(n = 972) 0.98 7.0 0.99 23.6 44.2 9.8 81.4 11.4 1.09 73.3 7.1 25.0 11.6 18.6 1.19 6.5 32.9 7.2 1.29 19.0 30.6 13.1 46.8 46.0 1.39 31.0 16.6 1.49 16.7
Sum of the Psychological Prices
(%) 98.8 94.2 89.3 99.2 100 97.9
Number of Different Prices 9 21 16 12 2 16
a) See footnote a), Table A1.
Source: See Table A1.
13

Table A3: The Distribution of Psychological Prices for “Coppenrath & Wiese Unsere Goldstücke”, 9 pieces, in the German Scanner Dataa)
Percentage Shares of Psychological Prices in Various Grocery-retailing Firms Most Important
Psychological Prices (DM) A
(n = 362) B
(n = 763) C
(n = 624) D
(n = 852) E
(n = 382) F
(n = 749) 2.19 6.3 2.29 55.6 11.4 9.2 6.9 2.47 8.5 2.49 82.0 39.4 78.4 62.0 60.5 39.5 2.59 21.1 39.5 10.8 2.69 10.9 18.6 2.79 5.8 2.99 12.3
Sum of the Psychological Prices
(%) 98.7 95.0 89.8 98.6 100 96.6
Number of Different Prices 7 10 22 12 2 12
a) See footnote a), Table A1.
Source: See Table A1.
Table A4: The Distribution of Psychological Prices for “Dallmayr Prodomo”, 500g, in the German Scanner Dataa)
Percentage Shares of Psychological Prices in Various Grocery-retailing Firms Most Important
Psychological Prices (DM) A
(n = 525) B
(n = 1264) C
(n = 707) D
(n = 1115) E
(n = 561) F
(n = 974) 7.99 11.4 8.49 6.3 8.79 6.9 8.97 7.2 8.99 24.4 26.6 14.9 20.7 15.5 9.49 21.1 6.3 10.9 6.5 21.4 9.98 6.8 10.5 9.99 39.0 18.5 23.5 35.5 42.3
10.49 10.0 11.6 22.7 25.8 14.3 10.79 28.0 25.8 10.99 6.5
Sum of the Psychological Prices
(%) 94.6 77.4 83.1 86.5 93.7 85.6
Number of Different Prices 17 104 30 37 13 24
a) See footnote a), Table A1.
Source: See Table A1.
14

Table A5: The Distribution of Psychological Prices for “Danone Actimel Drink Classic”, 4 x 100g, in the German Scanner Dataa)
Percentage Shares of Psychological Prices in Various Grocery-retailing Firms Most Important
Psychological Prices (DM) A
(n = 342) B
(n = 1010) C
(n = 680) D
(n = 924) E
(n = 400) F
(n = 855) 2.19 20.1 2.29 15.0 12.9 2.39 9.4 14.8 2.49 50.6 37.0 50.9 35.0 42.3 22.0 2.59 11.1 5.5 18.5 2.69 17.1 21.3 11.4 28.8 11.4 2.79 33.0 15.6 6.9 10.0 13.9 2.89 15.9 2.99 18.3 17.9
Sum of the Psychological Prices
(%) 94.7 93.5 88.1 97.8 95.9 96.6
Number of Different Prices 8 28 21 21 20 16
a) See footnote a), Table A1.
Source: See Table A1.
Table A6: The Distribution of Psychological Prices for “Golden Butter Toast”, 500g, in the German Scanner Dataa)
Percentage Shares of Psychological Prices in Various Grocery-retailing Firms Most Important
Psychological Prices (DM) A
(n = 539) B
(n = 1064) C
(n = 721) D
(n = 735) E
(n = 435) F
(n = 986) 1.79 13.3 1.89 12.9 1.99 25.2 45.1 83.1 91.4 77.9 44.0 2.29 5.4 6.2 7.6 15.6 7.6 2.39 9.1 2.49 51.1 20.9 11.3 2.59 14.9 2.69 15.8
Sum of the Psychological Prices
(%) 97.5 98.4 83.1 99.0 93.5 86.9
Number of Different Prices 17 18 32 7 19 41
a) See footnote a), Table A1.
Source: See Table A1.
15

Table A7: The Distribution of Psychological Prices for “Golden Toast Sonntagsbrötchen”, 8 pieces, in the German Scanner Dataa)
Percentage Shares of Psychological Prices in Various Grocery-retailing Firms Most Important
Psychological Prices (DM) A
(n = 446) B
(n = 567) C
(n = 479) D
(n = 277) E
(n = 172) F
(n = 538) 2.49 8.6 14.3 2.59 5.2 33.8 2.79 16.1 38.1 8.7 2.89 13.0 2.99 66.3 61.3 83.7 87.0 97.1 15.4 3.29 17.2 3.49 25.8
Sum of the Psychological Prices
(%) 99.6 99.4 97.5 100 97.1 98.0
Number of Different Prices 5 3 10 2 6 12
a) See footnote a), Table A1.
Source: See Table A1.
Table A8: The Distribution of Psychological Prices for “Jacobs Café Zauber Cappuccino”, 200g plus 10g Milchschokolade, in the German Scanner Dataa)
Percentage Shares of Psychological Prices in Various Grocery-retailing Firms Most Important
Psychological Prices (DM) A
(n = 410) B
(n = 1146) C
(n = 648) D
(n = 812) E
(n = 395) F
(n = 767) 5.99 12.4 6.98 10.0 6.99 92.0 15.2 39.5 8.9 30.5 7.49 7.5 28.9 23.9 26.4 26.3 27.4 7.79 38.0 7.99 37.2 27.3 17.5 64.8 37.8
Sum of the Psychological Prices
(%) 99.5 91.3 89.2 95.8 100 95.7
Number of Different Prices 4 26 24 16 3 11
a) See footnote a), Table A1.
Source: See Table A1.
16

Table A9: The Distribution of Psychological Prices for “Kellogg’s Cornflakes”, 375g, in the German Scanner Dataa)
Percentage Shares of Psychological Prices in Various Grocery-retailing Firms Most Important
Psychological Prices (DM) A
(n = 517) B
(n = 1026) C
(n = 572) D
(n = 1115) E
(n = 274) F
(n = 752) 2.99 14.1 10.8 15.9 12.7 13.1 25.0 3.29 22.2 10.1 10.6 14.4 3.39 11.5 32.4 6.2 3.47 6.9 3.49 64.8 17.3 53.5 18.3 22.3 3.59 6.0 69.3 3.77 18.9 3.79 19.3 7.2 10.0 3.99 48.1 13.7
Sum of the Psychological Prices
(%) 98.2 94.9 91.6 93.2 99.2 97.5
Number of Different Prices 10 9 14 17 6 20
a) See footnote a), Table A1.
Source: See Table A1.
Table A10: The Distribution of Psychological Prices for “Kerrygold Original Irische Butter”, 250g, in the German Scanner Dataa)
Percentage Shares of Psychological Prices in Various Grocery-retailing Firms Most Important
Psychological Prices (DM) A
(n = 539) B
(n = 1240) C
(n = 718) D
(n = 1029) E
(n = 561) F
(n = 867) 1.99 6.1 2.39 19.3 60.6 50.6 40.5 2.49 31.5 44.7 15.0 31.3 56.5 19.0 2.59 66.8 20.6 17.3 11.9 19.0 2.69 31.7 2.89 18.0 2.99 6.3
Sum of the Psychological Prices
(%) 98.3 90.7 92.9 93.8 97.0 94.0
Number of Different Prices 10 42 20 14 15 13
a) See footnote a), Table A1.
Source: See Table A1.
17
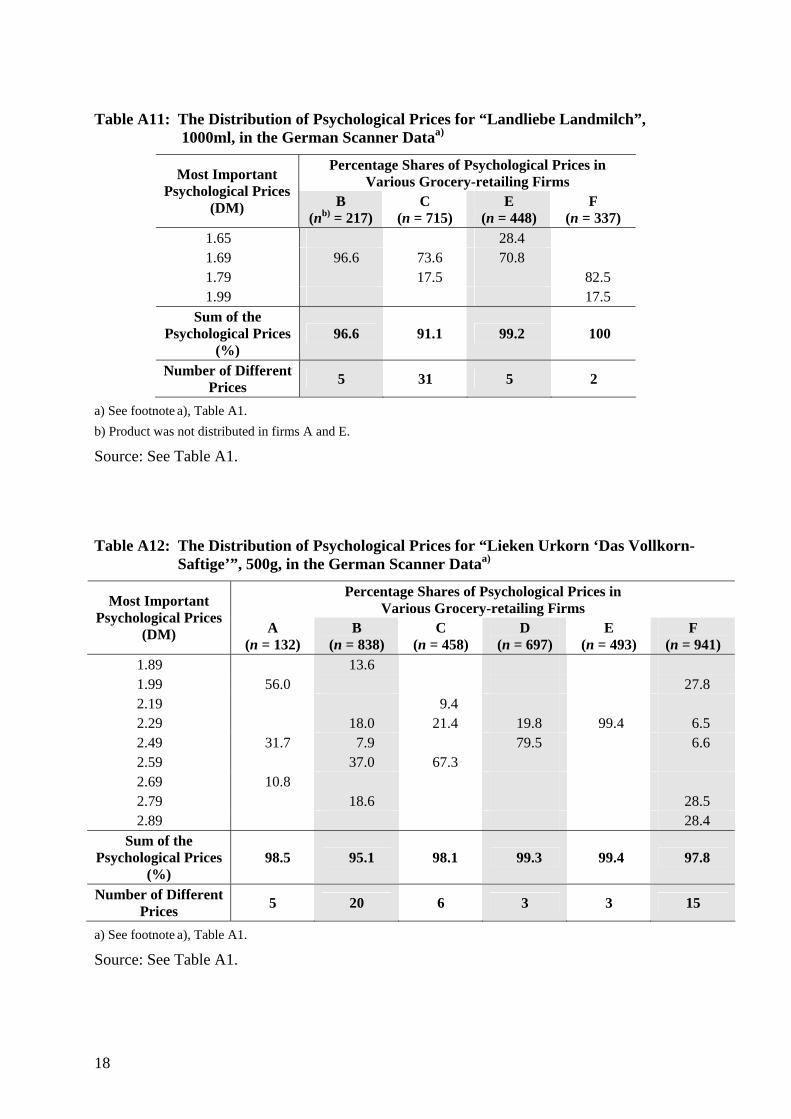
Table A11: The Distribution of Psychological Prices for “Landliebe Landmilch”, 1000ml, in the German Scanner Dataa)
Percentage Shares of Psychological Prices in Various Grocery-retailing Firms Most Important
Psychological Prices (DM) B
(nb) = 217) C
(n = 715) E
(n = 448) F
(n = 337) 1.65 28.4 1.69 96.6 73.6 70.8 1.79 17.5 82.5 1.99 17.5
Sum of the Psychological Prices
(%) 96.6 91.1 99.2 100
Number of Different Prices 5 31 5 2
a) See footnote a), Table A1. b) Product was not distributed in firms A and E.
Source: See Table A1.
Table A12: The Distribution of Psychological Prices for “Lieken Urkorn ‘Das Vollkorn-Saftige’”, 500g, in the German Scanner Dataa)
Percentage Shares of Psychological Prices in Various Grocery-retailing Firms Most Important
Psychological Prices (DM) A
(n = 132) B
(n = 838) C
(n = 458) D
(n = 697) E
(n = 493) F
(n = 941) 1.89 13.6 1.99 56.0 27.8 2.19 9.4 2.29 18.0 21.4 19.8 99.4 6.5 2.49 31.7 7.9 79.5 6.6 2.59 37.0 67.3 2.69 10.8 2.79 18.6 28.5 2.89 28.4
Sum of the Psychological Prices
(%) 98.5 95.1 98.1 99.3 99.4 97.8
Number of Different Prices 5 20 6 3 3 15
a) See footnote a), Table A1.
Source: See Table A1.
18
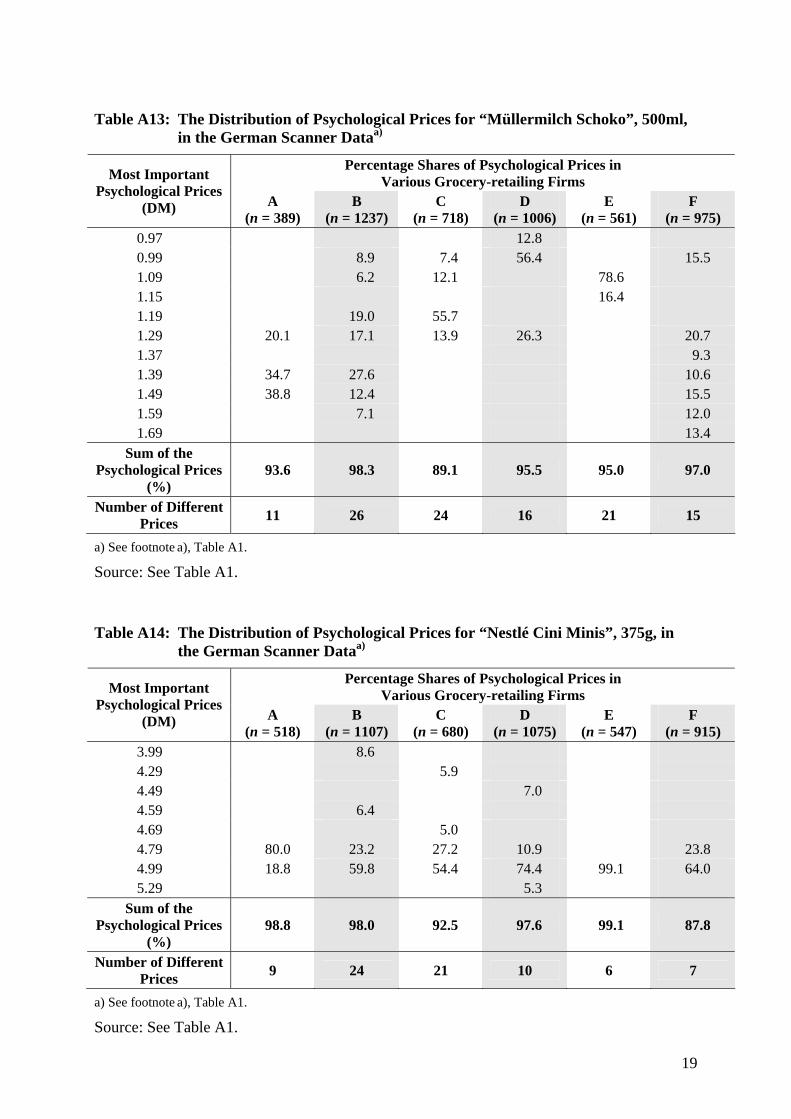
Table A13: The Distribution of Psychological Prices for “Müllermilch Schoko”, 500ml, in the German Scanner Dataa)
Percentage Shares of Psychological Prices in Various Grocery-retailing Firms Most Important
Psychological Prices (DM) A
(n = 389) B
(n = 1237) C
(n = 718) D
(n = 1006) E
(n = 561) F
(n = 975) 0.97 12.8 0.99 8.9 7.4 56.4 15.5 1.09 6.2 12.1 78.6 1.15 16.4 1.19 19.0 55.7 1.29 20.1 17.1 13.9 26.3 20.7 1.37 9.3 1.39 34.7 27.6 10.6 1.49 38.8 12.4 15.5 1.59 7.1 12.0 1.69 13.4
Sum of the Psychological Prices
(%) 93.6 98.3 89.1 95.5 95.0 97.0
Number of Different Prices 11 26 24 16 21 15
a) See footnote a), Table A1.
Source: See Table A1.
Table A14: The Distribution of Psychological Prices for “Nestlé Cini Minis”, 375g, in the German Scanner Dataa)
Percentage Shares of Psychological Prices in Various Grocery-retailing Firms Most Important
Psychological Prices (DM) A
(n = 518) B
(n = 1107) C
(n = 680) D
(n = 1075) E
(n = 547) F
(n = 915) 3.99 8.6 4.29 5.9 4.49 7.0 4.59 6.4 4.69 5.0 4.79 80.0 23.2 27.2 10.9 23.8 4.99 18.8 59.8 54.4 74.4 99.1 64.0 5.29 5.3
Sum of the Psychological Prices
(%) 98.8 98.0 92.5 97.6 99.1 87.8
Number of Different Prices 9 24 21 10 6 7
a) See footnote a), Table A1.
Source: See Table A1.
19

Table A15: The Distribution of Psychological Prices for “Nestlé Nesquik für ein Knusperfrühstück”, 375g, in the German Scanner Dataa)
Percentage Shares of Psychological Prices in Various Grocery-retailing Firms Most Important
Psychological Prices (DM) A
(n = 515) B
(n = 1132) C
(n = 684) D
(n = 1027) E
(n = 543) F
(n = 876) 3.99 8.2 4.29 7.2 4.59 6.4 4.69 4.79 81.4 22.1 66.7 9.4 29.7 4.99 17.3 59.6 16.8 86.3 98.9 59.1
Sum of the Psychological Prices
(%) 98.7 96.3 90.7 95.7 98.9 88.8
Number of Different Prices 9 16 17 7 7 7
a) See footnote a), Table A1.
Source: See Table A1.
Table A16: The Distribution of Psychological Prices for “Nutella”, 400g, in the German Scanner Dataa)
Percentage Shares of Psychological Prices in Various Grocery-retailing Firms Most Important
Psychological Prices (DM) A
(n = 542) B
(n = 1269) C
(n = 707) D
(n = 1129) E
(n = 561) F
(n = 970) 2.59 29.9 47.8 44.8 89.3 2.69 11.3 27.4 13.8 10.0 18.5 2.79 63.1 13.9 23.1 27.6 25.3 2.89 14.2 6.4 2.99 20.5 27.0 47.4
Sum of the Psychological Prices
(%) 97.8 82.1 98.3 92.6 99.3 91.2
Number of Different Prices 14 53 8 23 5 20
a) See footnote a), Table A1.
Source: See Table A1.
20
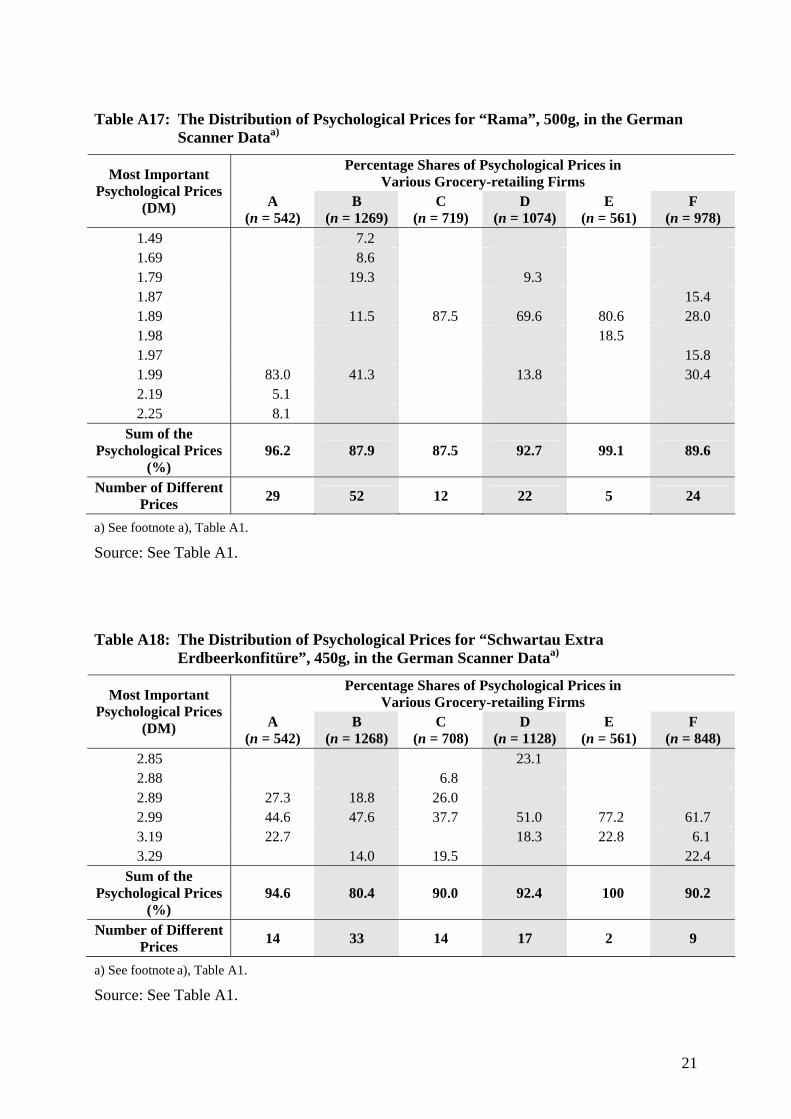
Table A17: The Distribution of Psychological Prices for “Rama”, 500g, in the German Scanner Dataa)
Percentage Shares of Psychological Prices in Various Grocery-retailing Firms Most Important
Psychological Prices (DM) A
(n = 542) B
(n = 1269) C
(n = 719) D
(n = 1074) E
(n = 561) F
(n = 978) 1.49 7.2 1.69 8.6 1.79 19.3 9.3 1.87 15.4 1.89 11.5 87.5 69.6 80.6 28.0 1.98 18.5 1.97 15.8 1.99 83.0 41.3 13.8 30.4 2.19 5.1 2.25 8.1
Sum of the Psychological Prices
(%) 96.2 87.9 87.5 92.7 99.1 89.6
Number of Different Prices 29 52 12 22 5 24
a) See footnote a), Table A1.
Source: See Table A1.
Table A18: The Distribution of Psychological Prices for “Schwartau Extra Erdbeerkonfitüre”, 450g, in the German Scanner Dataa)
Percentage Shares of Psychological Prices in Various Grocery-retailing Firms Most Important
Psychological Prices (DM) A
(n = 542) B
(n = 1268) C
(n = 708) D
(n = 1128) E
(n = 561) F
(n = 848) 2.85 23.1 2.88 6.8 2.89 27.3 18.8 26.0 2.99 44.6 47.6 37.7 51.0 77.2 61.7 3.19 22.7 18.3 22.8 6.1 3.29 14.0 19.5 22.4
Sum of the Psychological Prices
(%) 94.6 80.4 90.0 92.4 100 90.2
Number of Different Prices 14 33 14 17 2 9
a) See footnote a), Table A1.
Source: See Table A1.
21
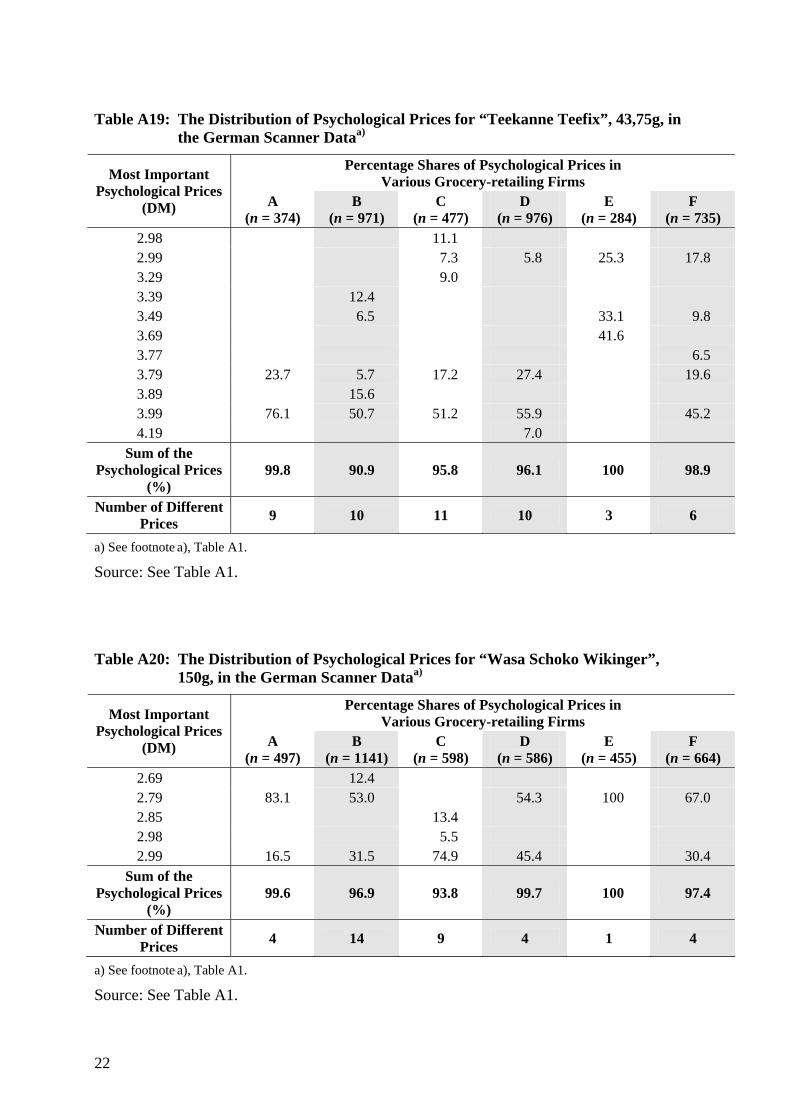
Table A19: The Distribution of Psychological Prices for “Teekanne Teefix”, 43,75g, in the German Scanner Dataa)
Percentage Shares of Psychological Prices in Various Grocery-retailing Firms Most Important
Psychological Prices (DM) A
(n = 374) B
(n = 971) C
(n = 477) D
(n = 976) E
(n = 284) F
(n = 735) 2.98 11.1 2.99 7.3 5.8 25.3 17.8 3.29 9.0 3.39 12.4 3.49 6.5 33.1 9.8 3.69 41.6 3.77 6.5 3.79 23.7 5.7 17.2 27.4 19.6 3.89 15.6 3.99 76.1 50.7 51.2 55.9 45.2 4.19 7.0
Sum of the Psychological Prices
(%) 99.8 90.9 95.8 96.1 100 98.9
Number of Different Prices 9 10 11 10 3 6
a) See footnote a), Table A1.
Source: See Table A1.
Table A20: The Distribution of Psychological Prices for “Wasa Schoko Wikinger”, 150g, in the German Scanner Dataa)
Percentage Shares of Psychological Prices in Various Grocery-retailing Firms Most Important
Psychological Prices (DM) A
(n = 497) B
(n = 1141) C
(n = 598) D
(n = 586) E
(n = 455) F
(n = 664) 2.69 12.4 2.79 83.1 53.0 54.3 100 67.0 2.85 13.4 2.98 5.5 2.99 16.5 31.5 74.9 45.4 30.4
Sum of the Psychological Prices
(%) 99.6 96.9 93.8 99.7 100 97.4
Number of Different Prices 4 14 9 4 1 4
a) See footnote a), Table A1.
Source: See Table A1.
22
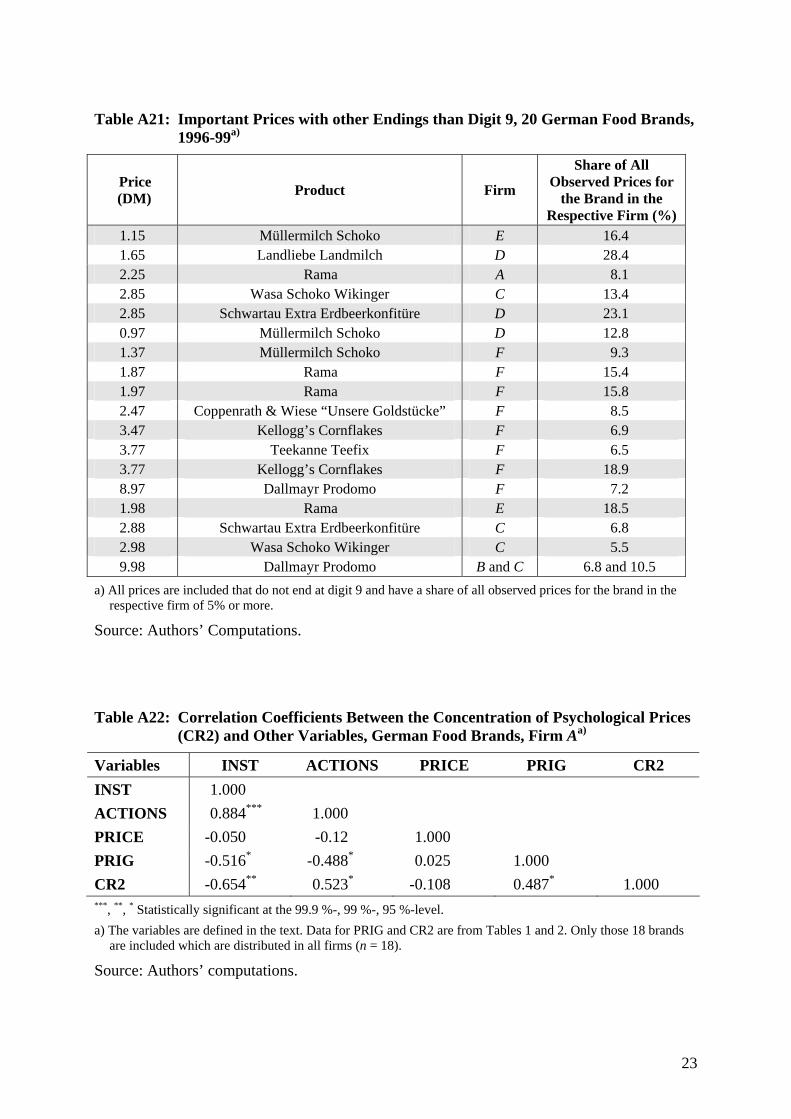
Table A21: Important Prices with other Endings than Digit 9, 20 German Food Brands, 1996-99a)
Price (DM) Product Firm
Share of All Observed Prices for
the Brand in the Respective Firm (%)
1.15 Müllermilch Schoko E 16.4 1.65 Landliebe Landmilch D 28.4 2.25 Rama A 8.1 2.85 Wasa Schoko Wikinger C 13.4 2.85 Schwartau Extra Erdbeerkonfitüre D 23.1 0.97 Müllermilch Schoko D 12.8 1.37 Müllermilch Schoko F 9.3 1.87 Rama F 15.4 1.97 Rama F 15.8 2.47 Coppenrath & Wiese “Unsere Goldstücke” F 8.5 3.47 Kellogg’s Cornflakes F 6.9 3.77 Teekanne Teefix F 6.5 3.77 Kellogg’s Cornflakes F 18.9 8.97 Dallmayr Prodomo F 7.2 1.98 Rama E 18.5 2.88 Schwartau Extra Erdbeerkonfitüre C 6.8 2.98 Wasa Schoko Wikinger C 5.5 9.98 Dallmayr Prodomo B and C 6.8 and 10.5
a) All prices are included that do not end at digit 9 and have a share of all observed prices for the brand in the respective firm of 5% or more.
Source: Authors’ Computations.
Table A22: Correlation Coefficients Between the Concentration of Psychological Prices (CR2) and Other Variables, German Food Brands, Firm Aa)
Variables INST ACTIONS PRICE PRIG CR2 INST 1.000 ACTIONS 0.884*** 1.000 PRICE -0.050 -0.12 1.000 PRIG -0.516* -0.488* 0.025 1.000 CR2 -0.654** 0.523* -0.108 0.487* 1.000 ***, **, * Statistically significant at the 99.9 %-, 99 %-, 95 %-level. a) The variables are defined in the text. Data for PRIG and CR2 are from Tables 1 and 2. Only those 18 brands
are included which are distributed in all firms (n = 18).
Source: Authors’ computations.
23
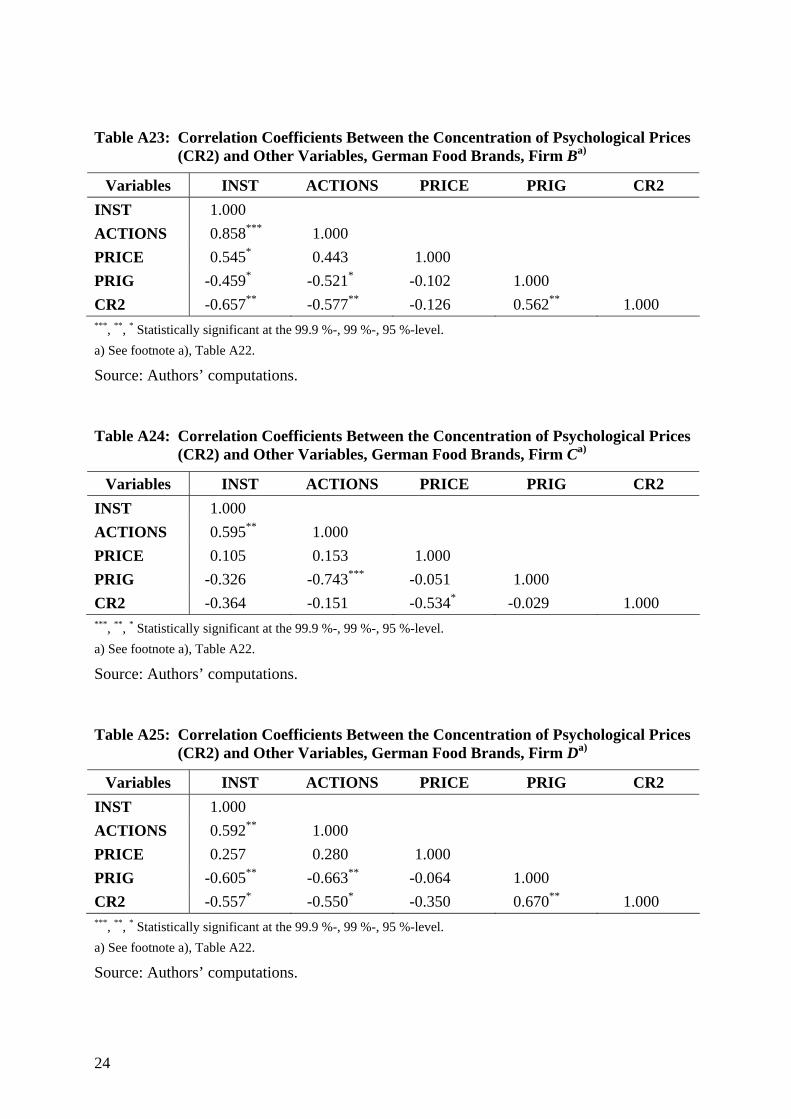
Table A23: Correlation Coefficients Between the Concentration of Psychological Prices (CR2) and Other Variables, German Food Brands, Firm Ba)
Variables INST ACTIONS PRICE PRIG CR2 INST 1.000 ACTIONS 0.858*** 1.000 PRICE 0.545* 0.443 1.000 PRIG -0.459* -0.521* -0.102 1.000 CR2 -0.657** -0.577** -0.126 0.562** 1.000 ***, **, * Statistically significant at the 99.9 %-, 99 %-, 95 %-level. a) See footnote a), Table A22.
Source: Authors’ computations.
Table A24: Correlation Coefficients Between the Concentration of Psychological Prices (CR2) and Other Variables, German Food Brands, Firm Ca)
Variables INST ACTIONS PRICE PRIG CR2 INST 1.000 ACTIONS 0.595** 1.000 PRICE 0.105 0.153 1.000 PRIG -0.326 -0.743*** -0.051 1.000 CR2 -0.364 -0.151 -0.534* -0.029 1.000 ***, **, * Statistically significant at the 99.9 %-, 99 %-, 95 %-level. a) See footnote a), Table A22.
Source: Authors’ computations.
Table A25: Correlation Coefficients Between the Concentration of Psychological Prices (CR2) and Other Variables, German Food Brands, Firm Da)
Variables INST ACTIONS PRICE PRIG CR2 INST 1.000 ACTIONS 0.592** 1.000 PRICE 0.257 0.280 1.000 PRIG -0.605** -0.663** -0.064 1.000 CR2 -0.557* -0.550* -0.350 0.670** 1.000 ***, **, * Statistically significant at the 99.9 %-, 99 %-, 95 %-level. a) See footnote a), Table A22.
Source: Authors’ computations.
24

Table A26: Correlation Coefficients Between the Concentration of Psychological Prices (CR2) and Other Variables, German Food Brands, Firm Ea)
Variables INST ACTIONS PRICE PRIG CR2 INST 1.000 ACTIONS 0.607** 1.000 PRICE 0.422 0.512** 1.000 PRIG -0.543* -0.658** -0.194 1.000 CR2 -0.795*** -0.697*** -0.595** 0.458* 1.000 ***, **, * Statistically significant at the 99.9 %-, 99 %-, 95 %-level. a) See footnote a), Table A22.
Source: Authors’ computations.
Table A27: Correlation Coefficients Between the Concentration of Psychological Prices (CR2) and Other Variables, German Food Brands, Firm Fa)
Variables INST ACTIONS PRICE PRIG CR2 INST 1.000 ACTIONS 0.621** 1.000 PRICE 0.103 0.171 1.000 PRIG -0.336 -0.518* -0.076 1.000 CR2 -0.638** -0.305 0.217 -0.035 1.000 ***, **, * Statistically significant at the 99.9 %-, 99 %-, 95 %-level. a) See footnote a), Table A22.
Source: Authors’ computations.
25
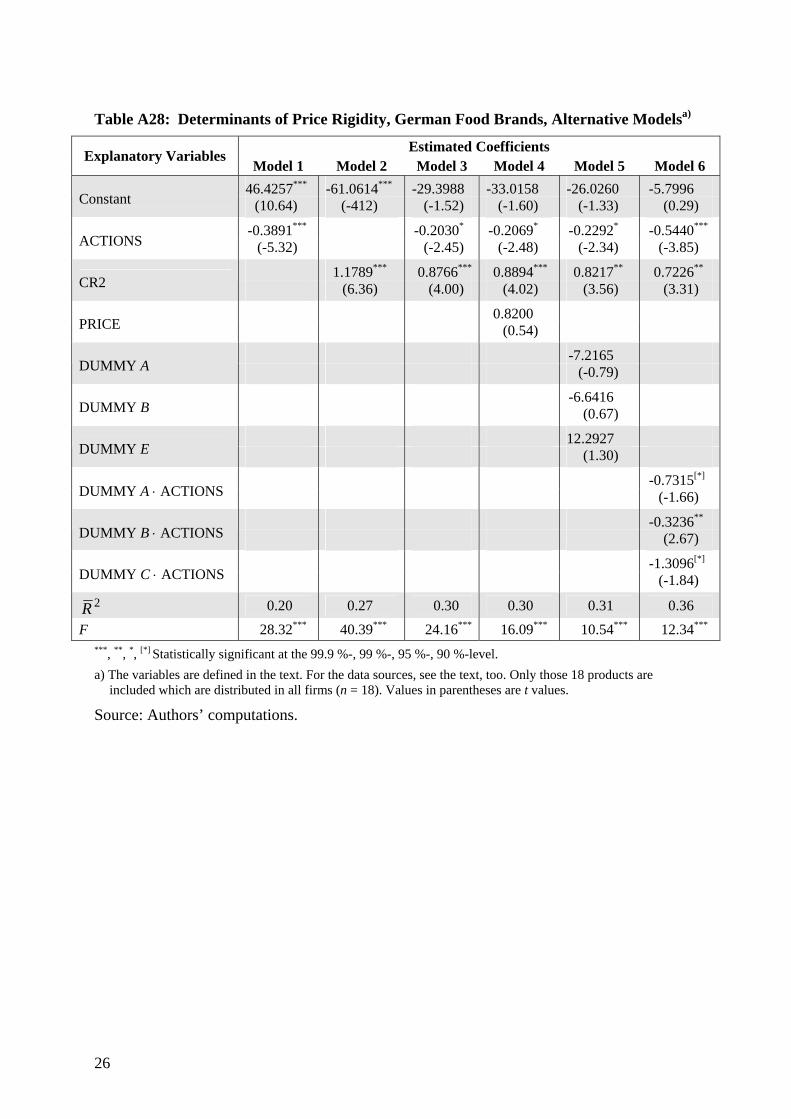
Table A28: Determinants of Price Rigidity, German Food Brands, Alternative Modelsa)
Estimated Coefficients Explanatory Variables Model 1 Model 2 Model 3 Model 4 Model 5 Model 6
46.4257*** -61.0614*** -29.3988 -33.0158 -26.0260 -5.7996 Constant (10.64) (-412) (-1.52) (-1.60) (-1.33) (0.29)
-0.3891*** -0.2030* -0.2069* -0.2292* -0.5440***
ACTIONS (-5.32) (-2.45) (-2.48) (-2.34) (-3.85)
1.1789*** 0.8766*** 0.8894*** 0.8217** 0.7226**
CR2 (6.36) (4.00) (4.02) (3.56) (3.31)
0.8200 PRICE (0.54)
-7.2165 DUMMY A (-0.79)
-6.6416 DUMMY B (0.67)
12.2927 DUMMY E (1.30)
-0.7315[*]
DUMMY A ⋅ ACTIONS (-1.66)
-0.3236**
DUMMY B ⋅ ACTIONS (2.67)
-1.3096[*]
DUMMY C ⋅ ACTIONS (-1.84) 2R 0.20 0.27 0.30 0.30 0.31 0.36
F 28.32*** 40.39*** 24.16*** 16.09*** 10.54*** 12.34***
***, **, *, [*] Statistically significant at the 99.9 %-, 99 %-, 95 %-, 90 %-level. a) The variables are defined in the text. For the data sources, see the text, too. Only those 18 products are
included which are distributed in all firms (n = 18). Values in parentheses are t values.
Source: Authors’ computations.
26

Table A29: Marginal Changes in Price Rigidity Due to a Change in the Number of Price Actions and a Change in Psychological Pricinga)
Marginal Changes in PRIG Due to a Change in … Grocery-retailing Firms ACTIONS CR2 2R F
-0.7275 0.8097 A (-1.28) (1.27) 0.22 3.40[*]
-0.0872 0.5312 B (-1.18) (1.57) 0.29 4.49*
-0.2654*** -0.1119 C (-4.48) (-0.84) 0.52 10.04**
-0.9005[*] 1.4356*
D (-2.09) (2.17) 0.52 10.07**
-4.4875* -0.046 E (-2.43) (-0.00) 0.36 5.72*
-0.2443* -0.1481 F (-2.58) (-0.94) 0.22 3.35[*]
***, **, *, [*] Statistically significant at the 99.9 %-, 99 %-, 95 %-, 90 %-level. a) The variables are defined in the text. For the data sources, see the text, too. Only those 18 products are
included which are distributed in all firms (n = 18). Values in parentheses are t values. The regression equations for which the corrected coefficient of determination and F-values are presented contain a constant additionally.
Source: Authors’ computations.
27


AGRARÖKONOMISCHE DISKUSSIONSBEITRÄGE – DISCUSSION PAPERS IN AGRICULTURAL ECONOMICS –
Nr. 1 –40: siehe Agrarökonomische Diskussionsbeiträge Nr. 72. 41. Manfred WIEBELT, Allgemeine Wirtschaftspolitik und Agrarsektorentwicklung in Entwick-
lungsländern - Eine allgemeine Gleichgewichtsanalyse. Februar 1997, 31 Seiten. (als erweiterte Fassung erschienen unter dem Titel "Wie beeinflußt die allgemeine Wirt-schaftspolitik die Landwirtschaft? Transmissionsmechanismen und ihre quantitative Bedeutung" in "Berichte über Landwirtschaft", Band 75 (1997), Heft 4, S. 515-538)
42. Kerstin PFAFF und Eva BEIMDICK, Der internationale Teemarkt: Marktüberblick, Protek-tionsanalyse und Entwicklung ökologisch erzeugten Tees. Februar 1997, 38 Seiten.
43. Anke GIERE, Roland HERRMANN und Katja BÖCHER, Wie beeinflussen Ernährungsinforma-tionen den Nahrungsmittelkonsum im Zeitablauf? Konstruktion eines Ernährungsinforma-tionsindexes und ökonometrische Analyse des deutschen Butterverbrauchs. Mai 1997, 44 Seiten. (gekürzte und geänderte Fassung erschienen unter dem Titel "Ernährungsinformationen und Nahrungsmittelkonsum: Theoretische Überlegungen und empirische Analyse am Beispiel des deutschen Buttermarktes" in "Agrarwirtschaft", Jg.46 (1997), Heft 8/9, S.283-293)
44. Joachim KÖHNE, Die Bedeutung von Preisverzerrungen für das Wirtschaftswachstum der Reformländer in Mittel- und Osteuropa. September 1997, 16 Seiten.
45. Christoph R. WEISS, Firm Heterogeneity and Demand Fluctuations: A Theoretical Model and Empirical Results. September 1997, 16 Seiten.
46. Roland HERRMANN und Claudia RÖDER, Some Neglected Issues in Food Demand Analysis: Retail-Level Demand, Health Information and Product Quality. Oktober 1997, 27 Seiten. (überarbeitete Fassung erschienen in „Australian Journal of Agricultural and Resource Econo-mics“, Vol.42, No.4, 1998, S. 341-367)
47. Timothy JOSLING, The WTO, Agenda 2000 and the Next Steps in Agricultural Policy Reform. Mai 1998, 46 Seiten.
48. Kerstin PFAFF, Marktstruktur- und Preisasymmetrieanalyse der Fleischbranche in Mittelhessen. September 1998, 60 Seiten.
49. Kerstin PFAFF und Marc C. KRAMB, Veterinärhygiene- und Tierseuchenrecht: Bedeutender Standortnachteil für Erzeuger und Schlachthöfe in Hessen? Oktober 1998, 22 Seiten.
50. Axel REINHARDT, Determinanten der Investitionsaktivitäten der Ernährungsindustrie. Empi-rische Ergebnisse für die deutsche Fruchtsaftindustrie. Dezember 1998, 34 Seiten.
51. Roland HERRMANN, Claudia RÖDER und John M. CONNOR, How Market Structure Affects Food Product Proliferation: Theoretical Hypotheses and New Empirical Evidence for the U.S. and the German Food Industries. Februar 1999, 58 Seiten.
52. Roland HERRMANN und Richard SEXTON, Redistributive Implications of a Tariff-rate Quota Policy: How Market Structure and Conduct Matter. März 1999, 60 Seiten. (ein Teil wurde in stark veränderter Form unter dem Titel "Market Conduct and Its Importance for Trade Policy Analysis: The European Banana Case" veröffentlicht in: MOSS, C., G. RAUSSER, A. SCHMITZ, T. TAYLOR und D. ZILBERMAN (eds.) (2001), Agricultural Globalization, Trade and the Environment. Dordrecht: Kluwer Academic Press, S. 153-177)
53. Stanley R. THOMPSON und Martin T. BOHL, International Wheat Price Transmission and CAP Reform. Juni 1999, 11 Seiten.
54. Michaela KUHL und P. Michael SCHMITZ, Macroeconomic Shocks and Trade Responsiveness in Argentina – A VAR Analysis. Juni 1999, 19 Seiten und Anhang. (erschienen in "Konjunkturpolitik", Jg. 46, 2000, Heft 1/2, S. 62-92)
55. Roland HERRMANN, Johannes HARSCHE und Kerstin PFAFF, Wettbewerbsnachteile der Land-wirtschaft durch unvollkommene Märkte und mangelnde Erwerbsalternativen? Juni 1999, 17 Seiten. (etwas gekürzte Fassung erschienen in "Zeitschrift für Kulturtechnik und Landentwicklung", Heft 5/6, 1999, S.282-288)
I
56. Stanley R. THOMPSON und Wolfgang GOHOUT, CAP Reform, Wheat Instability and Producer Welfare. August 1999, 15 Seiten.
57. Silke SCHUMACHER, Nachwachsende Rohstoffe in Hessen: Analyse und Bewertung anhand des Fallbeispiels Raps. August 1999, 24 Seiten.
58. Ernst-August NUPPENAU, Nature Preservation as Public Good in a Community of Farmers and Non-Farm Residents: Applying a Political Economy Model to Decisions on Financial Contribu-tions and Land Allocation. August 1999, 40 Seiten. (wurde in veränderter Form unter dem Titel "Public Preferences, Statutory Regulations and Bargaining in Field Margin Provision for Ecological Main Structures" veröffentlicht in "Agricultural Economics Review", Vol. 1, No. 1, (2000), S. 19-32)
59. Stanley R. THOMPSON, Roland HERRMANN und Wolfgang GOHOUT, Agricultural Market Liberalization and Instability of Domestic Agricultural Markets: The Case of the CAP. März 2000, 18 Seiten. (erschienen in "American Journal of Agricultural Economics", Vol. 82 (2000), No. 3, S. 718-726)
60. Roland HERRMANN, Marc KRAMB und Christina MÖNNICH, The Banana Dispute: Survey and Lessons. September 2000, 29 Seiten. (gekürzte und stark veränderte Fassung erschienen in „Quarterly Journal of International Agriculture“, Vol. 42 (2003), No. 1, S. 21-47)
61. Roland HERRMANN, Stephanie KRISCHIK-BAUTZ und Stanley R. THOMPSON, BSE and Generic Promotion of Beef: An Analysis for 'Quality from Bavaria'. Oktober 2000, 18 Seiten. (geänderte Fassung erschienen in „Agribusiness – An International Journal“, Vol. 18 (2002), No. 3, S. 369-385)
62. Andreas BÖCKER, Globalisierung, Kartelle in der Ernährungswirtschaft und die Möglichkeit der Neuen Industrieökonomie zur Feststellung von Kollusion. November 2000, 37 Seiten.
63. Kerstin PFAFF, Linkages Between Marketing Levels in the German Meat Sector: A Regional Price Transmission Approach with Marketing-Cost Information. Mai 2001, 17 Seiten. (stark überarbeitete Fassung erschienen unter dem Titel „Processing Costs and Price Transmission in the Meat Marketing Chain: Analysis for a German Region“, Vol. 15 (2003), Nos. 1/2, S. 7-22 von Kerstin PFAFF, Sven ANDERS und Roland HERRMANN)
64. Roland HERRMANN, Anke MÖSER und Elke WERNER, Neue empirische Befunde zur Preissetzung und zum Verbraucherverhalten im Lebensmitteleinzelhandel. Mai 2001, 28 Seiten. (stark veränderte Fassung erschienen in „Agrarwirtschaft“, Jg. 51 (2002), Heft 2, S. 99-111)
65. Stanley R. THOMPSON, Wolfgang GOHOUT und Roland HERRMANN, CAP Reforms in the 1990s and Their Price and Welfare Implications: The Case of Wheat. Dezember 2001, 14 Seiten. (erschienen in “Journal of Agricultural Economics”, Vol. 53 (2002), No. 1, S. 1-13)
66. Andreas BÖCKER, Extending the Application of Experimental Methods in Economic Analysis of Food-Safety Issues: A Pilot Study on the Impact of Supply Side Characteristics on Consumer Response to a Food Scare. Juni 2002, 30 Seiten. (veränderte Fassung erschienen unter dem Titel “Consumer response to a food safety incident: Exploring the role of supplier differentiation in an experimental study” in “European Review of Agricultural Economics”, Vol. 29 (2002), No. 1, p. 29-50)
67. Andreas BÖCKER, Perception of Food Hazards – Exploring the Interaction of Gender and Experience in an Experimental Study. Juni 2002, 24 Seiten. (stark veränderte Fassung erschienen unter dem Titel “Geschlechterdifferenzen in der Risikowahrnehmung bei Lebensmitteln genauer betrachtet: Erfahrung macht den Unterschied” in “Hauswirtschaft und Wissenschaft“, Jg. 29 (2002), Heft 2, S. 65-75)
68. Roland HERRMANN und Anke MÖSER, Preisrigidität oder Preisvariabilität im Lebensmittel-einzelhandel? Theorie und Evidenz aus Scannerdaten. Juni 2002, 29 Seiten. (erschienen in „Konjunkturpolitik“, Jg. 48 (2002), Heft 2, S. 199-227)
69. Sven ANDERS, Johannes HARSCHE und Roland HERRMANN, The Regional Incidence of European Agricultural Policy: Measurement Concept and Empirical Evidence. Oktober 2002, 18 Seiten.
70. Roland HERRMANN, Nahrungsmittelqualität aus der Sicht der Verbraucher und Implikationen für Pflanzenproduktion und Politik. Juni 2003, 16 Seiten.
II

71. Sven ANDERS, Agrarökonomische Analyse regionaler Versorgung. November 2003, 20 Seiten.
72. Sabine KUBITZKI, Sven ANDERS und Heiko HANSEN, Branchenspezifische Besonderheiten im Innovationsverhalten des Ernährungsgewerbes: Eine empirische Analyse des Mannheimer Innovationspanels. Dezember 2003, 23 Seiten.
73. Roland HERRMANN und Anke MÖSER, Psychological Prices of Branded Foods and Price Rigidity: Evidence from German Scanner Data. März 2004, 27 Seiten.
III