no. a12-1555 state of minnesota in supreme · pdf filea12-1555 state of minnesota in supreme...
TRANSCRIPT

2013 – BACHMAN LEGAL PRINTING – FAX (612) 337-8053 – PHONE (612) 339-9518 or 1-800-715-3582
NO. A12-1555
State of Minnesota
In Supreme Court
Graphic Communications Local 1B Health & Welfare Fund “A”; and
The Twin Cities Bakery Drivers Health and Welfare Fund, individually and on behalf of all others similarly situated,
Plaintiffs-Respondents, vs.
CVS Caremark Corporation, et al, Coborn’s, Incorporated,
Kmart Holding Corporation, et al., Snyder’s Drug Stores (2009), Inc., et al., Target Corporation; Sears, Roebuck And Co., Walgreen Co.,
and Wal-Mart Stores, Inc., Defendants-Appellants.
___________________________
AMICUS BRIEF AND APPENDIX OF THE NATIONAL ASSOCIATION OF CHAIN DRUG STORES, NATIONAL COMMUNITY PHARMACISTS
ASSOCIATION, RETAIL LITIGATION CENTER, MINNESOTA PHARMACISTS ASSOCIATION, MINNESOTA RETAILERS
ASSOCIATION, INDEPENDENT PHARMACY COOPERATIVE, THRIFTY WHITE PHARMACY, AND THE MINNESOTA CHAMBER OF COMMERCE
___________________________
BRIGGS AND MORGAN, P.A. Leah Ceee O. Boomsma (#0389885) 2200 IDS Center 80 South Eighth Street Minneapolis, MN 55402 (612) 977-8400 Attorneys for Amici National Association of Chain Drug Stores, National Community Pharmacists Association, Retail Litigation Center, Minnesota Pharmacists Association, Minnesota Retailers Association, Independent Pharmacy Cooperative, Thrifty White Pharmacy, and the Minnesota Chamber of Commerce
(Counsel for the parties and additional amici continues on following pages)

Wendy J. Wildung (#117055) Craig S. Coleman (#0325491) FAEGRE BAKER DANIELS LLP 2200 Wells Fargo Center 90 South Seventh Street Minneapolis, MN 55402 (612) 766-7000 Attorneys for Defendant-Appellant Target Corporation Todd A. Noteboom (#240047) Elizabeth Wiet Reutter (#316957) LEONARD, STREET AND DEINARD, P.A. 150 South Fifth Street, Suite 2300 Minneapolis, MN 55402 (612) 335-1500 Attorneys for Defendant-Appellant Walgreen Co. Lewis A. Remele, Jr. (#90724) Christopher R. Morris (#230613) BASSFORD REMELE, P.A. 33 South Sixth Street, Suite 3800 Minneapolis, MN 55402-3707 (612) 333-3000 Attorneys for Defendants-Appellants CVS Caremark Corporation, CVS Pharmacy, Inc., Caremark, LLC, Caremark Minnesota Specialty Pharmacy, LLC, and Caremark Minnesota Specialty Pharmacy Holding, LLC Tracy J. Van Steenburgh (#141173) NILAN JOHNSON LEWIS, PA 400 Canadian Pacific Plaza 120 South Sixth Street Minneapolis, MN 55402-4501 (612) 305-7500 Attorneys for Defendants-Appellants Kmart Holding Corporation, Sears, Roebuck & Co., and Sears Holding Corporation
David R. Marshall (#184457) Joseph J. Cassioppi (#388238) FREDRIKSON & BYRON, P.A. 200 South Sixth Street, Suite 4000 Minneapolis, MN 55402 (612) 492-7000
Attorneys for Defendant-Appellant Walmart Stores, Inc.
Kevin D. Hofman (#0179978) Ronald B. Peterson (#0086344) HALLELAND HABICHT, P.A. 33 South Sixth Street, Suite 3900 Minneapolis, MN 55402 (612) 836-5500 Attorneys fro Defendant-Appellant Coborn’s Incorporated
James K. Langdon (#171931) DORSEY & WHITNEY LLP 50 South Sixth Street, Suite 1500 Minneapolis, MN 55402-1498 (612) 340-2600 Attorneys for Defendants- Appellants Snyder’s Drug Stores (2009), Inc., Snyder’s Holdings (2009), Inc., and Snyder’s Holding, Inc.

2013 – BACHMAN LEGAL PRINTING – FAX (612) 337-8053 – PHONE (612) 339-9518 or 1-800-715-3582
David L. Hashmall (#138162) FELHABER, LARSON, FENLON & VOGT, P.A. 220 South Sixth Street, Suite 2200 Minneapolis, MN 55402 (612) 339-6321 Perrin Rynders (admitted pro hac vice) VARNUM LLP Bridgewater Place P.O. Box 352 Grand Rapids, MI 49501-0352 (616) 336-6000 John W. Barrett BAILEY & GLASSER LLP 209 Capitol Street Charleston, WV 25301 (304) 345-6555
Attorneys for Plaintiffs-Respondents
Donald R. McNeil Stephen F. Buterin HELEY, DUNCAN & MELANDER, PLLP 8500 Normandale Lake Boulevard Suite 2110 Minneapolis, MN 55437 (952) 841-0001
Attorneys for Amicus The National Labor Alliance of Health Care Coalitions
Mark S. Olson OPPENHEIMER WOLFF & DONNELLY, LLP Campbell Mithun Tower, Suite 2000 222 South Ninth Street Minneapolis, MN 55402 (612) 607-7000 Attorneys for Amicus Product Liability Advisory Council, Inc. William L. Davidson (#201777) LIND, JENSEN, SULLIVAN & PETERSON, P.A. 1300 AT&T Tower 901 Marquette Avenue South Minneapolis, MN 55402 (612) 333-3637 Attorneys for Amicus Minnesota Defense Lawyers Association Dale O. Thornsjo JOHNSON & CONDON, P.A. 7401 Metro Boulevard Suite 600 Minneapolis, MN 55439 (952) 831-6544 Attorneys for Amici Insurance Federation of Minnesota, et al. Jennifer Y. Dukart Assistant Attorney General MINNESOTA ATTORNEY GENERAL’S OFFICE 1200 Bremer Tower 445 Minnesota Street St. Paul, MN 55101 (651) 296-3353 Attorneys for Amicus State of Minnesota through Attorney General Lori Swanson


5673390v1
NACDS, et al. APPENDIX
1. Kaiser Family Foundation, Prescription Drug Trends (May 2010) .......... NA. 1
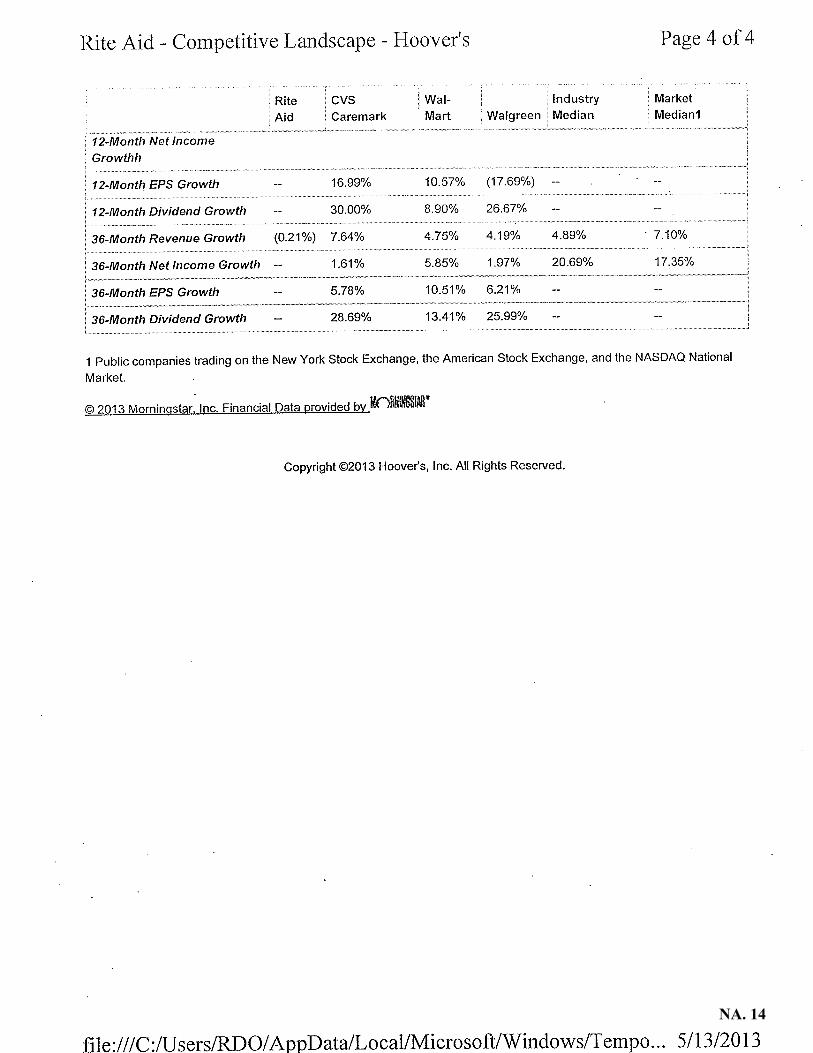
2. Hoovers Competitive Landscape Report ................................................. NA. 11
3. Rural Assistance Center of the U.S. Department of Health and Human Services, Rural Pharmacy and Prescription Drugs, http://www.raconline.org/topics/pharmacy/ (last visited Sep. 3, 2013) ........................................................................................................ NA. 15
4. Mayo Clinic, Brand-name v. Generic Drugs: Is One Better Than the Other?, Medical Edge Newspaper Column (Feb. 3, 2012) ..................... NA. 16
5. United States Food and Drug Administration, Understanding Generic Drugs: Facts About Generic Drugs, FDA.gov, http://www.fda.gov/drugs/resourcesforyou/consumers/ buyingusingmedicinesafely/understandinggenericdrugs/ucm167991.htm (last visited Sep. 3, 2013) ................................................................. NA. 17
6. Kaiser Family Foundation, Follow the Pill: Understanding the U.S. Commercial Pharmaceutical Supply Chain (Mar. 2005) ....................... NA. 19
7. The Federal Reserve Bank of Minneapolis, Cash, Check or Third Party? Prescription Benefit Plans Are Squeezing Retail Pharmacies, Fedgazette (Jan. 1, 2006) .................................................... NA. 51
8. Graphic Communications National, About Us: Plan Design for Local 1B, http://www.gccibthealthfund.org/index-1.html (last visited Sep. 3, 2013) ................................................................................ NA. 58
9. Excerpt of Twin Cities Bakery Drivers Health and Welfare Fund, Summary Plan Description (Sep. 2009) ................................................. N A. 61
10. Centers for Medicare & Medicaid Services, Part II: Draft Methodology for Calculating the National Average Drug Acquisition Cost (May 2012) ...................................................................................... NA. 71
11. Walgreen Co. & The Kroger Co., Declaratory Ruling (W. Va. Bd. of Pharm. Oct. 23, 2012) ............................................................................ NA. 107

The Henry J. Kaiser Family Foundation is a non-profit, private operating foundation dedicated to providing information and analysis on health care issues to
policymakers, the media, the health care community, and the general public. The Foundation is not associated with Kaiser Permanente or Kaiser Industries.
2400 Sand Hill Road, Menlo Park, CA 94025 Phone: (650) 854-9400 Facsimile: (650) 854-4800 www.kff.orgWashington, DC Office: 1330 G Street, NW, Washington, DC 20005 Phone: (202) 347-5270 Facsimile: (202) 347-5274
Prescription Drug Trends
Overview Prescription drugs are vital to preventing and treating illness and in helping to avoid more costly medical problems. Rising drug costs, implementation of the Medicare Part D drug benefit in 2006, and expansion of both the number of people covered by health insurance and the breadth of their benefits from the passage of health reform legislation in March 2010 have highlighted the need for a better understanding of the pharmaceutical market and for new approaches to address increasing prescription costs. Rising Expenditures for Prescription Drugs Spending in the US for prescription drugs was $234.1 billion in 2008, nearly 6 times the $40.3 billion spent in 1990.1 Although prescription drug spending has been a relatively small proportion of national health care spending (10% in 2008, compared to 31% for hospitals and 21% for physician services), it has been one of the fastest growing components, until the early 2000’s growing at double-digit rates compared to single-digit rates for hospital and physician services. Since 2000, the rate of increase in drug spending has declined each year except for 2006, which was the year Medicare Part D was implemented. By 2008, the annual rate of increase in prescription spending was 3%, compared to 5% for hospital care and 5% for physician services (Figure 1). From 1998 to 2008, prescription drugs contributed 13% of the total growth in national health expenditures, compared to 30% for hospital care and 21% for physician and clinical services.2 Annual prescription spending growth slowed from 1999 (18%) to 2005 (6%) because of the increased use of generic drugs, the increase in tiered copayment benefit plans, changes in the types of drugs used, and a decrease in the number of new drugs introduced.3 The annual change in drug spending in 2006 (9%) increased as a result of 1) increased use of prescription drugs which was attributable to a number of factors including the implementation of Medicare Part D, new indications for existing drugs, strong growth in several therapeutic classes, and increased use of specialty drugs; 2) lower rebates from drug manufacturers; and 3) changes in the mix of drugs (both brand versus generic, and changes in the therapeutic mix).4
May 2010
NA. 1

The 2007 change in drug spending (5%) decelerated because of an increase in the generic dispensing rate (which was affected in part by the loss of patent exclusivity for some blockbuster drugs), slower growth in prescription drug prices, and growing consumer safety concerns about certain drugs.5 The 2008 drug spending change (3%) declined (as did the spending growth for most health care goods and services) because of a slight decline in per capita use of prescription drugs due to the impact of the recession, a low number of new drug products, and safety and efficacy concerns.6 The share of prescription drug spending paid by private health insurance increased substantially from 1990 to 2005 (from 26% to 48%), contributing to a decline in the share that people paid out-of-pocket (from 56% to 24%); the public funds (government) share of expenditures increased from 18% in 1990 to 28% in 2005. However, the implementation of the Medicare Part D drug benefit in 2006 substantially changed the mix of funding sources, as the government’s share rose from 28% to 37% between 2005 and 2008, while the private insurance portion fell from 48% to 42%, and the consumer out-of-pocket share declined from 24% to 21% (Figure 2). Medicare’s and Medicaid’s shares of public funding changed when the Medicare drug benefit took effect in 2006: between 2005 and 2008, Medicare’s share grew from 7% to 60%, and Medicaid’s share fell from 70% to 24% (Figure 3) because Medicare replaced Medicaid as the primary source of drug coverage for beneficiaries with coverage under both programs (known as “dual eligibles”).
NA. 2

Factors Driving Changes in Prescription Spending Three main factors drive changes in prescription drug spending: changes in the number of prescriptions dispensed (utilization), price changes, and changes in the types of drugs used.
Utilization. The number of prescriptions dispensed in the US in 2009 increased 2.1% (from 3.8 billion to 3.9 billion), a larger growth rate than the 1.0% increase in 2008 over 2007. From 1999 to 2009, the number of prescriptions increased 39% (from 2.8 billion to 3.9 billion), compared to a US population growth of 9%. The average number of retail prescriptions per capita increased from 10.1 in 1999 to 12.6 in 2009.7 The percent of the population with a prescription drug expense in 2007 was 62%, the same as in 1997. The proportion of those with an expense varied by age -- 58% for those under age 65 and 90% for those 65 and older, with little change since 1997 when the proportions were 59% and 86%, respectively.8 A recent study found that the rate of unfilled prescriptions has increased, from both denials and abandonment. Health plan denials of commercial prescription claims in 2009 were 8.1% for new prescriptions and 4.2% for refills; denials of new brand name drug prescriptions (10.3% in 2009) were down 1.4% from 2008, but were up 22.5% since 2006 (denials are prescriptions that have been submitted to a pharmacy but rejected by a patient’s health plan). Abandoned prescriptions (those that are submitted to a pharmacy but are never picked up) as a percent of commercial prescription drug claims were 6.3% for new prescriptions and 2.6% for refills in 2009; for new brand name prescriptions, the abandonment rate was up 23% from 2008 and up 68% from 2006. Together, health plan denials and patient abandonment resulted in 14.4% of all new, commercial plan prescriptions going unfilled in 2009, up 5.5% from 2008.9 A 2009 study found that the cost of drug-related morbidity, including poor adherence (not taking medication as prescribed by doctors) and suboptimal prescribing, drug administration, and diagnosis, is estimated to be as much as $289 billion annually, about 13% of total health care expenditures. The barriers to medication adherence are many: cost, side effects, the difficulty of managing multiple prescriptions, patients’ understanding of their disease, forgetfulness, cultural and belief systems, imperfect drug regimens, patients’ ability to navigate the health care system, cognitive impairments, and a reduced sense of urgency due to asymptomatic conditions.10 Price. Prescription drug prices as measured by the Consumer Price Index increased 3.4% in 2009, 2.5% in 2008, 1.4% in 2007, and 4.3% in 2006. The average annual growth in prescription drug prices from 2000 to 2009 was 3.6 percent, compared to 4.1% for all medical care and 2.5% for all items.11 Industry data show that retail prescription prices12 (which reflect both manufacturer price changes for existing drugs and changes in use to newer, higher-priced drugs) rose from an average price of $38.43 in 1998 to $71.69 in 2008; the average brand name prescription price in 2008 was almost 4 times the average generic price ($137.90 vs. $35.22).13 Of the average retail prescription price of $71.69, manufacturers received 78%, retailers received 17%, and wholesalers received 4% in 2008.14 Changes in Types of Drugs Used. Prescription drug spending is affected when new drugs enter the market and when existing medications lose patent protection. New drugs can increase overall drug spending if they are used in place of older, less expensive medications; if they supplement rather than replace existing drugs treatments; or if they treat a condition not previously treated with drug therapy. New drugs can reduce drug spending if they come into the market at a lower price than existing drug therapies; this can occur when a new drug enters a therapeutic category with one or two dominant brand competitors. New drug use is affected by the number of new drugs (new molecular entities) approved by the US Food and Drug Administration; approvals have fluctuated over the past decade, with 35 approvals in 1999, 20 in 2005, and 25 in 2009.15 U.S. pharmaceutical research and biotechnology companies spent about $65 million on research and development of new medicines and vaccines in 2009, an Increase of about $1.5 billion over 2008.16 Drug spending is also typically reduced when brand name drugs lose patent protection and face competition from new, lower cost generic substitutes. FDA analysis of 1999-2004 data shows that generic competition is associated with lower drug prices: on average, the first generic competitor prices its product only slightly lower than the brand name manufacturer; the second generic manufacturer reduces the average generic price to nearly half the brand name price; prices continue to fall but more slowly as additional generic manufacturers market the product. For products with a large number of generics, the average generic price falls to 20% of the branded price and lower.17
NA. 3

Almost 80% of FDA-approved drugs have generic counterparts. In 2008, 22% of total prescription drug sales and 72% of total prescriptions dispensed were generic medicines. Generic sales grew 8% from 2005 to 2006.18 Several high-sales brand name drugs are expected to go off-patent in the next 5 years, peaking in 2011 and 2012 when 6 of today’s 10 largest products in the U.S. are expected to face generic competition. While total drug sales may decline as a result, the competition from generic drugs may bring down costs for patients.19 An issue receiving Congressional and Federal Trade Commission attention is the payments that brand name drug companies make to generic drug manufacturers to not release their products for a certain period of time, which the FTC says costs American consumers $3.5 billion per year.20 Advertising. Both prescription use and shifts to higher-priced drugs can be influenced by advertising, which is usually conducted for brand name rather than generic drugs. Manufacturer spending on advertising was over 1.5 times as much in 2009 ($10.9 billion) as in 1999 ($6.6 billion). After increasing every year since 1996, the total amount manufacturers spent on advertising declined from 2004 to 2005 (from $12.1 billion to $11.7 billion), rose to $12.4 billion in 2006, and fell to $11.8 billion in 2007, $11.3 billion in 2008, and $10.9 billion in 2009. The share directed toward consumers in 2009 (through advertising on television, radio, magazines, newspapers, and outdoor advertising), was over twice the amount spent in 1999 ($4.3 billion compared to $1.8 billion), though spending decreased 2% from 2008 ($4.4) to 2009 ($4.3 billion). The share directed toward physicians (through the sales activities of pharmaceutical representatives and through professional journals) in 2009 ($6.6 billion) was almost 1.5 times the amount in 1999 ($4.8 billion); such spending decreased 3% from 2008 ($6.8 billion) to 2009 ($6.6 billion).21 The FDA held hearings in November 2009 and bills have been introduced in the 111th Congress addressing changes to prescription advertising rules, particularly as they relate to on-line advertising. Sales and Profitability. Prescription drug sales were $300.3 billion in 2009, an increase of 5.1% over 2008. This increase was more than 2½ times the 1.9% increase from 2007 to 2008, but lower than the double-digit increases in the early 2000’s. IMS Health attributes the 2009 growth to a stronger demand for prescription drugs despite economic conditions; sustained pricing practices by pharmaceutical manufacturers; inventory management actions by retail pharmacies to bring stocking levels in line with market demand; greater use of specialty pharmaceuticals, which comprise 21% of U.S. market value; lower impact of patent expirations; and no significant product safety issues during the year.22 IMS Health forecasts a 3%-6% annual growth in the U.S. pharmaceutical market in the next 5 years, reaching $360-$390 billion in 2014.23 From 1995 to 2002, pharmaceutical manufacturers were the nation’s most profitable industry (profits as a percent of revenues). They ranked 3rd in profitability in 2003 and 2004, 5th in 2005, 2nd in 2006, and 3rd in 2007 and 2008, with profits of 19.3% in 2008.24 Selected PPACA Changes Affecting the Pharmaceutical Industry. The Patient Protection and Affordable Care Act (PPACA, P.L.11148, enacted March 23, 2010), as amended by the Health Care and Education Reconciliation Act of 2010 (HCERA, P.L.111-152, enacted March 30, 2010), includes several provisions that affect the pharmaceutical industry:
Imposes an annual fee on certain manufacturers and importers of brand name drugs (including biological products but excluding orphan drugs) whose branded sales exceed $5 million: an annual fee of $2.5 billion beginning in 2011, rising to $4.1 billion in 2018 and dropping to $2.8 billion in 2019 and thereafter, allocated across the industry according to the proportion of sales for government programs.
Establishes a process for FDA licensure of biosimilar (i.e., interchangeable) versions of brand name biological products; biological products are granted 12 years of exclusive use before biosimilar versions of a biological product can be approved, with certain drugs receiving additional years of exclusivity; FDA is authorized to collect associated user fees for the review of applications for approval.
Changes certain drug labeling requirements and requires the HHS Secretary to determine whether adding certain information to a prescription drug’s labeling and advertising would improve health care decision-making.
NA. 4
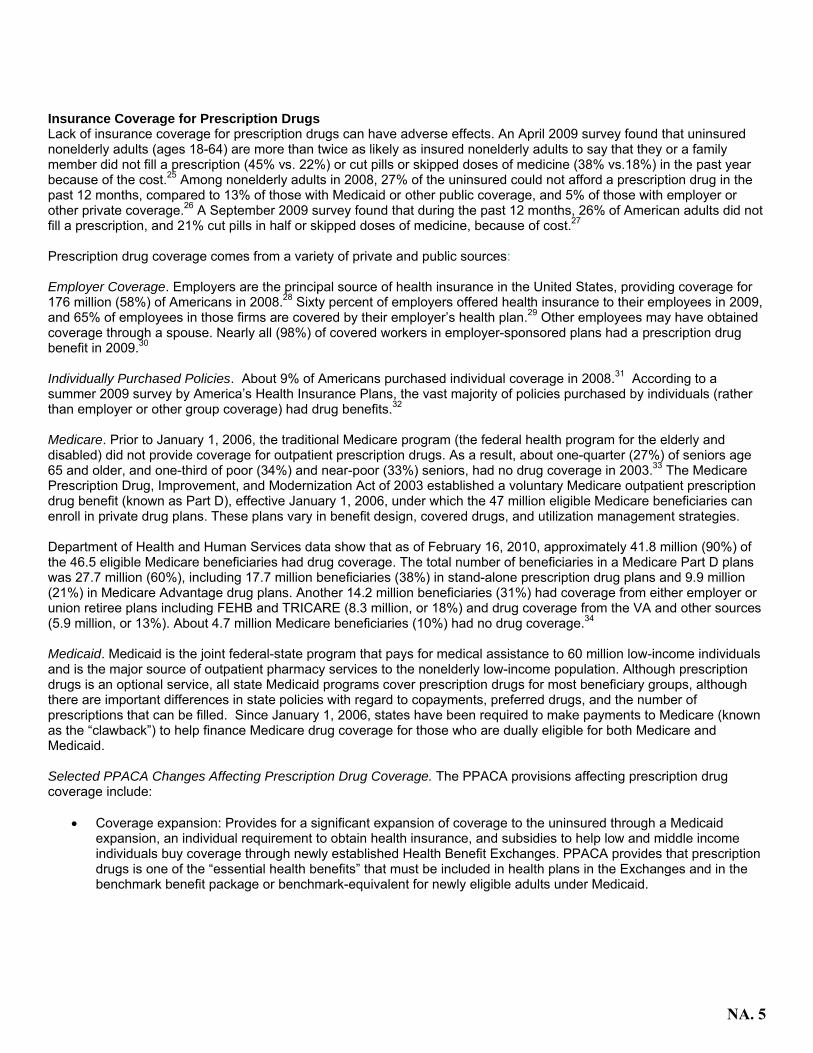
Insurance Coverage for Prescription Drugs Lack of insurance coverage for prescription drugs can have adverse effects. An April 2009 survey found that uninsured nonelderly adults (ages 18-64) are more than twice as likely as insured nonelderly adults to say that they or a family member did not fill a prescription (45% vs. 22%) or cut pills or skipped doses of medicine (38% vs.18%) in the past year because of the cost.25 Among nonelderly adults in 2008, 27% of the uninsured could not afford a prescription drug in the past 12 months, compared to 13% of those with Medicaid or other public coverage, and 5% of those with employer or other private coverage.26 A September 2009 survey found that during the past 12 months, 26% of American adults did not fill a prescription, and 21% cut pills in half or skipped doses of medicine, because of cost.27 Prescription drug coverage comes from a variety of private and public sources: Employer Coverage. Employers are the principal source of health insurance in the United States, providing coverage for 176 million (58%) of Americans in 2008.28 Sixty percent of employers offered health insurance to their employees in 2009, and 65% of employees in those firms are covered by their employer’s health plan.29 Other employees may have obtained coverage through a spouse. Nearly all (98%) of covered workers in employer-sponsored plans had a prescription drug benefit in 2009.30 Individually Purchased Policies. About 9% of Americans purchased individual coverage in 2008.31 According to a summer 2009 survey by America’s Health Insurance Plans, the vast majority of policies purchased by individuals (rather than employer or other group coverage) had drug benefits.32 Medicare. Prior to January 1, 2006, the traditional Medicare program (the federal health program for the elderly and disabled) did not provide coverage for outpatient prescription drugs. As a result, about one-quarter (27%) of seniors age 65 and older, and one-third of poor (34%) and near-poor (33%) seniors, had no drug coverage in 2003.33 The Medicare Prescription Drug, Improvement, and Modernization Act of 2003 established a voluntary Medicare outpatient prescription drug benefit (known as Part D), effective January 1, 2006, under which the 47 million eligible Medicare beneficiaries can enroll in private drug plans. These plans vary in benefit design, covered drugs, and utilization management strategies. Department of Health and Human Services data show that as of February 16, 2010, approximately 41.8 million (90%) of the 46.5 eligible Medicare beneficiaries had drug coverage. The total number of beneficiaries in a Medicare Part D plans was 27.7 million (60%), including 17.7 million beneficiaries (38%) in stand-alone prescription drug plans and 9.9 million (21%) in Medicare Advantage drug plans. Another 14.2 million beneficiaries (31%) had coverage from either employer or union retiree plans including FEHB and TRICARE (8.3 million, or 18%) and drug coverage from the VA and other sources (5.9 million, or 13%). About 4.7 million Medicare beneficiaries (10%) had no drug coverage.34 Medicaid. Medicaid is the joint federal-state program that pays for medical assistance to 60 million low-income individuals and is the major source of outpatient pharmacy services to the nonelderly low-income population. Although prescription drugs is an optional service, all state Medicaid programs cover prescription drugs for most beneficiary groups, although there are important differences in state policies with regard to copayments, preferred drugs, and the number of prescriptions that can be filled. Since January 1, 2006, states have been required to make payments to Medicare (known as the “clawback”) to help finance Medicare drug coverage for those who are dually eligible for both Medicare and Medicaid. Selected PPACA Changes Affecting Prescription Drug Coverage. The PPACA provisions affecting prescription drug coverage include:
Coverage expansion: Provides for a significant expansion of coverage to the uninsured through a Medicaid expansion, an individual requirement to obtain health insurance, and subsidies to help low and middle income individuals buy coverage through newly established Health Benefit Exchanges. PPACA provides that prescription drugs is one of the “essential health benefits” that must be included in health plans in the Exchanges and in the benchmark benefit package or benchmark-equivalent for newly eligible adults under Medicaid.
NA. 5

Medicare changes: Provides for a $250 rebate to Medicare Part D beneficiaries with out-of-pocket spending in the Medicare Part D coverage gap in 2010, a 50% discount for brand name drugs for beneficiaries in the coverage gap starting in 2011, a phasing-in of coverage in the gap for generic and brand name drugs which will reduce the beneficiary coinsurance rate from 100% in 2010 to 25% in 2020, a reduction between 2014 and 2019 in the threshold that qualifies enrollees for catastrophic coverage, and elimination of the tax deduction for employers who receive Medicare Part D retiree drug subsidy payments, starting in 2013.
Responses to Increasing Prescription Drug Costs A variety of public and private strategies have been implemented to attempt to contain rising costs for prescription drugs, as described below.35 Utilization Management Strategies. Health plans have responded to rising prescription drug costs by increasing enrollee cost-sharing amounts, using formularies to exclude certain drugs from coverage, applying quantity dispensing limits, requiring prior authorization, and using step therapy (starting with the most cost-effective drug and progressing to more costly therapy only if necessary). In 2009, over three-quarters (78%) of workers with employer-sponsored coverage were in plans with 3 or more 4 tiers of cost sharing for prescription drugs, almost 3 times the proportion in 2000 (27%).36 Worker copayments have increased from 2000-2009: 25% for generic drugs, 80% for preferred drugs, 59% for nonpreferred drugs, and 44% for fourth-tier drugs (data from 2004-2009) (Figure 4). The average copayment amounts in 2009 were $10 for generics, $27 for preferred drugs, $46 for nonpreferred drugs, and $85 for fourth-tier drugs. Twelve percent of covered workers had a separate annual drug deductible which averaged $108. A 2009 survey of individually purchased health policies found that the vast majority had drug benefits, with copayments being the predominant form of cost sharing. All HMOs and the majority of PPO/POS policies charged copayments which averaged, respectively, about $10/$13 for generic drugs, $26/$28 for preferred brand name drugs, and $44/$48 for non-formulary drugs. Fewer than half of the PPO/POS policies had a prescription drug deductible (averaging $481 for single coverage and $833 for family coverage); over half of the HMOs had a drug deductible (averaging $320 for single coverage and $1,002 for family coverage).37 Discounts and Rebates. Private and public drug programs negotiate with pharmaceutical manufacturers (often using contracted organizations known as pharmacy benefit managers) to receive discounts and rebates which are applied based on volume, prompt payment, and market share. Manufacturers who want their drugs covered by Medicaid must provide rebates to state Medicaid programs for the drugs they purchase; many states have also negotiated additional rebates, known as supplemental rebates.
NA. 6

Several federal government agencies, including the Department of Veterans Affairs, the Defense Department, the Public Health Service, and the Coast Guard, participate in a program known as the Federal Supply Schedule through which they purchase drugs from manufacturers at prices equal to or lower than those charged to their “most-favored” nonfederal purchasers.38 In order to participate in Medicaid, another program, the Section 340B Program, requires manufacturers to provide drugs to certain nonfederal entities (such as community health centers and disproportionate share hospitals) at discounted prices. PPACA expands the entities that qualify for the program to include non-PPS children’s and free-standing cancer hospitals, critical access hospitals and sole community hospitals, and rural referral centers; establishes new auditing, reporting, and other compliance requirements; and provides for an alternative dispute resolution process and penalties for violations.39 Medicaid. Historically, prescription drugs have been one of the fastest-growing Medicaid services, The Deficit Reduction Act of 2005 gave states more authority to control Medicaid drug spending through increased cost sharing for non-preferred drugs, changes in the way Medicaid pays pharmacists, allowing pharmacists to refuse prescriptions for beneficiaries who don’t pay their cost sharing, and inclusion of authorized generic drugs in the calculation of “best price” for drugs. By 2007, most states had already implemented many of these approaches, so new action to control drug spending slowed.40 A 2009 survey of 50 states+DC found that more than half had Medicaid pharmacy cost containment measures in place by FY2009, including preferred drug lists and prior authorization programs (about 45% of states), supplemental rebates from manufacturers and state Maximum Allowable Cost programs for generic and multi-source brand drugs (44%); smaller proportions of states were members of multi-state purchasing coalitions (26%) or had limits on quantities dispensed per prescription (16%).41 Medicaid spent $19.4 billion for prescription drugs in 2008, an increase of 3.5% over 2007; Medicaid drug spending decreased 1.7% between 2006 and 2007.42 Medicaid requires drug manufacturers who want to sell their products to Medicaid patients to agree to pay rebates to states for outpatient drugs purchased on behalf of Medicaid beneficiaries. PPACA increases the Medicaid drug rebate percentages for several types of outpatient drugs and requires that the resulting savings be remitted to the federal government. The law also extends the drug rebate to Medicare Managed Care Organizations and allows states to retain a portion of the savings generated from these rebates. Medicare. The Medicare Part D drug benefit shifted spending from the private sector and Medicaid to Medicare, making Medicare the nation’s largest public payer of prescription drugs (from 7% in 2005 to 60% in 2008). Medicare prescription drug spending as a share of total US prescription spending rose from 2% in 2005 to 22% in 2008. Medicare prescription drug spending totaled $52.1 billion in 2008, an increase of 13% over 2007.43 Part D plans use various cost containment approaches including tiered cost sharing, formulary coverage that varies considerably across plans, and utilization management (UM) restrictions such as prior authorization, step therapy, or quantity limits; UM use among stand-alone drug plans has increased from 18% in 2007 to 28% in 2009.44 Medicare is prohibited by law from directly negotiating drug prices or rebates with manufacturers to control costs. In the 110th Congress, the 2008 presidential campaign, and the 111th Congress, proposals to allow or require Medicare to negotiate drug prices with drug makers have been considered but not enacted. Purchasing Pools. Some public and private organizations have banded together to form prescription drug purchasing pools to increase their purchasing power through higher volume and shared expertise. Examples include joint purchasing by the Department of Defense and VA; multi-state bulk buying pools through which states purchase drugs for their Medicaid, state employees, senior/low-income/uninsured pharmacy assistance programs, or other public programs; and individual state purchasing pools.45 Consumers. Consumers are turning to a variety of methods to reduce their prescription costs,46 including requesting cheaper drugs or generic drugs from their physicians and pharmacies, using the Internet and other sources to make price comparisons, using the Internet to purchase drugs, buying at discount stores, buying over-the-counter instead of prescribed drugs, buying drugs in bulk and pill-splitting, using mail-order pharmacies,47 and using pharmaceutical company or state drug assistance programs. Over half of physicians say they frequently talk with patients about the out-of-pocket costs of medicines they prescribe, 62% say they switch patients to less expensive drugs, and 58% say they give patients office samples.48
NA. 7

Importation. The high cost of prescriptions has led some to suggest that individuals be permitted to purchase prescription products from distributors in Canada or other countries (called “importation,” or “reimportation” if the drug is manufactured in the US). Although it is generally not lawful for individuals or commercial entities such as pharmacies or wholesalers to purchase prescription drugs from other countries, the government does not always act to stop individuals from purchasing drug products abroad. Importation of pharmaceutical products from Canada through Internet sales and travel to Canada totaled about $700 million in sales in 2003, or 0.3% of total US prescription sales. An equivalent amount of prescription drugs was estimated to have entered the US from the rest of the world, mostly through the mail and courier services.49 P.L. 109-295 (enacted in 2006) allows US residents to transport up to a 90-day supply of qualified drugs from Canada to the US. Importation issues such as actual savings amounts, drug safety, and marketplace competition and pricing continue to be debated. Outlook for the Future HHS projects US prescription drug spending to increase from $234.1 billion in 2008 to $457.8 billion in 2019, almost doubling over the 11-year period. The average annual increase in drug spending from the previous year is projected to increase from 3.2% in 2008 to 5.2% in 2009 (reflecting growth in the use of prescription drugs per person, driven by an increase in the use of anti-viral drugs related to the H1N1 virus), and then rise to 7.3% in 2019 (reflecting increases in drugs prices, the number of new drug approvals, and the share of expensive specialty drugs). Drug spending as a percent of overall national health spending is projected to increase somewhat from 10.0% in 2008 to 10.2% in 2019.50 In the coming years, implementation of various provisions of PPACA will affect prescription drug coverage, utilization, prices, and regulation. Coverage and utilization of prescription drugs will be expanded by PPACA’s health insurance mandate and premium and cost-sharing subsidies; the designation of prescription drugs as an essential health benefit to be covered by private health plans through the new health benefit Exchanges and by Medicaid for newly eligible adults; and Medicare’s prescription drug rebate, cost-sharing, and catastrophic threshold changes. Prices charged to government programs will be affected by changes to Medicaid rebate requirements and expansions to the Section 340B program. Prescription drug regulation will be affected by the new process for licensure of biosimilar versions of brand name biological products and by drug labeling requirements. These and other PPACA changes will ultimately impact national spending for prescription drugs in ways yet to be seen.
NA. 8

1 All spending amounts in this report are in current dollars (i.e., not adjusted for inflation.) 2 Centers for Medicare & Medicaid Services, National Health Expenditure Accounts, Historical, http://www.cms.gov/NationalHealthExpendData/, accessed October 6, 2009. 3 Aaron Catlin et al., “National Health Spending In 2005: The Slowdown Continues, “Health Affairs 26, no. 1 (January/February 2007)142-153. 4 Aaron Catlin et al., “National Health Spending In 2006: A Year Of Change For Prescription Drugs,” Health Affairs 27, no. 1 (January/February 2008), 14-29. 5 Micah Hartman et al., “National Health Spending In 2007: Slower Drug Spending Contributes To Lowest Rate Of Overall Growth Since 1998,” Health Affairs 28, no. 1 (January/February 2009) 246-261. 6 Micah Hartman et al., “Health Spending Growth At A Historic Low In 2008,” Health Affairs 29, no. 1 (January 2010)147-155. 7 Kaiser Family Foundation calculations using data from IMS Health, http://www.imshealth.com (Press Room, US Top-Line Industry Data 2008), and Census Bureau, http;//www.census.gov. The per capita number may differ from the number reported at KFF’s website www.statehealthfacts.org because of differing data sources which use different retail pharmacy definitions (e.g., IMS Health includes mail order, Verispan does not). 8 Agency for Healthcare Research and Quality, Medical Expenditure Panel Survey Component Data, “Prescription Medicines – Mean and Median Expenses per Person With Expense and Distribution of Expenses by Source of Payment,” table 2, 1997 and 2007, http://www.meps.ahrq.gov/mepsweb/, accessed March 5, 2010. 9 Wolters Kluwer Pharma Solutions, Inc., Pharma Insight 2009: Patients take More Power Over Prescription Decisions (March 2010), http://www.wolterskluwerpharma.com/Press/Pharma%20Insight%202009%20-%20Media.pdf. 10 New England Healthcare Institute, Thinking Outside the Pillbox: A System-wide Approach to Improving Patient Medication Adherence for Chronic Disease (August 2009), http://www.nehi.net/publications/44/thinking_outside_the_pillbox_a_systemwide_approach_to_improving_patient_medication_adherence_for_chronic_disease. 11 Kaiser Family Foundation analysis of Consumer Price Index, All Urban Consumers, U.S. City Average, not seasonally adjusted, http://www.bls.gov/cpi/home.htm, accessed April 28, 2010. 12 Retail prescription prices reflect the prices paid by insured and uninsured patients, and do not reflect rebates, discounts, and other payments that in effect lower the cost of prescriptions. 13 National Association of Chain Drug Stores, “Industry Facts-at-a-Glance,” http://www.nacds.org (based on data from IMS Health), accessed March 8, 2010. 14 Ibid. 15 US Food and Drug Administration, http://www.fda.gov/Drugs/DevelopmentApprovalProcess/HowDrugsareDevelopedandApproved/DrugandBiologicApprovalReports/ucm121136.htm ; 2004-2009 data include new BLAs (biologic license applications) for therapeutic biologic products transferred from FDA’s Center for Biologics Evaluation and Research to its Center for Drug Evaluation and Research. 16 PhRMA, “R&D Investment by U.S. Biopharmaceutical Companies Remains Strong Despite Ongoing Economic Challenges,” March 16, 2010, http://www.phrma.org/news/news/rd_investment_us_biopharmaceutical_companies_remains_strong_despite_ongoing_economic_chall 17 US Food and Drug Administration, Center for Drug Evaluation and Research, “Generic Competition and Drug Prices,” http://www.fda.gov/AboutFDA/CentersOffices/CDER/ucm129385.htm, accessed March 12, 2010. 18 Generic Pharmaceutical Association, http://www.gphaonline.org/Content/NavigationMenu/AboutGenerics/Statistics/default.htm. 19 IMS Health, “IMS Forecasts Global Pharmaceutical Market Growth of 5-8% Annually Through 2014; Maintains Expectations of 4-6% Growth in 2010,” April 20, 2010, http://www.imshealth.com (Press Room, Press Releases). 20 Federal Trade Commission, “Pay-for-Delay: How Drug Company Pay-Offs Cost Consumers Billions,” January 2010, http://www.ftc.gov/os/2010/01/100112payfordelayrpt.pdf. 21 IMS Health, http://www.imshealth.com (Press Room, US Top-Line Industry Data 2009); Kaiser Family Foundation, Prescription Drug Trends, a chartbook, (July 2000), ex. 3.13, http://www.kff.org/rxdrugs/3019-index.cfm. The data on spending for advertising directed towards physicians excludes the retail value of drug samples left at sales visits to physicians’ offices, which totaled about $16 billion in 2004, the last year such data were available online from IMS Health. 22 IMS Health, “IMS Health Reports U.S. Prescription Sales Grew 5.1 Percent in 2009, to $300.3 Billion” (April 1, 2010), online at http://www.imshealth.com (Press Room, Press Releases). 23 IMS Health Press Release, ibid., April 20, 2010. 24 Fortune 500 online, http://money.cnn.com/magazines/fortune/fortune500/2009/performers/industries/profits/, and personal communication; April issues of Fortune magazine. 25 Kaiser Family Foundation, Kaiser Public Opinion Survey Brief, Economic Problems Facing Families (April 2008), p. 4, http://www.kff.org/kaiserpolls/upload/7773.pdf. 26 Kaiser Family Foundation, The Uninsured, A Primer (October 2009), p. 7, http://www.kff.org/uninsured/upload/7451-05.pdf, using Kaiser Commission on Medicaid and the Uninsured analysis of 2008 NHIS data. 27 Kaiser Family Foundation, Kaiser Health Tracking Poll (September 2009), http://www.kff.org/kaiserpolls/7990.cfm. 28 US Census Bureau, Income, Poverty and Health Insurance Coverage in the United States:2008 (September 2009), Table C-1, p. 59, http://www.census.gov/prod/2009pubs/p60-236.pdf. 29 Kaiser Family Foundation and Health Research and Educational Trust, Employer Health Benefits 2009 Annual Survey (September 2009), pp.37 and 55, http://ehbs.kff.org/pdf/2009/7936.pdf. 30 Ibid, p.170, http://ehbs.kff.org/pdf/2009/7936.pdf. 31 US Census Bureau, op. cit., p. 59. 32 America’s Health Insurance Plans, Center for Policy and Research, “Individual Health Insurance 2009 – A Comprehensive Survey of Premiums, Availability, and Benefits” (October 2009), http://www.ahipresearch.org/pdfs/2009IndividualMarketSurveyFinalReport.pdf. 33 Dana Gelb Safran et al., “Prescription Drug Coverage And Seniors: Findings From A 2003 National Survey,” Health Affairs, Web Exclusive (April 19, 2005): W5-160, http://www.kff.org/medicare/med041905pkg.cfm. 34 Kaiser Family Foundation, Medicare: A Primer (April 2010), p.8, http://www.kff.org/medicare/upload/7615-03.pdf. 35 See also Kaiser Family Foundation, Cost Containment Strategies For Prescription Drugs: Assessing The Evidence In the Literature (March 2005), http://www.kff.org/rxdrugs/loader.cfm?url=/commonspot/security/getfile.cfm&PageID=51885.
NA. 9
36 Kaiser Family Foundation and Health Research and Educational Trust, op. cit., Ex. 9.1, http://ehbs.kff.org/?page=charts&id=2&sn=24&ch=1136. 37 America’s Health Insurance Plans, Center for Policy and Research, Individual Health Insurance 2009: A Comprehensive Survey of Premiums, Availability, and Benefits (October 2009), http://www.ahipresearch.org/pdfs/2009IndividualMarketSurveyFinalReport.pdf. 38 Congressional Budget Office, Prices for Brand-Name Drugs Under Selected Federal Programs (June 2005), http://www.cbo.gov/ftpdocs/64xx/doc6481/06-16-PrescriptDrug.pdf. 39 http://www.hrsa.gov/opa/introduction.htm and Section 7101 of PPACA as modified by Sec. 2302 of HCERA. 40 Kaiser Commission on Medicaid and the Uninsured, Few Options for States to Control Medicaid Spending in a Declining Economy (April 2008), p. 3, http://www.kff.org/medicaid/upload/7769.pdf. 41 Kaiser Family Foundation calculations using data from Vernon Smith et al., The Crunch Continues: Medicaid Spending, Coverage and Policy in the Midst of a Recession: Results from a 50-State Medicaid Budget Survey for State Fiscal Years 2009 and 2010 (Kaiser Commission on Medicaid and the Uninsured, September 2009), p. 48, fig. 32, http://www.kff.org/medicaid/upload/7985.pdf. 42 Centers for Medicare and Medicaid Services, Office of the Actuary, National Health Statistics Group, at http://www.cms.hhs.gov/NationalHealthExpendData/. 43 Ibid. 44 Kaiser Family Foundation, Medicare Prescription Drug Plans in 2009 and Key Changes Since 2006: Summary of Findings (June 2009), http://www.kff.org/medicare/7917.cfm. 45 National Conference of State Legislatures, “Pharmaceutical Bulk Purchasing: Multi-state and Inter-agency Plans, 2008 edition” (Updated May 8, 2008), http://www.ncsl.org/programs/health/bulkrx.htm. 46 Devon Herrick, National Center for Policy Analysis, Shopping for Drugs: 2004, National Center for Policy Analysis, Policy Report No. 270 (October 2004), http://www.ncpa.org/pub/st/st270. 47US mail services sales have increased 54% since 2003, though their share of total US prescription sales has increased only slightly -- 2007: $44.6 billion in sales, 16% of total prescription sales; 2003: $28.9 billion in sales, 13% of total prescription sales. IMS Health, http://www.imshealth.com (About Us, Press Room, US Top-Line Industry Data, 2007 U.S). 48 Kaiser Family Foundation, Prescription Drugs: Advertising, Out-of-Pocket Costs, and Patient Safety from the Perspective of Doctors and Pharmacists (November 2006), http://www.kff.org/kaiserpolls/upload/7583.pdf. 49 US Department of Health and Human Services Task Force on Drug Importation, Report on Prescription Drug Importation (December 2004), ix, http://www.hhs.gov/importtaskforce/Report1220.pdf. 50 Christopher J. Truffer et al., ”Health Spending Projections Through 2019: The Recession’s Impact Continues,” Health Affairs 29, no.3 (March 2010), 522-529. For More Information: In addition to the Kaiser Family Foundation reports found in the Endnotes above, this Fact Sheet (#3057-08) and the following reports are available on the Foundation’s website at http://www.kff.org: Trends and Indicators in the Changing Health Care Marketplace (#7031), Prescription Drug Trends—A Chartbook Update (#3112), Cost Containment Strategies for Prescription Drugs: Assessing the Evidence in the Literature (#7295), Follow the Pill: Understanding the U.S. Commercial Pharmaceutical Supply Chain (#7296), Medicare Prescription Drug Benefit Fact Sheet (#7044-10), Medicare Payments and Beneficiary Costs for Prescription Drug Coverage (#7620), several Data Spotlights on the Medicare Part D drug benefit, Explaining Health Care Reform: Key Changes to the Medicare Part D Drug Benefit Coverage Gap (#8059), Federal Policies Affecting the Cost and Availability of New Pharmaceuticals (#3254), Views on Prescription Drugs & the Pharmaceutical Industry, Public and Physician Views of Direct-to-Consumer Prescription Drug Advertising. See also http://www.statehealthfacts.org for state-specific prescription drug utilization and sales (under Health Costs & Budgets); http://www.kaiserEDU.org (Prescription Drugs) for a Tutorial, Issue Modules, and SmartLinks on prescription drugs; and http://facts.kff.org/ (search for Prescription Drugs) for Fast Facts about prescription drugs.
Prepared by Janet Lundy of the Kaiser Family Foundation.
This publication (#3057-08) is available on the Kaiser Family Foundation’s website at www.kff.org.
NA. 10

NA. 11

NA. 12

NA. 13
NA. 14

pment, technicalrole in the health
Rural Pharmacy and Prescription Drugs Introduction - Rural Assistance C... http://www.raconline.org/topics/pharmacy-and-prescription-drugs/
1 of 1 9/3/2013 5:20 PM
NA. 15
Share on:
Share on:
Brand-name vs. Generic Drugs: Is One Better Than the Other?
February 3, 2012
Dear Mayo Clinic:
If a generic drug really is the same thing as the brand-name version, why are generic drugs so much cheaper? How do I find out if a generic form is available for
some of my medications?
Answer:
The active ingredients in generic drugs are the same as in brand-name drugs. However, they may look different or have different inactive ingredients, such as fillers or
coloring agents. Generic drugs approved by the Food and Drug Administration (FDA) must meet the same rigid standards of strength, quality and purity that are
applied to brand-name drugs. For example, they must be manufactured in a way that's approved by the FDA. In addition, it must be shown that a generic drug
provides an identical or nearly identical blood level of the drug compared to the brand version. In short, every type of regulation that's applied to brand-name drugs by
the FDA is also applied to FDA-approved generic drugs.
Still, myths persist that generic drugs are significantly different from brand-name drugs. If you stick to buying a brand-name drug because you feel that a generic isn't
the same, you're likely spending more money than is necessary.
Generic drugs are less expensive because the companies that make them don't need to spend money on drug research and development, clinical trials, marketing,
and advertising — as do brand-name drug manufacturers. These costs can run into the hundreds of millions of dollars for a single drug.
Once patents and exclusive sales rights of a brand-name drug have expired, generic drugs can begin to enter the market. A generic drug manufacturer needs only to
understand the known chemistry of a brand drug, and then develop a method for manufacturing a product that meets FDA standards.
That said, it can take decades for a brand-name drug to become available as a generic. The initial patent life of a new drug is 20 years, but a patent can be obtained
at any point in the drug-development stage. If a patent is obtained early, research and development time may eat up a decade or more of patent life before the FDA
approves the drug for use. A patent obtained later in the development process may buy more time for the drug to be sold under patent protection.
Beyond the initial patent time, patent extensions of up to five years may be granted if FDA regulatory delays slow the process of bringing the drug to market. In
addition, studying a drug for pediatric use may add six months to the patent extension, even if the drug is never used for children.
After FDA approval of a drug, the FDA may allow a drug company to remain the exclusive seller. Exclusive seller extensions lasting months to years may be added
for a number of reasons. The goal of these extensions is to find a balance between consumer-friendly pricing and offering drug companies enough profit incentive to
continue to invest in research.
The FDA frequently grants a six-month period of exclusive marketing rights to the first generic manufacturer of a brand name drug. Typically, the price of that first
generic is about 6 percent lower than the brand-name. If the initial generic is widely used, chances are good that several other generic manufacturers will enter the
arena and the price usually drops substantially.
When two or more generic manufacturers make a drug, the price of the generic drug is often about 50 to 95 percent less than the cost of the brand-name drug. The
extent of the price drop usually depends on how many manufacturers make the drug and how difficult the drug is to make.
Often state laws and insurance copay rules — not to mention the vigilance of doctors and pharmacists — can alert you or even prevent you from buying a
brand-name drug when a less expensive generic alternative is available. Medicare Part D insurance plans report that when a generic drug is available, it's dispensed
89 percent of the time on average over the brand-name equivalent. However, your doctor can still prescribe a brand-name drug over a generic, if necessary.
Even with this level of consumer protection, it doesn't hurt to ask your doctor or pharmacist if there's a generic alternative to any name brand drug you're taking. Tell
your doctor that you're willing to work together on an ongoing basis to identify medications that meet your health needs but aren't necessarily the latest, heavily
marketed brand-name drugs on the market.
— Lisa Buss Preszler, Pharm.D., R.Ph., Mayo Clinic, Rochester, Minn.
Brand-name vs. Generic Drugs: Is One Better Than the Other? http://www.mayoclinic.org/medical-edge-newspaper-2012/feb-03b.html
1 of 2 9/3/2013 5:25 PM
NA. 16
FACT: FDA requires generic drugs to have the same quality and performance as brand name drugs.
When a generic drug product is approved, it has met rigorous standards established by the FDA with respect to identity, strength, quality, purity, and potency. However, some variability can and does occur during manufacturing, for both brand name and generic drugs. When a drug, generic or brand name, is mass-produced, very small variations in purity, size, strength, and other parameters are permitted. FDA limits how much variability is acceptable.
Generic drugs are required to have the same active ingredient, strength, dosage form, and route of administration as the brand name product. Generic drugs do not need to contain the same inactive ingredients as the brand name product.
The generic drug manufacturer must prove its drug is the same as (bioequivalent) the brand name drug. For example, after the patient takes the generic drug, the amount of drug in the bloodstream is measured. If the levels of the drug in the bloodstream are the same as the levels found when the brand name product is used, the generic drug will work the same.
Through review of bioequivalence data, FDA ensures that the generic product performs the same as its respective brand name product. This standard applies to all generic drugs, whether immediate or controlled release.
All generic manufacturing, packaging, and testing sites must pass the same quality standards as those of brand name drugs, and the generic products must meet the same exacting specifications as any brand name product. In fact, many generic drugs are made in the same manufacturing plants as brand name drug products.
FACT: Research shows that generics work just as well as brand name drugs.
A study evaluated the results of 38 published clinical trials that compared cardiovascular generic drugs to their brand name counterparts. There was no evidence that brand name heart drugs worked any better than generic heart drugs.[1]
FACT: FDA does not allow a 45 percent difference in the effectiveness of the generic drug product.
FDA recently evaluated 2,070 human studies conducted between 1996 and 2007. These studies compared the absorption of brand name and generic drugs into a person’s body. These studies were submitted to FDA to support approval of generics. The average difference in absorption into the body between the generic and the brand name was 3.5 percent[2]. Some generics were absorbed slightly more, some slightly less. This amount of difference would be expected and acceptable, whether for one batch of brand name drug tested against another batch of the same brand, or for a generic tested against a brand name drug. In fact, there have been studies in which brand name drugs were compared with themselves as well as with a generic. As a rule, the difference for the generic-to-brand comparison was about the same as the brand-to-brand comparison.
Any generic drug modeled after a single, brand name drug must perform approximately the same in the body as the brand name drug. There will always be a slight, but not medically important, level of natural variability – just as there is for one batch of brand name drug compared to the next batch of brand name product.
FACT: When it comes to price, there is a big difference between generic and brand name drugs. On average, the cost of a generic drug is 80 to 85 percent lower than the brand name product.
In 2010 alone, the use of FDA-approved generics saved $158 billion, an average of $3 billion every week.[3]
FACT: Cheaper does not mean lower quality.
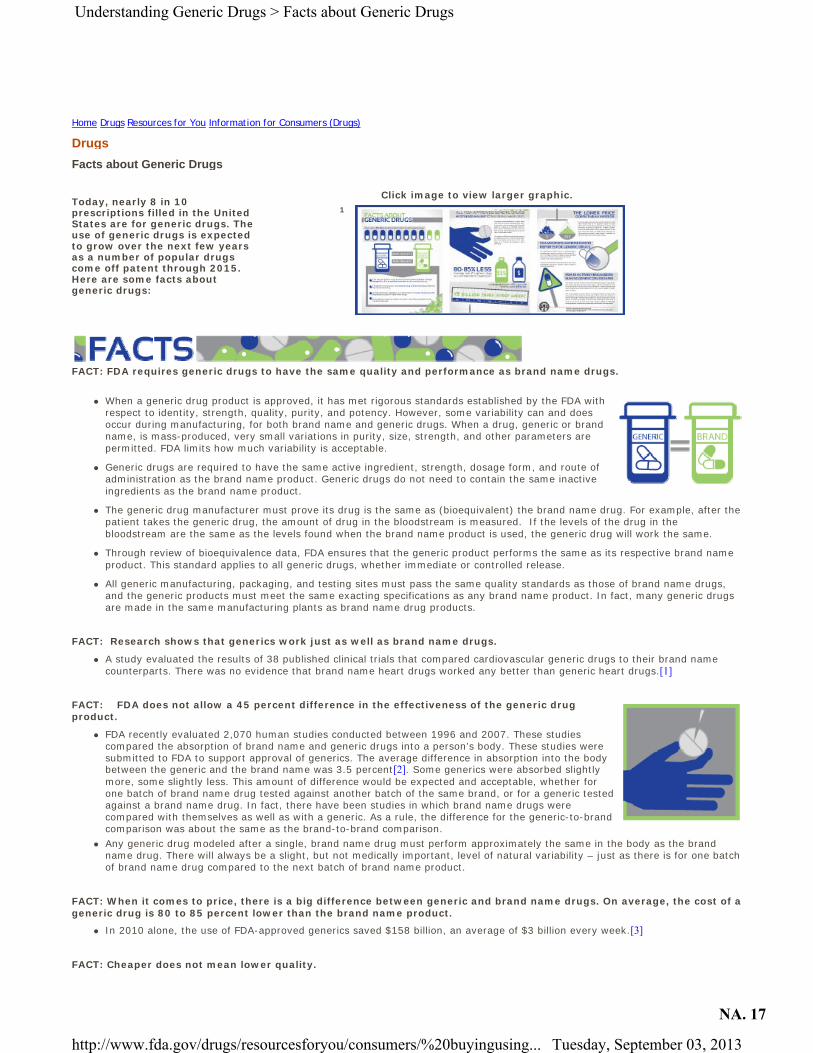
Facts about Generic Drugs
Today, nearly 8 in 10 prescriptions filled in the United States are for generic drugs. The use of generic drugs is expected to grow over the next few years as a number of popular drugs come off patent through 2015. Here are some facts about generic drugs:
Click image to view larger graphic. 1
Drugs
Home Drugs Resources for You Information for Consumers (Drugs)
Understanding Generic Drugs > Facts about Generic Drugs
Tuesday, September 03, 2013http://www.fda.gov/drugs/resourcesforyou/consumers/%20buyingusing...
NA. 17

Page Last Updated: 09/19/2012 Note: If you need help accessing information in different file formats, see Instructions for Downloading Viewers and Players.
Accessibility Contact FDA Careers FDA Basics FOIA No Fear Act Site Map Transparency Website Policies
U.S. Food and Drug Administration 10903 New Hampshire Avenue Silver Spring, MD 20993 Ph. 1-888-INFO-FDA (1-888-463-6332) Email FDA
For Government For Press Combination Products Advisory Committees Science & Research Regulatory Information Safety Emergency Preparedness International Programs News & Events Training and Continuing Education Inspections/Compliance State & Local Officials Consumers Industry Health Professionals FDA Archive
1. /Drugs/ResourcesForYou/Consumers/BuyingUsingMedicineSafely/UnderstandingGenericDrugs/ucm305896.htm
Generic manufacturers are able to sell their products for lower prices because they are not required to repeat the costly clinical trials of new drugs and generally do not pay for costly advertising, marketing, and promotion. In addition, multiple generic companies are often approved to market a single product; this creates competition in the market place, often resulting in lower prices.
FACT: FDA monitors adverse events reports for generic drugs.
The monitoring of adverse events for all drug products, including generic drugs, is one aspect of the overall FDA effort to evaluate the safety of drugs after approval. Many times, reports of adverse events describe a known reaction to the active drug ingredient.
Reports are monitored and investigated, when appropriate. The investigations may lead to changes in how a product (brand name and generic counterparts) is used or manufactured.
FACT: FDA is actively engaged in making all regulated products – including generic drugs – safer.
FDA is aware that there are reports noting that some people may experience an undesired effect when switching from brand name drug to a generic formulation or from one generic drug to another generic drug. FDA wants to understand what may cause problems with certain formulations if, in fact, they are linked to specific generic products.
FDA is encouraging the generic industry to investigate whether, and under what circumstances, such problems occur. The Agency does not have the resources to perform independent clinical studies and lacks the regulatory authority to require industry to conduct such studies. FDA will continue to investigate these reports to ensure that it has all the facts about these treatment failures and will make recommendations to healthcare professionals and the public if the need arises.
[1] Kesselheim et al. Clinical equivalence of generic and brand name drugs used in cardiovascular disease: a systematic review and meta-analysis. JAMA. 2008;300(21)2514-2526 [2] Davit et al. Comparing generic and innovator drugs: a review of 12 years of bioequivalence data from the United States Food and Drug Administration. Ann Pharmacother. 2009;43(10):1583-97. [3] SAVINGS An Economic Analysis of Generic Drug Usage in the U.S., GPhA, September 2011, page 1.
Links on this page:
Understanding Generic Drugs > Facts about Generic Drugs
Tuesday, September 03, 2013http://www.fda.gov/drugs/resourcesforyou/consumers/%20buyingusing...
NA. 18

Prepared for The Kaiser Family Foundation by:
The Health Strategies Consultancy LLC
March 2005
Follow The Pill:Understanding the U.S. Commercial Pharmaceutical Supply Chain
NA. 19

Table of Contents
I. Executive Summary
II. The Flow of Goods from Manufacturers to Consumers in the U.S.
Pharmaceutical Supply Chain Pharmaceutical Manufacturers Wholesale Distributors Pharmacies Pharmacy Benefit Managers (PBMs)
III. The Flow of Money and Key Financial Relationships in the U.S. Pharmaceutical Supply Chain
Pharmaceutical Manufacturers Wholesale Distributors Pharmacies Pharmacy Benefit Managers (PBMs)
IV. Conclusion
V. Appendix
A. Special Pricing Rules Applicable to Federal Programs Medicaid
Department of Veteran Affairs, Department of Defense, Public Health Service, Coast Guard
Section 340B Drug Pricing Program
B. Other Stakeholders in the U.S. Commercial Supply Chain Physicians Large Employers Health Plans
VI. Key Acronyms and Glossary of Key Terms
NA. 20

I. Executive Summary The pharmaceutical supply chain is the means through which prescription medicines are delivered to patients. Pharmaceuticals originate in manufacturing sites; are transferred to wholesale distributors; stocked at retail, mail-order, and other types of pharmacies; subject to price negotiations and processed through quality and utilization management screens by pharmacy benefit management companies (PBMs); dispensed by pharmacies; and ultimately delivered to and taken by patients. There are many variations on this basic structure, as the players in the supply chain are constantly evolving, and commercial relationships vary considerably by geography, type of medication, and other factors. The intent of this paper is to demystify the U.S. pharmaceutical supply chain. The first section of the paper describes each of the key players (i.e., industry segments) involved in the process of supplying prescription drugs to consumers. The section begins with a discussion of what each player does and the role that it plays in the flow of pharmaceuticals from manufacturer to patient. The second section of the paper describes the financial relationships between each of these key players and how the dollars flow between and among the segments, including the consumer. Highlights from this paper about the key players and their financial relationships include: Pharmaceutical Manufacturers:
• A relatively few large, multinational firms comprise the bulk of the brand pharmaceutical manufacturing industry today – the 10 largest pharmaceutical corporations, as measured by U.S. sales, accounted for almost 60 percent of total U.S. sales in 2004.
• Pharmaceutical manufacturers have the most influence over pharmaceutical prices, assessing expected demand, future competition, and projected marketing costs to establish the wholesale acquisition cost (WAC), which is the baseline price at which wholesale distributors purchase drug products. Discounts and rebates may be applied, based on market share, volume, and prompt payment.
Wholesale Distributors:
• The wholesale distribution industry has consolidated in the last 30 years, with the number of wholesale distributors in the U.S. declining from approximately 200 in 1975 to fewer than 50 in 2000. The top 3 wholesale distributors account for almost 90 percent of the wholesale market.
• Wholesale distributors typically sell drugs to pharmacies at WAC plus some negotiated percentage. They may facilitate discounts negotiated between manufacturers and other customers.
Pharmacies:
• Although comprising a small overall percentage of total prescriptions filled (approximately 6.1 percent in 2004), mail-order pharmacy sales were the fastest-growing sector of the U.S. prescription drug retail market in 2004, increasing by 18 percent over the previous year.
NA. 21

• Pharmacies may negotiate with manufacturers or wholesalers for discounts and rebates based on volume sales or market share, and they may negotiate with PBMs for inclusion in their networks and for their reimbursement (drug cost plus dispensing fee).
Pharmacy Benefit Managers (PBMs):
• Approximately two-thirds of all prescriptions written in the U.S. are processed by a PBM.
• PBMs may achieve savings for their customers by negotiating discounts and through cost containment programs, including use of formularies and cost sharing.
The Appendix briefly describes: (A) special pricing rules applicable to Medicaid and some other federal programs, and (B) the roles physicians, large employers, and health plans have in the pharmaceutical supply chain. The pharmaceutical supply system is complex, and involves multiple organizations that play differing but sometimes overlapping roles in drug distribution and contracting. This complexity results in considerable price variability across different types of consumers, and the supply chain is not well understood by patients or policymakers. Increased understanding of these issues on the part of policymakers should assist in making rational policy decisions for the Medicare and Medicaid programs.
NA. 22
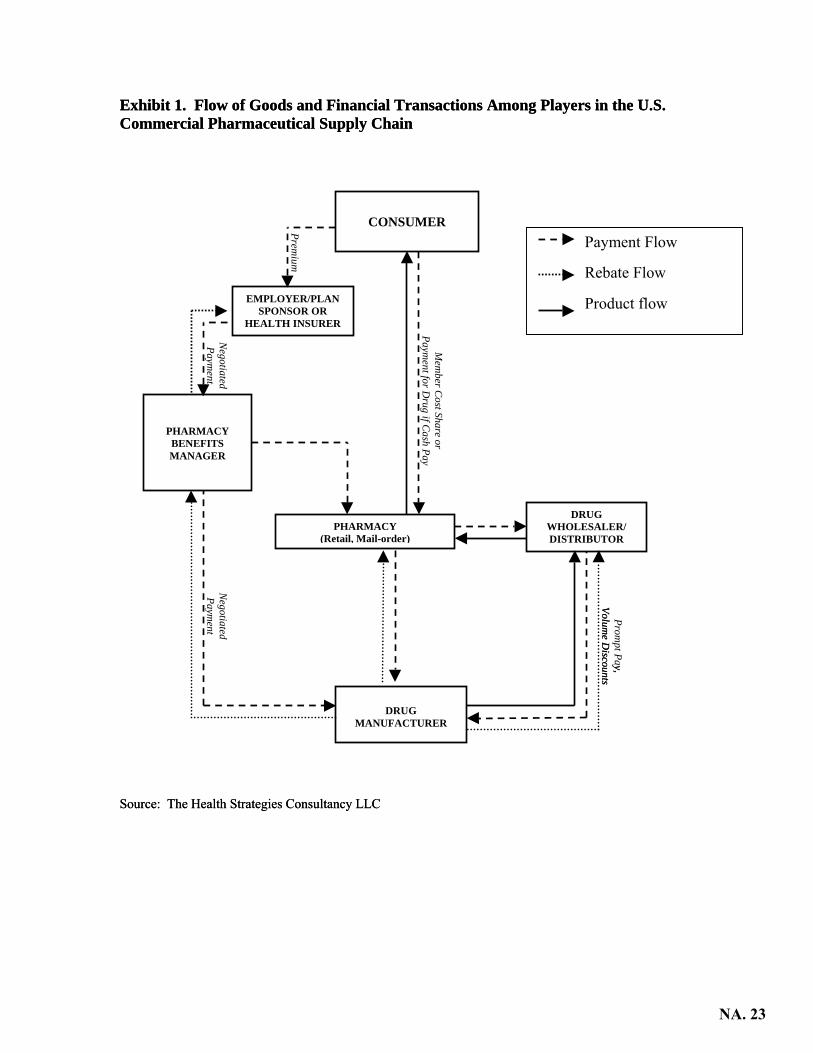
Exhibit 1. Flow of Goods and Financial Transactions Among Players in the U.S. Commercial Pharmaceutical Supply Chain Exhibit 1. Flow of Goods and Financial Transactions Among Players in the U.S. Commercial Pharmaceutical Supply Chain
Negotiated Paym
ent
Premium
Mem
ber Cost Share or
Payment for D
rug if Cash Pay
Negotiated Paym
ent
(
PHARMACY BENEFITS MANAGER
EMPLOYER/PLAN SPONSOR OR
HEALTH INSURER
DRUG WHOLESALER/ DISTRIBUTOR
CONSUMER Payment Flow
Rebate Flow
Product flow
Source: The Health Strategies ConsulSource: The Health Strategies Consul
PHARMACY Retail, Mail-order)
Prompt Pay,
Volume D
iscountsy,
Volume D
iscounts
DRUG
MANUFACTURER
tancy LLCtancy LLC
NA. 23

II. The Flow of Goods from Manufacturers to Consumers in the U.S. Pharmaceutical Supply Chain
Pharmaceutical Manufacturers
Manufacturers are the source of the prescription drugs in the pharmaceutical supply chain. The pharmaceutical manufacturing industry is composed of two distinct business models: manufacturers of brand-name drugs (e.g., Pfizer, Merck, and Novartis) and manufacturers of generic drugs (e.g., Mylan, Roxane, and Barr). There are a few pharmaceutical companies that participate in both the branded and generic parts of the industry, and both models focus on the manufacturing and packaging of pharmaceutical products, but there are other important differences. Most brand manufacturers devote a portion of their expenses to the scientific research and development of new drug therapies. Generic drug manufacturers typically do not develop new drug therapies, but instead manufacture generic compounds that compete directly with the original branded version of a drug once the brand product’s patent protection has expired. Manufacturers manage the actual distribution of drugs from manufacturing facilities to drug wholesalers, and in some cases, directly to retail pharmacy chains, mail-order and specialty pharmacies, hospital chains, and some health plans. Manufacturers may also distribute products directly to government purchasers, such as the Veterans Administration, AIDS Drug Assistance Programs (ADAPs), and Vaccines for Children (VFC), which typically receive the largest price discounts. In a few rare cases, a manufacturer may distribute drugs directly to a self-insured employer with an on-site pharmacy, but the typical employer-sponsored plan does not follow this path. Wholesale distributors are the manufacturers’ largest purchasers. Very few drugs are distributed directly to consumers. At the most basic economic level, a pharmaceutical manufacturer supplies a quantity of its products that is equal to the demand for its products from consumers/patients (of course, consumer demand in this market is expressed through the medium of a prescribing physician or other licensed health care provider). Manufacturers also play roles in stimulating demand for drug products through underwriting clinical studies designed to demonstrate the value proposition of pharmaceutical treatments compared to one another or compared to no clinical treatment at all; by engaging in the promotion and marketing of products to health care providers (including health plans and PBMs) and direct-to-consumer advertising; and by administering patient assistance programs that provide the firm’s products at nominal cost to low-income consumers. Manufacturers also play an important role in ensuring the safety of the pharmaceutical supply chain by producing informational labeling for prescribers and consumers that is consistent with the terms and conditions of a drug’s approval by the U.S. Food and Drug Administration (FDA), and by using electronic bar-coding technology on drug packaging that may be used to track individual production lots, and to prevent prescribing errors.
NA. 24

Overview of Pharmaceutical Manufacturing Industry Pharmaceutical manufacturing is a large global industry. In 2003, worldwide pharmaceutical industry sales totaled $491.8 billion, an increase in sales volume of 9 percent over the preceding year.1 The U.S. represents the largest single national market for pharmaceuticals, accounting for 44 percent of global industry sales in 2003, or a total of $216.4 billion, which was an increase of approximately 12 percent from the previous year’s figure.2
After a decade of significant mergers and acquisitions by drug companies, a relatively few large, multinational firms comprise the bulk of the brand pharmaceutical manufacturing industry today. The ten largest pharmaceutical corporations, as measured by U.S. sales, accounted for almost 60 percent of total U.S. sales in 2004: Exhibit 2. Top 10 Pharmaceutical Corporations by U.S. Sales, 2004
Rank Corporation U.S. Sales
($ Billions) % Growth Over
Previous Year % Market
Share 1 Pfizer $30.7 5 13.1 2 GlaxoSmithKline 18.8 1 8.0 3 Johnson & Johnson 16.2 7 6.9 4 Merck & Co. 15.0 8 6.4 5 AstraZeneca 11.3 12 4.8 6 Novartis 10.2 7 4.3 7 Sanofi-Aventis 10.0 13 4.3 8 Amgen 9.5 23 4.1 9 Bristol-Myers Squibb 9.2 -4 3.9
10 Wyeth 8.2 11 3.5 Total, Top 10 139.1 -- 59.3
Source: IMS Health, IMS National Sales Perspectives,TM February 2005, accessed 2/28/05 at http://www.imshealth.com/ims/portal/front/articleC/0,2777,6599_49695983_69891374,00.html
1IMS Health, “Bruised But Triumphant,” Medical Marketing and Media, May 2004, accessed at http://www.imshealth.com/vgn/images/portal/cit_40000873/23/12/55250930BruisedTriumphant081804.pdf 2IMS Health, “IMS Reports 11.5 Percent Dollar Growth in '03 U.S. Prescription Sales,” February 17, 2004, accessed at http://www.imshealth.com/ims/portal/front/articleC/0,2777,6599_3665_44771558,00.html. Prescription sales figures reported by IMS Health represent manufacturer prices.
NA. 25

When measured by prescription volume, the “top 10” list is similar but not identical, as a few generic drug manufacturers appear on the list: Exhibit 3. Top 10 Pharmaceutical Corporations by Total U.S. Dispensed Prescriptions, 2004
Rank Corporation U.S. Prescriptions
(Millions) % Growth Over
Previous Year % Market
Share 1 Pfizer 360.7 -4 10.2 2 Novartis 225.5 -2 6.4 3 Teva* 221.2 7 6.3 4 Mylan Labs* 215.2 4 6.1 5 Watson* 175.6 7 5.0 6 GlaxoSmithKline 138.8 -13 3.9 7 Merck & Co. 129.5 3 3.7 8 AstraZeneca 100.4 11 2.9 9 Johnson & Johnson 95.6 -9 2.7
10 Abbott 91.5 -4 2.6 Total, Top 10 1754.0. 49.8
* Generic drug manufacturers Source: IMS Health, National Prescription AuditTMPlus, January 2005, accessed 2/28/05 at http://www.imshealth.com/ims/portal/front/articleC/0,2777,6599_49695974_68913574,00.html Exhibit 4 provides a description of the generic pharmaceutical market: Exhibit 4. Top 10 Generic Manufacturers by Total Global Sales, 2003
Rank Corporation Global Sales($ Millions)
% Growth Over Previous Year
1 Sandoz $4,004.0 2 Teva Pharmaceutical Industries Limited 3,276.4 30.1 3 IVAX Corporation 1,420.3 18.6 4 Mylan Laboratories Inc. 1,269.2 15.0 5 Alpharma Inc. 1,297.3 4.8 6 Andrx Corporation 1,046.3 35.7 7 Barr Pharmaceuticals, Inc. 902.9 -24.1 8 Par Pharmaceutical Companies, Inc. 661.7 73.4 9 American Pharmaceutical Partners, Inc. 351.3 26.6
10 Eon Labs, Inc. 329.5 34.9 Source: Hoover’s, Inc. Hoover’s Online, accessed 1/03/2005. To convey the size of the pharmaceutical manufacturing industry from the perspective of individual products, the following tables present data on the biggest selling pharmaceutical products in the United States in 2004, measured by prescriptions dispensed and by sales in dollars. Exhibits 5 and 6 are for individual drug products, while Exhibits 7 and 8 are for broader therapeutic classes of drugs.
NA. 26

Exhibit 5. Top 10 Products by Total U.S. Dispensed Prescriptions, 2004 Rank Product Manufacturer Prescriptions
(Millions) % Growth
Over Previous Year
% Market Share
1 Lipitor Pfizer 74.8 9 2.1 2 HYCD/APAP Mallinckrodt 49.5 12 1.4 3 Synthroid Abbott 47.4 -5 1.3 4 Norvasc Pfizer 38.3 5 1.1 5 Toprol-XL AstraZeneca 35.0 18 1.0 6 Zoloft Pfizer 33.1 1 0.9 7 Zocor Merck 29.6 1 0.8 8 HYCD/APAP Watson 29.0 -2 0.8 9 Albuterol Warrick 26.8 0 0.8
10 Amoxicillin Teva 26.2 -5 0.7 Source: IMS Health, National Prescription AuditTMPlus, January 2005, accessed 2/28/05 at http://www.imshealth.com/ims/portal/front/articleC/0,2777,6599_49695974_68913594,00.html Exhibit 6. Top 10 Products by U.S. Sales, 2004
Rank Product Manufacturer U.S. Sales ($ Billions)
% Growth Over Previous
Year
% Market Share
1 Lipitor Pfizer $7.7 14 3.3 2 Zocor Merck 4.6 4 1.9 3 Prevacid TAP 3.8 -5 1.6 4 Nexium AstraZeneca 3.8 23 1.6 5 Procrit Ortho Biotech 3.2 -3 1.4 6 Zoloft Pfizer 3.1 8 1.3 7 Epogen Amgen 3.0 -4 1.3 8 Plavix Sanofi-Synthelabo 3.0 33 1.3 9 Advair Diskus GlaxoSmithKline 2.9 26 1.2
10 Zyprexa Eli Lilly 2.8 -10 1.2 Source: IMS Health, IMS National Sales Perspectives,TM February 2005, accessed 2-28-05 at http://www.imshealth.com/ims/portal/front/articleC/0,2777,6599_49695983_69890133,00.html Exhibit 7. Top 10 Therapeutic Classes by Total U.S. Dispensed Prescriptions, 2004
Rank Therapeutic Class Total Prescriptions
(Millions)
% Growth over Previous
Year
% Market Share
1 Codeine 157.6 5 4.5 2 SSRIs/SNRIs 147.4 4 4.2 3 ACE Inhibitors 143.8 5 4.1 4 HMG-COA Reductase Inhibitors (Statins) 139.8 11 4.0 5 Beta Blockers 120.6 7 3.4 6 Proton Pump Inhibitors 93.1 -2 2.6 7 Thyroid Hormone, Synthetic 90.0 6 2.6 8 Calcium Blockers 88.4 0 2.5 9 Seizure Disorders 84.8 7 2.4
10 Oral Contraceptives 82.5 -3 2.3 Source: IMS Health, National Prescription AuditTMPlus, January 2005, accessed 2/28/05 at http://www.imshealth.com/ims/portal/front/articleC/0,2777,6599_49695974_68914714,00.html
NA. 27
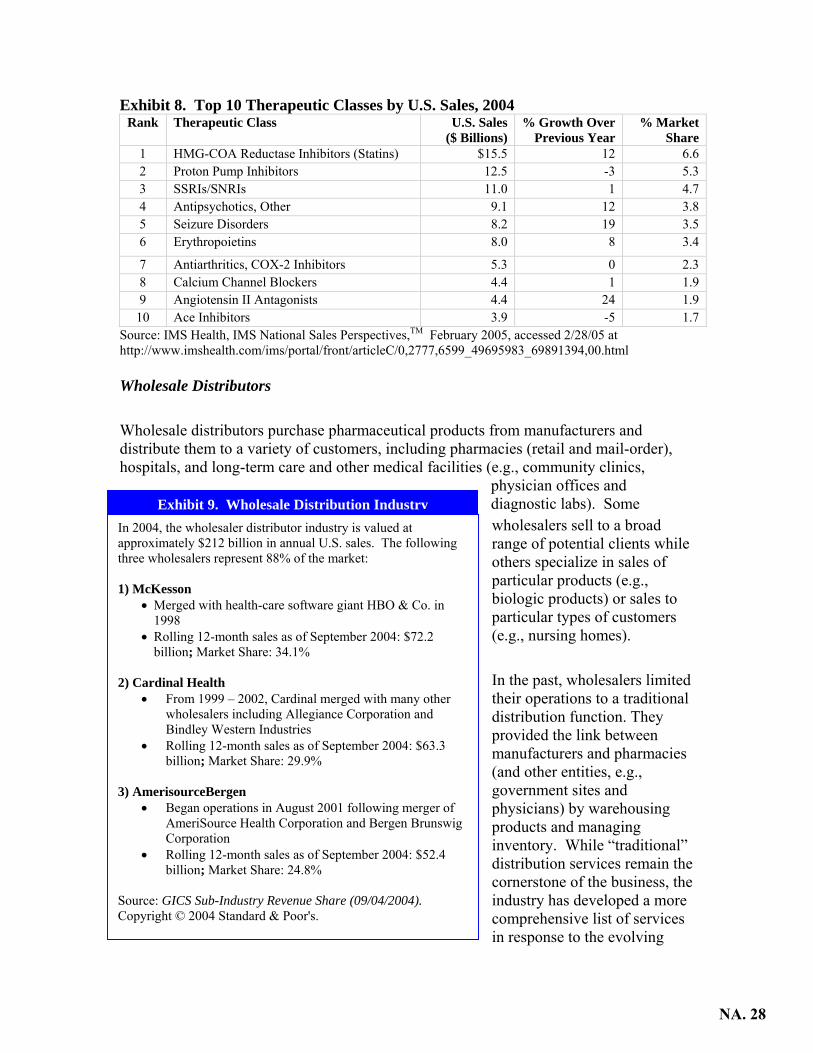
Exhibit 8. Top 10 Therapeutic Classes by U.S. Sales, 2004 Rank Therapeutic Class U.S. Sales
($ Billions) % Growth Over
Previous Year % Market
Share 1 HMG-COA Reductase Inhibitors (Statins) $15.5 12 6.6 2 Proton Pump Inhibitors 12.5 -3 5.3 3 SSRIs/SNRIs 11.0 1 4.7 4 Antipsychotics, Other 9.1 12 3.8 5 Seizure Disorders 8.2 19 3.5 6 Erythropoietins 8.0 8 3.4
7 Antiarthritics, COX-2 Inhibitors 5.3 0 2.3 8 Calcium Channel Blockers 4.4 1 1.9 9 Angiotensin II Antagonists 4.4 24 1.9
10 Ace Inhibitors 3.9 -5 1.7 Source: IMS Health, IMS National Sales Perspectives,TM February 2005, accessed 2/28/05 at http://www.imshealth.com/ims/portal/front/articleC/0,2777,6599_49695983_69891394,00.html Wholesale Distributors
Wholesale distributors purchase pharmaceutical products from manufacturers and distribute them to a variety of customers, including pharmacies (retail and mail-order), hospitals, and long-term care and other medical facilities (e.g., community clinics,
physician offices and diagnostic labs). Some wholesalers sell to a broad range of potential clients while others specialize in sales of particular products (e.g., biologic products) or sales to particular types of customers (e.g., nursing homes).
In the past, wholesalers limited their operations to a traditional distribution function. They provided the link between manufacturers and pharmacies (and other entities, e.g., government sites and physicians) by warehousing products and managing inventory. While “traditional” distribution services remain the cornerstone of the business, the industry has developed a more comprehensive list of services
In 2004, the wholesaler distributor industry is valued at approximately $212 billion in annual U.S. sales. The following three wholesalers represent 88% of the market: 1) McKesson
• Merged with health-care software giant HBO & Co. in 1998
• Rolling 12-month sales as of September 2004: $72.2 billion; Market Share: 34.1%
2) Cardinal Health
• From 1999 – 2002, Cardinal merged with many other wholesalers including Allegiance Corporation and Bindley Western Industries
• Rolling 12-month sales as of September 2004: $63.3 billion; Market Share: 29.9%
3) AmerisourceBergen
• Began operations in August 2001 following merger of AmeriSource Health Corporation and Bergen Brunswig Corporation
• Rolling 12-month sales as of September 2004: $52.4 billion; Market Share: 24.8%
Source: GICS Sub-Industry Revenue Share (09/04/2004). Copyright © 2004 Standard & Poor's.
Exhibit 9. Wholesale Distribution Industry
in response to the evolving
NA. 28
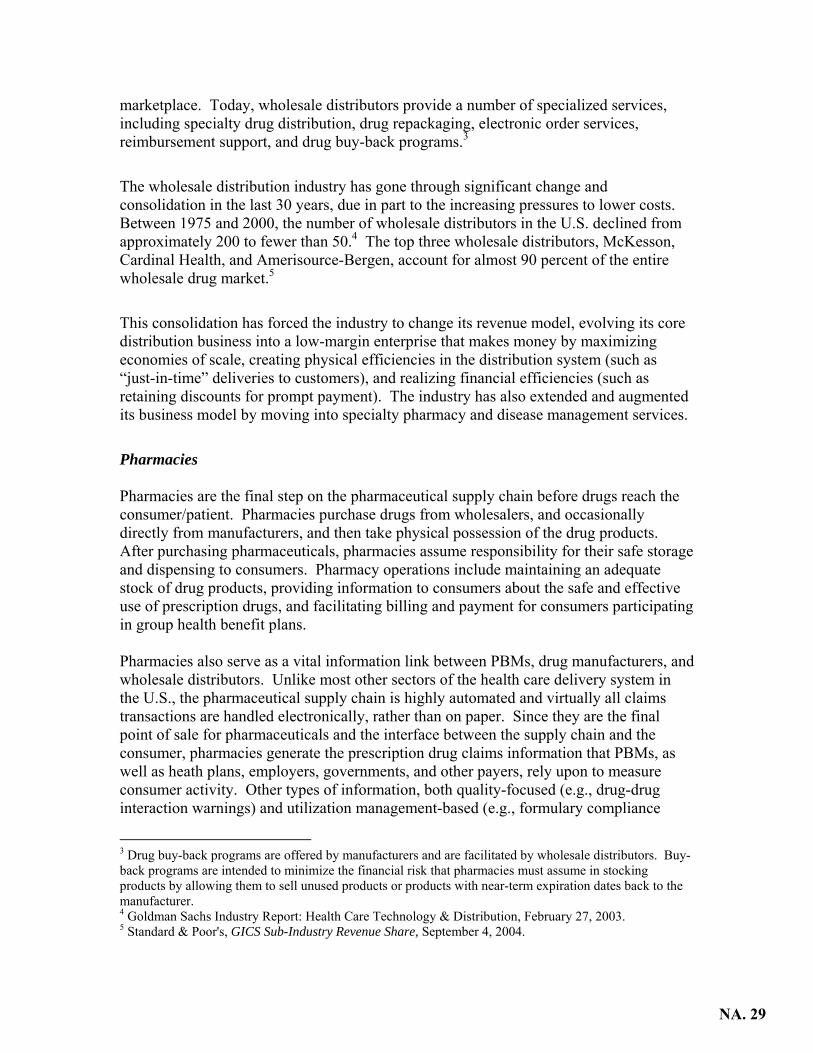
marketplace. Today, wholesale distributors provide a number of specialized services, including specialty drug distribution, drug repackaging, electronic order services, reimbursement support, and drug buy-back programs.3
The wholesale distribution industry has gone through significant change and consolidation in the last 30 years, due in part to the increasing pressures to lower costs. Between 1975 and 2000, the number of wholesale distributors in the U.S. declined from approximately 200 to fewer than 50.4 The top three wholesale distributors, McKesson, Cardinal Health, and Amerisource-Bergen, account for almost 90 percent of the entire wholesale drug market.5
This consolidation has forced the industry to change its revenue model, evolving its core distribution business into a low-margin enterprise that makes money by maximizing economies of scale, creating physical efficiencies in the distribution system (such as “just-in-time” deliveries to customers), and realizing financial efficiencies (such as retaining discounts for prompt payment). The industry has also extended and augmented its business model by moving into specialty pharmacy and disease management services.
Pharmacies Pharmacies are the final step on the pharmaceutical supply chain before drugs reach the consumer/patient. Pharmacies purchase drugs from wholesalers, and occasionally directly from manufacturers, and then take physical possession of the drug products. After purchasing pharmaceuticals, pharmacies assume responsibility for their safe storage and dispensing to consumers. Pharmacy operations include maintaining an adequate stock of drug products, providing information to consumers about the safe and effective use of prescription drugs, and facilitating billing and payment for consumers participating in group health benefit plans. Pharmacies also serve as a vital information link between PBMs, drug manufacturers, and wholesale distributors. Unlike most other sectors of the health care delivery system in the U.S., the pharmaceutical supply chain is highly automated and virtually all claims transactions are handled electronically, rather than on paper. Since they are the final point of sale for pharmaceuticals and the interface between the supply chain and the consumer, pharmacies generate the prescription drug claims information that PBMs, as well as heath plans, employers, governments, and other payers, rely upon to measure consumer activity. Other types of information, both quality-focused (e.g., drug-drug interaction warnings) and utilization management-based (e.g., formulary compliance
3 Drug buy-back programs are offered by manufacturers and are facilitated by wholesale distributors. Buy-back programs are intended to minimize the financial risk that pharmacies must assume in stocking products by allowing them to sell unused products or products with near-term expiration dates back to the manufacturer. 4 Goldman Sachs Industry Report: Health Care Technology & Distribution, February 27, 2003. 5 Standard & Poor's, GICS Sub-Industry Revenue Share, September 4, 2004.
NA. 29

messaging) can originate from other parts of the supply chain, in particular from PBMs, to the pharmacy as a prescription is being dispensed. As the final actor in the supply chain, it is up to the pharmacy to take action based on the information provided. For example, the pharmacy is expected to contact the prescribing physician if the drug prescribed is not on the patient’s health plan’s formulary or if a lower-cost therapeutic alternative is available. There are several types of pharmacies, including independent pharmacies, chain drug stores, pharmacies in supermarkets and other large retail establishments, and mail-order pharmacies. Most pharmacies purchase their drug supply from a wholesale distributor, although in some cases, large institutional and retail chain pharmacies, specialty pharmacies, and mail-order pharmacies obtain drugs directly from a manufacturer. These organizations can deal directly with manufacturers because they already possess the operational infrastructure necessary to bypass wholesalers – warehousing facilities, distribution vehicles, and inventory control systems. Once a pharmacy takes possession of the drug products, it distributes the products to physicians or directly to consumers. In addition, there are specialty pharmacies, which specialize in the distribution of high-cost and more complex drug therapies (e.g., self-injectable drugs and biologics). In 2003, there were 55,000 community retail pharmacies, including 19,000 independent drug stores, 21,000 chain drug stores, and 16,000 pharmacies in supermarkets and other retail merchants.6 In 2004, there were 3.5 billion prescriptions dispensed in the United States through community pharmacies, including about 1.8 billion filled at chain drug stores, 780 million filled at independent pharmacies, and 470 million filled in supermarkets. Another 214 million prescriptions were filled through the mail.7
6 National Association of Chain Drug Stores, http://www.nacds.org/user-assets/PDF_files/Retail_Outlets2003.pdf. 7 IMS Health, National Prescription AuditTMPlus, January 2005, accesses 2/28/05 at http://www.imshealth.com/ims/portal/front/articleC/0,2777,6599_49695974_68913551,00.html
NA. 30

Exhibits 10 and 11 depict the distribution of pharmaceuticals in the U.S. through the various types of “retail” pharmacy channels:
Chain Stores52%
Independent22%
Mail Service6%Long-Term
Care7%
Food Stores13%
Note: Represents total dispensed prescriptions, including insulin dispensed through chain, food store, independent, long term care, and mail service pharmacies.
Source: IMS Health, National Prescription Audit™ Plus, January 2005, accessed 2/28/05 at www.imshealth.com/ims/portal/front/articleC/0,2777,6599_49695974_68913551,00.html
Exhibit 10. Number of Prescriptions by Pharmacy Distribution Channel, 2004
Chain Stores36%
Other23%
Independent14%
Mail Service14%
Long-Term Care4%
Food Stores9%
Exhibit 11. Drug Sales by Pharmacy Distribution Channel, 2004
Note: Represents wholesale prices. Sales include prescription products only. Source: IMS Health, IMS National Sales Perspectives,™ February 2005, accessed 2/28/05 at
http://www.imshealth.com/ims/portal/front/articleC/0,2777,6599_49695983_69891354,00.html
NA. 31

Like all other parts of the pharmaceutical supply chain, the pharmacy industry has gone through significant consolidation as well as diversification of its businesses over the past five to ten years. Several retail pharmacy chains have merged, primarily as a way to gain buying power for use in negotiations with drug manufacturers and wholesale distributors. As shown in Exhibit 12, Walgreens, CVS, and Rite Aid were the top three retail pharmacy chains based on market capitalization: Exhibit 12. Top 5 Retail Pharmacy Chains in the U.S., By Market Capitalization
Rank Pharmacy Chain 2004 Market Cap 1 Walgreens Company $35.2 bil. 2 CVS Corporation $16.1 bil. 3 Rite Aid $2.6 bil. 4 Longs Drug Stores $0.7 bil. 5 Duane Reade $0.4 bil. Total for Industry $103.0 bil.
Source: Health Strategies Consultancy analysis of Pharmacy/Drug Store Industry based on market cap data obtained from Dow Jones (factiva.com)8
In addition to traditional retail pharmacy services, consumers have increasingly been using specialty and mail-order pharmacies over the past several years. Growth in the use of these types of pharmacies is expected to increase rapidly for the foreseeable future, as more payers adopt the view that these specialized retail distribution channels can be important components of their strategies to manage the rate of growth in their pharmacy benefit expenditures. Residents of long-term care facilities (LTC) rely almost exclusively on dedicated LTC pharmacies.
• Specialty pharmacies serve patients with chronic diseases by dispensing high-cost biotechnology drugs. Specialty pharmaceuticals typically are administered by injection or infusion (intravenously), and often, are administered by a clinical professional in a doctor’s office. The diseases treated with specialty pharmaceuticals range from relatively common conditions, some of which are treated with multiple drug therapies, such as HIV/AIDS, multiple sclerosis, cancer, and rheumatoid arthritis, to rare diseases that are treated with a single drug therapy, such as hemophilia and growth hormone deficiency. The specialty pharmacy industry today is dynamic, with new companies entering continuously. Types of firms in the market range from publicly-traded stand-alone firms to subsidiaries of PBMs, retail pharmacies, and home health companies.9,10
8 Market capitalization is the value of a company's outstanding shares of stock, which is measured by multiplying the number of shares outstanding by the current share price. Speaking very generally, the larger the market capitalization, the more financially stable the company. 9 Credit Suisse First Boston, “Pharmacy Benefit Managers and Specialty Pharmacies: Initiating Coverage,” July 14, 2003, p. 22. 10 Raymond James & Associates, Inc., “Specialty Drug Distribution,” July 16, 2002, p. 3.
NA. 32

• Mail-order pharmacies receive prescriptions by mail, fax, phone, or Internet at a central location; process the prescription in large, mostly automated centers; and mail the prescribed drugs back to the consumer. An aging population, convenience, and the recent upswing in pharmaceutical treatments for common chronic ailments, such as diabetes and depression, are some of the driving forces behind the rapid growth in the use of mail-order pharmacies.11 While representing a small overall percentage of total prescriptions filled (approximately 6.1 percent in 200412), mail-order pharmacy sales remained the fastest-growing sector of the U.S. prescription drug retail market in 2004, increasing by 18 percent over the previous year.13 The majority of mail-order facilities are owned and operated by PBMs, and a number of the large retail pharmacy chains also own mail-order pharmacies.14
• Long-term care pharmacies, sometimes called institutional pharmacies, are a
third type of specialized retail pharmacy. Long-term care pharmacies address the special needs of nursing homes, providing packaging for controlled administration (called unit-dose supply or bubble packs), and special services that are more extensive than those provided by retail pharmacies. These special services include: quality assurance checks, emergency drug kits and medication carts, regular and emergency (24-hour-a-day) delivery services, and in-service training programs for nurse aides, nurses, and other professional nursing facility staff. Four national chains provide the bulk of institutional pharmacy services to nursing homes: Omnicare, PharMerica, NeighborCare, and Kindred Healthcare. In 2003, these four chains served over two-thirds of all nursing home beds and had collective revenues of more than $6 billion.15 The two largest national long-term care pharmacies, Omnicare and PharMerica (which is a subsidiary of AmerisourceBergen, a wholesale distributor), provide drugs to over half of the nursing home beds in the United States. Omnicare is the largest provider with over $3 billion in 2003 revenues.16
Pharmacy Benefit Managers (PBMs) According to one leading report on the PBM industry, PBMs currently manage prescription drug benefits for as much as 57 percent of the U.S. population,17 and the
11 National Health Policy Forum, The ABCs of PBMs, October 1999. 12 IMS Health, National Prescription AuditTMPlus, January 2005, accessed 2/28/05 at http://www.imshealth.com/ims/portal/front/articleC/0,2777,6599_49695974_68913551,00.html 13 IMS Health, IMS National Sales Perspectives,TM February 2005, accessed 2/28/05, at http://www.imshealth.com/ims/portal/front/articleC/0,2777,6599_49695983_69891354,00.html 14 California Health Care Foundation, Navigating the Pharmacy Benefits Marketplace, January 2003. 15 Long-Term Care Pharmacy Association, 2003. 16 Omnicare Annual Report, 2003. 17 Atlantic Information Services (AIS), Inc., A Guide to Drug Cost Management Strategies (2nd Edition), 2004, p. 329. AIS states that its data are based on a quarterly survey that the firm has been using to track all publicly-traded and privately-held PBMs since 2000.
NA. 33

National Association of Chain Drug Stores estimates that approximately two-thirds of all prescriptions written in the U.S. are processed by a PBM.18 While not a direct link in the physical supply chain for pharmaceutical products (PBMs in most instances do not take possession or control of prescription drugs), PBMs have become an integral part of most consumer drug purchases. PBMs work with third party payers (private insurers, self-funded employers and public health programs) to manage consumer drug purchases by defining which drugs will be paid for and the amounts that the pharmacy will receive and the consumer must pay out-of-pocket when the prescription is filled. PBMs have evolved over the last three decades from basic claims administrators to more complex organizations offering a wide range of prescription drug management tools. In addition to offering their basic services – claims processing, record keeping, and reporting programs – PBMs offer their customers a wide range of services including drug utilization review, disease management, and consultative services. PBMs also assist clients with establishing their benefit structure. Options for plan design include: developing and maintaining a prescription drug formulary; developing a network of pharmacy providers; and providing mail order fulfillment services. A PBM’s core services and tools include:
• Formularies: PBMs use formularies to negotiate deeper price discounts with manufacturers, set cost-sharing levels to influence beneficiary utilization rates, and encourage beneficiaries to use a mix of preferred or lower-cost covered products.
• Rebates: PBMs negotiate with pharmaceutical manufacturers for rebates on
products selected for the formulary. Rebate amounts are based on the contracts negotiated between the PBM and plan sponsors and the PBM and manufacturers. Typically, contracts are structured so that PBMs retain a portion of the rebate in exchange for developing the formulary and negotiating with manufacturers.
• Pharmacy Networks: Pharmacy networks consist of pharmacies that have agreed
to dispense prescription drugs and provide pharmacy services to a health plan’s enrollees under specified terms and conditions. Pharmacy networks can be broad or narrow. These networks allow PBMs to lower prescription drug prices by negotiating the reimbursement rate and dispensing fee with pharmacies.
• Mail-Order Pharmacy Service: Almost all PBMs offer mail-order pharmacy
service, especially targeted toward individuals with chronic medical conditions who take maintenance medications. The medications are dispensed typically in 90-day amounts per prescription, as opposed to the usual 30-day supply per prescription dispensed by a retail pharmacy. PBMs are able to lower the cost of pharmaceuticals to consumers and payers by using mail-order services to more successfully drive market share for particular products, based on the terms of
18 Ibid., p. 331.
NA. 34
contracts negotiated with pharmaceutical manufacturers (e.g., encouraging generic and branded therapeutic substitution and other forms of managing formulary compliance), and (relative to the typical retail pharmacy operation) by automating dispensing processes.
• Claims Adjudication: All PBMs use a real-time, point-of-sale system linked to
retail and mail-order pharmacies and distribution centers. This process provides verification of coverage, formulary restrictions, drug interactions, and individual co-pay information. This process also provides prescription drug information back at the PBM data warehouse, where it can be used for customized reporting and quality-focused clinical and intervention programs.
• Generic and Therapeutic Substitution: Generic substitution promotes the shift
from brand to chemically equivalent generic drugs as a cost savings device. Therapeutic interchange programs promote the use of preferred drugs (i.e., drugs on a plan’s formulary) that are determined to be clinically similar.
• Quality-Focused Programs: PBMs develop programs that provide disease
management, compliance strategies, and other clinical expertise promoting the safe, educated use of prescription drugs.
PBMs generally do not take physical possession of prescription drugs when performing their core pharmaceutical management functions. However, in their mail-order and specialty-pharmacy businesses, PBMs buy drugs from wholesalers or manufacturers and dispense them directly to patients in a manner similar to other pharmacies.
NA. 35

During the 1990s, there was a great deal of jockeying within the PBM market, a highly penetrated market compared to just a decade ago. In order to remain competitive, PBMs have merged and acquired new businesses. Most recently, in March 2004, Caremark acquired AdvancePCS; in 2001, Express Scripts acquired National Prescription Administrators; in 2000, Medco Health Solutions acquired Provantage; and in 1998, Express Scripts acquired Value Rx. As shown in Exhibit 13, the PBMs that controlled the most market share measured by prescriptions per year in 2003 were Medco Health Solutions, ACS State Healthcare, AdvancePCS/Caremark, and Express Scripts.19
Medco Health Solutions
18%
Express Scripts14%
Caremark & AdvancePCS
20%
ACS State Healthcare
16%
MedImpact Healthcare Systems
6%
First Health Services5%
Wellpoint Pharmacy Mgmt.
4%
Other PBMs17%
Exhibit 13. PBM Market Share by Number of Prescriptions per Year, 2003
*Note: Caremark acquired AdvancePCS in March 2004.Source: AIS, A Guide to Drug Cost Management Strategies, 2nd Edition (2004), Fig. 12.13.
19 Atlantic Information Services, Inc., A Guide to Drug Cost Management Strategies, 2nd Edition, 2004.
NA. 36

III. The Flow of Money and Key Financial Relationships in the U.S. Pharmaceutical Supply Chain The flow of money between manufacturers and end-users is more complex than the physical distribution of drugs. The manufacturer typically interacts with three primary entities when dealing with price: wholesale distributors, retail pharmacies, and pharmacy benefit managers. Pharmaceutical manufacturers negotiate separate contracts with these entities and offer various discounts and rebates based largely on the entities’ varying ability to influence the quantity of drugs that are sold. This section looks at these financial relationships and charts the flow of funds among the key players, starting with manufacturers, who play by far the most important role in establishing prices.
Pharmaceutical Manufacturers
Manufacturers have the most influence over pharmaceutical prices. They develop algorithms to account for expected demand for the product, future competition for the product, and projected marketing costs, and use those algorithms to establish the “wholesale acquisition cost” (WAC), which is the baseline price at which wholesale distributors purchase products. After the WAC is established, the average wholesale price (AWP), or the retail list price, is established either by the manufacturer or by one of the companies that publishes price compendia. The AWP, and sometimes the WAC, is listed in drug compendia published by a small number of private firms, such as the Red Book, published by Thomson Medical Economics, and First DataBank. The AWP has two purposes: (1) it is often used by public and private third-party payers as the basis for reimbursement, and (2) it often serves as the base price for negotiations between manufacturers and private sector purchasers of drugs (e.g., health plans, pharmacy benefit managers, self-insured employers, etc.). The negotiation process and the price points on which negotiations are based are different for brand and generic manufacturers. Brand manufacturers typically offer discounts based on a percentage of AWP or WAC, depending upon the purchaser. End purchasers can typically acquire brand drug products for a price in a range of AWP minus 5 to 40 percent, depending upon their purchasing power or that of their designated agent, such as a PBM. Generic pharmaceutical manufacturers operate in a more aggressive and dynamic negotiation environment than brand manufacturers and thus the prices for generic drugs change much more frequently, sometimes daily, in response to market forces. The most common kinds of discounts and rebates include: retroactive rebates based on market share (i.e., rebates paid by the manufacturer to the pharmacy or PBM based on its ability to direct consumers to certain products); volume discounts (discounts that are triggered when predetermined sales volume targets are met); and “prompt pay” discounts (discounts that are triggered when the purchaser reimburses the manufacturer in an expedited fashion). Pricing for prescription drugs purchased and dispensed by certain federal programs, including Medicaid and the Veterans Administration, are subject to special rules which
NA. 37

generally result in those programs getting lower prices than other purchasers. These rules are outlined in the Appendix.
PRICING TE
• Average Manufacturer Price (AMP): Thwholesalers for drugs distributed to retail Congress in 1990 in calculating Medicaidfor additional discussion of pharmaceutic
• Average Sales Price (ASP: The weightedof chargebacks, discounts, rebates, and otwhether it is paid to the wholesaler or thecovered under Medicare Part B changed uAWP to ASP.
• Average Wholesale Price (AWP): Althou list price (sometimes referred to as a “sticprivate third-party payers as the basis for AWP has been widely criticized as a priceand (2) easily manipulated. The basis forPart B changed under the Medicare Modeprice (ASP).
• Estimated Acquisition Cost (EAC): EACprice generally paid by pharmacies for a p
• Maximum Allowable Cost (MAC): MACgeneric and multi-source brand products. typically publish lists of selected generic maximum price at which the program wilwill receive payment no higher than the M
• Wholesale Acquisition Cost (WAC): Thethe wholesaler's supplier, typically the maWAC amounts may not reflect all availab
Wholesale Distributors Wholesale distributors purchase drugs frompurchase price is fairly uniform, with little ndistributor. The distributor typically purchaof WAC. Examples of discounts for brandepay discounts, and discounts related to the swholesaler is assuming a risk that the produwholesale distributor then sells the product WAC plus some negotiated percentage. For generic products, the purchase price is hcompetition in the class and the ability of thor increase the volume sold. In this case, wnegotiation of the price of the product. Theelastic depending upon the negotiated contra
RMS DEFINED
e average price paid to a manufacturer by pharmacies. AMP was a benchmark created by rebates and is not publicly available. (See Appendix al pricing in Medicaid). average of all non-Federal sales to wholesalers net her benefits tied to the purchase of the drug product, retailer. The basis for reimbursement for products nder the Medicare Modernization Act of 2003 from
gh not defined in statute, AWP is recognized as retailker” price) and is currently used by some public and reimbursement (e.g., AWP minus 5 or 25 percent). that is (1) not reflective of the true market price,
reimbursement for products covered under Medicare rnization Act of 2003 from AWP to average sales
is a state Medicaid Agency’s best estimate of the articular drug. lists are designed to cap reimbursement for certain States and private payers with MAC programs and multi-source brand drugs along with the l reimburse for those drugs. In general, pharmacies AC price when billing for drugs on a MAC list.
price paid by a wholesaler for drugs purchased from nufacturer of the drug. Publicly disclosed or listed le discounts.
manufacturers. For branded products, the egotiation on the part of the wholesale ses branded products for a discounted rate off d products include volume discounts, prompt ale of short-dated products (because the ct will expire before it can be resold). The to its end consumer, typically a pharmacy, at
ighly variable, largely depending upon e wholesale distributor to drive market share holesale distributors play a larger role in the price to the end consumer also is highly cts with the retail pharmacies.
NA. 38
In some cases, the wholesale distributor may facilitate discounts negotiated between manufacturers and other customers. For example, wholesaler A may distribute drugs to pharmacy B based on negotiations between pharmacy B and manufacturer C. Although wholesaler A directly distributes the drugs to pharmacy B, it plays a minimal part in pricing negotiations for these drugs. In this case, wholesalers use an important pricing mechanism, chargeback, which allows them to carry products destined for customers paying very different prices to manufacturers. The wholesaler keeps track of sales to various customers under prices negotiated between the manufacturer and the customer. The wholesaler then “charges back” the manufacturer for any difference between the negotiated prices paid by the customer and the wholesaler’s cost of goods (WAC). Pharmacies Payment for prescription drugs flow from the pharmacy to the manufacturer according to a negotiated contract involving manufacturers, PBMs, and pharmacies. Retail pharmacies negotiate with manufacturers for discounts and rebates based on the pharmacy’s ability to sell specific volumes of certain drugs or achieve a certain share of a specified market. As discussed in the wholesale distributor section, pharmacies may be able to negotiate discounts with manufacturers that are more substantial than the wholesale distributor’s cost. In these instances, the wholesale distributor facilitates the discount and “charges back” the manufacturer for any difference between the negotiated prices paid by the customer and the wholesaler’s cost of goods (WAC). Pharmacies also negotiate with PBMs for inclusion in a PBM’s pharmacy network and for reimbursement for the cost of the drug plus dispensing fees. Manufacturers may offer volume discounts on selected drugs to pharmacies when they achieve predetermined market share targets. These discounts provide an incentive for pharmacists to work with patients and physicians to switch products from a prescribed non-preferred drug to a preferred drug. Pharmacies contract with PBMs to join their pharmacy network. This structure provides pharmacies with guaranteed, stable reimbursement from private payers and access to a greater number of customers. The network consists of a group of retail and independent pharmacies and serves to offer plan members with lower prescription drug costs. As part of the pharmacy network contract, retail pharmacies must agree to a guaranteed reimbursement formula for prescription drugs. For brand-name medications, the reimbursement formula is usually determined by subtracting a negotiated percentage from the drug’s AWP and adding the dispensing fee. For generic drugs, reimbursement may be determined in the same way as for a brand drug (for less competitive generic drug classes), but more often is based on an amount specified referred to as the maximum allowable cost (MAC). Smaller retail stores, such as independent pharmacies and smaller retail chains, either purchase directly from wholesalers – at a price significantly higher than retail pharmacies – or join group-purchasing organizations (GPOs). As members of a GPO, small
NA. 39

pharmacies receive the benefits of volume purchasing by leveraging their combined purchasing power to negotiate discount pricing from wholesalers or even in some cases from manufacturers. Some of these groups further reduce their costs through direct rebate deals offered by manufacturers. Mail-order and specialty pharmacy services are increasingly becoming a more attractive and demanded option for health plan sponsors and other payers seeking to rein in pharmaceutical expenditures for their members. Mail-order and specialty pharmacies are able to generate increased savings by driving market share, streamlining the distribution chain, and automating drug dispensing processes.
• Specialty Pharmacy: Most specialty pharmacy providers manage the cost of specialty pharmaceuticals by negotiating directly with manufacturers and by running quality-focused programs intended to improve patient care and lower costs. Large PBMs or retail pharmacy chains own a number of the specialty pharmacies, and in some cases these entities are able to negotiate greater discounts with manufacturers.20 Nearly all specialty pharmacies also administer programs designed to enforce patient compliance. Industry representatives claim that these programs save the patient and health plan money by averting acute incidences.
• Mail-Order Pharmacy: In 2000, the U.S. Department of Health and Human
Services estimated that mail-order pharmacies were able to generate savings between two and 35 percent compared to retail pharmacies.21 Representatives from the mail-order industry attribute these savings to their ability to “manage” prescriptions because the majority of mail-order prescriptions are filled in 90-day units (the equivalent of three prescriptions).22 The considerable lead time associated with filling a 90-day prescription gives the pharmacists and other clinical staff at a mail-order pharmacy the time to analyze whether the prescribed drug is on the client’s (i.e., insurer’s or health plan’s) approved formulary, if there is a generic equivalent available, and if there are any potential interactions of the prescribed drug with other medications the member’s physician or physicians may have also prescribed.
• Long-Term Care Pharmacy: LTC pharmacies have long-term, almost exclusive
contracts with nursing homes to provide medications and services for residents. LTC pharmacies capture a large volume of customers in this way. LTC pharmacy chains have developed formularies and use them in many states that do not have Medicaid preferred drug lists (PDLs) applicable in the nursing home setting. The large LTC pharmacy chains negotiate rebates with manufacturers in exchange for
20 Berg, Kevin I. “Health Care Industry Report: The Down Low,” First Albany Corporation 6 (2003): 1-153. 21 Department of Health and Human Services, Report to the President: Prescription Drug Coverage: Spending Utilization and Prices, April 2000. 22 California HealthCare Foundation, Navigating the Pharmacy Benefits Marketplace, January 2003.
NA. 40

moving market share on their formularies. In addition to receiving rebates, many pharmacies are reimbursed at higher rates than acquisition costs, because they purchase drugs through wholesalers and group purchasing organizations.
Pharmacy Benefit Managers (PBMs) Although PBMs are a relatively unknown entity to the end consumer, they play a fundamental role in negotiating the price that is ultimately paid for the product through their relationships with other entities in the supply chain. PBMs contract with health plans to manage their prescription drug costs. Each contract is different between health plans and PBMs; however, there are generally three basic components of the payment negotiated between PBMs and their sponsors. First, PBMs receive payment for the services they provide. These services may include claims adjudication processing and disease management services. Second, PBMs typically assume some type of performance risk in the contracts they negotiate. Performance metrics can include: customer service (e.g., adequacy of pharmacy networks, timeliness of reporting), clinical quality measures (e.g., the number of people averted from taking inappropriate medications), and cost management techniques (e.g., the number of generic substitutions made in a given time period). Third, PBMs also retain a portion of rebates they secure from manufacturers. PBMs do not typically assume full insurance risk for drugs. This type of risk is assumed when an insurer takes full or partial financial responsibility for claims incurred under a specified benefit. Insurance risk can further be segmented into three sub-categories: price, utilization, and selection risk. PBMs do not typically guarantee either the unit prices of drugs, the volume of drugs (utilization) or the kinds of patients that sign up for the drug plan (selection). Insurance risk for drugs is often assumed by self-insured entities in the context of a full medical benefit. For an entitiy to assume insurance risk, the entity must demonstrate that it has adequate financial reserves, be licensed and overseen by state insurance regulators, and be prepared for underwriting cycles. While performance risk arrangements are very common for PBMs, insurance risk arrangements are not. During the mid-1990s, some PBMs experimented with risk contracts. ValueHealth, PCS, and Medco had contracts in which the PBM assumed full insurance risk. The contracts typically contained actuarial carve-outs for new biotechnology products and unexpected changes in demographics, but put the PBM at risk for other drug utilization and cost. Many of these contracts were with large manufacturing clients who were self-insured, concerned about drug spending, and bid out the pharmacy benefit competitively to multiple vendors. The experience was uniformly negative from the PBM perspective. The PBMs consistently lost money because they under-estimated the development and diffusion of new technology. Many were able to negotiate out of these contracts, but some contracts persisted until the late 1990s. Most, if not all, are now gone.
NA. 41

PBM relationships with manufacturers are governed under guidance from the Department of Health and Human Services (HHS) Office of the Inspector General, and subject to oversight by the Department of Justice for compliance with federal anti-kickback statutes. PBMs are further regulated in many states under consumer protection statutes. In recent years, some industry practices, for example switching of medications and associated pricing issues, have come under scrutiny by state Attorneys General and the Department of Justice. Allegations have also included accepting undisclosed incentives from pharmaceutical manufacturers, not passing manufacturer rebates through to plan sponsors, and driving beneficiaries unnecessarily to mail-order services for the benefit of the PBM. False Claim Act lawsuits also have been filed by the federal government and several states. Medco Health Solutions settled in April 2004 with twenty State Attorneys General on a case involving therapeutic interchange and price disclosure. While this legal scrutiny has focused on a few industry practices, the typical business practices of PBMs have also been heavily scrutinized by plan sponsors, such as health plans and self-insured employers. Further guidance from the HHS Office of the Inspector General on PBM operations and safe harbors under the anti-kickback statute is expected.23
According to a January 2003 study conducted by the federal Government Accountability Office (GAO), PBMs achieved significant discounts for drugs purchased at retail pharmacies (in comparison to cash-paying customers) and offered even greater discounts for their mail-order services.24 However, cost savings are largely driven by how restrictive or open the cost-containment programs are. This is a point usually negotiated between the health plans and PBMs. For example, open formularies (where consumers are free to access all prescription drugs) typically yield lower cost savings than closed formularies (where consumers are limited to certain drugs). Cost sharing differences by the type of formulary also increase members’ sensitivity to prescription drug costs and provides an incentive to use lower-cost or preferred products on the formulary. Common private-sector, cost sharing tools include flat copayments, percent copayments with a minimum/maximum dollar amount, and front-end deductibles with a benefit maximum and/or stop loss.25
• Manufacturer-PBM Relationship: As discussed above, the relationship between
manufacturers and PBMs is centered around inclusion of a drug on a plan’s formulary and the PBM’s ability to increase a manufacturer’s market share for certain drugs through inclusion or exclusion on a formulary. Manufacturers pay rebates to PBMs retroactively based on the PBM’s ability to meet both of these goals. These rebates are passed in whole or in part back to the employer. According to the California HealthCare Foundation, PBMs are often able to secure rebates of 5-25 percent for branded drugs.26
23 For more information about the Medco settlement, see The Pink Sheet, May 3, 2004, pages 22-30. 24 U.S. Government Accountability Office, “Federal Employees’ Health Benefits: Effects of Using Pharmacy Benefit Managers on Health Plans, Enrollees, and Pharmacies,” GAO-03-196, January 2003. 25 Joanne Sica, “Managing prescription drug costs,” Employee Benefits Journal, March 2001, pp. 35-40. 26 California HealthCare Foundation, Navigating the Pharmacy Benefits Marketplace, January 2003.
NA. 42

• PBM-Pharmacy Relationship: As discussed above, PBMs negotiate with pharmacies for drug reimbursement and dispensing. The pharmacies negotiate for inclusion in a PBM’s pharmacy network. There is often significant tension between the two entities because (1) in general, pharmacies are reimbursed by PBMs at levels below uninsured cash-paying customers and other government payers, like Medicaid, and (2) pharmacies are often required to perform more administrative tasks when filling a prescription for a PBM customer.
NA. 43

IV. Conclusion Pharmaceuticals are a vital part of patient care, and their importance will only grow as the population ages and pharmaceutical innovation continues. Understanding current pharmaceutical issues (including the sources of prescription drugs, pricing and discounts, cost containment methods, and brand/generic questions) requires knowledge about the various actors in the supply chain. State and federal policymakers increasingly are looking to private sector financing strategies to shape the ways in which individuals with public coverage receive medications. Passage of the Medicare Modernization Act of 2003 (MMA) makes knowledge about the pharmaceutical chain even more important as the large public Medicare program and its beneficiaries begin to access the chain, and pharmaceutical chain entities make changes in response to the new coverage. The pricing of prescription drugs and the flow of money among the various links in the pharmaceutical supply chain is more complex than the physical distribution of drugs through the chain. This complexity can result in substantial variations in what different purchasers pay for the same drugs. As we have shown, the price of prescription drugs paid by the consumer is determined by a constellation of negotiated contracts between manufacturers, PBMs, wholesale distributors, pharmacies, and plan sponsors. The price charged by each entity in the chain is largely driven by the ability of contracting entities to sell specific volumes of certain drugs or achieve a certain share of a specified market. It is also affected by the value each entity brings to the subsequent actors in the supply chain. Rapid increases in spending on pharmaceuticals in recent years have led policymakers to more closely scrutinize drug pricing and the relationships among key actors in the marketplace, and the greatly enhanced federal role in the market brought about through the MMA will only intensify public interest in these areas. Experiences with the Medicare price comparison website for the drug discount card has increased consumer and government interest in internet-based price comparisons. The price differences highlighted by these and other analyses lead to questions about the basis for these pricing differentials. Medicare’s activities to detect and remedy fraud and abuse will also require continued oversight and need for transparency and fiscal accountability. Public policy discussions regarding transparency and price disclosure are thus likely to continue to be active over the coming years.
NA. 44

V. Appendix This Appendix briefly describes: (A) special pricing rules applicable to Medicaid and some other federal programs, and (B) the roles physicians, large employers, and health plans have in the pharmaceutical supply chain. A. Special Pricing Rules Applicable to Federal Programs Several federal programs that are significant purchasers of prescription drugs have special rules for pricing.
Medicaid Federal rules require that states pay for brand name prescription drugs based on the lower of (1) the estimated acquisition cost (EAC) of a drug (the method most states use); or (2) the usual or customary charge to the public. Most Medicaid programs use a drug’s AWP to calculate the EAC, generally AWP minus some percentage. An additional limit, known as the Federal Upper Limit (FUL), applies to the purchase of generic drugs. Manufacturers who want to have their drugs covered by Medicaid also must provide rebates to state Medicaid programs. For brand name drugs, the basic rebate is the larger of (1) 15.1% of the AMP (the average price paid to manufacturers by wholesalers for drugs distributed to retail pharmacies; the AMP is usually lower than the AWP); or (2) the difference between the AMP and the lowest price the manufacturer offers to most other purchasers. An additional rebate is required if the price of brand name drugs rises faster than the change in Consumer Price Index. Rebates for generic drugs are calculated by multiplying the AMP by 11%.
Department of Veterans Affairs, Department of Defense, Public Health Service, Coast Guard The Department of Veterans Affairs (VA) administers a program known as the Federal Supply Schedule (FSS), through which the VA and certain other government agencies can purchase prescription drugs at prices that are equal to or lower than the prices that drug manufacturers charge their “most-favored” private customers. In addition, manufacturers must sell brand-name drugs to these agencies at a minimum of 24% off the AMP (known as the federal ceiling price).
Section 340B Drug Pricing Program Section 340B of the Public Health Service Act requires drug manufacturers, as a condition of having their drugs covered by Medicaid, to provide prescription drugs to certain nonfederal entities (public and disproportionate share hospitals, community health centers, certain grantees of Federal agencies, and health centers that serve migrant, homeless, public housing, and Native American populations)
NA. 45
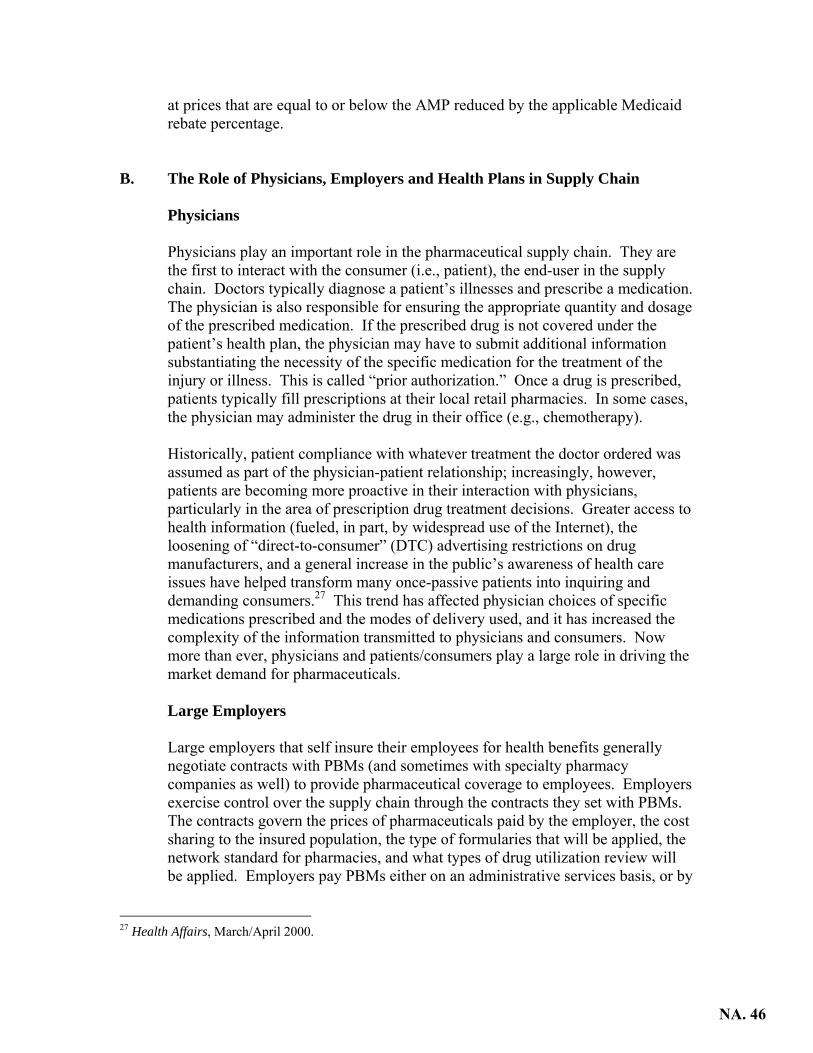
at prices that are equal to or below the AMP reduced by the applicable Medicaid rebate percentage.
B. The Role of Physicians, Employers and Health Plans in Supply Chain
Physicians
Physicians play an important role in the pharmaceutical supply chain. They are the first to interact with the consumer (i.e., patient), the end-user in the supply chain. Doctors typically diagnose a patient’s illnesses and prescribe a medication. The physician is also responsible for ensuring the appropriate quantity and dosage of the prescribed medication. If the prescribed drug is not covered under the patient’s health plan, the physician may have to submit additional information substantiating the necessity of the specific medication for the treatment of the injury or illness. This is called “prior authorization.” Once a drug is prescribed, patients typically fill prescriptions at their local retail pharmacies. In some cases, the physician may administer the drug in their office (e.g., chemotherapy).
Historically, patient compliance with whatever treatment the doctor ordered was assumed as part of the physician-patient relationship; increasingly, however, patients are becoming more proactive in their interaction with physicians, particularly in the area of prescription drug treatment decisions. Greater access to health information (fueled, in part, by widespread use of the Internet), the loosening of “direct-to-consumer” (DTC) advertising restrictions on drug manufacturers, and a general increase in the public’s awareness of health care issues have helped transform many once-passive patients into inquiring and demanding consumers.27 This trend has affected physician choices of specific medications prescribed and the modes of delivery used, and it has increased the complexity of the information transmitted to physicians and consumers. Now more than ever, physicians and patients/consumers play a large role in driving the market demand for pharmaceuticals.
Large Employers
Large employers that self insure their employees for health benefits generally negotiate contracts with PBMs (and sometimes with specialty pharmacy companies as well) to provide pharmaceutical coverage to employees. Employers exercise control over the supply chain through the contracts they set with PBMs. The contracts govern the prices of pharmaceuticals paid by the employer, the cost sharing to the insured population, the type of formularies that will be applied, the network standard for pharmacies, and what types of drug utilization review will be applied. Employers pay PBMs either on an administrative services basis, or by
27 Health Affairs, March/April 2000.
NA. 46

allowing the PBMs to retain a portion of manufacturer rebates. Employers retain audit rights to exercise oversight of PBM operations.
Health Plans
Health plans employ the use of a range of strategies to manage prescription drug benefits, most of which involve the use of a PBM or PBM-like strategies. There are a few remaining plans that compensate pharmacies on a fee-for-service basis, but plans are using this method less frequently, as it does not allow for use of cost-containment strategies to lower prescription drug costs. More commonly, plans do one of the following: (1) outsource management to an external PBM, (2) operate their own PBM, or (3) outsource claims administration only. Notable exceptions include certain group models, such as that of Kaiser Permanente, which has maintained control of pharmaceutical procurement. Kaiser streamlines the distribution process by purchasing pharmaceuticals from manufacturers and dispensing the medications to consumers at on-site pharmacies.
Regardless of the strategy used, health plans often influence the cost-containment strategies utilized by PBMs. For example, managed care organizations may negotiate a more restrictive formulary or more competitive pharmacy networks. Managed care companies a greater ability to enforce formulary compliance and to drive consumers to a smaller number of pharmacies.
NA. 47

VI. Key Acronyms and Glossary of Key Terms
AMP – Average Manufacturer Price ASP – Average Sales Price AWP – Average Wholesale Price EAC – Estimated Acquisition Cost MAC – Maximum Allowable Cost PBM – Pharmacy Benefit Manager WAC – Wholesaler Acquisition Cost Average Manufacturer Price (AMP) – The average price paid to a manufacturer by wholesalers for drugs distributed to retail pharmacies. AMP was a benchmark created by Congress in 1990 in calculating Medicaid rebates and is not publicly available. Average Sales Price (ASP) – The weighted average of all non-Federal sales to wholesalers net of chargebacks, discounts, rebates, and other benefits tied to the purchase of the drug product, whether it is paid to the wholesaler or the retailer. The basis for reimbursement for products covered under Medicare Part B changed under the Medicare Modernization Act of 2003 from AWP to ASP. Average Wholesale Price (AWP) – A national average of list prices charged by wholesalers to pharmacies. AWP is sometimes referred to as a "sticker price" because it is not the actual price that larger purchasers normally pay. Estimated Acquisition Cost (EAC) – EAC is a state Medicaid Agency’s best estimate of the price generally paid by pharmacies for a particular drug Maximum Allowable Cost (MAC) – MAC is a cap set by payers on reimbursement for certain generic and multi-source brand products. States and private payers with MAC programs typically publish lists of selected generic and multi-source brand drugs along with the maximum price at which the program will reimburse for those drugs. In general, pharmacies will receive payment no higher than the MAC price when billing for drugs on a MAC list. Medicaid Best Price – The lowest price paid to a manufacturer for a brand name drug, taking into account rebates, chargebacks, discounts, or other pricing adjustments, excluding nominal prices. Best price is a variable used in the Medicaid rebate statute to calculate manufacturer rebates owed to State Medicaid agencies. Prices charged to certain governmental purchasers are statutorily excluded from best price including prices charged to the Veterans Administration, Department of Defense, Indian tribes, the Federal Supply Schedule, State Pharmaceutical Assistance Programs, Medicaid, Public Health Service “340B” entities, and Medicare Part D prescription drug plans (starting in 2006). Best price data are reported by manufacturers to CMS, but are not publicly available.
NA. 48

Reference Pricing – System of fixed reimbursement for pharmaceuticals, in which the government or other third party payers establish a level at which they are willing to reimburse “interchangeable” products. Manufacturers may charge above the reference price, but patients must pay the excess cost. Wholesale Acquisition Cost (WAC) – The price paid by a wholesaler for drugs purchased from the wholesaler's supplier, typically the manufacturer of the drug. Publicly disclosed or listed WAC amounts may not reflect all available discounts.
NA. 49

The Henry H. Kaiser Family Foundation
2400 Sand Hill Road Menlo Park, CA 94025
Phone: 650-854-9400 Fax: 650-854-4800
Washington Office: 1330 G Street, NW
Washington, DC 20005 Phone: 202-347-5270 Fax: 202-347-5274
www.kff.org
Individual copies of this publication (#7296) are available on the Kaiser Family Foundation’s website at www.kff.org
The Kaiser Family Foundation is a non-profit, private operating foundation dedicated to providing information and analysis on health care issues to policymakers, the media, the health care community, and the general public. The Foundation is not associated with Kaiser Permanente or Kaiser Industries. NA. 50

RSS
Cash, check or third party?
Prescription benefit plans are squeezing retail pharmacies.
Ronald A. Wirtz - Editor, fedgazette
Published January 1, 2006 | January 2006 issue
On the surface, one might think these are the halcyon days for retail pharmacies. Prescription drug usage has ballooned, making for a veritable conveyer belt of little plastic bottles passing from pharmacist to consumer.
But oddly, strong demand does not necessarily mean better profits for the average corner pharmacy. One Wisconsin pharmacy source noted—with no hint of irony or sarcasm—that pharmacies were "suffering under an incredible increase" in prescription drug use.
Rather, beneath the courteous retail setting of a pharmacy (it is a doctor's office, after all), a force is rumbling through the pharmacy industry that threatens to shake the pill bottles off the wall.
The force is a growing third-party payer system, where private companies, nonprofit firms and government programs pay for prescription drug coverage on behalf of employees and other beneficiaries. These so-called plan sponsors then often hire an outside firm—called a prescription benefit manager, or PBM—to manage the overall costs of the program and organize a pharmacy network that will accept enrollees' insurance coverage.
A seemingly benevolent force that has made prescription drugs more affordable for tens of millions of people, the third-party payer system has been less than kind to retail pharmacies—chain and independent alike—because it has been steadily chopping into a major financial artery: drug reimbursement rates, a two-part fee that pharmacists charge for the ingredients and labor necessary to fill a prescription. The first half of the reimbursement is for the drug itself (and involves the average wholesale price of a drug minus some negotiated group discount—in pharmacy lingo, quite literally, AWP minus X percent). The second half is a dispensing fee, or a flat-rate charge for putting pills in a bottle, which is expected to cover operational costs for a pharmacy.
Ironically, as demand for prescription drugs increases, pharmacies are losing more control over pricing of their central product. Here's how: Increased usage by beneficiaries and high drug costs have meant that plan sponsors—employers, government—are paying substantially more every year to offer drug benefits. Looking for relief, plan sponsors are demanding that PBMs contain the cost of drug benefits. Among various responses, PBMs have been persistently cutting reimbursement rates paid to pharmacies to levels that many pharmacists claim are no longer even marginally profitable.
They are able to do so because the third-party payer system has consolidated the buying pool. Two decades ago, the pharmacy market was made up of millions of buyers paying cash. The third-party system has consolidated these individual buyers into huge pods of collective buyers. As the
Cash, check or third party? - fedgazette - Publications & Papers | The Federal Reserve Bank of Minne...
Tuesday, September 03, 2013http://www.minneapolisfed.org/publications_papers/pub_display.cfm?i...
NA. 51

gatekeeper for these pharmacy customers, PBMs have leverage to set reimbursement rates they are willing to pay on behalf of plan beneficiaries. (Economists call this a monopsony, where one buyer faces many sellers.) Pharmacies interested in serving a PBM's client base can either accept or decline the reimbursement contract being offered, with the understanding that choosing not to join a PBM network could sacrifice a major portion of their clientele. As one Wisconsin pharmacist noted, "Negotiation does not exist in my world."
That puts retail pharmacies at a disadvantage, and particularly independent ones, because they don't have the counterleverage of multiple stores and high volume that chain-owned pharmacies have.
"The single greatest shortcoming of independent pharmacies is their inability to have leverage in the system of healthcare purchasing," according to Chris Decker, executive vice president of the Pharmacy Society of Wisconsin. Decker, who responded to questions via e-mail, said, "Pharmacies have 90 percent of their business in the insurance market but have little to no ability to negotiate fees with the insurers" or PBMs. Efforts by plan sponsors and their PBMs to contain escalating drug costs have "largely resulted in paying pharmacies less and less" for dispensing medications to insured beneficiaries.
Even government programs like Medicaid, long a source of reliable profits for pharmacies, are coming under pressure to reduce drug costs, and the promise some see in expanded drug coverage for seniors in the recent expansion of Medicare is viewed warily by pharmacists and seniors alike.
Take two aspirin, then buy two more
Prescription spending has been on something of a drug bender for the better part of a decade and a half. Prescription drug sales were expected to reach about $250 billion last year, the majority through retail pharmacies, according to IMS Health, a health research and marketing firm.
Though still a small portion of total costs, pharmaceuticals have gradually assumed a larger share of total healthcare spending, rising from 9.7 percent in 1991 to 15.5 percent in 2004, according to a September report on the drug industry by Lehman Brothers. During this period, annual drug costs have risen by an average of 11 percent; in fact, drug costs have risen faster than medical costs in 13 of 14 years during this period.
Few prescriptions are paid for in cash anymore, which is a sea change in just a decade and half. In 1990, 63 percent of prescriptions were paid for by cash; by 2002, just 14 percent. Third-party payers have picked up the slack. According to the National Community Pharmacists Association, 85 percent of prescriptions at independent (nonchain) pharmacies were paid for by public and private third-party payers.
The large majority of prescription drug plans are managed by a small handful of PBMs; firms like Caremark, Medco and Express Scripts have millions of members. This gives individual PBMs enormous leverage when negotiating contracts with pharmacies, particularly small independent ones, and reimbursement rates have been going down as a result.
Whether that's a good or bad thing probably depends on your role in the average prescription transaction. The negotiating leverage of PBMs—with drug manufacturers as well as pharmacies—is generally viewed as a good thing for plan sponsors and consumers because it helps keep costs down. Many have complained about market power among the major PBMs, a matter that came to a head with the 2004 merger of PBM giants Caremark and AdvancePCS. The Federal Trade Commission acknowledged that "retail pharmacies might be concerned about this outcome," but allowed the
Cash, check or third party? - fedgazette - Publications & Papers | The Federal Reserve Bank of Minne...
Tuesday, September 03, 2013http://www.minneapolisfed.org/publications_papers/pub_display.cfm?i...
NA. 52

merger on the belief that additional bargaining power gained by such a merger "is procompetitive when it allows the buyer to reduce its costs and decreases prices to its consumers."
But pharmacies also have to bear much of the inherent inefficiencies of a growing third-party payer system. A report five years ago by the U.S. Department of Health and Human Services found that pharmacists spend between 10 percent and 20 percent of their time on third-party issues, like a beneficiary's insurance coverage. A 1999 study by Arthur Andersen found similar results. Given a steadily rising percentage of prescriptions covered by third-party insurance, that figure is likely conservative today. A Montana pharmacist said a technician at his pharmacy "is on the phone half the day" trying to straighten out payments and other matters. "Sometimes that's all my tech does."
All of this eats into a pharmacy's profits. Net profits of independent pharmacies have remained doggedly steady between 3 percent and 4 percent over the last decade, but that's in part because owner compensation has steadily declined over this period, according to the most recent NCPA-Pfizer Digest, an annual report on the independent pharmacy industry.
Singing the Blues
The pharmacy industry's dilemma with third-party coverage has surfaced in a big way in North Dakota. In August, the state's largest private insurer, Blue Cross Blue Shield of North Dakota, terminated its existing contract with pharmacies statewide and is replacing it with a contract offering lower reimbursement rates. (Technically, this is being done through Prime Therapeutics, a PBM that is collectively owned by various BCBS plans. Prime Therapeutics also owns a mail order pharmacy in Texas that is part of the pharmacy network for BCBSND beneficiaries.)
Pharmacies can choose not to join the new network, but that decision comes with significant consequences because BCBSND is the prescription gatekeeper for about half of the state's entire population, and 80 percent of its insured population. Patricia Hill, executive vice president of the state pharmacists association, said of the insurer, "There is no competition. … They own us."
Hill said her members have been offered contracts that cut reimbursements by 25 percent. "They've been told it's a take-it-or-leave-it situation. … That's their options, and both options pretty much lead to the same (bad) result," Hill said. One pharmacist owner in Bismarck calculated it would cost him $130,000 in annual revenue, "and there was no place to absorb it," according to Hill, so this particular pharmacist recently closed rather than die a slow business death.
But under the previous contract, BCBSND's reimbursement rates were substantially higher than those paid by Blue Cross affiliates in other states, according to data provided by Tom Christensen, director of pharmacy management for BCBSND.
While "other details" are involved regarding the new BCBSND contract, the matter "begins and ends with the fact we're looking for competitive market reimbursement," said Christensen, who added that he could not discuss contract negotiations, but characterized the 25 percent reduction in reimbursement rates cited by Hill as "inaccurate."
The company lived with the rate gap, according to Christensen, because it wasn't "hearing a lot of noise" from clients. But that changed as drug costs ballooned on employers. "Everybody (today) is paying attention to their drug costs … (and) our pharmacy reimbursement rates would often come up" in negotiations with employers about health plan costs, he said.
Cash, check or third party? - fedgazette - Publications & Papers | The Federal Reserve Bank of Minne...
Tuesday, September 03, 2013http://www.minneapolisfed.org/publications_papers/pub_display.cfm?i...
NA. 53

Christensen acknowledged that "there may be some pain" in the transition to lower reimbursement rates. "It's not a pleasant process or one that we relish going into. But we have to try and get more competitive rates."
Government island
During this period of sinking reimbursements, one island remained for many pharmacies, particularly rural and independent ones.
The name of this reimbursement island? Just ask Jim Smith, executive director of the Montana Pharmacy Association. Smith said he gets asked all the time why a state like Montana has many dozens of small, independent pharmacies sprinkled throughout its wide-open expanses.
"Two little words," Smith said. "Medic-aid."
More to the point, Medicaid makes up a significant share of total prescriptions—for independent pharmacies, about 25 percent—and has historically offered a healthy reimbursement rate. Federal Medicaid law gives states flexibility to set reimbursement rates, with the added provision that Medicaid recipients have proper access to services. To serve a diffuse population, states have generally set reimbursement rates high—at least compared with other third-party payers—to ensure that an ample number of pharmacies agree to serve Medicaid clients.
Medicaid reimbursement rates vary across the nation, and the degree of their "generosity," if you will, is difficult to determine exactly. The dispensing fee is fairly straightforward, but is only half of the equation. The other half of the reimbursement formula (for the cost of drug ingredients) varies among states and defies easy ranking. Other factors, like uncollectible co-pays from indigent patients and reportedly higher administrative costs for Medicaid claims, further cloud an easy comparison not only with other third-party reimbursements, but also between state Medicaid programs.
That said, Medicaid still clearly offers attractive margins, particularly for dispensing fees. In Montana, the dispense rate is $4.70 per prescription—far higher than for the average third-party prescription, and nothing short of a life preserver for many rural pharmacies, said Smith. "Medicaid is the only (payer) that cares that (rural pharmacies) are out there."
But Medicaid reimbursements are under assault from many angles. Congress has been debating numerous cuts to Medicaid (which the federal government cost-shares with states), including pharmacy reimbursements. In a late-November proposal, Congress suggested cutting over $2 billion in Medicaid pharmacy reimbursements, according to the NCPA.
In Wisconsin this fall, Gov. Jim Doyle chopped annual Medicaid reimbursements to pharmacies through a line-item budget veto. The matter is being hotly contested by the state pharmacists association, and efforts are being made to have the Legislature override the budget veto. Barring some special action, the measure will be enacted in February and will cut both halves of the state's Medicaid reimbursement rate, costing pharmacies an estimated $50 million. Some pharmacies have vowed to discontinue filling Medicaid prescriptions, and Decker, the state association representative, said the reimbursement cut "will cause an already fragile system to break."
But a more ominous straw hovering over the pharmacy camel might be the new Medicare "Part D" prescription drug benefit. When the program got inaugurated on the first of this year, it eliminated the so-called dual eligible—disabled and low-income seniors who were eligible for prescription services under Medicaid (based on need) and medical services under Medicare (based on age).
Cash, check or third party? - fedgazette - Publications & Papers | The Federal Reserve Bank of Minne...
Tuesday, September 03, 2013http://www.minneapolisfed.org/publications_papers/pub_display.cfm?i...
NA. 54

The new Medicare drug program made the Medicaid drug benefit redundant for dual eligibles, who have subsequently been enrolled in the new Medicare program. While that might not seem like a big deal—poor seniors just hopped from one government drug benefit program to another, right?—it has major ramifications for pharmacies because the new Medicare drug benefit is being administered by private PBM plans, which takes us full circle back to the beginning of this controversy: cost containment and lower reimbursements.
It's not a small amount of money at stake either, according to state-level data on Medicaid recipients compiled by the Kaiser Foundation. Minnesota, for example, had 123,000 dual-eligible Medicaid recipients (aged and disabled) in 2003. Total Medicaid spending on drugs for this population alone that year was nearly $290 million. For the state's roughly 1,500 retail, hospital and other pharmacies, even a relatively small reduction in reimbursement rates would cut revenues without a reduction in workload.
Anxiety pill
If that weren't enough, pharmacists are nervously awaiting the full effect of the Medicare prescription drug benefit, which goes well beyond tinkering with dual eligibles.
Widely heralded and criticized, the new program provides drug coverage to anyone over 65 years old who signs up. As a drug subsidy for seniors, the new program would appear to be a boon for pharmacies because it is expected to push drug usage higher, and with it the number of prescriptions filled by pharmacists.
But it's not that simple, and no one's really sure how this new federal drug entitlement will play out, particularly for rural pharmacies. The program will further accelerate the third-party payer trend as seniors sign up for coverage, and given the fact that PBMs and other private health firms are administering the many individual (and competing) drug plans, reimbursement rates are likely to come under further attack.
That doesn't mean it necessarily will be a lopsided race to the reimbursement bottom. Because "there's lots of Medicare clients" in rural areas, "these plans are going to want to work with these rural pharmacies" to provide an adequate network for coverage, said Smith, from the Montana Pharmacy Association.
Some safeguards are in place to ensure that PDPs construct a broad, viable network in terms of access. Under the so-called tricare standard, for example, a plan must have a pharmacy within 15 miles of 70 percent of its rural beneficiaries. That means plans can't always skimp on the pharmacy reimbursement, because rural pharmacies will simply refuse to provide service.
But there is enough confusion in the marketplace, as well as enough loopholes in the 400-page final rules of the program, that pharmacists are nervous about the drug program's long-term ramifications. "On paper, rural pharmacies shouldn't get hurt. But whether it's actually going to play out (that way) on the ground, I have my doubts," said Smith.
To date, Medicare drug plans have reportedly not been offering particularly generous rates. "I am hearing from my colleagues in other states that these (Medicare contract) offers are not very good," said Smith. A Wisconsin pharmacist said most prescription drug plans being peddled have a "no negotiation stance" with regard to reimbursements. With the Medicare administration taking a hands-off approach, "(it) gives us dark reimbursement opportunities."
Cash, check or third party? - fedgazette - Publications & Papers | The Federal Reserve Bank of Minne...
Tuesday, September 03, 2013http://www.minneapolisfed.org/publications_papers/pub_display.cfm?i...
NA. 55

Robert Mann, a pharmacy owner and member of the Montana Board of Pharmacy, said most Medicare drug plans "want to pay us less than the cost of the medication. … They have no idea what it takes to fill a prescription."
As a result, "we're not signing contracts with everyone. … What's in it for us?" Mann asked rhetorically. On some contracts, he said, "I lose money right off the bat. Why should I sign this? I'd be just as (profitable) filling half as many prescriptions." A patchwork pharmacy network means some seniors will get drug service at local pharmacies, others not. "I'd hate to see it come to whose prescription we're going to fill and whose we won't" based on which drug plan a senior chooses, Mann said.
"High-priced fertilizer"
Given various glitches, complaints and design shortcomings of the Medicare drug program, "patchwork" might be generous. Julie Johnson, executive vice president and CEO of the Minnesota Pharmacists Association, pointed out that the sign-up period for seniors didn't begin until November, and the numerous drug plans had to have their networks in place ahead of that. As such, pharmacists have had to guess where their existing clientele would enroll, and which prescription drug plan would attract the most enrollees overall.
"There is no way right now to know who or how many have signed contracts that [plan providers] mail out," said Johnson, by e-mail. "Some pharmacies probably signed up for everything that came in the mail to them. Some have signed none."
Some rural pharmacies might have little choice but to sign on regardless of reimbursement rates. The new federal entitlement likely involves a large portion of their clientele, and refusal to participate in a PDP network would mean its patient base would migrate elsewhere, even if it meant long drives. Several pharmacists noted that patients will go to great lengths to save a few bucks on prescriptions. One Montana pharmacist said small-town loyalty to its pharmacy "is on the wane. Either you take my insurance or I will drive to the end of the earth to find someone who does."
Healthcare providers—including pharmacists—also are prohibited from "facilitating enrollment" in a federal program. As such, pharmacists can only provide general education and are barred from helping patients choose the proper plan for their prescription needs. That irked Andy Peterson, owner of Peterson Pharmacy, located in the southwestern Wisconsin city of Hillsboro, population 1,300. Commenting by e-mail, Peterson said, "Denying pharmacists the opportunity to help patients choose the right plan has undermined the credibility of the whole program."
Peterson has a lot of farmers as clients, and they "have had years of experience listening to big chemical companies selling expensive herbicides and pesticides. … They see drug company salesmanship and marketing in much the same light," he said. "My average, common-sense retired farmer sees the (Medicare prescription drug) program as high-priced fertilizer."
A diamond in the rough start?
Several sources did note some positives from the Medicare drug program for pharmacies in the long run.
Pharmacists, for example, have long complained that they get paid nothing for a critical part of the drug transaction: the consultation with the patient. Unlike doctors, whose business is based on
Cash, check or third party? - fedgazette - Publications & Papers | The Federal Reserve Bank of Minne...
Tuesday, September 03, 2013http://www.minneapolisfed.org/publications_papers/pub_display.cfm?i...
NA. 56

consultations, pharmacists dispense their health wisdom mostly for free. But Medicare Part D will change this for a small but important percentage of enrolled seniors, which could have a big effect on the economics of pharmacies. The program has proposed paying for pharmacist consultations for those enrollees with high drug costs in an effort to help patients better manage chronic illness and moderate overall drug usage, with the expectation that consultations will also help control program costs.
Getting the federal government to pay for consultations "would be a huge leap into our future," said Hill, the state association rep from North Dakota. That's because "the federal government is the biggest healthcare purchaser in the world," and when it gets into something new, the rest of the healthcare market tends to pay attention.
Johnson, from Minnesota, said the intent behind the new Medicare program "is a good one. … For the first time, Medicare will pay for the diagnosis and the treatment. People who could truly not afford prescription drugs will be able to access them now. … The results from this whole benefit will be interesting in a year."
"Let's just hope the pharmacists are still there to serve them."
Top
Cash, check or third party? - fedgazette - Publications & Papers | The Federal Reserve Bank of Minne...
Tuesday, September 03, 2013http://www.minneapolisfed.org/publications_papers/pub_display.cfm?i...
NA. 57

SPD
SPD Documents
1st Amendment
2nd Amendment
3rd Amendment
4th Amendment
5th Amendment
News Letters
Spring 2010
Winter 2009/2010
Fall 2009
Summer 2009
Privacy
Our Privacy Statement
Home Page
About Us
Participating Groups
Fund Partners
Fund History
Contact Us
Why the National Fund
Consistent and Timely Verbal and Written
Responses to Your Participants' Questions
Preparation and Distribution of Required Plan
Documents, including Summary Plan Descriptions
and Summary of Material Modifications
Maintenance of Member Eligibility and Superior
Claim Adjudication
Negotiation of all Contracts with the National
Fund's Service Partners
Administration and Operations are overseen by
Labor and Management Trustees
Leveraged Purchasing Power Resulting in
Managing Costs, Maximizing Discounts and
Reduced Overall Administration Expenses
Spreading of Risk, Producing Reduced Volatility in
Rate Renewals
Flexible Benefit Coverage Elections to Meet Your
NA. 58

Specific Needs
COBRA and HIPAA Administration
Eliminate FASB 106 & SOP 92-6 Liabilities for
Retiree Obligations, (where applicable)
Non-bargaining Employee Coverage Availability
The Value Added Benefits of the National Fund
Financial Matters
All administrative costs are included in the quoted rates
COBRA & HIPAA administration is part of the National Fund's service and the cost is included in the premium
The National Fund allocates assets to fund appropriate levels of reserves for future contingencies
Professional Services
All auditing, legal, banking, administrative and underwriting needs
Constant monitoring of participant needs and developments in the medical, dental, vision, Medicare and prescription drug marketplace
Professional oversight on all National Fund underwriting, financial and investment matters
Plan Design and Network Access
Flexible Benefit options include any or all of the medical, dental, vision, prescription drug, disability or life insurance benefits to suit group's needs
Medical benefits through the Carefirst Blue Cross Blue Shield nationwide PPO network considered to be the most widely recognized accessible network of hospitals and physicians, offering deep discounts
Prescription Drugs through Express Scripts, one of the largest pharmacy networks, including mail order
Dental coverage through Delta Dental using their expansive comprehensive network of providers
NA. 59
Vision benefits with National Vision Administrator
Life and AD&D benefits through Aetna
Non-Bargaining Employees
Employers can cover all of their bargaining andnon-bargaining employees
Management Oversight
Joint Labor and Management Trustee Committee to handle participant appeals
Home | About Us | Participating Groups | Fund Partners | Fund History | Contact Us
NA. 60

SUMMARY PLAN DESCRIPTION
FOR
THE TWIN CITIES BAKERY DRIVERS
HEALTH AND WELFARE FUND
CLASS 5A
SEPTEMBER 2009
NA. 61

ATTENTION:
THE BENEFITS CONTAINED HEREIN DO NOT CONSTITUTE, NOR SHOULD THEY BE CONSTRUED AS CONSTITUTING, A CONTRACT TO PROVIDE FUTURE BENEFITS OR A PRESENT PROMISE FOR A FUTURE BENEFIT. THE TRUSTEES OF THE PLAN HAVE THE RIGHT UPON THIRTY (30) DAYS’ WRITTEN NOTICE TO THE PARTICIPANTS, TO MODIFY, CHANGE, ALTER, REDUCE OR DISCONTINUE ANY OR ALL OF THE BENEFITS PROVIDED BY THE PLAN WITHOUT THE SHOWING OF ANY NECESSITY THEREFORE.
NOTHING IN THIS SUMMARY PLAN DESCRIPTION IS MEANT TO INTERPRET OR EXTEND OR CHANGE IN ANY WAY THE PROVISIONS EXPRESSED IN ANY INSURANCE POLICIES THAT ARE PART OF THE PLAN OF BENEFITS OFFERED BY THIS TRUST FUND.
THIS DOCUMENT IS EFFECTIVE SEPTEMBER 1, 2009
NA. 62

20939.2i
TABLE OF CONTENTS
Page
Part I General Information .................................................................................................................... 11.1 General Plan Information ................................................................................................ 11.2 Trustees of the Twin Cities Bakery Drivers H&W Fund ..................................................... 21.3 Plan Sponsor .................................................................................................................. 21.4 Funding for Plan Benefits ................................................................................................ 21.5 Agent for Service of Legal Process .................................................................................... 31.6 Trustees Rights and Powers ............................................................................................. 3
Part II Employee and Dependent(s) Eligibility .......................................................................................... 42.1 Eligibility ........................................................................................................................ 42.2 Effective Date of Individual Coverage .............................................................................. 42.3 Change in Classification or the Amount of Coverage ........................................................ 42.4 Termination of Individual Coverage ................................................................................. 42.5 Eligibility After Termination of Coverage .......................................................................... 52.6 Retired Employees’ Eligibility .......................................................................................... 52.7 Dependent Eligibility ...................................................................................................... 62.8 Dependents Not Eligible ................................................................................................. 72.9 Effective Date of Dependent Coverage ............................................................................. 72.10 Exceptions to Effective Date of Dependent Coverage ........................................................ 82.11 Termination of Dependent Coverage ............................................................................... 8
Part III Benefits ...................................................................................................................................... 83.1 Medical Benefits ............................................................................................................. 83.2 Weekly Disability Benefits .............................................................................................. 83.3 Preferred Provider Organization Network ......................................................................... 93.4 Class 5A Schedule of Benefits .......................................................................................... 93.5 Cost Containment Provisions ......................................................................................... 123.6 Out of Network Deductible ........................................................................................... 123.7 Exception to Out of Network Benefit ............................................................................. 133.8 Maximum Payment for All Coverage Under the Plan....................................................... 133.9 Room Charge Limit ....................................................................................................... 133.10 Covered Services In and Out of Network ........................................................................ 133.11 Emotionally Handicapped Child..................................................................................... 153.12 Scalp Hair Prosthesis...................................................................................................... 153.13 Ambulatory Medical-Surgical Center .............................................................................. 153.14 Dental Exclusion ........................................................................................................... 153.15 Ventilator-Dependent .................................................................................................... 153.16 Clef Lip and Clef Palate ................................................................................................. 163.17 Preexisting Conditions Provision .................................................................................... 163.18 Routine Cancer Screening ............................................................................................. 163.19 Child Health Supervision Services and Prenatal Care Services ......................................... 173.20 Dietary Treatment for Phenylketonuria (PKU).................................................................. 173.21 Extended Benefits ......................................................................................................... 173.22 Special Provisions ......................................................................................................... 183.23 Chiropractic Network .................................................................................................... 18
Part IV General Exclusions – Medical..................................................................................................... 184.1 General Exclusions ........................................................................................................ 18
NA. 63

20939.2ii
Part V Life Insurance Benefit ................................................................................................................ 215.1 Participant Life Insurance .............................................................................................. 215.2 Termination of Insurance .............................................................................................. 21
Part VI Accidental Death and Dismemberment Benefit ........................................................................... 22
Part VII Family Service Benefit ............................................................................................................... 22
Part VIII Vision Benefit ........................................................................................................................... 23
Part IX Reserved ................................................................................................................................... 24
Part X Coordination of Benefits (COB) .................................................................................................. 2410.1 How it Works................................................................................................................ 2410.2 Order of Benefit Determination .......................................................................... 2410.3 How COB Affects Benefit Limits .................................................................................... 2610.4 Right to Collect and Release Needed Information ........................................................... 2610.5 Facility of Payment ....................................................................................................... 2610.6 Right of Recovery ......................................................................................................... 2610.7 Definitions ................................................................................................................... 26
Part XI Cost Containment Provisions ..................................................................................................... 2711.1 Experimental ................................................................................................................ 2711.2 Hospital Confinement Review........................................................................................ 2711.3 Effect on Benefits .......................................................................................................... 2811.4 Review Requirement for Hospital Confinement .............................................................. 2811.5 Case Management Program ........................................................................................... 2911.6 Eligible for the Case Management Program .................................................................... 2911.7 Second Opinion Program .............................................................................................. 3011.8 Second Opinion Program Requirements ........................................................................ 3011.9 Benefits Limitation on Procedures for Which Second Opinion Is Mandatory..................... 3111.10 Procedures Which Require Second Opinion .................................................................. 3111.11 Mental and Nervous Disorders, Alcohol and Drug Abuse Outpatient Review Provision..... 3211.12 Outpatient Review Requirements .................................................................................. 33
Part XII Medicare Coordination of Benefits ............................................................................................. 3312.1 When This Provision is Applicable ................................................................................. 3312.2 Rules for Determining Order of Benefits ........................................................................ 3412.3 Definitions ................................................................................................................... 35
Part XIII Payment of Claims..................................................................................................................... 3513.1 How to File Claims under the In-Network PPO Provision ................................................ 3513.2 How to File Other Claims .............................................................................................. 3513.3 Proof of Loss Requirements (Out of Network).................................................................. 3613.4 Proof of Loss Requirements Out of Network (For Dental Benefits) .................................... 3613.5 When Claims Are Paid................................................................................................... 3713.6 Appeal Procedure ......................................................................................................... 3713.7 Manner of Claims Payment ........................................................................................... 4113.8 Overpayment of Claims ................................................................................................ 4113.9 Examination and Autopsy............................................................................................... 4113.10 Changes in Plan Benefits ............................................................................................... 4113.11 Right of Recovery-Subrogation Provision ........................................................................ 4113.12 ERISA Rights ................................................................................................................. 4313.13 Notice Regarding Childbirth........................................................................................... 45
NA. 64
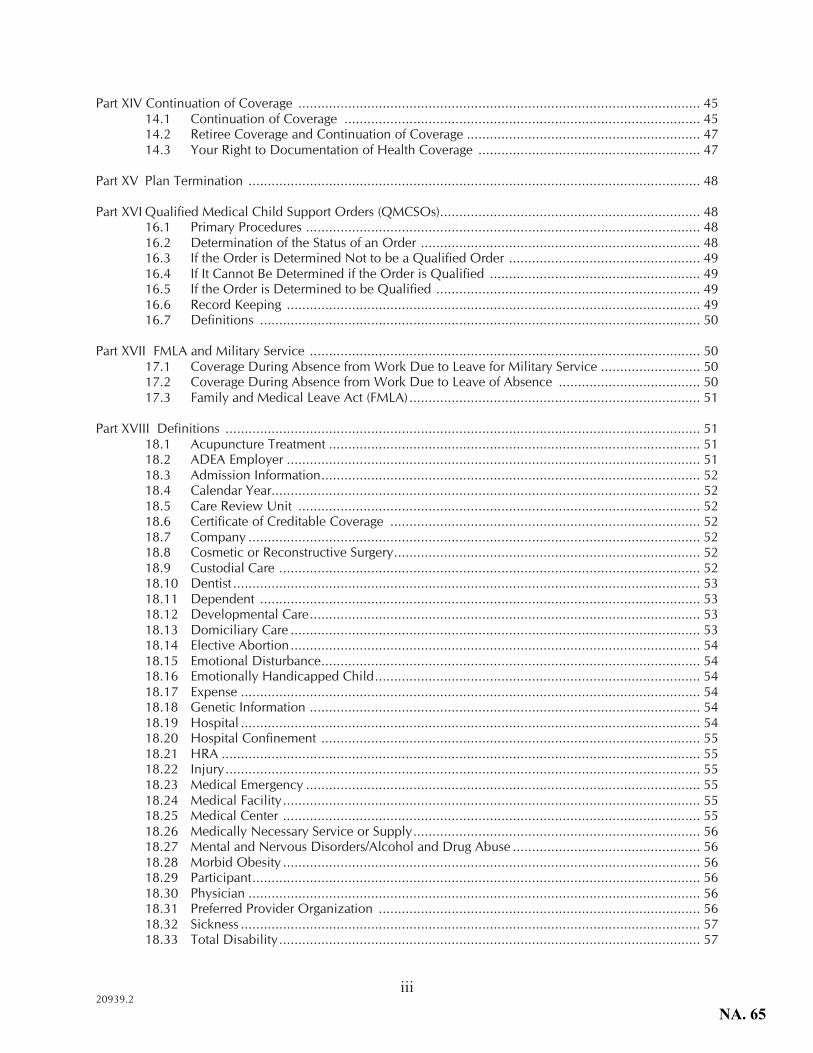
20939.2iii
Part XIV Continuation of Coverage ......................................................................................................... 4514.1 Continuation of Coverage ............................................................................................. 4514.2 Retiree Coverage and Continuation of Coverage ............................................................. 4714.3 Your Right to Documentation of Health Coverage .......................................................... 47
Part XV Plan Termination ...................................................................................................................... 48
Part XVI Qualified Medical Child Support Orders (QMCSOs).................................................................... 4816.1 Primary Procedures ....................................................................................................... 4816.2 Determination of the Status of an Order ......................................................................... 4816.3 If the Order is Determined Not to be a Qualified Order .................................................. 4916.4 If It Cannot Be Determined if the Order is Qualified ....................................................... 4916.5 If the Order is Determined to be Qualified ..................................................................... 4916.6 Record Keeping ............................................................................................................ 4916.7 Definitions ................................................................................................................... 50
Part XVII FMLA and Military Service ...................................................................................................... 5017.1 Coverage During Absence from Work Due to Leave for Military Service .......................... 5017.2 Coverage During Absence from Work Due to Leave of Absence ..................................... 5017.3 Family and Medical Leave Act (FMLA)............................................................................ 51
Part XVIII Definitions ............................................................................................................................ 5118.1 Acupuncture Treatment ................................................................................................. 5118.2 ADEA Employer ............................................................................................................ 5118.3 Admission Information................................................................................................... 5218.4 Calendar Year................................................................................................................ 5218.5 Care Review Unit ......................................................................................................... 5218.6 Certificate of Creditable Coverage ................................................................................. 5218.7 Company ...................................................................................................................... 5218.8 Cosmetic or Reconstructive Surgery................................................................................ 5218.9 Custodial Care .............................................................................................................. 5218.10 Dentist .......................................................................................................................... 5318.11 Dependent ................................................................................................................... 5318.12 Developmental Care...................................................................................................... 5318.13 Domiciliary Care ........................................................................................................... 5318.14 Elective Abortion........................................................................................................... 5418.15 Emotional Disturbance................................................................................................... 5418.16 Emotionally Handicapped Child..................................................................................... 5418.17 Expense ........................................................................................................................ 5418.18 Genetic Information ...................................................................................................... 5418.19 Hospital ........................................................................................................................ 5418.20 Hospital Confinement ................................................................................................... 5518.21 HRA ............................................................................................................................. 5518.22 Injury............................................................................................................................ 5518.23 Medical Emergency ....................................................................................................... 5518.24 Medical Facility............................................................................................................. 5518.25 Medical Center ............................................................................................................. 5518.26 Medically Necessary Service or Supply........................................................................... 5618.27 Mental and Nervous Disorders/Alcohol and Drug Abuse ................................................. 5618.28 Morbid Obesity ............................................................................................................. 5618.29 Participant..................................................................................................................... 5618.30 Physician ...................................................................................................................... 5618.31 Preferred Provider Organization .................................................................................... 5618.32 Sickness ........................................................................................................................ 5718.33 Total Disability.............................................................................................................. 57
NA. 65

20939.2iv
18.34 Usual and Customary Charge ......................................................................................... 57
Part XIX Voluntary Termination of Health and Welfare Coverage by Individual Participants ....................... 57
Part XX Women’s Health Care and Cancer Rights Act of 1998 ................................................................. 58
Part XXI Genetic Information................................................................................................................... 58
Part XXII HIPPA Privacy Rights .............................................................................................................. 59
Exhibit A Subrogation/Reimbursement Agreement...................................................................... 60
Exhibit B Voluntary Termination of Participation in Fund ........................................................... 63
Exhibit C Notice of Privacy Practices ........................................................................................ 65
Part XXIII Health Reimbursement Arrangement ...................................................................................... 72
Part XXIV Dental Benefits....................................................................................................................... 7423.1 Dental Benefits ............................................................................................................. 7423.2 Benefits Provided .......................................................................................................... 7423.3 Dental Exclusion ........................................................................................................... 77
NA. 66

20939.2 9
causes entirely unrelated and begin after you have returned to full-time active work and have completed one day of continuous active work.
3.3 PREFERRED PROVIDER ORGANIZATION NETWORK: The Twin Cities Bakery Drivers Health and Welfare Fund participates in a Preferred Provider Organization (PPO) network currently sponsored by Blue Cross Blue Shield of Minnesota. PPO networks are arrangements whereby Hospitals, Physicians, and other providers are contracted to furnish, at negotiated costs, medical care for the employees and their Eligible Dependents of participating employers.
A current listing of the participating Hospitals, Physicians and other providers can be found on the Blue Cross Blue Shield of Minnesota Web Site at www.bluelinktpamn.com or by calling Blue Card Access® at 1-800-810-2583.
The Plan’s participation in the PPO will result in significant savings of funds needed to maintain the Plan. These savings are passed on to the Participants in the form of higher plan benefits payable for services received by a Participant or Eligible Dependent from Preferred Providers.
3.4 Class 5A Schedule of Benefits
Your group is Self-Insured through the Twin Cities Bakery Drivers Health and Welfare Fund. The Twin Cities Health and Welfare Fund utilizes the BlueCross/BlueShield Blue Link Network of Providers.
GENERAL INFORMATION
IN-NETWORKBlueCross BlueShield
Blue Link Network
OUT-OF-NETWORK
CALENDAR YEAR DEDUCTIBLE
Per IndividualPer Family
$1,500$3,000
$1,500$3,000
HEALTH REIMBURSEMENT ARRANGEMENT (Please see the Health Reimbursement Arrangement Section
in the Back of this SPD)
(Please see the Health Reimbursement Arrangement Section
in the Back of this SPD)
CALENDAR YEAR OUT-OF-POCKET MAXIMUM
Per IndividualPer Family
After satisfying the In-Network Deductible expenses will be paid at
100%. (With the exception any applicable Co-pay)
After satisfying the Out-of-Network Single or Family Deductible expenses
will be paid at 80%
LIFETIME MAXIMUM $1,000,000 $1,000,000
NA. 67

20939.2 10
PREVENTIVE SERVICES
IN-NETWORKBlueCross BlueShield
Blue Link Network
OUT-OF-NETWORK
• Routine Physicalo Once in a 12-month period
• Immunizations• Well Child Care• Cancer Screenings
100%
100%100%100%
Maximum Benefit Payable: $100(ages 6 to adult)
80% after deductible80% after deductible80% after deductible
MEDICAL SERVICES
IN-NETWORKBlueCross BlueShield
Blue Link Network
OUT-OF-NETWORK
IN-PATIENT HOSPITAL SERVICES
• Semi Private Room and Board• Intensive Care Unit• Ancillary Services and Supplies• Anesthesiology• Pathology and Radiology Fees
100% Coverage
Subject to Deductible &$500 co-pay
(maximum of 3 co-pays per year)
80% after deductible
Pre-certification is required through the BCBS PAN program.
If an emergency please contact BCBS within 48 hours
OUT-PATIENT MEDICAL SERVICES
Office Calls/Visits and Related Expenses. Including:• X-ray and Lab Tests• Injections• Schedules Diagnostic and
Therapeutic Services• Pre-Admission Tests• Ambulatory Surgery
100% Coverage
Subject to Deductible & $25 co-pay
80% after deductible
EMERGENCY CARE 100% Coverage
Subject to Deductible & $25 co-pay
Covered at 80% of the first $1,000 eligible expenses, the remainder will be paid at 100% of Usual and Customary Charges
(per occurrence/per individual).
NA. 68

20939.2 11
MENTAL HEALTH and CHEMICAL DEPENDENCY BENEFIT
MENTAL HEALTH BENEFIT
CHEMICAL DEPENDENCY BENEFIT
Inpatient treatment by a Hospital or qualified Residential Treatment Facility.
100% Coverage
Subject to Deductible &$500 co-pay
(maximum of 3 co-pays per year)
80% after deductible
Outpatient treatment by a Hospital or qualified Residential Treatment Facility
100% Coverage
Subject to Deductible & $25 co-pay
80% after deductible
OTHER COVERED SERVICESIN-NETWORK
BlueCross BlueShield Blue Link Network
OUT-OF-NETWORK
ACUPUNCTURE 100%Subject to Deductible &
$25 co-pay
80% after Deducible
HOSPICE • Care of Terminal Illness
100%Subject to Deductible &
$25 co-pay
80% after Deductible
VISION BENEFIT• Exam (once in a 24-month period)• Materials (once in a 24-month
period)
100% after a $25 co-payMaximum reimbursement on Materials
of $150In lieu of Materials lasik eye surgery
paid up to $205
Maximum Reimbursement to $55Maximum Reimbursement to $150
WEEKLY DISABILITY BENEFIT• Weekly Benefit• Maximum Number of Weeks• Waiting Period
o AccidentIllness
$30018 Weeks
0 Days7 Days
Not Applicable
CHIROPRACTIC SERVICESIN-NETWORK
BlueCross BlueShield Blue Link Network
OUT-OF-NETWORK
Chiropractic Benefit• Maximum of 30 visits per year• No Coverage for children under 10
years of age
100% Subject to Deductible &
$25 co-pay
No Coverage
NA. 69

20939.2 12
PHARMACY SERVICESIN-NETWORK
Caremark Pharmaceutical Network
OUT-OF-NETWORK
PHARMACY BENEFIT(No Coordination of Benefits)
• Retail (34 Day Supply)
• Mail Order Prescription
Maximum Yearly Reimbursement of $30,000 (increased from $20,000
effective January 1, 2009)100% after a $25 Co-pay
100% after a $25 Co-pay(90-day Supply)
80% after Deductible
LIFE INSURANCEKANAWHA INSURANCE COMPANY
Term Life Insurance Benefit• Eligible Employee
$10,000 Not Applicable
Listed Below is a brief Summary of the Twin Cities Bakery Drivers Health and Welfare Fund’s Dental Benefit.
DENTAL SERVICES IN-NETWORKFormula Dental Networkwww.formuladental.com
OUT-OF-NETWORKBenefits are paid to the Formula Dental Usual and Customary Fee
ScheduleDENTAL BENEFIT• Office Visit• Diagnostic & Preventive Care• Basic Restorative• Major Restorative & Prosthetics• Maximum Calendar Year Benefit
• Orthodontic Serviceso Dependent Children Only
(Dependent children under age 19)
$25 Co-pay100%100%80%
$1,200
50%$1,000 lifetime benefit
$25 Co-pay100%100%80%
$1,000
50%$1,000 lifetime benefit
3.5 COST CONTAINMENT PROVISIONS: In order to provide cost effective health coverage, the Plan contains the following Cost Containment Provisions: Hospital Confinement Review, Case Management Program, Second Opinion Program, Mental and Nervous Disorders, Alcohol and Drug Abuse Outpatient Review.
3.6 OUT-OF-NETWORK DEDUCTIBLE:
INDIVIDUAL DEDUCTIBLE: $1,500 of expense incurred for covered services. The Participant or Eligible Dependent must satisfy the Deductible once each calendar year.
FAMILY DEDUCTIBLE: After $3,000 of expense has been incurred for covered services and applied toward the Deductible by all covered family members combined in a calendar year, no other covered family member must satisfy the Deductible in that calendar year.
NA. 70

DRAFT
The Centers for Medicare & Medicaid Services
Part II:
Draft Methodology for Calculating
the National Average Drug
Acquisition Cost
(NADAC)
May 2012
NA. 71

Draft Methodology for Calculating the NADAC – National Average Drug Acquisition Cost
Table of Contents
Background ..................................................................................................................... 3
Purpose ........................................................................................................................... 5
Level of Reporting ........................................................................................................... 6
Data Sources ................................................................................................................. 9
Data Collection - Monthly Survey Process ................................................................... 10
Processing of Survey Data ............................................................................................ 12
National Average Drug Acquisition Cost (NADAC) Calculation ..................................... 14
NADAC Updates ........................................................................................................... 18
Quality Assurance ....................................................................................................... 211
Help Desk Support Functions ........................................................................................ 22
Deliverables ................................................................................................................. 23
Glossary ...................................................................................................................... 267
Appendix ....................................................................................................................... 28
DRAFT 2
NA. 72
Draft Methodology for Calculating the NADAC – National Average Drug Acquisition Cost
Background
Section 1927(f) of the Social Security Act provides, in part, that CMS may contract with a vendor to conduct monthly surveys with respect to retail community pharmacies of retail prices for covered outpatient drugs.
The first part of the survey (Part I) focuses on the retail community pharmacy consumer prices. The Part I methodology will be disseminated for review and comment in another document.
This part of the survey, which is the second part (Part II), will focus on the retail community pharmacy ingredient costs. This will provide for a survey of the acquisition costs of covered outpatient drugs purchased by retail community pharmacies, which will include purchase prices derived from independent community pharmacies and chain pharmacies.
Section 1927(f) also provides for the calculation of the monthly national retail community pharmacy prices of covered outpatient drugs. It includes reporting by the States of payment and certain utilization rates for the 50 most widely prescribed drugs, and comparing State drug payment rates with the national retail survey prices.
State Medicaid agencies reimburse participating pharmacy providers for covered outpatient drugs that are prescribed and dispensed to Medicaid beneficiaries. The payment consists of two parts: 1) reimbursement for drug ingredient costs, and 2) reimbursement for dispensing costs. In general, Federal regulations require that Medicaid reimburse for drug ingredient costs at no more than the agency‟s best
estimate of the acquisition cost for a drug. As defined in Federal regulations at § 42 CFR 447.502, the estimated acquisition cost (EAC) is the State‟s best estimate of the acquisition cost generally and currently paid by Medicaid-participating pharmacies for a drug marketed or sold by manufacturers or labelers in the package size of the drug most frequently purchased by providers. Most Medicaid agencies currently utilize published drug pricing benchmarks to determine the EAC for drug ingredient costs.
The Average Wholesale Price (AWP) is a key drug pricing benchmark that, until recently, was commonly utilized as one of the standards in pharmaceutical reimbursement by State Medicaid agencies. However, this benchmark has been the subject of scrutiny and litigation stating that many AWPs were artificially inflated. The effect of this inflation could result in an overstatement of estimated acquisition costs and consequently the overpayment for drugs by State Medicaid agencies. Through numerous investigations, the Office of Inspector General found that AWP-based
DRAFT 3
NA. 73

Draft Methodology for Calculating the NADAC – National Average Drug Acquisition Cost
reimbursement was “fundamentally flawed” and caused Medicaid to pay too much for
certain drugs.1
In part as a result of litigation concerning AWP, drug pricing compendia have reversed the inflated prices listed in the published AWP, effective September 2009. In addition to this change, a pharmacy data publisher of AWP chose to discontinue publication of AWP in September 2011, further creating a need for alternative methods for states to determine drug ingredient costs. Utilization of other published drug pricing benchmarks is an option that States commonly consider. Such alternatives include Wholesale Acquisition Cost (WAC), Average Sales Price (ASP), and Direct Price (DP). In late 2009, a working group within the National Association of State Medicaid Directors (NASMD) convened to discuss the various considerations related to this topic. The working group authored a white paper in June 2010 entitled “Post AWP Pricing and
Reimbursement” that evaluated the issues and developed options for the replacement of AWP in reimbursement methodologies. Among the recommendations presented in the white paper was the establishment of a single national price benchmark for pharmacy reimbursement based on average drug acquisition costs. Such a benchmark would provide State Medicaid agencies with a better estimate of prices paid by pharmacies for drugs because it would be based upon actual drug purchase experience. This approach to drug ingredient price determination provides greater accuracy and transparency in how drug prices are established. The NASMD requested that CMS coordinate, develop, and support this benchmark. Section 1927(f) of the Social Security Act provides, in part, that CMS may contract with a vendor to conduct monthly surveys with respect to retail community pharmacies of retail prices for covered outpatient drugs. The statute provides that such prices represent a nationwide average of consumer purchase prices, net of discounts and rebates. The statute further contemplates that the contractor provide notification when a drug product becomes generally available and that the contract include such terms and conditions as the Secretary shall specify, including a requirement that the vendor monitor the marketplace. CMS expects that ingredient cost data would provide information to assist CMS in carrying out its responsibilities and to the States in setting drug payment rates through the state plan amendment process. The National Average Drug Acquisition Cost (NADAC) file will allow for covered outpatient drug products to be reimbursed more effectively.
Purpose
1 Replacing Average Wholesale Price: Medicaid Drug Payment Policy. Office of Inspector General. July 2011,
http://www.oig.hhs.gov/oei/reports/oei-03-11-00060.pdf
DRAFT 4
NA. 74
Draft Methodology for Calculating the NADAC – National Average Drug Acquisition Cost
The purpose of the NADAC is to create a new national price benchmark that is more reflective of the prices that pharmacies pay to acquire prescription and over-the-counter drugs. The statute provides that such prices represent a nationwide average of consumer purchase prices, net of discounts and rebates. The survey data will provide information which CMS expects to use to assure compliance with Federal requirements.
A monthly nationwide survey of licensed retail community pharmacies, which will include independent pharmacies and chain pharmacies in the United States, will be performed to collect drug acquisition cost information. To ensure that NADACs are accurate, timely, and robust, the NADACs will be reviewed and updated on a weekly basis. The NADAC will be available for consideration by the States to assist with their individual pharmacy reimbursement policies.
CMS has contracted with Myers and Stauffer LC, a national certified public accounting firm, to conduct the surveys of drug ingredient costs from pharmacy entities, such as independent pharmacies and chain pharmacies in the United States, and to develop and maintain the NADAC pricing benchmark.
Level of Reporting
The NADAC for prescription and over-the-counter covered outpatient drug products will be calculated at the drug grouping/drug category/pharmacy type level, and reported at the 11-digit National Drug Code (NDC) level.
Drug grouping will allow the same NADAC to be applied to the NDCs of identical products. It is based on the active ingredient(s), strength, dosage form, and route of administration. NDCs for drugs that are therapeutically and pharmaceutically equivalent will belong to the same drug grouping. In some cases, additional parameters are included in the definition of a drug grouping. For example, package size will be included for additional delineation when there is a demonstrated variance of acquisition costs among package sizes for drugs in which the most cost effective package size cannot be purchased and easily repackaged for dispensing (e.g., topical creams and ointments).
Drug category is obtained from the most recent quarterly CMS covered outpatient drug product file. It classifies each NDC listed in the file as one of the following: Single source (S), Innovator multiple source (I), or Non-innovator multiple source (N). NDCs designated as S and I will be considered S or I drugs and NDCs designated as N will be considered N drugs for purposes of the NADAC calculation. S or I drugs will have separate NADACs than N drugs. A drug grouping may have an S/I drug and an N drug
DRAFT 5
NA. 75

Draft Methodology for Calculating the NADAC – National Average Drug Acquisition Cost
NADAC if NDCs with those drug categories are included in the drug grouping. An NDC will only have an S/I drug, or an N drug NADAC; it will not be assigned both.
The S/I/N designation in the covered outpatient drug product file is related to a drug‟s
rebate status but may not always correspond with the manner in which States classify a drug for reimbursement purposes. In cases where the S/I/N designation for an NDC does not correspond with the designation that the States use for drug reimbursement, an override process will be implemented to ensure that the calculation of the NADAC reflects reimbursement policy. The override process will consist of the following steps:
The S/I/N designation of each NDC in the Covered Outpatient Drug product file will be compared to the brand/generic designation of State reimbursement methodology to identify cases in which they commonly conflict.
CMS will review and approve the proposed S/I/N overrides for NADAC calculation purposes.
The goal of the override process is to address cases where the S/I/N designation would not accurately reflect the reimbursement policy utilized by the States, for example when an “S” drug has therapeutic equivalents.
Pharmacy entity type is the identification of a pharmacy as chain or independent. The pharmacy type is obtained from a national self-reported pharmacy identification database. However, other supplemental resources may be used to verify the pharmacy type. There will be separate NADACs based on drug costs collected from different types of pharmacy entities, such as independent pharmacies and chain pharmacies in the United States. The NADACs for each pharmacy entity type will be based upon the acquisition costs obtained through survey from the corresponding pharmacy entity types. These price lists are not mutually exclusive so a drug grouping may appear with NADACs from different pharmacy entity types, though these NADACs would be based on acquisition costs from each respective pharmacy entity type. A Pharmacy Entity Type field in the reference file will distinguish between different types of pharmacy entities.
The designation of these three indicators will determine which NADAC will be applicable to a given situation. The following example illustrates this concept.
Example 1:
Drug NADACs Drug Grouping Drug Category Pharmacy Entity Type NADAC
DRAFT 6
NA. 76

DRAFT 7
Draft Methodology for Calculating the NADAC – National Average Drug Acquisition Cost
Lipitor (atorvastatin) 10mg tablets
S/I C/I 2.00000
N C/I 1.00000
NA. 77

Draft Methodology for Calculating the NADAC – National Average Drug Acquisition Cost
Drug NADACs applied to individual NDCs Drug
Grouping NDC
Drug
Category1
Pharmacy
EntityType2 NADAC
Lipitor 10mg tablet
xxxxx-xxxx-xx I C/I 2.00000
xxxxx-xxxx-xx I C/I 2.00000
atorvastatin 10mg tablet xxxxx-xxxx-xx N C/I 1.00000
1 Drug Category values in this example are reported on CMS Quarterly Covered Outpatient Drug product file. 2Pharmacy Entity Type C/I = Chain and independent pharmacies. Note: This example does not illustrate the contents of the NADAC file, show actual NADACs, or list all NDCs for these drug groupings.
This example illustrates the assignment of NADACs based on drug grouping, drug category and pharmacy type. All NDCs for Lipitor (atorvastatin) 10mg tablets would classified into one drug grouping since they contain the same combination of active ingredient, strength, dosage form, and route of administration. However, NDCs for Lipitor (atorvastatin) 20mg tablets would be classified into a separate drug grouping, due to the different strengths (10mg versus 20mg).
In the Lipitor (atorvastatin) example, these NDCs reflect drug products that are availaonly from chain and independent pharmacies; therefore the pharmacy type for the thrNDCs is the same. However, since the drug category differs, the NADAC assigned tthe NDCs for Lipitor differs from the NDC for atorvastatin.
DRAFT 8
be
ble ee o
NA. 78

Draft Methodology for Calculating the NADAC – National Average Drug Acquisition Cost
Data Sources
Myers and Stauffer LC will work with numerous data sources in order to facilitate the collection, calculation, analysis and reporting of the NADAC.
Pharmacy drug acquisition data will be collected through monthly surveys of pharmacy entities (e.g., independent pharmacies and chain pharmacies in the United States)).
Drug identification and published pricing information will be obtained from multiple national drug pricing compendia in order to verify that NDCs meet certain NADAC criteria, such as whether their status is valid and active, and if their Medicaid drug rebate DESI code is 5 or 6, for purpose of excluding these from NADAC calculations (refer to the NADAC Calculation section in this document for details).
A national pharmacy compendia file will be used to identify individual pharmacy characteristics for the survey sample selection and data analysis processes.
The covered outpatient drug product file will be obtained from Medicaid.gov to use in the NADAC criteria evaluation.
DRAFT 9
NA. 79

Draft Methodology for Calculating the NADAC – National Average Drug Acquisition Cost
Data Collection – Monthly Survey Process
On a monthly basis, Myers and Stauffer LC will collect acquisition cost data from a random sample of pharmacies selected from all 50 states and the District of Columbia. There will be a survey of pharmacy entities (e.g., independent pharmacies and chain pharmacies in the United States). National pharmacy compendia files containing information on the retail pharmacies throughout the country will be used to determine the pool of providers eligible for each survey.
Chain and Independent Pharmacy - A random sample of approximately 2,000-2,500 chain and independent pharmacies will be generated on a monthly basis. The sample is drawn from the overall population of such pharmacies. Each month, all such pharmacies are eligible to be selected for the monthly sample. Given the large number of chain and independent pharmacies nationwide (over 60,000), there is less than a 5 percent chance that a pharmacy will be selected twice in a year for a survey. The appendix contains a comparison of the distribution of pharmacy entity characteristics between a survey sample and the pharmacy population. It shows that the composition of the survey sample closely aligns with the composition of the pharmacy population with regards to pharmacy characteristics.
Specialty Pharmacy - Specialty pharmacies will be excluded from the survey at this time. These specialty pharmacies are identified by their classification as primarily specialty pharmacies on the National Council for Prescription Drug Programs (NCPDP) database. Furthermore, the URAC specialty pharmacy certification list is used to identify additional specialty pharmacies for exclusion from the initial survey
Survey Process – Prior to the first of each month, survey letters will be mailed to the physical location address of each selected pharmacy. The survey will request the voluntary submission of drug acquisition cost data from the previous month. Pharmacies will be asked to submit the requested information within 2 weeks. Upon request, survey letters can also be emailed to a pharmacy or, in the case of chain providers, a corporate contact. Reminders will be sent via electronic mail to pharmacies within 10 to 14 days.
Survey Request – Pharmacies are requested to submit information on all covered outpatient drug purchases made from all wholesalers or manufacturers over the specified time period. Information requested through the survey consists of a minimum of the following:
NDC Unit Price Paid
DRAFT 10
NA. 80

Draft Methodology for Calculating the NADAC – National Average Drug Acquisition Cost
Invoice Date Quantity Purchased
These items listed will be the only information obtained from submitted documents that will be retained for use in calculating the NADAC. Other information from the submissions will not be used.
We understand this information is found on documentation that is already maintained in the pharmacy and is readily available. Data will be accepted in hard copy and electronic formats. The time needed to respond to the survey request should take no more than 30 minutes of non-pharmacist staff time. Many pharmacy inventory systems have functionality that allows pharmacies to produce and send a report that includes the requested information. In addition, another option for pharmacies to respond to the surveys is to contact their wholesalers to produce and send the requested information on their behalf. Pharmacy invoices that reflect drugs purchased through the 340B program will be excluded. For purposes of this survey, discounts or rebates that are not listed on the invoice will not be collected. In addition to information on drug purchases, pharmacies will be requested to send the cover sheet that accompanies the survey letter. This cover sheet indicates the pharmacy‟s intent for its submitted information to
remain confidential. If the cover sheet is not included in the pharmacy‟s submission, Myers and Stauffer LC will attempt to contact the pharmacy to confirm the intent to exclude the cover letter. Refer to the appendix of this document for a sample of the survey letter and cover sheet.
DRAFT 11
NA. 81

Draft Methodology for Calculating the NADAC – National Average Drug Acquisition Cost
Processing of Survey Data
Data submitted for the survey will be accepted in many formats. Pharmacies or their wholesalers can submit their acquisition costs in electronic format via electronic mail delivery, send hard copy duplicates via postal mail, or transmit submissions via facsimile.
As responses are received, several tasks are performed to process the submissions. Pharmacy submissions are tracked in a receipt log to ensure that survey responses are counted. Whether a pharmacy has marked its submission as confidential is tracked. In cases where the pharmacy has not indicated that data provided are confidential, Myers and Stauffer LC will attempt to contact the pharmacy to clarify whether this omission was intentional. If the pharmacy chooses to indicate that its submission is confidential, the pharmacy will be asked to also submit the cover letter that accompanies the survey letter to request confidentiality.
Data will be reviewed to ensure that costs entered into the database reflect the submitted data and that the NDCs are valid and active. Myers and Stauffer LC may contact pharmacies that submitted survey data to clarify questions about the submissions. Drug prices that are found to be equal to or greater than AWP will not be entered into the database. Refer to the background section of this document for further discussion on the AWP and drug prices. If required information (e.g. NDC information) is not submitted or does not appear to be reasonable (e.g. unit cost is equal to or greater than AWP), the submission will be excluded from consideration in the calculation of the NADAC.
After preliminary reviews of the cost data, the data will be loaded into a database in order to be eligible for use in the NADAC calculation.
Data received in electronic format are directly entered into the database. Submissions received in hard copy are manually entered into the database. After data entry is complete, quality assurance procedures will be applied to ensure that data are accurately and completely entered. Such procedures include comparisons between the actual submitted documents and related database entries, and reconciliation between numbers of data lines submitted electronically versus those entered into the database for individual pharmacies.
All submitted survey responses will be stored in a secure and confidential manner. Hard copy files are stored in a locked environment and eventually returned to CMS or destroyed upon CMS direction in accordance with the federal records retention
DRAFT 12
NA. 82

Draft Methodology for Calculating the NADAC – National Average Drug Acquisition Cost
requirements. All information submitted is the property of CMS, and Myers and Stauffer LC is prohibited from utilizing this data for any purpose other than as directed by CMS.
DRAFT 13
NA. 83

Draft Methodology for Calculating the NADAC – National Average Drug Acquisition Cost
National Average Drug Acquisition Cost (NADAC) Calculation
These processes apply to NADAC calculations for various entities (e.g., independent pharmacies and chain pharmacies in the United States).
Prior to any calculations, the data are classified according to: Drug Category: Single source (S), Innovator multiple source (I), or Non-innovator
multiple source (N)
Pharmacy Entity Type: chain and independent pharmacy (C/I)
In order to be included in the NADAC calculations, the data must satisfy the following criteria:
Data must be from surveyed pharmacies.
Cost data must be for valid, active NDCs listed in published pricing compendia. Obsolete NDCs are excluded from NADAC calculations.
Invoice date must be for the calendar month under review.
Products must be on the latest CMS covered outpatient drug product file or new drugs determined as covered outpatient drugs as defined by section 1927 of the Social Security Act.
Products must not have a code that indicates that it has been declared less than effective by the Drug Product Efficacy Study and Implementation (DESI) program. Such drugs, identified by having a DESI code of either 5 or 6, will be excluded. DESI codes will be obtained from the CMS covered outpatient drug product file.
A product must include only one cost observation per NDC per pharmacy. If a pharmacy submits more than one cost observation for the same NDC, the cost with the latest date of purchase will be used. If a pharmacy submits more than one cost observation for the same NDC with the same purchase date, the lowest cost will be used.
A minimum number of reported drug costs for each drug grouping/drug category/ pharmacy type will be required to calculate a NADAC. This minimum number will be
DRAFT 14
NA. 84

Draft Methodology for Calculating the NADAC – National Average Drug Acquisition Cost
determined in accordance with the initial pharmacy drug acquisition cost surveys received.
The NADAC for each classification defined by drug grouping, drug category, and pharmacy type will be calculated as the average of the per-pricing unit costs, in accordance with (National Council for Prescription Drug Programs) NCPDP standards, weighted by the submitted acquisition costs. Cost observations greater than +/- two standard deviations from the mean are removed as outliers. This approach eliminates values that are substantially inconsistent with the majority of observations, while retaining at least 95% of the values to calculate a revised mean. The dispersion of the prices is measured by the standard deviation. A drug-by-drug review for reasonableness will be also conducted. Once the outliers are removed, the average of the per-pricing unit costs will be re-calculated.
Since the primary purpose of the drug category field in the CMS covered outpatient drug product file is to support the Medicaid Drug Rebate Program (MDRP), it is necessary to make some adjustments to the application of these values to ensure their usefulness for NADAC calculation purposes. Cost data for single source („S‟) and innovator multiple source („I‟) products will be separated from non-innovator multiple source („N‟) products
for NADAC calculation. The „S‟, „I‟, and „N‟ designations will be determined using the
most current CMS covered outpatient drug product file. Processes to override the drug category to reflect categorization used by States is described in further detail in the Level of Reporting section of this document.
The NADAC for S and I products will be referred to as the S/I drug NADAC. The NADAC for N products will be referred to as the N drug NADAC. Generally, one S/I drug NADAC will apply to all S and I NDCs within a drug grouping. Likewise, one N drug NADAC will apply to all N NDCs within a drug grouping. The following is an example of the use of the drug category and drug category overrides for NADAC purposes.
Example 2: Drug NADACs Drug Grouping Drug Category Pharmacy Entity Type NADAC
S/I C/I 2.00000 Lipitor (atorvastatin) 10mg tablets N C/I 1.00000
DRAFT 15
NA. 85

Draft Methodology for Calculating the NADAC – National Average Drug Acquisition Cost
Drug NADACs applied to individual NDCs
Drug Name Drug NDC NADAC Note 1 (Labeler) Category
Lipitor 10mg tablet xxxxx-xxxx-xx I 2.00000 - (Pfizer)
Lipitor 10mg tablet xxxxx-xxxx-xx I 2.00000 - (Pfizer)
atorvastatin 10mg xxxxx-xxxx-xx N 1.00000 - tablet (Ranbaxy)
atorvastatin 10mg 68084-0564-01 tablet (Amer. N 1.00000 -
Health Packing)
Overridden to N atorvastatin 10mg drug NADAC due to xxxxx-xxxx-xx I 1.00000 tablet (Watson) authorized generic
status 1Drug Category values in this example rare reported on CMS Quarterly Covered Outpatient Drug product file. Note: This example does not illustrate the contents of the NADAC file, show actual NADACs, or list all NDCs for this drug grouping. There will be some situations where exceptions to NADAC calculations will necessarily need to be applied to ensure appropriate drug grouping such as cases where per unit drug prices differ based on package sizes. While most NADAC drug groupings will consist of all package sizes available, certain drug groupings such as some topical products have differential pricing based upon package size. Therefore, these situations will require the use of differential NADAC that varies by package sizes. These NADACs will be calculated for unique drug grouping/drug category/pharmacy type/package size combinations. There may also be other situations where the NADACs will be established based on a product-specific grouping such as cases where multiple innovator products share the same active ingredient(s), strength, dosage form, and route of administration but greatly differ in their per unit pricing.
DRAFT 16
NA. 86

Draft Methodology for Calculating the NADAC – National Average Drug Acquisition Cost
Prior to the publication of updated reference files, drug costs used for determining the NADAC will be adjusted to reflect the relative changes in published drug prices, as described in the NADAC Updates section of this document. This will ensure NADACs are reflective of current drug prices at the time of publication. Myers and Stauffer LC will maintain a Help Desk to address drug price changes that are not reflected in the NADAC updates. Refer to the section on Help Desk Support Functions within this document for further details.
DRAFT 17
NA. 87

Draft Methodology for Calculating the NADAC – National Average Drug Acquisition Cost
NADAC Updates
NADAC will be updated to revise existing NADACs or to add new NADACs to the reference file. These NADAC updates will occur on both a weekly and monthly schedule.
Non-innovator multiple source drugs (N drugs)
After the initial NADACs have been determined using the results of the first monthly pharmacy acquisition cost survey, the NADACs will be reviewed for updates on both a weekly and monthly schedule.
On a weekly basis, the NADACs will be reviewed and adjusted as necessary based on research initiated by pharmacy inquiries into the NADAC Help Desk. If research substantiates that a change in price for a drug has occurred, a revised NADAC will be calculated and included in the next weekly reference file update.
On a monthly basis, existing NADACs will be replaced with updated NADACs using the results of the ongoing monthly pharmacy acquisition cost surveys. New drugs will be added that meet the NADAC criteria. If an average drug cost for an existing NADAC cannot be calculated with data from a subsequent monthly pharmacy acquisition cost survey, the existing NADAC for that drug will remain on the reference file until the sooner of 1) a month for which a NADAC can be calculated, or 2) twelve months. If an updated NADAC cannot be calculated with survey data after twelve consecutive months, the NADAC will be removed from the reference file. Once a NADAC can be calculated for the previously removed drug grouping, the NADAC will be appear on the file with the updated NADAC.
Single source or Innovator multiple source drugs (S or I drugs)
After the initial NADACs have been determined using the results of the first monthly pharmacy acquisition cost survey, the NADACs will be reviewed for updates on both a weekly and monthly schedule.
On a weekly basis, the NADACs for S/I drugs will be reviewed and adjusted as necessary based on changes in published prices. Changes in published prices are measured as the relative percentage difference between the new published price and the previous published price. Therefore, if the published price for a drug increases by 5%, then the NADAC for that drug will also be increased by 5%. The relationship between published and actual drug prices will be tracked to ensure that a direct correlation continues to exist.
DRAFT 18
NA. 88

Draft Methodology for Calculating the NADAC – National Average Drug Acquisition Cost
In addition to these update processes, NADACs can be reviewed and adjusted based on research initiated by pharmacy inquiries into the NADAC Help Desk. If research substantiates that a change in price for a drug has occurred, a revised NADAC will be calculated and included in the next weekly reference file update. Refer to the Help Desk Support Functions section of this document for further details.
On a monthly basis, existing NADACs will be evaluated and updated as necessary with new survey data. For consistency and smoothing purposes, the results of each subsequent monthly pharmacy acquisition cost survey will be compared to the existing NADAC to evaluate if a change is warranted. Thresholds will be determined through analysis of the initial acquisition cost survey to determine whether an updated NADAC is necessary. For example, analysis of cost differences between various pharmacy entity types compared to differences in published drug prices may determine that changes of less than 2% from the previous month‟s NADAC would not warrant a
change in the published NADAC. Since manufacturer published price changes are already being accounted for through the weekly processes, small pricing variations observed from month-to-month are likely reflective of price fluctuations due to the sample composition and not related to marketplace changes in the price of the drug. Utilizing these thresholds in the evaluation of S/I drug NADACs will avoid NADAC adjustments not based on changes in marketplace prices.
If thresholds are exceeded, the current NADAC will be replaced by the NADAC based on monthly drug prices collected. If thresholds are not exceeded, the current S/I drug NADAC will remain on the reference file with an updated NADAC Date. If an average drug cost for an existing NADAC cannot be calculated with data from a subsequent monthly pharmacy acquisition cost survey, the existing NADAC for that drug will remain on the reference file until the sooner of 1) the first month for which a NADAC can be calculated, or 2) twelve months. If an updated NADAC cannot be calculated with survey data after twelve consecutive months, the NADAC will be removed from the reference file. Once a NADAC can be calculated for the previously removed drug grouping, the NADAC will be appear on the file with the updated NADAC.
NADACs for N drugs will not have thresholds established for smoothing purposes. S and I drugs are typically available from one manufacturer so pricing fluctuations will reflect the price changes of a single supplier. Therefore, if the manufacturer has not changed the price of the drug, price fluctuations are due to another factor, such as sample composition. However, N drugs are available from multiple manufacturers. Price volatility for these drugs is a function of the variety of prices charged by numerous suppliers of these products. Due to the volatility of prices and the subsequent range of
DRAFT 19
NA. 89

Draft Methodology for Calculating the NADAC – National Average Drug Acquisition Cost
acquisition costs within N drug groups, smoothing to address changes in the sample composition is not necessary.
Addition of NADACs for new drugs not listed on current quarterly CMS covered outpatient drug product file on Medicaid.gov
The CMS covered outpatient drug product file available on Medicaid.gov is updated on a quarterly basis. There may be drugs that are new to the pharmacy marketplace that would not be listed until the next quarterly covered outpatient drug product file is published. The lag between the availability of the new drug product in the marketplace and its inclusion on the covered outpatient drug product file could potentially delay addition of new drug to the NADAC file. To address these instances, when the criteria for establishing a NADAC is achieved for these new drugs, they will be reviewed individually to determine if they meet the criteria of covered outpatient drugs. To support this effort, Myers and Stauffer LC will receive interim updates from CMS with regards to new drug products. In addition, a list of drug manufacturers participating in MDRP will be maintained and updated based upon releases from CMS to ensure the most recent drug manufacturer rebate information is used. It is important to note that the assignment of a NADAC to a particular NDC does not constitute the status of the NDC as a covered outpatient drug.
DRAFT 20
NA. 90

Draft Methodology for Calculating the NADAC – National Average Drug Acquisition Cost
Quality Assurance
Myers and Stauffer LC will fully incorporate quality assurance procedures to ensure that the acquisition cost submissions are reasonable and are associated with valid, active NDCs. Myers and Stauffer LC may contact individual pharmacies if there are questions with the pharmacy‟s acquisition cost submissions.
Prior to initiation of NADAC calculations, data will be reviewed to ensure that costs entered into the database reflect the submitted data and that the NDCs are valid and active. Drug costs that are found to be equal to or greater than AWP will not be entered into the database. Refer to the background section of this document for further discussion on the AWP and drug prices.
As described earlier in the NADAC calculation section, the price outliers will be removed through two processes. The first process will be to remove all cost observations that are not within two standard deviations from the mean acquisition cost for each drug grouping. This approach eliminates values that are substantially inconsistent with the majority of observations, while retaining at least 95% of the values to calculate a revised mean.
The second process will be to review the NADAC calculations to ensure reasonableness, such as evaluating the range of cost observations used to calculate the NADAC. Costs that do not fall within a reasonable range will be removed. This quality assurance measure prevents outlier acquisition costs from impacting the NADAC calculation.
Myers and Stauffer LC will also perform ongoing quality review of calculations and procedures for the acquisition cost survey and NADAC publication to continue to refine these processes. Quality Assurance analyses that can be used for this endeavor may include monitoring price change trends compared to published price references and comparison of acquisition costs across various pharmacy characteristics.
DRAFT 21
NA. 91
Methodology for Calculating the NADAC – National Average Drug Acquisition Cost
Help Desk Support Functions
Myers and Stauffer LC will support a NADAC Help Desk, which will be staffed with certified pharmacy technicians, trained analysts, and pharmacists. This Help Desk will assist pharmacies and State Medicaid agencies with the following types of issues only.
Survey Support - Pharmacies will be able to contact Myers and Stauffer LC with questions related to the survey, survey process, options for responding to the survey, what information to submit, or other related questions.
Drug Price Changes - Notification of recent drug price changes not reflected in posted NADACs can be sent to the Help Desk. Help Desk staff may request additional information to assist in the research of these calls.
The Help Desk will receive and address each inquiry. Research will be performed to validate claims of drug pricing changes. Such research will include comparison to costs collected through the survey, confirmation of drug or material shortages, and confirm drug price changes with other pharmacies.
Pharmacies will be informed that changes made to the NADAC as a result of the inquiry will be reflected in future published rate files. Understanding that many inquiries will be related to identical topics, the results from research performed on individual inquiries will not be communicated back to the inquiring pharmacy. Changes in NADACs resulting from inquiries will be addressed in future reference files. Providers can contact the Help Desk to receive an update on the status of their question if they are unclear of the resolution.
The Help Desk will not address pharmacy inquiries into specific State or claim reimbursement related questions or concerns.
The NADAC Help Desk can be contacted through the following means.
Toll-free phone: (855) 457-5264 Electronic mail: [email protected] Facsimile: (317) 816-4134
DRAFT 22
NA. 92

ff
Draft Methodology for Calculating the NADAC – National Average Drug Acquisition Cost
Deliverables
We expect to make the NADACS available to the States. There will be one reference file provided that contains the NADAC and associated information. Separate NADACs will be presented for various pharmacy entity types and identified by the Pharmacy Entity Type field.
Reference File Format and Layout
The reference file will be published as a fixed length text file and an Excel file. The file will be sorted by NDC in ascending order and will contain the following fields:
NDC – 11-digit National Drug Code; limited to NDCs listed on CMS covered outpatient drug product file, or NDCs approved by CMS to be included as covered outpatient drugs.
Drug Name – Label name associated with the NDC.
NADAC – National Average Drug Acquisition Cost.
Pharmacy Entity Type – Identifies whether the NADAC reflects acquisition costs rom chain or independent pharmacies (C/I). There may be up to two NADACs or each NDC - one for each pharmacy entity type.
NADAC Date – Date that the NADAC is transmitted to CMS. Refer to NADAC Date Assignment below.
NDC Attribute – Codes that pertain to additional attributes about specific NADACs. These codes will be identified in an accompanying narrative that will be posted on Medcaid.gov.
Table 1 is an example of the NADAC file.
DRAFT 23
NA. 93

Draft Methodology for Calculating the NADAC – National Average Drug Acquisition Cost
Table 1: Sample NADAC Reference File
NDC Drug Name NADAC
Pharmacy
Entity
Type
NADAC
Date
NADAC
Attribute1
xxxxx-xxxx-xx Drug A 0.05698 C/I 7/1/2012 1,4 1NADAC Attribute = 1 identifies that posted NADAC reflects the average cost from submitted invoice costs only. NADAC Attribute = 4 identifies that the drug category on the CMS covered outpatient drug product file has been overridden.
Reference File Publication
The NADAC reference file will be posted on Medicaid.gov weekly. The file will contain all of the NDCs that have an assigned NADAC. Each NADAC file update will contain a full listing of covered outpatient drug products NDCs with assigned NADACs; therefore there will be a full file replacement on a weekly basis. NDCs with CMS Termination Dates that have passed will be excluded from the file. The updated file will replace the existing file on Medicaid.gov. Changes to the NADAC file will be identified through the NDC Attribute code.
In addition to the NADAC file, an accompanying narrative document will be published to assist in the interpretation of the NADAC file. Information in this document will include the field lengths, field descriptions, and NDC Attribute codes.
NADAC Date Assignment
The NADAC Date published on each reference file will be assigned in the following manner:
Monthly NADAC updates – For monthly NADAC files, the NADAC Date will be assigned the date that the NADAC file is sent to CMS. In cases where the weekly S/I drug NADAC update reflects a published drug price change within the week prior to the file processing, the date of the published drug price change will be the NADAC Date. For NADACs that do not change from the previous reference file, the NADAC will carry forward and will be assigned an updated NADAC Date.
Weekly NADAC updates – For weekly NADAC files, NADACs that are not adjusted will be carried forward and will retain the NADAC Date from the current monthly file. For NADACs that are adjusted based on relative changes in published drug prices, the date of the published drug price change will be assigned as the NADAC Date.
DRAFT 24
NA. 94

Draft Methodology for Calculating the NADAC – National Average Drug Acquisition Cost
For NADACs that are adjusted based on inquires through the Help Desk, the NADAC Date will be assigned the date that the weekly NADAC file is sent to CMS.
DRAFT 25
NA. 95

Active Ingredient(s) The active ingredient(s) represents the text description of the generic name of drug product for the NDC.
CMS Termination Date Date drug was withdrawn from market or the drug‟s last lot expiration date.
CMS Drug Category S or I Drug or N Drug, as determined through the „Single-source‟, „Innovator Multiple Source‟, and „Non-innovator Multiple Source‟ drug category designations listed on the
most current CMS outpatient covered drug product file.
CMS DESI Code Drug Product Efficacy Study and Implementation (DESI) codes obtained from the CMS covered outpatient drug product file. Products must not have a code that indicates that it has been declared less than effective by the DESI program. Such drugs, identified by having a DESI code of either 5 or 6, will be excluded from NADAC calculations.
Drug Grouping The drug grouping will be based on active ingredient, strength, dosage form, and route of administration for a formulation. In some cases, the drug grouping will be further differentiated by package size. This additional delineation will occur when there is a demonstrated variance of acquisition cost among package sizes for drugs in which the most cost effective package size cannot be purchased and easily repackaged for dispensing.
Drug Name The drug name is the labeled product name including active ingredient(s), strength, unit of measure, and dosage form.
Entities Licensed pharmacies in the United States. Examples of entities include independent pharmacies and chain pharmacies.
Draft Methodology for Calculating the NADAC – National Average Drug Acquisition Cost
Glossary
DRAFT 26
NA. 96

Draft Methodology for Calculating the NADAC – National Average Drug Acquisition Cost
NADAC The National Average Drug Acquisition Cost (NADAC) is the national price benchmark that is reflective of the costs that pharmacies pay to acquire prescription and over-the-counter drugs. It is based upon invoice cost data collected from pharmacies that reflect actual drug purchases.
NDC
The National Drug Code (NDC) is the national classification system for identification of drugs. The NDC is a unique 11- digit code assigned by the drug manufacturer to a specific drug. It identifies the Labeler Code, Product Code, and Package Size Code.
Obsolete Date The estimated date on which an NDC is reported by the manufacturer, to be discontinued, no longer marketed, no longer produced, no longer distributed, or otherwise made unavailable to the marketplace. This date is obtained from drug information compendia.
Outlier Drug cost observations that exhibit a large deviation from other cost observations for similar drugs.
Package size
The package size is the labeled quantity that to the NDC.
corresponds
Pharmacy
Entity Type Entities such as chain and independent pharmacies (C/I), as determined through self-reported pharmacy identification, or other supplemental resources. This information is obtained from a national pharmacy compendia file.
Pricing Unit
The pricing unit is the type of billing unit to be product (each, gram, milliliter).
used for a
Specialty Pharmacy
Pharmacies that dispense specialty drugs, as identified by the classification of their pharmacies as primarily specialty pharmacies on the National Council for Prescription Drug Programs (NCPDP) database. In addition, URAC specialty pharmacy certification will be used to identify specialty pharmacies for exclusion from the initial survey.
DRAFT 27
NA. 97

Draft Methodology for Calculating the NADAC – National Average Drug Acquisition Cost
Appendix
1) Survey Letter
2) Paperwork Reduction Act Statement
3) Comparison of Distributions within a Survey Sample and the Pharmacy Population
DRAFT 28
NA. 98

Draft Methodology for Calculating the NADAC – National Average Drug Acquisition Cost
DRAFT 29
APPENDIX 1: Survey Letter
NA. 99

Draft Methodology for Calculating the NADAC – National Average Drug Acquisition Cost
DRAFT 30
NA. 100

Draft Methodology for Calculating the NADAC – National Average Drug Acquisition Cost
DRAFT 31
NA. 101
Draft Methodology for Calculating the NADAC – National Average Drug Acquisition Cost
DRAFT 32
NA. 102

Draft Methodology for Calculating the NADAC – National Average Drug Acquisition Cost
DRAFT 33
NA. 103

Draft Methodology for Calculating the NADAC – National Average Drug Acquisition Cost
APPENDIX 2: Paperwork Reduction Act Statement
PRA Disclosure Statement
According to the Paperwork Reduction Act of 1995, no persons are required to respond to a
collection of information unless it displays a valid OMB control number. The valid OMB
control number for this information collection is 0938-1041. The time required to complete this
information collection is estimated to average 30 minutes per response, including the time to
review instructions, search existing data resources, gather the data needed, and complete and
review the information collection. If you have comments concerning the accuracy of the time
estimate(s) or suggestions for improving this form, please write to: CMS, 7500 Security
Boulevard, Attn: PRA Reports Clearance Officer, Mail Stop C4-26-05, Baltimore, Maryland
21244-1850.
DRAFT 34
NA. 104

Draft Methodology for Calculating the NADAC – National Average Drug Acquisition Cost
APPENDIX 3: Comparison of Distributions within a Survey Sample and the Pharmacy Population
DRAFT 35
NA. 105

Draft Methodology for Calculating the NADAC – National Average Drug Acquisition Cost
DRAFT 36
NA. 106

NA. 107

NA. 108

NA. 109

NA. 110

NA. 111
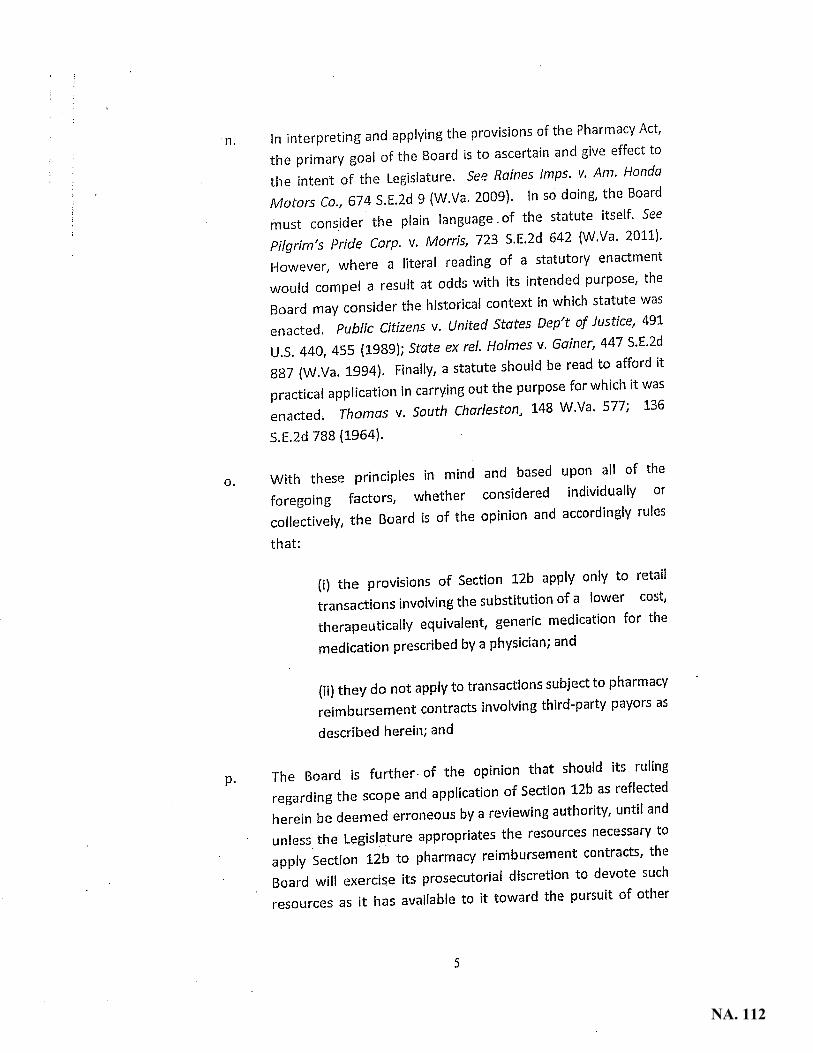
NA. 112

NA. 113

NA. 114
NA. 115
NA. 116

NA. 117

NA. 118

NA. 119

NA. 120

NA. 121
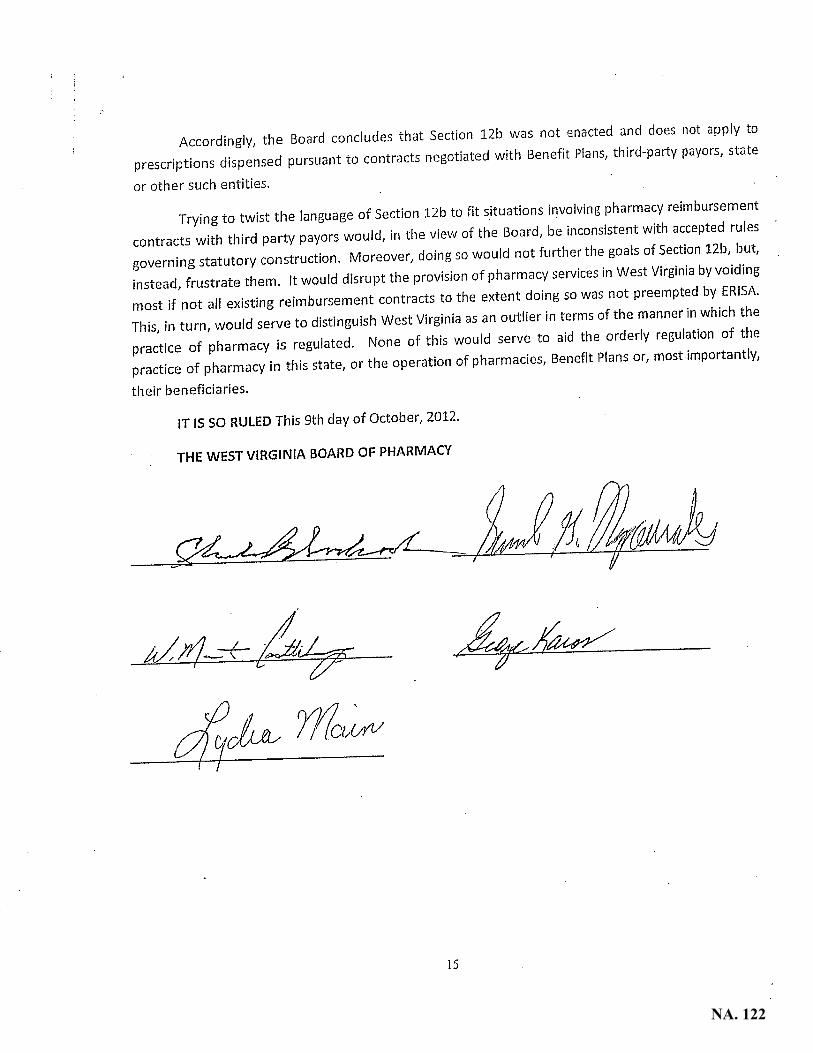
NA. 122