no item page no
TRANSCRIPT


2
No Item Page No. 1. Acknowledgement 3
2. Overview of the study 4
3. Data Sources 5
4. Ancient history of Chennai City 6
5. Profile of Chennai City 8
6. Land cover information of Chennai City 15
7. Formation of new wards of Chennai City 18
8. Education in Chennai City 20
9. Limitations of data in Chennai city 30
10. Analysis 31
11. Analysis –paper I An index & a smoothed map of illiteracy and its covariates of Chennai City 32
12. Analysis –paper II Determinants associated with infant immunization in Chennai City 2012, 2013 38
Tables
1. Area and population of Chennai City 1901-2011 9
2. Age structure of population in percent of Chennai Metropolitan Area (CMA) 10
3. Sex ratio per 1000 Males of Chennai Metropolitan Area 10
4. Chennai City ward wise population 1991, 2001 and 2011 12
5. Chennai City ward wise annual growth rate 1991-01 and 2001-11 13
6. Chennai City Zone wise population & annual growth rate 1971-2011 14
7. Chennai City Zone wise Literacy Level in 2001 & 2011 14
8. Zone wise population of Chennai City in 2013-2014 18
9. Madras /Chennai -Literates by Sex and Sex Ratio of Literates 1901-2011 20
10. Education facilities in Chennai City -2005 21
11. Birth rate and Death rate of Chennai City 22
12. Registered deaths of Chennai city 1975-76 & 1983-84 23
13. Health Infrastructure in Chennai Medical College hospitals -2005 24
14. Health Infrastructure in detail in Chennai City 2005 25
15. No. of Beds in Private Hospitals in Chennai City 2005 26
16. Zone wise no. of beds in hospitals of Chennai city 2005 27
17. No of Hospitals and Dispensaries Run by Chennai Corporation- 2005 27
18. Public Health facility available in Chennai City 2013 27
19. Health Post wise Immunization details for Chennai City 2011-14 28
20. Health Budget of Chennai City 2009-2015 29
A Percent distribution of illiteracy covariates of Chennai City, 2011 36
B Index of illiteracy covariates of Chennai City, 2011 36
C Infant immunization coverage of Chennai City 2012,2013 43
D Determinants associated with the Immunization status in infants, Chennai City, 2012 43
E Determinants associated with the Immunization status in infants, Chennai City, 2013 44
Figures
1. Chennai City with 155 wards and 10 Zones 11
2. Land cover Information of Chennai City 1997 & 2001 15
3. Land cover Information of Chennai City 2012 & estimated for 2024 16
4. Chennai City with 200 wards and 15 zones 17
5. Population pyramid of Chennai City 19
6. Chart showing trend of Birth & death rates of Chennai city 1971-2011. 22
7. Comparison map of Chennai City in 2011 & 2012 30
A. Mapping of illiteracy of Chennai City 2011 37
B. Spatial mapping of predicted values of Completely Immunized Infants of Chennai City 2012,2013 45
CONTENTS

3
Acknowledgement
My sincere thanks to
Secretary, DHR & Director General, ICMR for funding the project.
Dr Sanjay Mehendale, Director, National Institute of Epidemiology for
providing me all support and intellectual inputs.
Dr S. Venkatasubramanian for his timely suggestions as Co-PI.
Chennai Corporation Health Authorities and all zonal medical officers for
providing me the data.
Dr K. Kolandaswamy, Director of Public Health & Preventive Medicine,
Chennai for permitting me to use the PICME data.
Mr M. Chandrasekar, Project Statistical Assistant, NIE for data collection &
data entry.
Mr D. Augustine, Technical Asst., NIE for data entry.

4
Overview of the study
A city health profile is a valuable document which provides a scientific account of health; stimulates
public interest and commitment and can help to identify targets for future and monitor progress
towards them. Chennai City, with its historical past, current administration and commercial nature,
has been a major populous urban centre in Tamil Nadu state in India. It has 15 percent of the state’s
population. The demand for having periodic information on diverse aspects of socio-economic,
health and other aspects of population has increased and it is expected to grow with the progress of
any city because it provides a strong basis for policy formulation and program implementation. This
paper reviews the historical development of the city and describes selected health indicators of
Chennai City. The purpose of this study was to collate the available information and to examine
literacy, immunization and health indicators in relation to health outcomes.
The Report consists of two sections a) Consolidated Data; and b) Analysis.
Two types of analyses were done based on the available information;
i) an index and a smoothened map for illiteracy using several covariates (population, average
family size, proportion of slum population, proportion of illiterates, proportion of female
illiteracy, proportion of births, proportion of person unemployed, proportion of tribal
population, average no. of children per government school, average no. of persons using per
public water facility, average no. of persons using per public convenience) simultaneously for
ten zones of Chennai city for the year 2011 were generated.
ii) determinants associated with the complete immunization of infants for Chennai City for the
year 2012 and 2013 were identified using binary logistic regression model to produce a
smoothened surface map of Chennai City with predicted values of Complete immunization
coverage of Chennai city for both years respectively.
Getting reliable information was a great challenge, entire zonal boundary structure had been
changed and hence comparison over years was difficult. Some information was available by wards
/divisions, some by health posts and some based on revenue division and civic division. Thus collation
of data was difficult. Also data available were under different administrative boundaries like Chennai
City, Chennai Metropolitan Area and Chennai district which posed difficulties in meaningful
comparisons. The present study time period was one year, which got further restricted due to
prevalent floods in December 2015.

5
1. Records from Chennai Corporation.
2. Annual Reports of Corporation of Madras/Chennai.
3. Census of India. http://censusindia.gov.in/
4. https://en.wikipedia.org/wiki/List_of_Chennai_Corporation_zones
5. https://en.wikipedia.org/wiki/Timeline_of_Chennai_history#19th_century
6. https://en.wikipedia.org/wiki/History_of_Chennai
7. https://en.wikipedia.org/wiki/Chennai
8. http://www.ijhssi.org/papers/v3(8)/Version-2/F0382030042.pdf
9. http://shodhganga.inflibnet.ac.in/bitstream/10603/24086/8/08_chapter3.pdf
10. http://www.censusindia.gov.in/2011census/dchb/3302_PART_B_DCHB_CHENNAI.pdf
11. http://censusindia.gov.in/2011-prov-results/data_files/tamilnadu/3.Tamil%20Nadu_PPT_2011-
BOOK%20FINAL.pdf
12. http://www.cmdachennai.gov.in/Volume1_English_PDF/Vol1_Chapter02_Demography.pdf
13. http://www.cmdachennai.gov.in/Volume3_English_PDF/Vol3_Chapter03_Demography.pdf
14. http://www.hrdp-idrm.in/.../infoboxContent32717/Floodriskandcontextofland-
usesChennaicitycase-GuptaandNair.pdf
15. Vijayalakshmi R, Toshiyuki K, 2014. A Simulation of Land Use/Cover Change for Urbanization on
Chennai Metropolitan Area, India. http://conference.corp.at/archive/CORP2014_73.pdf
16. http://www.cmdachennai.gov.in/Volume3_English_PDF/Vol3_Chapter08_Social%20Facilities%2
0.doc.pdf
17. http://www.kicc.jp/auick/database/training/2006-1/CR/WS2006-1CR-Chennai.pdf
18. www.indiaonlinepages.com/population/chennai-current-population.html
19. Madras, Chennai: A 400-year Record of the First City of Modern India, Volume 1. The land,
people and their governance, edited by S. Muthiah, Palaniappa Brothers.
20. Annual reports of Institute for Research in Medical Statistics, Chetput, Chennai, 1988.

6
Chennai city
History of Chennai City
Chennai is an ancient city in South India. Originally known as "Madras patnam" this was located in
the province of Tondaimandalam, an area lying between Pennar river of Nellore and the Pennar
river of Cuddalore. The capital of the province was Kancheepuram. In the year 1646, the settlement
had 19,000 persons with the Portuguese and Dutch populations.
During the course of the late 17th century, both plague and genocidal warfare reduced the
population of the colony dramatically. Later the neighbouring villages of Triplicane, Egmore,
Purasawalkam and Chetput were annexed with the city to form the city of Chennapatnam. The
English merchants and the planter families who, allied with their wealthy Indian counterparts,
jointly controlled Chennapatnam under the supervision of White Town. Over a period of time and
following administrative reforms, the area was fully incorporated into the new metropolitan charter
of Madras.
Ripon building Ancient Chennai dwellers
Chennai central railway station Govt. general Hospital, Park Town

7
The development of a harbour in Madras led the city to become an important centre for trade
between India and Europe in the 18th century. In 1788, Thomas Parry came to Madras as a
merchant and he set up the oldest company in the country (EID Parry). John Binny came to Madras
in 1797 and he established the textile company Binny & Co in 1814. Spencer's started a small
business in 1864 which later became the biggest department stores in Asia. The original building
which housed Spencer & Co. was burnt down in a fire in 1983 and the present structure houses one
of the largest shopping malls in India, Spencer Plaza. Other prominent companies in the city
included Gordon Woodroffe, Best & Crompton, Higginbotham's, Hoe & Co and P. Orr & Sons.
In 1901 the city, covering an area of about 70 sq km, had a population of 540,000. And in 1905
the Chennai Port Trust was formed. The Government Royapettah Hospital was established in 1911.
Water mains and drainage were formed in 1914 and the Street lights were introduced.
Kilpauk water works was inaugurated. The First aeroplane flew to Chennai in 1917 arranged by
Simpson & Co. The city was expanded to an area of about 80 sq km in 1923. The School of Indian
Medicine was founded in 1924 and in 1925 the Loyola College was founded. Tambaram TB
Sanatorium was established in 1928. The first broadcasting station was founded at Ripon
Buildings complex in 1930. Suburban electric train services started from Chennai Beach to
Tambaram in 1931. Raja Sir Muthiah Chettiyar was appointed as the first mayor of the city in 1934.
Government Stanley Hospital was established. In 1942 the Second World War resulted in evacuation
of Madras. Japanese fighter planes dropped bombs on the city in 1943. Population of the city
crossed million persons. The Regional Meteorological Centre was established from the old Madras
observatory in 1945.
Around 1946 Mambalam, Saidapet, Government farm Puliyur, Kodambakkam,
Saligramam, Adayar and Alandur villages which were part of Saidapet Municipality; Sembiyam,
Siruvallur, Peravallur, Small Sembarambakkam and Ayanavaram which were part of Sembium,
Panchayat Board; Aminjikarai, Periyakudal, Maduvankarai villages which were part of Aminjikarai
Panchayat Board and Part of Velacheri village, belonging to Velacheri Panchayat Board, were
annexed to the city.
After India became independent in 1947, the city became the administrative and legislative capital
of Madras State which was renamed as Tamil Nadu in 1968.
With the inclusion of 12 Panchayats around Chennai in 1978, the Chennai district area extended
from 128.83 sq. kms to 175 sq. kms as per revenue authorities. From time to time, the Chennai

8
district was divided into number of Divisions for administrative convenience and for rendering
effective civic service. The total numbers of Divisions/ Wards increased from 150 in 1981 to 155 in
1991 with the inclusion of five areas such as Cherian Nagar, Dr. Radhakrishnan Nagar (South),
Villivakkam (South), Virugambakkam (South) and Aminjikarai (Central). As per 2011 census, Chennai
city has 155 Divisions distributed in 10 Zones. Chennai city with an area of 175 sq. km and a
population of 4646732. High degree of urbanization and density resulted from immigration and
sporadic development of industries on the outskirts. Although Chennai is the smallest of the entire
district in the state, it has the highest population density. Chennai district is a city district which has
the capital of the state of Tamil Nadu. Chennai district was divided into 5 taluks, namely: (1)
Egmore-Nungambakkam (2) Fort Tondiarpet (3) Mambalam-Guindy (4) Mylapore-Triplicane and (5)
Perambur-Purasawalkkam.
Profile of Chennai City
Chennai is located on the northeastern part of Tamil Nadu, on the east coast adjoining the Bay of
Bengal. It lies between 12o 09’ N and 13 o 09’ N of the latitudes and 80 o 0’ 12’’ E and 80 o 0’ 19’’ E of
the longitudes, on a ‘sandy shelving breaker swept beach’. It stretches for 25.6 km along the Bay
coast, from Thiruvanmiyur on the south to Thiruvottiyur on the north. It is bounded on the east by
the Bay of Bengal and on the remaining three sides by Kanchipuram and Thiruvallur districts. The
City is accommodating the ever increasing population and the City has fast developed into a Mega
city. Chennai City is by population graded as 4th largest in India and 36th-largest urban area in the
world. Chennai is the 38th most visited city in the world. "The quality of living survey" rated Chennai
as the safest city in India. Chennai attracts about 45% of health tourists from abroad to India, so the
city was termed as "health capital of India".
Chennai city had large population in India after Mumbai and Delhi, with 5.41 lakhs in 1901 and
steadily increasing to 46.46 lakhs in 2011. Tourism guide publisher Lonely Planet named Chennai as
one of the top ten cities in the world to visit in 2015.

9
Chennai Corporation
DATA CONSOLIDATED AS TABLES & FIGURES
Table 1: Area and population of Chennai City, 1901-2011
Year Area in sq km Total Population (in lakhs)
Population density (per hect.)
Decadal growth in %
1901 68.17 5.41 80 -
1911 68.17 5.56 82 2.77
1921 68.17 5.78 85 3.96
1931 68.17 7.13 105 23.36
1941 77.21 8.65 112 21.32
1951 128.83 14.27 111 64.97
1961 128.83 17.49 136 22.56
1971 128.83 26.42 192 51.06
1981 176.00 32.84 187 24.30
1991 176.00 38.43 218 17.02
2001 176.00 43.44 247 13.04
2011* 176.00 46.47 264 6.98
2012# 426.00 69.00 162 48.48
2013-14 426.00 70.81 167 2.62 * As per 2011 census; #As per new structure of Chennai City with 200 wards
The population of Chennai from 5.41 lakhs in 1901 with an area of 68.17 sq km and 38.43 lakhs in
1991 with an area of 176 sq km, had rapidly increased to 70.81 lakhs in 2014 with an area of 426 sq
km. The decal growth rate varied from a minimum of 2.62% to a maximum of 64.97%.
Chennai accounted for 6.8 percent of the total population of 62,110,839 of the state in 2001.
Among them, 51.3 per cent were males. It ranked 2nd highest population among all the districts of
Tamil Nadu, next to Coimbatore district.
10
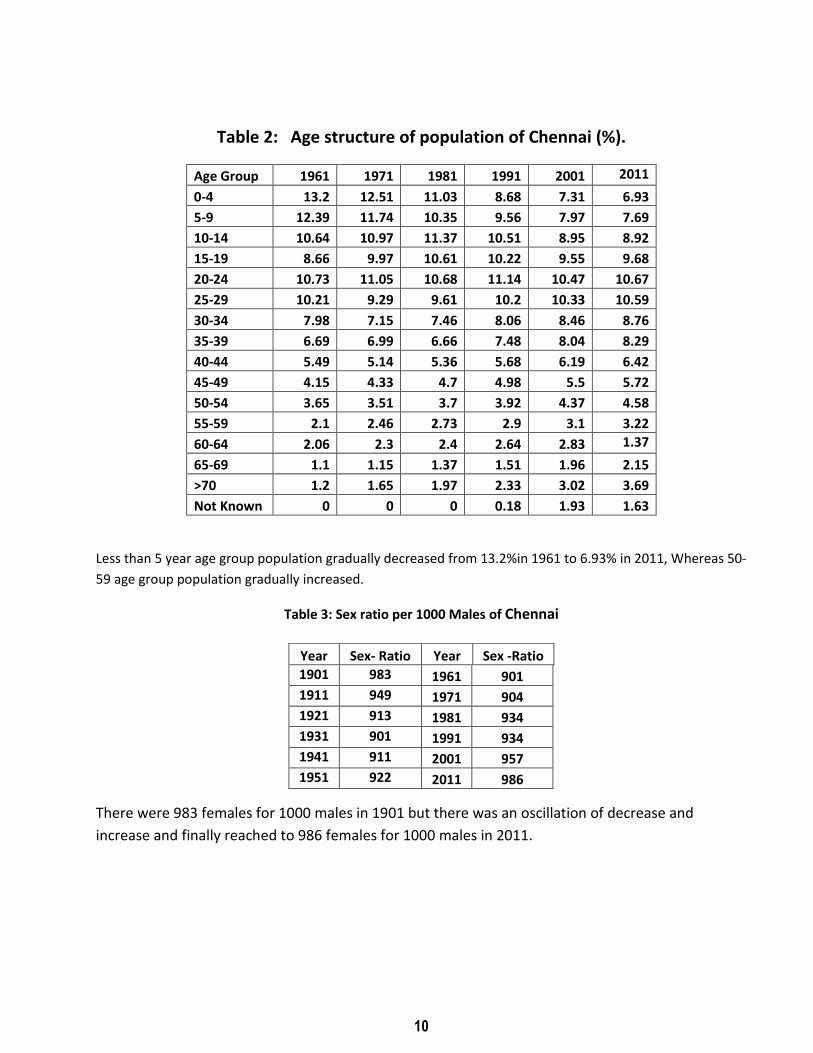
Table 2: Age structure of population of Chennai (%).
Age Group 1961 1971 1981 1991 2001 2011
0-4 13.2 12.51 11.03 8.68 7.31 6.93
5-9 12.39 11.74 10.35 9.56 7.97 7.69
10-14 10.64 10.97 11.37 10.51 8.95 8.92
15-19 8.66 9.97 10.61 10.22 9.55 9.68
20-24 10.73 11.05 10.68 11.14 10.47 10.67
25-29 10.21 9.29 9.61 10.2 10.33 10.59
30-34 7.98 7.15 7.46 8.06 8.46 8.76
35-39 6.69 6.99 6.66 7.48 8.04 8.29
40-44 5.49 5.14 5.36 5.68 6.19 6.42
45-49 4.15 4.33 4.7 4.98 5.5 5.72
50-54 3.65 3.51 3.7 3.92 4.37 4.58
55-59 2.1 2.46 2.73 2.9 3.1 3.22
60-64 2.06 2.3 2.4 2.64 2.83 1.37
65-69 1.1 1.15 1.37 1.51 1.96 2.15
>70 1.2 1.65 1.97 2.33 3.02 3.69
Not Known 0 0 0 0.18 1.93 1.63
Less than 5 year age group population gradually decreased from 13.2%in 1961 to 6.93% in 2011, Whereas 50-
59 age group population gradually increased.
Table 3: Sex ratio per 1000 Males of Chennai
There were 983 females for 1000 males in 1901 but there was an oscillation of decrease and
increase and finally reached to 986 females for 1000 males in 2011.
Year Sex- Ratio Year Sex -Ratio 1901 983 1961 901
1911 949 1971 904
1921 913 1981 934
1931 901 1991 934
1941 911 2001 957
1951 922 2011 986

11
Figure 1:
The Chennai city had 150 wards in 1981, remained the same up to the year 1991. Later in 1991 the
city got expanded to 155 wards of 10 zones till September 2011. The above figure shows the ward
boundaries of the city.
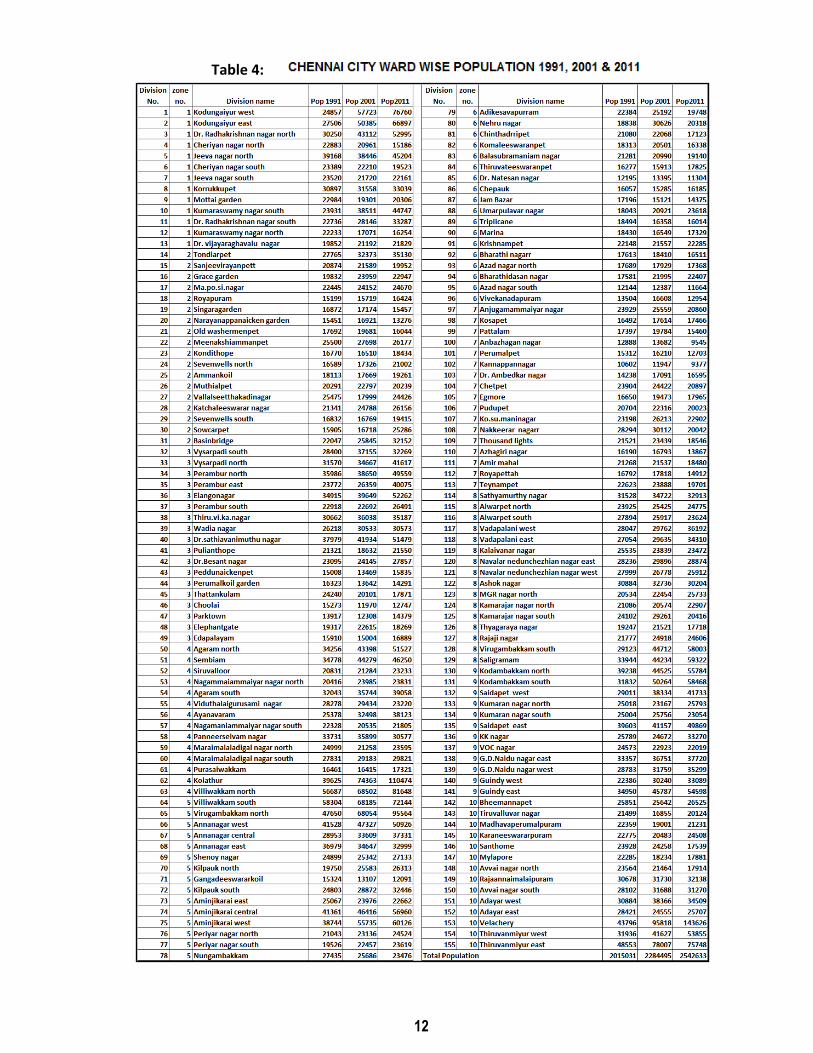
The following table (4) shows the three decadal population of Chennai city and table5 shows the
variation in the annual growth rate of the wards over decades. The annual growth rate varied from -
2.93 to a maximum of 13.22 in 1991-01 and varied from -3.37 to 5.20 in 2001-11. The highest
growth rate was in ‘kodungaiyur’ and ‘Perambur east’ divisions respectively.
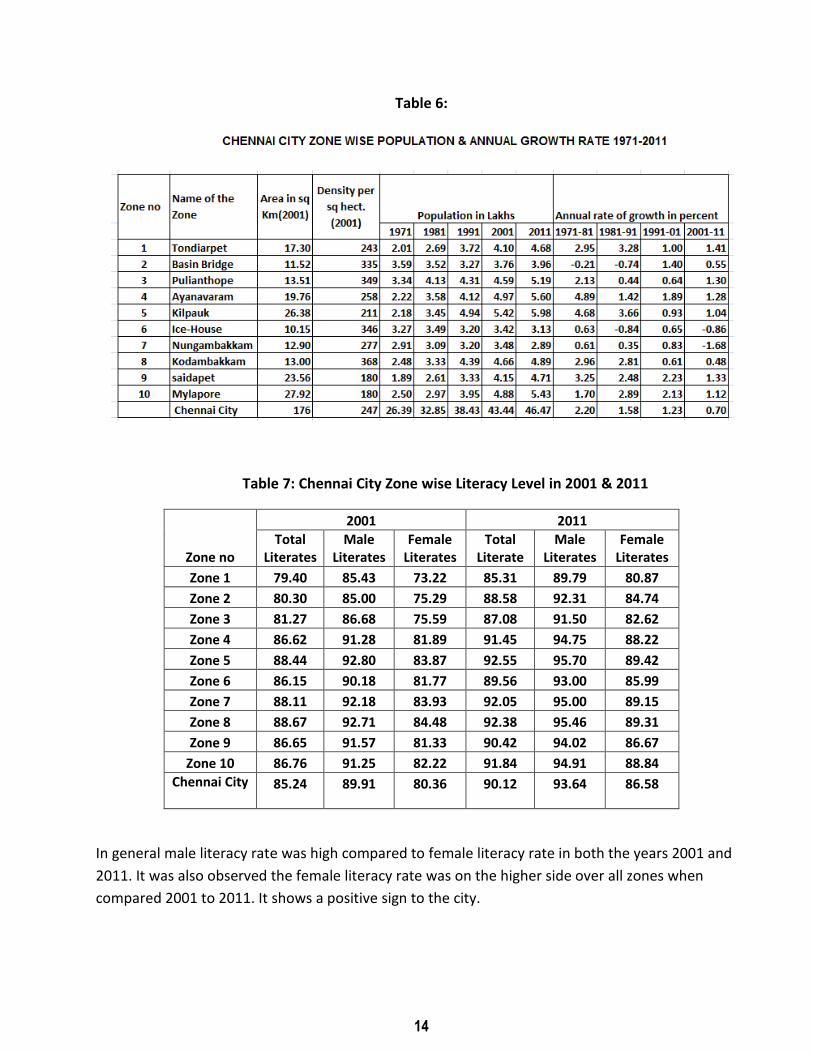
Table 6 shows the zonal population and growth rate over three decades. Kilpauk zone with less
dense population showed a higher growth rate over years.
12
Table 4:

13
Table5:
Pink Colour shows the highest decadal growth rate and green colour shows the lowest decadal growth rate in the respective yrs.
14
Table 6:
Table 7: Chennai City Zone wise Literacy Level in 2001 & 2011
Zone no
2001 2011
Total Literates
Male Literates
Female Literates
Total Literate
Male Literates
Female Literates
Zone 1 79.40 85.43 73.22 85.31 89.79 80.87
Zone 2 80.30 85.00 75.29 88.58 92.31 84.74
Zone 3 81.27 86.68 75.59 87.08 91.50 82.62
Zone 4 86.62 91.28 81.89 91.45 94.75 88.22
Zone 5 88.44 92.80 83.87 92.55 95.70 89.42
Zone 6 86.15 90.18 81.77 89.56 93.00 85.99
Zone 7 88.11 92.18 83.93 92.05 95.00 89.15
Zone 8 88.67 92.71 84.48 92.38 95.46 89.31
Zone 9 86.65 91.57 81.33 90.42 94.02 86.67
Zone 10 86.76 91.25 82.22 91.84 94.91 88.84
Chennai City
85.24 89.91 80.36 90.12 93.64 86.58
In general male literacy rate was high compared to female literacy rate in both the years 2001 and
2011. It was also observed the female literacy rate was on the higher side over all zones when
compared 2001 to 2011. It shows a positive sign to the city.

15
Figure 2
Land cover information of Chennai city
The land cover information tremendously changed over years. Dense vegetation areas in 1997 changed to
dense built up areas in 2001.
In 2012 the urban built up areas increased replacing the crop land / vegetation area and the estimated urban
areas in the year 2026 with almost invisible crop lands or vegetation.
Though the Chennai City shows an improvement over industrialization, population density etc. it also shows
an alarming sign of scarcity of good environment.

16
Figure 3:

17
Figure 4:
Chennai City (Sep 2011) with 200 wards and 15 zones

18
Formation of new wards of Chennai City in the year 2011.
Chennai Corporation absorbed 7 municipalities, three town panchayats and 13
panchayat unions in Tiruvallur district and 2 municipalities, five town panchayats and 12
panchayat unions in Kanchipuram district.
A total of 9 municipalities merged into the city Alandur, Ambattur, Kattivakkam,:
Madhavaram, Maduravoyal, Manali, Tiruvottiyur, Ullagaram Puzhuthivakkam and
Valasaravakkam.
A total of eight town panchayats merged into the city: Chinnasekkadu, Puzhal,Porur,
Nandambakkam, Meenambakkam, Perungudi, Pallikaranai, Sholinganallur.
A total of twenty five village panchayats merged into the city: Edayanchavadi,
Sadayankuppam, Kadapakkam, Theeyampakkam, Mathur,Vadaperumbakkam, Surapet,
Kathirvedu, Puthagaram, Nolambur, Karambakkam, Nerkundram, Ramapuram,Mugaliva
kkam, Manapakkam, Kottivakkam, Palavakkam, Neelankarai, Injambakkam, Karapakkam
, Okkiyam,Thuraipakkam, Madipakkam, Jaladampet, Semmencherry, Uthandi.
The expanded city was re-organized into 15 zones consisting of 200 wards. The newly
annexed areas were divided into 93 wards, and the remaining 107 wards were created
out of the original 155 within the old city limits. As of September 2011, the new wards
of the Chennai City were 200 wards, 26 were reserved for scheduled castes and
scheduled tribes and 58 were reserved for women.
Table 8: Zone wise population of Chennai City, 2013-14.
The table 8, shows the zone wise population of Chennai city in 2014 with the highest
population in zone 9, Teynampet; and the smallest zone as shollinganallur, zone 15.

19
Figure: 5 Population pyramid of Chennai City

20
EDUCATION IN CHENNAI CITY
Currently Chennai is in second place for literacy among the metropolitan city centers in India
with 90.33 per cent literacy rate. Chennai has a mix of public and private schools. The public
school system is managed by the Chennai Corporation with an enrollment of 142,387 students
in over 330 schools. Tamil and English are the primary media of instruction, though several
schools also use Telugu or Urdu. Public schools run by the Chennai Corporation are all affiliated
with the Tamil Nadu State Board, while private schools may be affiliated with either of the
Tamil Nadu Board of Secondary Education or the Central Board of Secondary Education (CBSE).
There is also the Matriculation School education. The Arts and Science Colleges in Chennai are
affiliated to University of Madras, which has five campuses in the city. The Indian Institute of
Technology Madras (IITM) and the Anna University are the two well-known centres for
engineering education in the city.
Table 9:
Madras /Chennai -Literates by Sex and Sex Ratio of Literates 1901-2011
No. of Literates Percent to total
Population Sex Ratio
Year P M F P M F Per 1000
males
1901 115481 92394 23087 22.7 36.0 9.1 250
1911 144758 112258 32500 27.9 42.0 12.9 290
1921 168690 125136 43554 32.0 45.3 17.4 348
1931 199870 147872 51998 30.8 43.3 16.9 352
1951 490912 297853 193059 34.7 40.4 28.4 648
1961 1028326 633203 395123 59.5 69.6 48.2 624
1971 1531406 915488 615918 62.0 70.6 52.5 673
1981 2241149 1280772 960337 68.4 75.6 60.7 750
1991 2752341 1535351 1216990 71.6 77.3 65.6 793
2001 3336695 1799981 1536714 76.8 81.1 72.3 854
2011
3776276 1968079 1808197 90.12
93.64 86.58 949
A gradual increase in the literacy level over the years has been observed. In the year 1901 there
were 250 females for 1000 males where as it increased to 949 females per 1000 males in 2011.

21
Table 10: Education Facilities in Chennai City (2005)
Sl.No. Category of Institutions
Govt / Govt aided Private Total
1 Schools
(a) Primary 164 315 479
(b) Middle 125 127 252
(c ) High School 55 171 226
(d) Higher Secondary 60 366 426
2 Colleges
(a) Arts and Science colleges 22 11 33
(b) Training Colleges 5 1 6
( c) Physical Education 1 1
(d) Others including Research Institutions 25 13 38
3 Technical Education
(a) I.I.T.s 3 87 90
(b) Polytechnics 11 2 13
( c) Engineering colleges 4 2 6
4 Medical Colleges
(a) Medical Education 3 3
(b) Dental Colleges 1 0 1
( c) Siddha 1 0 1
(d) Homeo
(e) Unani 1 1
(f) Ayurveda 1 1
(g) Pharmacy 1 2 3
(h) Nursing 1 1
5 Veterinary Colleges 1 1
Law Colleges 1 1

22
Figure 6: Chart showing the trend of Birth &
death rates of Chennai City 1971-2011
05
1015202530354045
19
71
19
72
19
73
19
74
19
75
19
76
19
81
-90
19
91
19
92
19
93
19
94
19
95
19
96
19
97
19
98
19
99
20
00
20
01
20
02
20
03
20
11
Birth rate
Death rate
Table 11:
Birth rates and Death rates of Chennai City 1971-2011 (per
1000 population).
Year Birth rate Death rate
1971 38.60 12.30
1972 37.80 12.70
1973 36.40 12.40
1974 34.40 11.50
1975 34.30 13.10
1976 32.10 12.00
1981-90 28.70 8.60
1991 25.89 9.67
1992 24.01 9.50
1993 23.82 9.14
1994 23.39 9.07
1995 23.75 8.49
1996 22.68 8.54
1997 22.50 8.20
1998 23.81 9.00
1999 25.68 8.87
2000 25.53 8.92
2001 24.50 8.42
2002 23.72 8.27
2003 22.62 8.01
2011 23.88 8.36
The data shown in the table are illustrated through the chart.
The chart shows the trend over yrs from 1971 to 2011. Birth
rates show a decline, whereas the death rate does not decrease
sharply but shows slight variation over years from 1995 to 2011.

23
Table: 12 Registered deaths of Chennai city 1975-76 & 1983-84 per 1000 population
Source: Data from Chennai Corporation, A study done by Institute for Research in Medical Statistics (ICMR) in 1988.

24
Table 13:
Health Infrastructure in Chennai Medical College hospitals -2005
Health Infrastructure in Chennai
Type of Hospital No.
Medical College Hospitals 4
Maternity Hospitals 3
Emergency Obstetric Care Centre 10
Communicable Diseases Hospital 1
Urban Primary Health Centres 80
Peripheral Hospitals 3
ESI Hospitals 3
Institute of Child Health 1
Institute of Mental Health 1
Private Hospitals 451
Private Medical Practitioners > 10,000
ICDS Centres 1600

25
Table 14: Health Infrastructure in Chennai City 2011

26
Table 15:
27
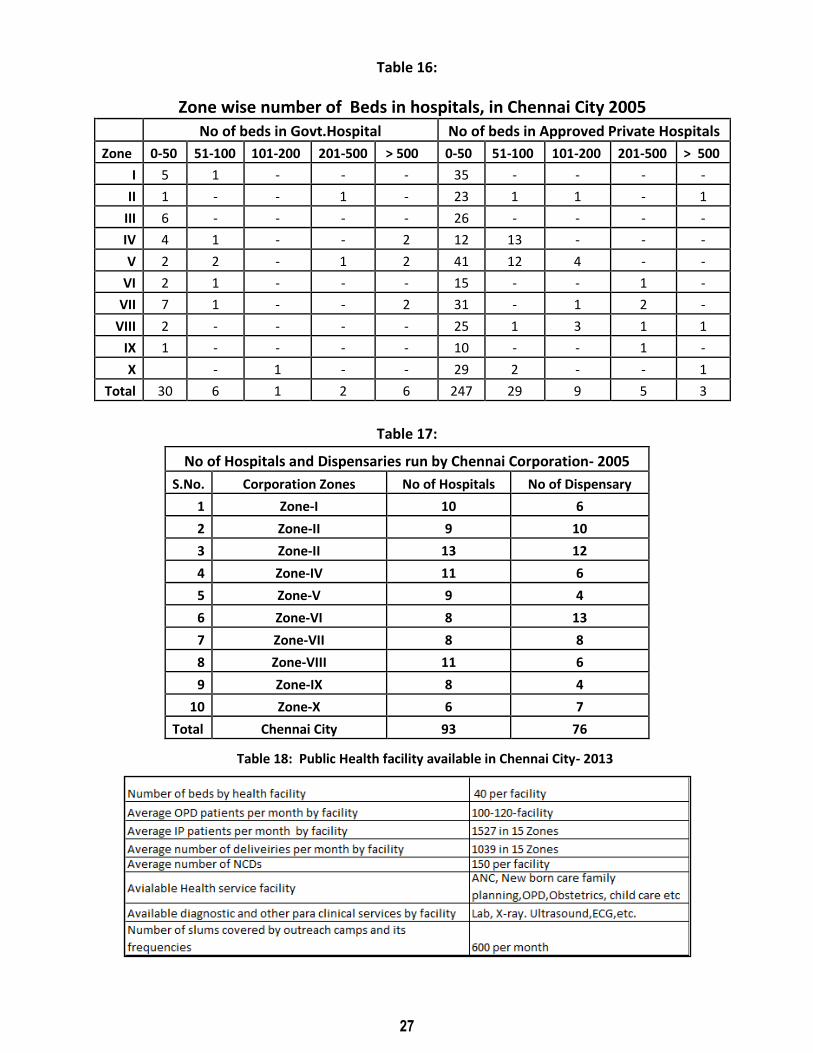
Table 16:
Zone wise number of Beds in hospitals, in Chennai City 2005
No of beds in Govt.Hospital No of beds in Approved Private Hospitals
Zone 0-50 51-100 101-200 201-500 > 500 0-50 51-100 101-200 201-500 > 500
I 5 1 - - - 35 - - - -
II 1 - - 1 - 23 1 1 - 1
III 6 - - - - 26 - - - -
IV 4 1 - - 2 12 13 - - -
V 2 2 - 1 2 41 12 4 - -
VI 2 1 - - - 15 - - 1 -
VII 7 1 - - 2 31 - 1 2 -
VIII 2 - - - - 25 1 3 1 1
IX 1 - - - - 10 - - 1 -
X - 1 - - 29 2 - - 1
Total 30 6 1 2 6 247 29 9 5 3
Table 17:
No of Hospitals and Dispensaries run by Chennai Corporation- 2005
S.No. Corporation Zones No of Hospitals No of Dispensary
1 Zone-I 10 6
2 Zone-II 9 10
3 Zone-II 13 12
4 Zone-IV 11 6
5 Zone-V 9 4
6 Zone-VI 8 13
7 Zone-VII 8 8
8 Zone-VIII 11 6
9 Zone-IX 8 4
10 Zone-X 6 7
Total Chennai City 93 76
Table 18: Public Health facility available in Chennai City- 2013

28
Table 19: Health post wise Population, ANC mothers, live births and Immunization details for Chennai City 2011-14.

29
Table 20:
Health Budget of Chennai City 2009-2015
Corporation of Chennai-Public Health Department Rate of
Increase 1 Annual total budget for health Sector 2015-2016 Rs.893 Lakhs 79
2 Annual total budget for health Sector 2014-2015 Rs.500 Lakhs 19
3 Annual total budget for health Sector 2013-2014 Rs.420 Lakhs 20
4 Annual total budget for health Sector 2012-2013 Rs.350 Lakhs 78
6 Annual total budget for health Sector 2010-2011 Rs.197 Lakhs 97
7 Annual total budget for health Sector 2009-2010 Rs.100 Lakhs
The annual budget for health sector was 100 lakhs in 2009-10 which increased to 893 lakhs in
2015-16.The budget’s annual increase was at a higher level in the year 2010-11 and lower in the
year 2014-15.

30
Limitations of data in Chennai City
Figure 7: Comparison map of Chennai City in 2011 & 2012
When both the zonal maps are compared we can observe that there is a complete change in
the zonal boundaries. The entire zonal structure has been changed hence comparison over the
years was difficult. The boundaries of the revenue divisions and the health posts are different.
Currently no. of wards and no. of health post are different. The above facts pose challenges for
trend analysis and GIS mapping. There was also a frequent change in the data personnel.
Approachability of personnel was also found to be difficult because of several other
commitments of the staff in various programme like Indradhanush, flood relief work etc.
Natural disaster like Tsunami & floods of Chennai city made the population unstable.
Evacuation of population, migration etc., led to the unaccountability of the population to the
respective wards.

31
32
Paper I
Submitted for Seventh International Conference on Health GIS 7-9 Dec 2017 held at Mysore.
An index and a smoothed map of illiteracy and its covariates of Chennai City
As per Census of India, a person aged seven and above who can both read and write with
understanding in any language, is treated as literate. The word illiteracy refers to the inability of
a person above seven years to read or write a simple message in any language. An illiterate is
equal to a handicapped person who is unfamiliar with his surroundings and is unable to
perform efficiently day to day activities. The factors causing illiteracy vary from region to
region. One important factor that causes illiteracy in countries is the social issue of women
education. More literacy means more knowledgeable and skilled people in a country which is
normally termed as human capital. Literacy enables a person to understand better, so they
enjoy a better socio economic life and assist in the family’s overall development. Illiteracy is
considered to be a vicious cycle; all interlinked may vary with population growth, economic
growth and cultural growth. Once we attain the power of literacy, we will become a
superpower as we will have the indestructible weapon of “knowledge”[1].
According to a report by United Nations Educational, Scientific and Cultural Organization, India
has the highest population of illiterate adults at 287 million. The report further says that the
richest young women in India have already achieved universal literacy but the poorest are
projected to only do so around 2080, noting that huge disparities within India, point to a failure
to target support adequately towards those who need it the most. Post-2015 goals need to
include a commitment to make sure the most disadvantaged groups achieve benchmarks set
for goals [2]. As per 2011 census India has shown considerable improvement in literacy levels
compared to 2010 an increase of 14% but one in 10 households still doesn't have even a single
literate member [3].
The literacy rate for Tamil Nadu in 2011 has increased to 80.33 % from73.45% returned in the
2001 Census, while the increase in the decadal literacy rate in Chennai city was 4.85%. Often
the literacy level has been viewed as a single entity to measure the economic growth of the
country/region. Fortunately Census of India has the data on various parameters at district and
ward level. Hence an attempt was made to develop an index and a smoothened map for
illiteracy using several covariates simultaneously for zones of Chennai city.
33
Materials and methods:
Data on illiteracy and its covariates for the year 2011 from Census of India, Corporation of
Chennai and published reports [4,5] were used.
Ten zones of Chennai city and eleven covariates of illiteracy for which the information is
available were considered for the study. Covariates are based on demographic variables and
additional available free amenities. The covariates being population, average family size,
proportion of slum population, proportion of illiterates, proportion of female illiteracy,
proportion of births, proportion of person unemployed, proportion of tribal population,
average no. of children per government school, average no. of persons using per public water
facility, average no. of persons using per public convenience. The data matrix is of size 10x11
(table A) and the data set was standardized to eliminate different scales of measurement. We
have considered covariates in such a way that they are highly correlated with illiteracy.
Using the data matrix, Correlation matrix between the covariates was computed and examined
(87% of the cases correlation > 0.3 in absolute value). Bartlett's sphericity test is found to be
highly significant (P<0.0001). Thus the indicators selected for the analysis were well correlated
as required for factor analysis to be valid. This is readily computed by the SPSS [6] package. The
original data set was made into relatively a smaller number of independent factors and to find
the estimates of factor scores, which is a linear combination of standardized indicators. The
method of principal components [7] was used and factors extracted. And these factors were
improved using varimax rotation and factor scores obtained. Then the initial index for a zone is
obtained using percent variation as weights on the factor scores and further the index was
standardized for comparison purpose.
Kriging technique is an earth science technique based on regionalized variable theory [8,9].
Using the method of least squares, it provides a means of interpolating values for points not
physically sampled using the available information and the spatial arrangement of the data set.
The standardized score (as proportion) for each zone was expressed as Zobs (xi, yi) where (xi, yi)
are the geographic co-ordinates (latitude and longitude). Zobs(xi, yi) was modeled by means of
a variogram using geo-statistical (kriging) technique and the kriged estimates were obtained
using the ArcGIS software package [10] The map (Fig. A) would identify regions with higher
concentration of illiteracy level.

34
Results:
The factor analysis revealed four factor scores. The first factor explained 26.78% of the total
variation, second factor 26.17% third factor 14.7% and fourth factor 14.2%. These four factors
together explained 81.8% of the total variation. This is considered as a satisfying result for
factor analysis. Initial index for various zones is listed (table B) and the last column represents
the corresponding standardized index. If value 50 is taken as an average value, it can be seen
that four zones (z1, z3, z4 & z5) have an index of above 50 which shows greater care should be
emphasized on these zones to bring down illiteracy.
The map obtained (Figure) gives an optimal unbiased representation of multiple covariates of
illiteracy with Kriged estimates. It depicts the regional variation and the high illiteracy
concentrated regions. The Kriged estimate shows the high illiteracy concentrated regions as
northern part of Chennai city. This map shows the regional variation by simultaneously
considering several covariates.
Discussion:
The illiteracy rate varied from 7.45% to 14.69% among the zones of Chennai city. The
standardized index and the Kriged map using 2011 data reveals that northern part of the
Chennai city needs priority care compared to other parts. Further comparing the four northern
zones (i.e Index value more than 50) with the rest of the other zones, the covariates, proportion
of slum dwellers and proportion of tribal population turned out to be significant using chi-
square statistics (p<0.05). As per the report on slum dwellers of Chennai city [11] growth of
slums are due to large scale of migration, poverty and unemployment. Chennai being a major
metropolitan city with growing industries, people from other parts of districts/state tend to
migrate in search of occupation mainly to metros like Chennai. Poor migrants are forced to be
an illiterate as they seek for their survival. As a refuge stay squat on the unused land located
near their work places and Coovam basin areas which are comfortable and easily adaptable to
them. Chennai is ranked as beta level city [12] when compared with other districts of Tamil
Nadu ranks top in literacy level but still pockets of illiteracy exists, significantly by slum dwellers
and under privileged. Chennai slums are comprised of migrants. Hence policy makers while
framing policy should make some provision in filling the gap of illiteracy among slum dwellers
mainly migrants and build sufficient municipal civic amenities like special schools / programme
outside their working time to wipe out illiteracy from Chennai city.

35
Limitations
The zone as a unit is too big, if finer grid points like information about wards or division wise for
all covariates readily available, it would have been more precise to pin point the pockets in the
Chennai city for focused intervention.
Acknowledgement: Our sincere thanks to Corporation of Chennai, Census of India 2011 and to
Mr. M Chandrasekar for data collection.
REFERENCES
1. http://www.voicesofyouth.org/en/posts/illiteracy--a-curse-on-development accessed
on 1th October 2015.
2. http://www.thehindu.com/features/education/issues/india-tops-in-adult-illiteracy-un-
report/article5629981.ece accessed on 1th October 2015.
3. http://timesofindia.indiatimes.com/india/Literacy-rate-jumps-10-in-a-decade-in-
India/articleshow/45244626.cms accessed on 1th October 2015.
4. http://www.transparentchennai.com/wp-content/uploads/2011/05/Public-Toilets-
Transparent-Chennai-Issue-Brief.pdf accessed on 1th October 2015.
5. http://www.seu.ac.lk/researchandpublications/symposium/4thinternational/socilascien
ceshumanities/Water%20Supply%20and%20Demand.pdf accessed on 1th October 2015.
6. Statistical package for the social sciences (SPSS) for Windows (version 14), Chicago,
Illinois, USA: SPSS Inc, 2006.
7. Bryan F J Manly Multivariate Statistical Methods A Primer 1986; 76-89.
8. Carrat F, Valleron AJ. Epidemiologic mapping using the kriging method: application to an
influenza-like illness epidemic in France. Am J Epidemiol 1992; 135 : 1293-300.
9. Vasna J , Gupte MD, Adhikary R , Paranjape RS , Manikar MK , Brahmam GNV, Mahanta J
& Ramesh BM. Index based mapping of high risk behaviours for HIV among female sex
workers in India. Indian J Med Res 136 (Supplement), October 2012, pp 14-22.
http://icmr.nic.in/ijmr/2012/october%20supp/3.pdf
10. Environmental Systems Research Institute (ESRI), ArcGIS Desktop: Release 9.2. Redlands,
CA, USA.
11. http://ccs.in/internship_papers/2006/Statistical%20Analysis%20Health%20&%20Educat
ion%20in%20Chennai%20Slums%20%20-%20Vydyanathan.pdf accessed on 1th October
2015.
12. https://en.wikipedia.org/wiki/Chennai accessed on 1th October 2015.

36
Table A: Percent distribution of illiteracy covariates of Chennai City, 2011.
Table B: Index of illiteracy covariates of Chennai City, 2011.
ZONE IN_INDEX STD_INDEX
1 76.52 100.00
2 3.69 36.94
3 60.78 86.37
4 70.20 94.53
5 21.85 52.66
6 -5.10 29.33
7 -38.98 0.00
8 -19.84 16.57
9 7.56 40.29
10 -30.45 7.38
STD-INDEX = (IN-INDEX MIN OF IN-INDEX) * 100
(MAX IN-INDEX MIN IN-INDEX)

37
Figure A

38
Paper II
(Under publication process)
Determinants associated with infant immunization in Chennai City 2012, 2013.
Background
Immunization is the best way a child’s life can be protected from illness and disability. The
vaccination of children against six preventable diseases namely Diphtheria, Pertussis, Tetanus,
Measles, Poliomyelitis and Tuberculosis has been the cornerstone of the child health care
system. According to United Nations Children’s Fund (UNICEF)1 vaccine preventable diseases
(VPDs) cause an estimated 2 million deaths or more every year, of which approximately 1.5
million deaths occur among children below five year age. The Universal Child Immunization
programme was implemented during 1985-86. According to India 2009 evaluation survey2 the
immunization coverage for BCG, DPT1, DPT3 and measles are 87%, 83% 72% and 85%
respectively. As per the District Level Household Survey (DLHS4)3 during 2012–13, 58.6% of
children aged 12-23 months in the state of Tamil Nadu (urban) were fully vaccinated. A WHO
30-cluster survey4 in Chennai city (1993) showed Polio and DPT vaccine coverage of 93%, a BCG
vaccine coverage of 94% and a Measles vaccine coverage of 75%. A recent study5 in Tamil Nadu
for children aged 12-23 months, has shown that the full vaccination coverage for non slum
municipal corporations as 84.3%
Complete and correct dosage of vaccination is a key factor for children preventable diseases.
PICME (Pregnancy Infant Cohort Monitoring & Evaluation) is one of the e-health initiatives in
Tamil Nadu. This software was initiated on 1 April 2008 for both rural and urban areas of Tamil
Nadu. The system has accumulated a large volume of data. The study objective was i) to
identify the determinants associated with the complete immunization of infants for Chennai
City for the year 2012 and 2013 using binary logistic regression model. ii) to produce a
smoothened surface map of Chennai City with predicted values of Complete immunization
coverage of Chennai city for both years respectively.
Methods
PICME is user specific software introduced by Directorate of Public Health, Tamil Nadu and it
was developed by National Informatics Centre (NIC). It allows the user only for their portfolio of
operation. User specific IDs and password have been generated and distributed for each
Primary Health Centre (PHC) and the Sector Health Nurse (SHN) is the only authorized person
for application of data entry and verification. It gives information of about pregnant mothers.
Each mother has been given a unique ID called “PICME Number”. The details of pregnant
mothers are entered right from the date of early registration of pregnancy up to the completion
of first birth day of the child by Village Health Nurses (VHN). The Data’s being mainly focused

39
for high risk cases referral and monitoring mothers. The data consists of mother’s details, pre
and post natal Care, pregnancy complications and outcome, and the child’s immunization
details.
Definitions
Completely immunized child6: A child who has received 8 vaccines (BCG, 3 doses of DPT, 3
doses of OPV and 1 dose of measles) by the age of 12 months
A child was considered Completely immunized with valid doses, if he/she meets the following
condition (a) BCG vaccine – given before attainment of one year of age (b) DPT/Pentavalent
vaccine–First dose given after 6 weeks of birth and two subsequent doses with an interval of at
least 4 weeks and receipt of all the three doses before the first year of life (c) Measles vaccine –
administered after completion of 9 months (270 days) but before the first year of life.
The study was based on Chennai City with 200 wards and 15 zones. Children born in the year
2012 and 2013 and who has completed his/her first birthday was considered for the analysis.
The data set was cleaned and validated for correctness. There were n = 26835 and n = 36125
infants for the year 2012 and 2013 comprised of 122 Public Health Centres (PHC).
Fourteen covariates considered for the study were sex of the baby, birth weight of the baby,
whether breast fed at birth, birth complication, height of the mother, community of the
mother, education of the mother, education of the father, gravida of the mother, parity of the
mother, pregnancy outcome, number of births at delivery, place of delivery, immunization
status of the mother (whether completely immunized or not).
Binary logistic regression analysis was used to find the significant predictors of the completely
immunized infants (CII). The variables included in the logistic model were based on the Chi-
square tests which examines associations of different covariates with the complete
immunization status. Finally the covariates namely sex of the baby, birth weight of the baby,
gravida of the mother, age of the mother and education of the mother were included in the
binary logistic regression model. The model adequacy was examined using Hosmer-Lemeshow
test. The model was also assessed for confounding, interaction, and multicollinearity. Receiver
operating characteristic (ROC) curves were used both to define the optimal cut-off points and
to evaluate the ability of the logistic model to distinguish between CII and not completely
immunized infants7,8.
The predicted values of completely immunized infants of Chennai City were aggregated to
simple averages at PHC level. The cleaned information was completely available for 122 PHCs.
The latitude and longitude values of the centroids of PHC were identified using the Google
earth. The inverse distance weighting (IDW) method was used to interpolate the CII status
across Chennai City using ArcGIS11 spatial analyst software, to predict values for unmeasured

40
locations. For each predicted value, a minimum of 2 and a maximum of 12 surrounding points
(default value) were used. The result was the smoothened surface of Chennai City with
predicted values of complete immunization status, which took into account all the
determinants included in the model.
Results
In the year 2012, 77.4% of the children were completely immunized with correct time intervals
where as it was 74.7% in the year 2013. Nearly 1% of the infants were never given any
vaccination in both the years and the rest were given incorrect and incomplete doses (table C).
The binary logistic regression model assessed birth weight [(≤2kg) of the baby (OR 0.72; CI :
0.56, 0.93) and (2+ to 3kg ) (OR 1.12 ; CI: 1.02,1.23)], education of the mother [(high school or
above) (OR 0.87; CI : 0.82, 0.93)] and gravida [3 or more (OR 0.69; CI : 0.59,0.80)] as significant
predictors of complete immunization status in the year 2012 (table D) where as in 2013 sex of
the baby (OR 0.95; CI : 0.91, 0.99) birth weight of the baby (≤2kg) (OR 0.55; CI : 0.43, 0.69) and
education of the mother (high school or above) (OR 0.86; CI : 0.83, 0.94) turns out to be
significant predictors of the CII status (table E).
Figure B depicts the smoothened map of completely immunized infants with predicted values
of Chennai City. The map shows the regional variation of Chennai City with completely
immunized infants monitored in the PICME programme. The northern part of Chennai City
Zones 1, 2, 3 and 4 shows higher level of incomplete vaccination coverage in both the years.
The spread of lower level of CII has increased in the year 2013 than 2012.The lower south
western part of the Chennai city infants were more with CII than the rest of the area.
Discussion
In the present study, the incomplete immunization (less doses) and not vaccinated infants were
less (1.1% in 2012 and 1.6% in 2013) but more than one fifth (22% in 2012 and 24% in 2013)
attempted for Complete vaccination doses but with incorrect timings. If attempted correctly
then the complete vaccination coverage for Chennai City would be 98% to 99%.
In both the years’ birth weight of the baby and education of the mother turned out to be
significant predictors for complete immunization of the infant.
In the present study out of low birth weights infants (333 in 2012; 334 in 2013), 31% and 38%
respectively were not completely immunized. Preterm (PT) and low birth weight (LBW) infants
are at greater risk of increased morbidity from vaccine-preventable diseases. Generally they are
less likely to receive immunizations in a timely fashion because of their higher rates of medical
complications related to preterm birth9. The Red Book addressed the specific immunization
needs of PT and LBW infants and recommended that all PT infants receive, with the qualified
exception of hepatitis B vaccine given at birth, full doses of all routinely recommended
41
childhood vaccines at a chronologic age consistent with the schedule used for full-term (FT)
infants10,11.
There is a enormous demographic literature indicating that female literacy exerts greater
influence on fertility and child mortality than male literacy12,13. The present study also
emphasizes that a mother with high school or higher level of education has a correct
understanding and importance of the vaccination schedule.
The negligence of higher order of gravida (3 or more) among mothers in both years was
observed and among them nearly one fourth of the children were not completely immunized in
Chennai City. In the study there was no significant difference between gravida and live births.
An earlier study12, showed that the likelihood of vaccination decreases with increase in birth-
order and the negligence effect was more in urban than in rural mothers in India.
It has also been observed that still slight gender discrimination for vaccinating their children
exists in Chennai City. Some researchers have already notified the behaviour of families to
neglect and discriminate female children in India14,15,16.
Future focus should be to i) educate the mother and the health workers with the importance of
not only with complete dosages of vaccination but also with the correct time intervals/schedule
of vaccination dosages ii) importance of complete vaccination even for low birth weight babies
who are at higher risk of morbidity and iii) strategies to eliminate gender discrimination for
complete vaccination and negligence of higher order of birth for the healthy survival of the
infants from vaccine preventable diseases iv) northern part of Chennai city needs priority care
to move one step closer to cent percent complete immunization status of infants.
References
1. Committing to Child Survival: A Promise Renewed. Progress Report 2014. UNICEF, 2014.
Retrieved from http://files.unicef.org/publications/files/APR_2014_web_15Sept14.pdf
2. India: WHO and UNICEF estimates of immunization coverage: 2014 revision.
http://data.unicef.org/fckimages/uploads/immunization/india.pdf
3. International institute for population sciences (IIPS). District Level Household and
Facility Survey-4. State Fact Sheet Tamil Nadu (2012-13).
4. B.N. Murthy, S. Radhakrishna, S. Venkatasubramanian et al. Lot Quality Assurance
Sampling for Monitoring Immunization Coverage in Madras City. Indian Pediatrics 1999;
36:555-9.
5. Manoj V. Murhekar, P. Kamaraj, K. Kanagasabai et al. Vaccination coverage among
children aged 12-23 months, Tamil Nadu, India. IJMR under press.

42
6. World development report: investing in health. New York: Oxford University Press;
1993.
7. Hanley J, Mc Neil B. The meaning and use of the area under a ROC curve. Radiology
1982; 143 : 29-36. 9.
8. Haedo, Silvia A, Natal, Liliana M. Logistic regression and ROC curves: a non conventional
methodology. Available from: http://isi.cbs.nl/iamamember/CD2/pdf/772.PDF, accessed
on March 30, 2009.
9. Long SS, Pickering LK, Prober CG, eds. Principles and Practice of Pediatric Infectious
Diseases. New York, NY: Churchill Livingstone Inc; 1997:596–603, 607–608, 619–625,
981.
10. Saari TN. Immunization of Preterm and Low Birth Weight Infants. Pediatrics,. July 2003, VOL
112 (1).
11. American Academy of Pediatrics, Committee on Infectious Diseases. Immunization in
special circumstances. Preterm and low birth weight infants. In: Pickering LK, ed. 26th
ed. Red Book: 2003 Report of the Committee on Infectious Diseases. Elk Grove Village, IL:
American Academy of Pediatrics; 2003:66–68
12. Nilanjan Patra, Universal immunization programme in India: the determinants of
childhood immunization,
http://www.isical.ac.in/~wemp/Papers/PaperNilanjanPatra.pdf
13. Bhat, P.N. Mari and Rajan, S. Irudaya (1992): ‘Demographic Transition in Kerala: A
Reply’, Economic and Political Weekly, June 6, pp-1213-5.
14. Das Gupta, M. (1987): ‘Selective Discrimination against Female Children in Rural Punjab,
India’, Population Development Review, Vol-13, No.-1, pp-77-100.
15. Rajeshwari (1996): ‘Gender Bias in Utilization of Health Care Facilities in Rural Haryana’,
Economic and Political Weekly, Feb 24, pp-489-94.
16. Islam, S.M.S. and Islam, M.M. (1996): ‘Influences of Selected Socio-economic and
Demographic Factors on Child Immunization in a Rural Area of Bangladesh’,
Demography India, Vol-25, No.-2, pp-275-83.

43
Table C:
Infant immunization coverage of Chennai City 2012, 2013.
Immunization status 2012 2013 No (%) No (%)
Not Vaccinated 244 (0.9) 231(0.6)
Partially Vaccinated 60 (0.2) 345(1.0)
Fully Vaccinated but in incorrect timings 5760(21.5) 8558(23.7)
Fully vaccinated with correct timings 20771(77.4) 26991(74.7)
Total 26835 36125
Table D:
Determinants associated with the Immunization status in infants, Chennai City, 2012.
Characteristics N Adjusted OR (95% CI) P-value
Sex of the baby
Male 14286 1
Female 12487 0.98 (0.92, 1.03) 0.42
Birth weight of the baby
≤ 2 kg 333 0.72(0.56, 0.93) 0.01
2.1kg - ≤3kg 19801 1.12 (1.02,1.23) 0.02
3.1kg+ 6639 1 0.18
Age of the mother
≤ 22 5467 1
23 - 29 18786 1.02 (0.91,1.15) 0.68
30+ 2520 1.05 (0.95,1.16) 0.33
Mother’s education
IX std or less 17924 1
High school or more 8849 0.87 (0.82, 0.93) <0.001
Gravida
≤2 25519 1
3 or more 1254 0.69 (0.59,0.80) <0.001

44
Table E
Determinants associated with the Immunization status in infants, Chennai City, 2013.
Characteristics N Adjusted OR (95% CI) P-value
Sex of the baby
Male 19471 1
Female 16678 0.95(0.91, 0.99) 0.02
Birth weight of the baby
≤ 2 kg 334 0.55(0.43, 0.69) <0.001
2.1 - 3kg 26641 0.99(0.90, 1.08) 0.77
3.1kg + 9174 Age of the mother
≤ 21 11255 1
22 - 29 21957 0.99 (0.90, 1.10) 0.93
30+ 3003 0.92 (0.84, 1.01) 0.09
Mother’s education
IX std or less 9338 1
High school or more 13807 0.88 (0.83, 0.94) <0.001
Gravida
≤2 18785 1
3 or more 15520 0.93 (0.83, 1.04) 0.18

45
Figure B:
Spatial mapping of predicted values of Completely Immunized Infants of Chennai City.

46
References
1. Annual Reports of the Corporation of Madras/Chennai
2. Census of India. http://censusindia.gov.in/
3. https://en.wikipedia.org/wiki/List_of_Chennai_Corporation_zones
4. https://en.wikipedia.org/wiki/Timeline_of_Chennai_history#19th_century
5. https://en.wikipedia.org/wiki/History_of_Chennai
6. https://en.wikipedia.org/wiki/Chennai
7. http://shodhganga.inflibnet.ac.in/bitstream/10603/24086/8/08_chapter3.pdf
8. http://www.censusindia.gov.in/2011census/dchb/3302_PART_B_DCHB_CHENNAI.pdf
9. http://www.cmdachennai.gov.in/Volume1_English_PDF/Vol1_Chapter02_Demography.
10. http://www.cmdachennai.gov.in/Volume3_English_PDF/Vol3_Chapter03_Demography.
11. Vijayalakshmi R, Toshiyuki K, A Simulation of Land Use/Cover Change for Urbanization
on Chennai Metropolitan Area, India.
http://conference.corp.at/archive/CORP2014_73.pdf
12. http://www.cmdachennai.gov.in/Volume3_English_PDF/Vol3_Chapter08_Social%20Faci
lities%20.doc.pdf
13. http://www.kicc.jp/auick/database/training/2006-1/CR/WS2006-1CR-Chennai.pdf
14. www.indiaonlinepages.com/population/chennai-current-population.html
