no slide title · • 2009 acquisition of 2 x 300 mw calaca power plants (sem-calaca ... rizal cebu...
TRANSCRIPT
SEMIRARA MINING & POWER CORPORATION
Company Profile

ORGANIZATIONAL STRUCTURE
A member of the DMCI Holdings, Inc.
group of companies
Sem-Calaca
Power Corp.
*Southwest
Luzon Power
Generation
Corp.
*Sem-Cal
Industrial
Park
Developers,
Inc.
*Semirara
Claystone,
Inc.
*Semirara
Energy
Utilities, Inc.
*St. Raphael
Power
Generation
Corp.
*Sem-
Balayan
Power Power
Generation
Corp.
100% 100% 100% 100% 100% 100% 100%
Sem-Calaca
RES Corp.
* pre-operating

Semirara Island
Manila
350 Km.
San Jose
Occ. Mindoro
50 Km.
Libertad
Antique
85 Km.
Calaca
Batangas
250 Km.
Boracay/
Caticlan
60 Km.
ISLAND PROFILE
Semirara Island, Caluya
Province of Antique
Land Area = 55 sq. km. or
5,500 hectares
Three (3) Barangays
Nine (9) Sitios
Population ~ 16,661
Livelihood – Fishing & Farming
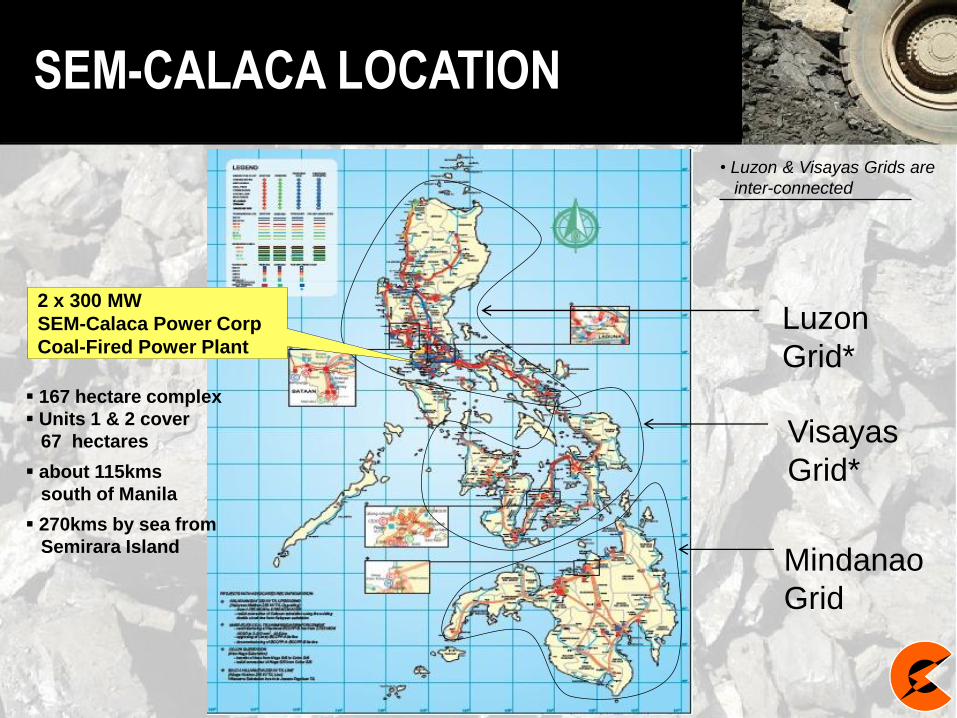
SEM-CALACA LOCATION
Luzon
Grid*
Visayas
Grid*
Mindanao
Grid
• Luzon & Visayas Grids are
inter-connected
2 x 300 MW
SEM-Calaca Power Corp
Coal-Fired Power Plant
167 hectare complex
Units 1 & 2 cover
67 hectares
about 115kms
south of Manila
270kms by sea from
Semirara Island

• 1940 Pres. Quezon through Proclamation # 649 declared the islands of Semirara, Sibay,
• and Caluya of Antique as coal mining reservation
• 1980 Incorporated in the Philippines as a limited liability company
• 1983 Initial public offering, listing on the Philippines Stock Exchange
• 1984 Commercial production at the Unong mine commenced
• 1997 DMCI Holdings, Inc. (DMCI-HI ) purchased 40% interest in Semirara
• 1998 Debt to equity conversion increased DMCI-HI’s interest to 74%
Installation of coal washing plant
• 1999 New management team installed by DMCI-HI
• 1999-2000 Unong mine depleted, operations commenced at Panian; Full shift from continuous to conventional mining system;
• 2004 Capital restructuring increased DMCI-HI’s interest to 94.5%; Declared stock dividend of PHP225m, consisting of 225m common shares; Authorized capital increased to 1b shares
• 2005 International and Domestic Offering of 105.046m shares, comprising of 46.875m primary
shares and 58.171m secondary offering, increased outstanding common shares to 296.875m; DMCI-HI’s interest reduced to 60%
• 2007 Maiden voyage carrying 28.8K MTs of coal to Xiamen, China
SEC’s Top 20 PLCs for Corporate Governance
• 2008 Coal Operating Contract is extended up to 14 July 2027 BOI Registration as expanding coal producer ISO Certifications – ISO 9001:2000, ISO14001:2004, OHSAS 18001:2007
Exploratory drilling activities indicated substantial coal deposits
Silver Awardee for SEC’s Top PLCs for Corporate Governance
MILESTONES
MILESTONES
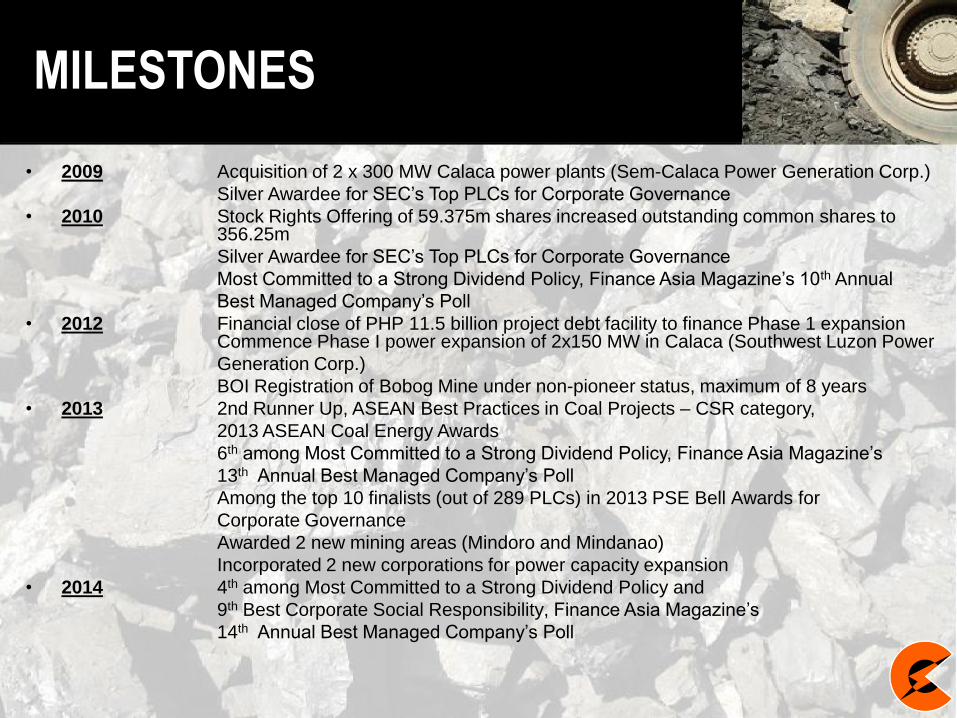
• 2009 Acquisition of 2 x 300 MW Calaca power plants (Sem-Calaca Power Generation Corp.)
Silver Awardee for SEC’s Top PLCs for Corporate Governance
• 2010 Stock Rights Offering of 59.375m shares increased outstanding common shares to 356.25m
Silver Awardee for SEC’s Top PLCs for Corporate Governance
Most Committed to a Strong Dividend Policy, Finance Asia Magazine’s 10th Annual
Best Managed Company’s Poll
• 2012 Financial close of PHP 11.5 billion project debt facility to finance Phase 1 expansion Commence Phase I power expansion of 2x150 MW in Calaca (Southwest Luzon Power
Generation Corp.)
BOI Registration of Bobog Mine under non-pioneer status, maximum of 8 years
• 2013 2nd Runner Up, ASEAN Best Practices in Coal Projects – CSR category,
2013 ASEAN Coal Energy Awards
6th among Most Committed to a Strong Dividend Policy, Finance Asia Magazine’s
13th Annual Best Managed Company’s Poll
Among the top 10 finalists (out of 289 PLCs) in 2013 PSE Bell Awards for
Corporate Governance
Awarded 2 new mining areas (Mindoro and Mindanao)
Incorporated 2 new corporations for power capacity expansion
• 2014 4th among Most Committed to a Strong Dividend Policy and
9th Best Corporate Social Responsibility, Finance Asia Magazine’s
14th Annual Best Managed Company’s Poll

Investment in Sem-Calaca MILESTONES
The 2 x 300 MW coal-fired power plants in Calaca, Batangas was
acquired by the Company in 2 December 2009 for $361.7 M

BOBOG PIT
48 mil. mt
► Coal Reserves Open Pit ………. 146 million mt Remaining as of Jan .1, 2014
Underground …. 12 million mt Initial for Tuong
► Other Minerals Limestone …….. 1.2 Billion Mt
Clay……………... 2.9 Million Mt
UNONG PIT
12 mil. Mt
( Depleted )
Total Land Area = 55 sq.km (5,500 hectares)
PANIAN PIT
(ACTIVE)
18 mil. Mt
Remaining
HIMALIAN
80 mil. mt
Tuong UG
12 mil. mt
► Earlier Studies Conducted by: AustroMineral Contractors, 1980-85
Dames & Moore, 1982
Geomontan, 1990
Monenco Consultants Limited, 1990
► Inhouse Drilling (2006-present)
690 Exploration & confirmatory drill holes
Coal and Other Reserves SEMIRARA RESOURCES
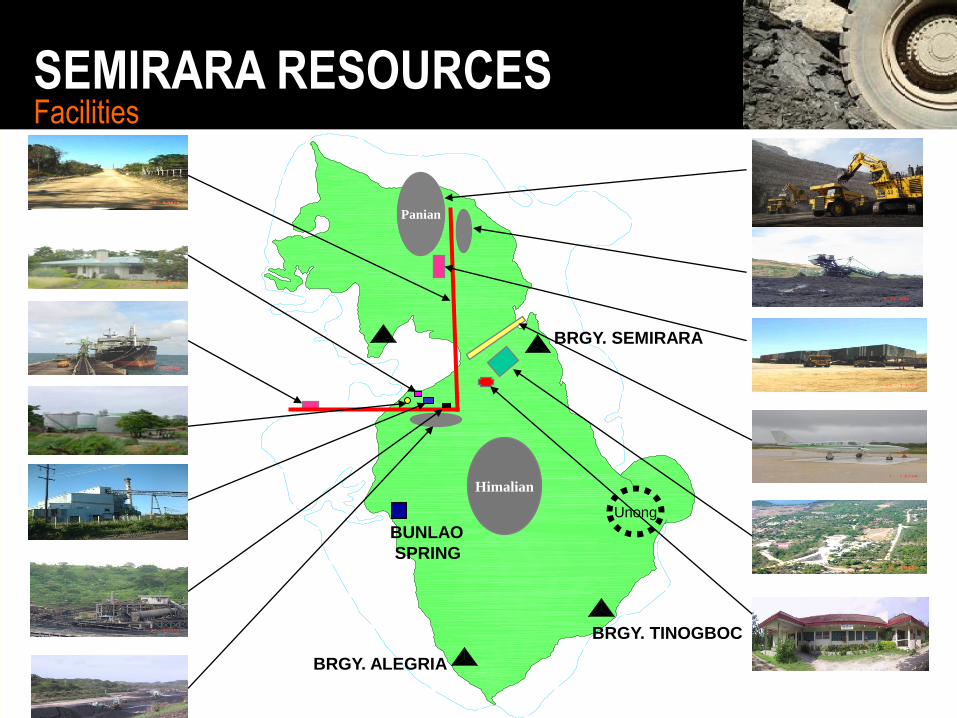
Panian
BRGY. TINOGBOC
BRGY. ALEGRIA
BRGY. SEMIRARA
Himalian
Unong
BUNLAO
SPRING
Facilities SEMIRARA RESOURCES

Stacks 300MW Unit 1
- built: 1984
300MW Unit 2
- built: 1995
NGCP Switchyard
Coal Yard
Powerhouse
Electrostatic Precipitator Boiler
Coal Unloading Facility
SEM-CALACA FACILITIES

Coal Unloading Facility
Transfer Tower Coal Yard
Silo Stacker/Reclaimer
Conveyor
SEM-CALACA FACILITIES

EQUIPMENT UNIT 1 UNIT 2
Steam Generator Foster Wheeler (FWEC),
USA
Asea Brown Boveri/
Combustion Eng’g
(ABB-CE), USA
Steam Turbine Toshiba, Japan GEC-Alsthom, France
Electric Generator Toshiba, Japan GEC-Alsthom, France
Condenser Toshiba, Japan GEC-Alsthom, France
EPC Mitsui and Co., Japan Mitsubishi, Japan
SEM-CALACA OEM / EPC
PRODUCTION
& OPERATIONS
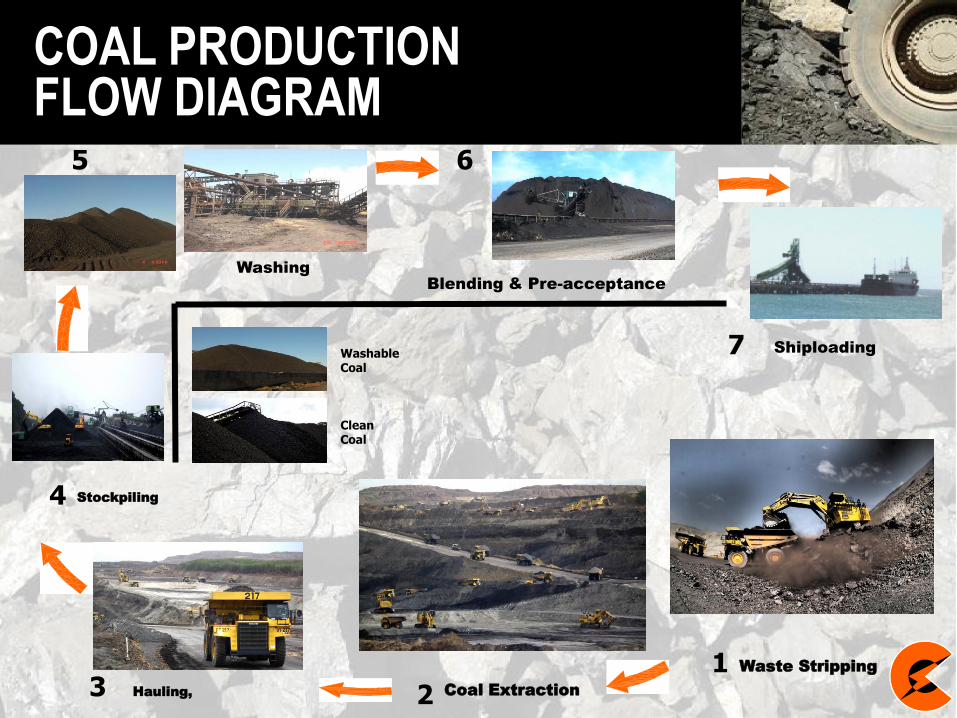
Waste Stripping
4
Clean Coal
Washable Coal
Coal Extraction Hauling,
Stockpiling
Washing
Blending & Pre-acceptance
Shiploading
1 2 3
5 6
7
COAL PRODUCTION FLOW DIAGRAM

COAL SPECIFICATIONS
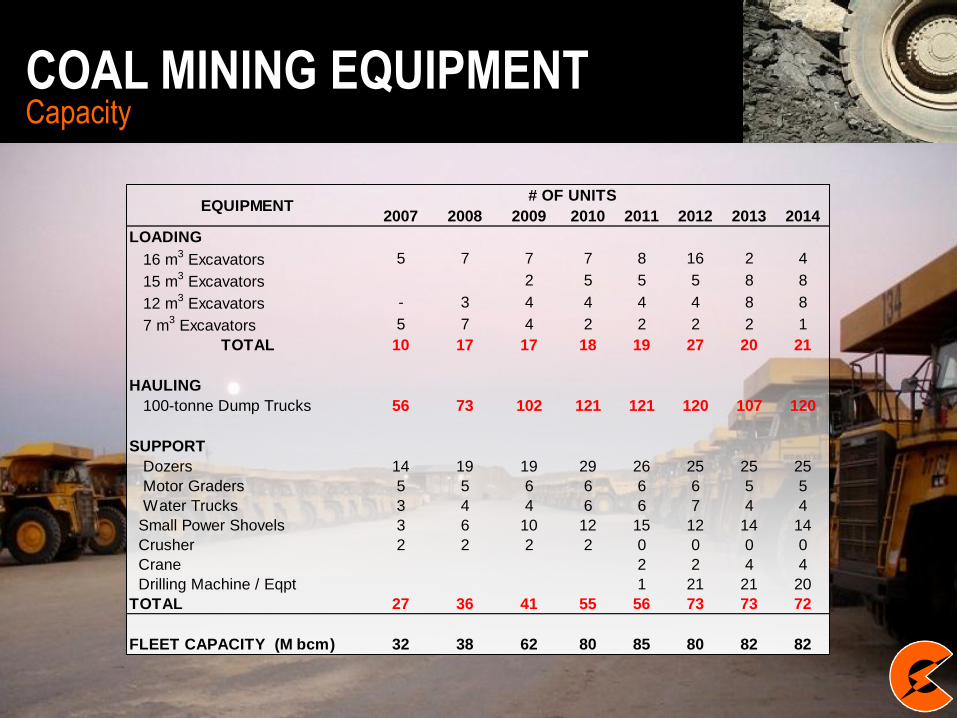
COAL MINING EQUIPMENT Capacity
2007 2008 2009 2010 2011 2012 2013 2014
LOADING
16 m3 Excavators 5 7 7 7 8 16 2 4
15 m3 Excavators 2 5 5 5 8 8
12 m3 Excavators - 3 4 4 4 4 8 8
7 m3 Excavators 5 7 4 2 2 2 2 1
TOTAL 10 17 17 18 19 27 20 21
HAULING
100-tonne Dump Trucks 56 73 102 121 121 120 107 120
SUPPORT
Dozers 14 19 19 29 26 25 25 25
Motor Graders 5 5 6 6 6 6 5 5
Water Trucks 3 4 4 6 6 7 4 4
Small Power Shovels 3 6 10 12 15 12 14 14
Crusher 2 2 2 2 0 0 0 0
Crane 2 2 4 4
Drilling Machine / Eqpt 1 21 21 20
TOTAL 27 36 41 55 56 73 73 72
FLEET CAPACITY (M bcm) 32 38 62 80 85 80 82 82
EQUIPMENT# OF UNITS

HISTORICAL COAL PRODUCTION Unong and Panian Annual Coal Production
0
1,000
2,000
3,000
4,000
5,000
6,000
7,000
8,000
9,000
1997 1998 1999 2000 2001 2002 2003 2004 2005 2006 2007 2008 2009 2010 2011 2012 2013
In t
ho
usan
d M
Ts
Unong closed;
Start of Panian
operations
Started
exporting
1997 Start of Unong operations
1983 Start of Coal Production at 177,858 MTs
1984 Introduction of bucketwheel operation
DMC
acquired
SCC
Record
Production:
7.7 M MTs

Total: 7.84 M MTs
2013 PHILIPPINE ROM COAL PRODUCTION In metric tons
SEMIRARA 7,570,003 MTs
97%
ZAMBOANGA 24,271 MTs
0%
CEBU 63,889 MTs
1%
ALBAY 23,964 MTs
0% SURIGAO 59,906 MTs
1%
SSCM 100,366 MTs
1%
Source: DOE
0
500
1,000
1,500
2,000
2,500
3,000
3,500
4,000
In G
Wh
Unit 1 Unit 2
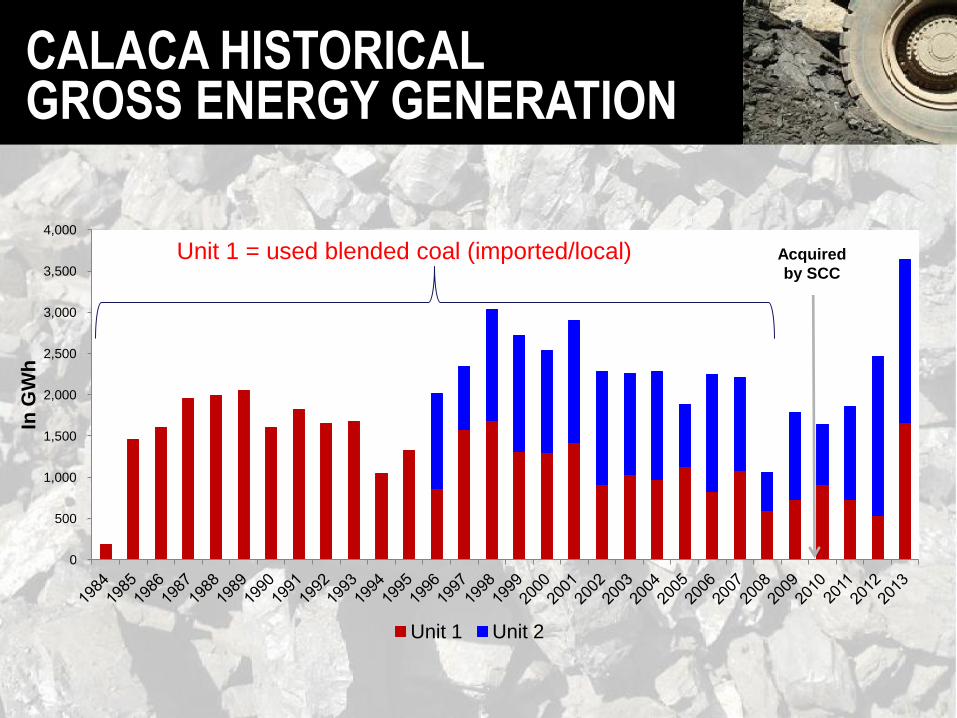
GROSS ENERGY GENERATION CALACA HISTORICAL
Acquired
by SCC
Unit 1 = used blended coal (imported/local)
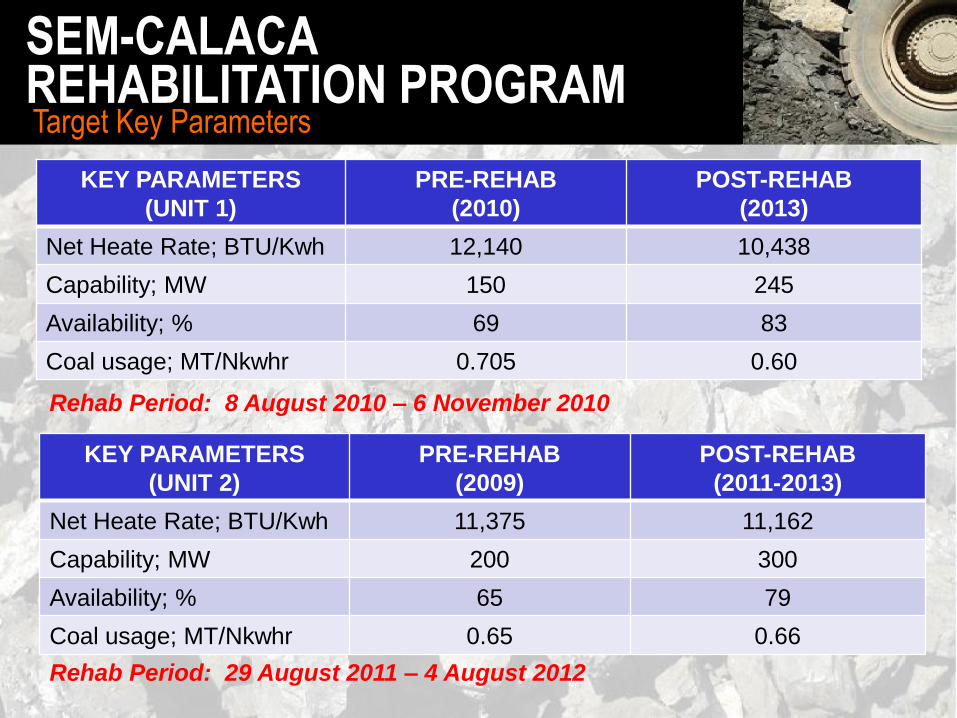
REHABILITATION PROGRAM SEM-CALACA
KEY PARAMETERS
(UNIT 1)
PRE-REHAB
(2010)
POST-REHAB
(2013)
Net Heate Rate; BTU/Kwh 12,140 10,438
Capability; MW 150 245
Availability; % 69 83
Coal usage; MT/Nkwhr 0.705 0.60
KEY PARAMETERS
(UNIT 2)
PRE-REHAB
(2009)
POST-REHAB
(2011-2013)
Net Heate Rate; BTU/Kwh 11,375 11,162
Capability; MW 200 300
Availability; % 65 79
Coal usage; MT/Nkwhr 0.65 0.66
Target Key Parameters
Rehab Period: 8 August 2010 – 6 November 2010
Rehab Period: 29 August 2011 – 4 August 2012

SALES
& MARKETING
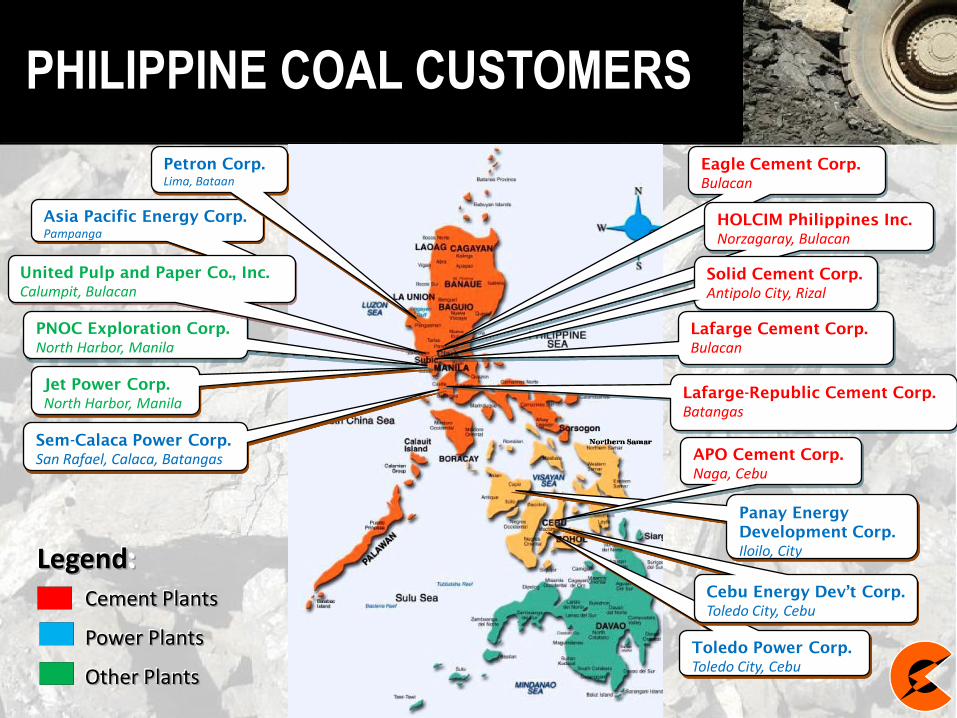
Asia Pacific Energy Corp.
Pampanga
PHILIPPINE COAL CUSTOMERS
Panay Energy
Development Corp.
Iloilo, City
Petron Corp.
Lima, Bataan
APO Cement Corp.
Naga, Cebu
Toledo Power Corp.
Toledo City, Cebu
Jet Power Corp.
North Harbor, Manila
Sem-Calaca Power Corp.
San Rafael, Calaca, Batangas
PNOC Exploration Corp.
North Harbor, Manila
Eagle Cement Corp.
Bulacan
HOLCIM Philippines Inc.
Norzagaray, Bulacan
Solid Cement Corp.
Antipolo City, Rizal
Cebu Energy Dev’t Corp.
Toledo City, Cebu
Lafarge Cement Corp.
Bulacan
Lafarge-Republic Cement Corp.
Batangas
United Pulp and Paper Co., Inc.
Calumpit, Bulacan
Legend: Cement Plants
Power Plants
Other Plants
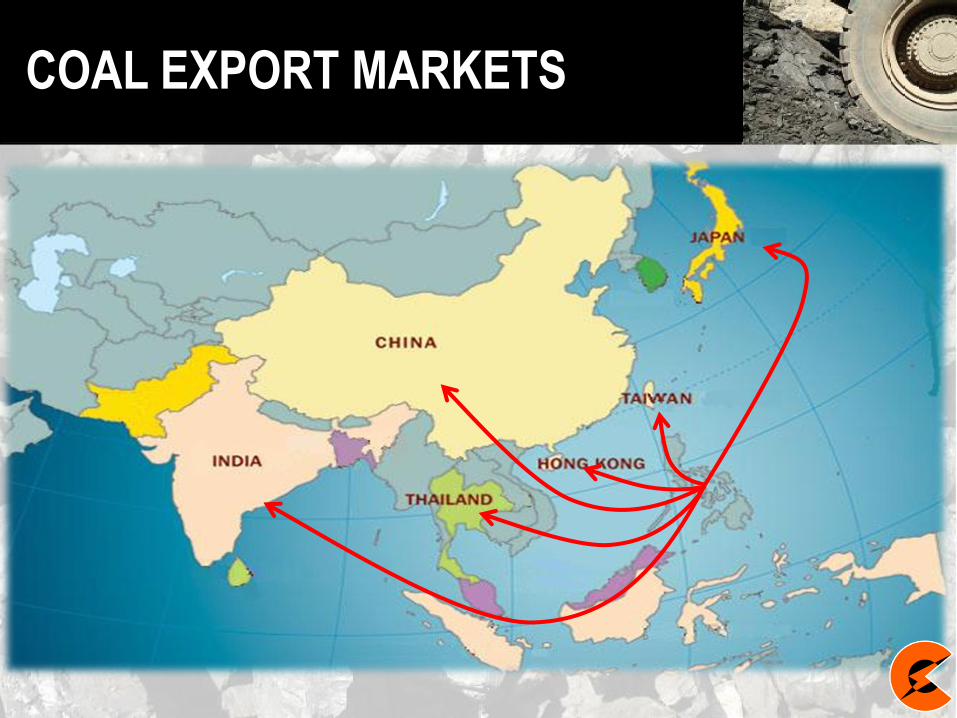
COAL EXPORT MARKETS
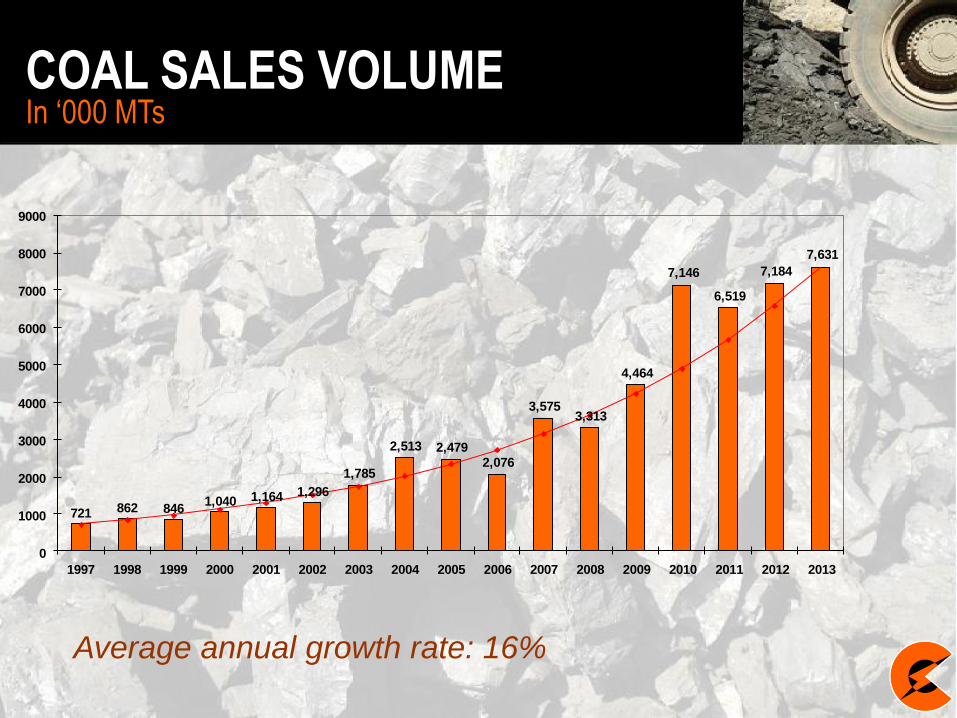
COAL SALES VOLUME In ‘000 MTs
Average annual growth rate: 16%
721 862 8461,040 1,164 1,296
1,785
2,513 2,4792,076
3,5753,313
4,464
7,146
6,519
7,184
7,631
0
1000
2000
3000
4000
5000
6000
7000
8000
9000
1997 1998 1999 2000 2001 2002 2003 2004 2005 2006 2007 2008 2009 2010 2011 2012 2013
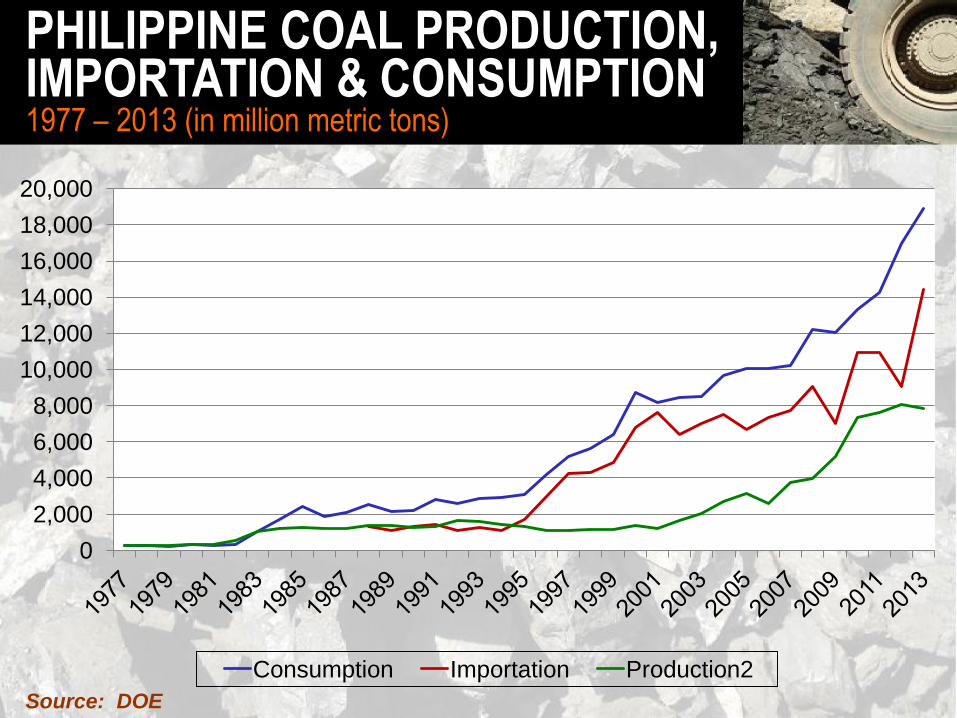
PHILIPPINE COAL PRODUCTION,
1977 – 2013 (in million metric tons) IMPORTATION & CONSUMPTION
Source: DOE
0
2,000
4,000
6,000
8,000
10,000
12,000
14,000
16,000
18,000
20,000
Consumption Importation Production2

SCC PHILIPPINE MARKET
SHARE
Total Local Consumption:
18.92 M MTs
Power Plants 14,762,464 MTs
78%
Cement Plants
3,154,691 MTs 17%
Industrial Plants
1,005,059 MTs 5%
2013 COAL CONSUMPTION
Source: DOE
22%
78%
0%
20%
40%
60%
80%
100%
SCC MARKET SHARE
Others
SCC

EXISTING COAL-FIRED POWER PLANTS
2 x 647 MW Sual Coal-Fired Power Plant, Pangasinan (TeaM Energy)
25 MW CFB UPPC Coal- Fired Power Plant, Bulacan (UPPC)
2 x 315 MW Masinloc Coal-Fired Power Plant, Pangasinan (AES)
50 MW CFB APEC Coal-Fired Power Plant, Pampanga (TIPCO)
2 x 600 MW CFB Mariveles Coal-Fired Power Plant, Bataan (GN Power) 2012
70 MW Petron Coal-Fired Power Plant, Limay Bataan 2 x 300 MW Batangas Coal- Power Plant, (SEM-Calaca/DMCI Group)
456 MW QPPL Coal-Fired Power Plant, (Quezon Power) 2 x 382 MW Pagbilao Coal-Fired Power Plant, Quezon (TeamM Energy)
2 x 82 MW CFB PEDC, Iloilo (Global Business Power Corp.)
3 x 82 MW CFB CEDC, Cebu (Global Business Power Corp.)
2 x 50 MW CFB CTPP, Cebu (Salcon Power Corp.)
2 x 100 MW CFB KSPC, Cebu (KEPCO-Salcon)
89 MW Toledo Power Corp., Cebu (Global Business Power Corp.)
2 x 10⁵ MW Mindanao Coal-Fired Power Plant, Misamis Oriental (STEAG)

COMMITTED POWER PROJECTS
Source: DOE
Luzon Grid Committed Power Projects Proponent Location Type Rated Capacity Project Costs Target
(MW) (PHP Billion) Commissioning South Luzon Thermal Energy Corp. (SLTEC) Puting Bato, West, Calaca, Batangas Coal-Fired 135.0 12.9 August 2014 South Luzon Thermal Energy Corp. (SLTEC) Puting Bato, West, Calaca, Batangas Coal-Fired 135.0 9.6 November 2015 Southwest Luzon Power Generation Corp. (SLPGC)
San Rafael, Calaca, Batangas
Coal-Fired
300.0
45.4
October 2014
San Jose 1 Power Corp. Brgy. Tulat, San Jose, Nueva Ecija Biomass 9.9 1.2 November 2014 Energy Development Corp. Sitio Burgos, Ilocos Wind 87.0 32 December 2014
TOTAL 666.9 101.1
Visayas Grid Committed Power Projects Proponent Location Type Rated Capacity Project Costs Target
(MW) (PHP Billion) Commissioning Toledo Power Corporation Toledo City, Cebu Coal-Fired 82.0 10.2 September 2014 Energy Development Corp. Nasuji, Valencia, Negros Or. Geothermal 50.0 4.0 August 2014 Sunwest Water & Electric Co., Inc. Brgy. Igsoro, Bugasong, Antique Hydro 8.0 1.4 May 2014 San Carlos BioPower Corp. San Carlos City, Negros Occ. Biomass 18.0 1.7 March 2015 Petrogreen Energy Corp. Brgy. Pawa, Nabas, Aklan Wind 50.0 5.4 December 2014 Trans-Asia Oil Renewable Energy Corp. San Lorenzo, Guimaras Wind 54.0 4.3 August 2014
TOTAL 262.0 27
Mindanao Grid Committed Power Projects Proponent Location Type Rated Capacity Project Costs Target
(MW) (PHP Billion) Commissioning Peak Power Soccsargen Inc. SocSarGen Biomass 20.9 0.250 September 2014 Peakpower San Francisco Inc. SocSarGen Biomass 5.2 September 2014 Therma South, Inc. Brgy. Binugao, Toril, Davao Coal-Fired 150.0 12.0 March 2015 Brgy. Inawayan, Davao del Sur
TOTAL 176.1 12.25

Source: DOE/ERDB, 11 Jul 2012
CEMENT & INDUSTRIAL COAL END-USERS
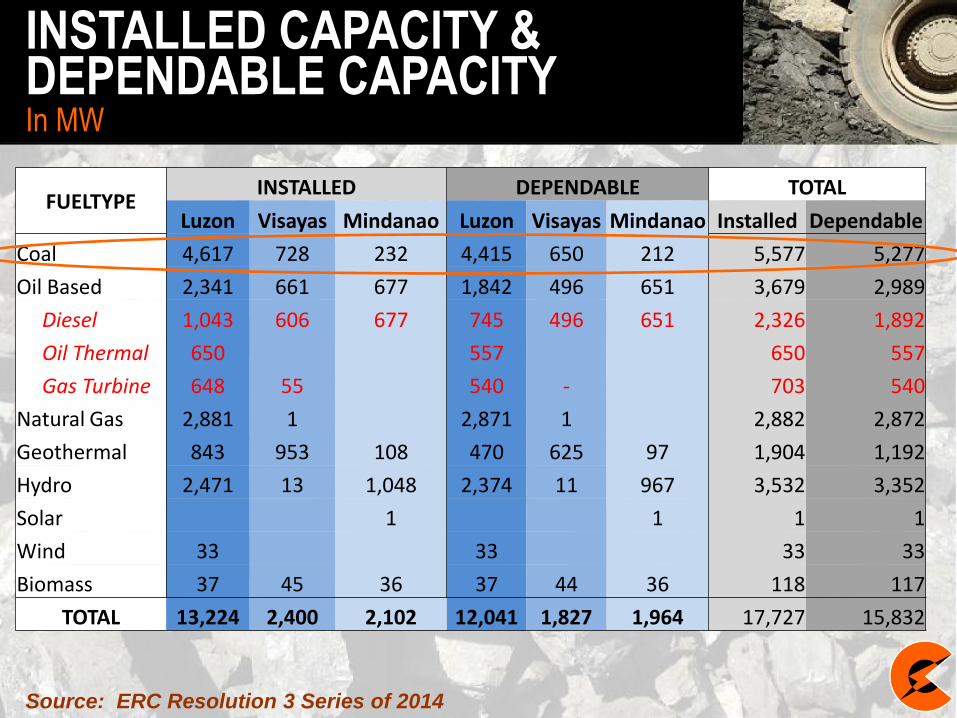
INSTALLED CAPACITY &
In MW DEPENDABLE CAPACITY
Source: ERC Resolution 3 Series of 2014
FUELTYPE INSTALLED DEPENDABLE TOTAL
Luzon Visayas Mindanao Luzon Visayas Mindanao Installed Dependable
Coal 4,617 728 232 4,415 650 212 5,577 5,277
Oil Based 2,341 661 677 1,842 496 651 3,679 2,989
Diesel 1,043 606 677 745 496 651 2,326 1,892
Oil Thermal 650 557 650 557
Gas Turbine 648 55 540 - 703 540
Natural Gas 2,881 1 2,871 1 2,882 2,872
Geothermal 843 953 108 470 625 97 1,904 1,192
Hydro 2,471 13 1,048 2,374 11 967 3,532 3,352
Solar 1 1 1 1
Wind 33 33 33 33
Biomass 37 45 36 37 44 36 118 117
TOTAL 13,224 2,400 2,102 12,041 1,827 1,964 17,727 15,832

LUZON SUPPLY & DEMAND OUTLOOK 2013-2030
Source: DOE
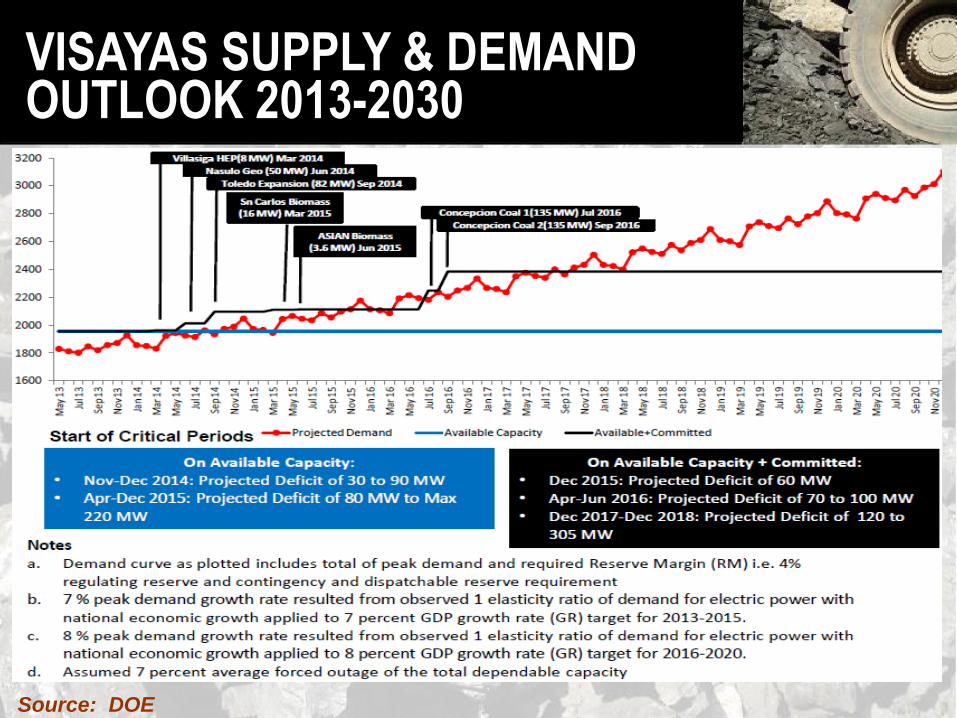
OUTLOOK 2013-2030
Source: DOE
VISAYAS SUPPLY & DEMAND
OUTLOOK 2013-2030
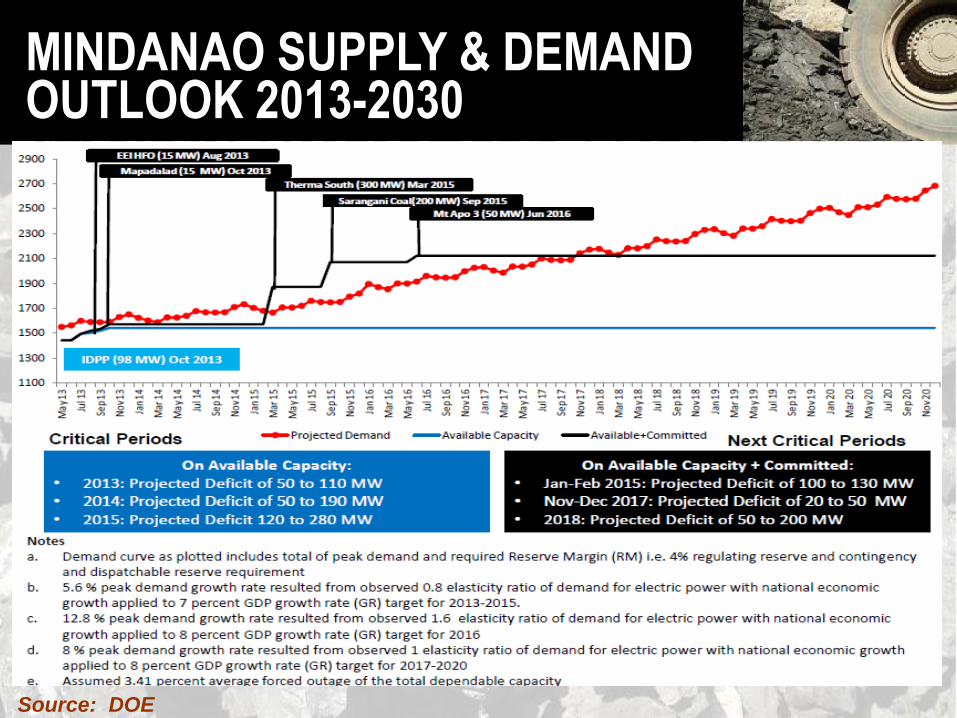
Source: DOE
MINDANAO SUPPLY & DEMAND

FINANCIAL
HIGHLIGHTS

TOTAL REVENUES In Million Pesos
Average annual growth rate: 26%
654 874 758 7711,360 1,517
2,177
5,066 5,5534,688
6,467
8,490
11,944
22,898
25,814
24,150
27,331
0
5,000
10,000
15,000
20,000
25,000
30,000
1997 1998 1999 2000 2001 2002 2003 2004 2005 2006 2007 2008 2009* 2010* 2011* 2012* 2013*
*Consolidated

NET INCOME AFTER TAX In Million Pesos
*Consolidated
(2,335)
(73) (307) (1,368)
(22) (110) 151
1,439 1,592
601 633 796
1,846
3,953
6,031 6,358
7,540
(2,500)
(500)
1,500
3,500
5,500
7,500
1997 1998 1999 2000 2001 2002 2003 2004 2005 2006 2007 2008 2009*2010*2011* 2012*2013*

BALANCE SHEET In Million Pesos
*Consolidated
1997 1998 1999 2000 2001 2002 2003 2004 2005 2006 2007 2008 2009* 2010* 2011* 2012* 2013*
Assets 2,598 3,506 3,679 2,736 3,240 3,413 3,099 3,862 6,928 6,511 6,558 6,111 24,26 30,49 35,62 36,18 44,83
Liabilities 2,353 2,248 2,729 2,853 3,379 3,546 3,094 2,502 2,736 2,197 1,944 1,811 14,38 18,15 20,82 19,29 24,70
Equity 245 1,258 951 (117) (139) (249) 6 1,361 4,192 4,315 4,615 4,301 9,884 12,34 14,80 16,89 20,13
-10,000
0
10,000
20,000
30,000
40,000
50,000
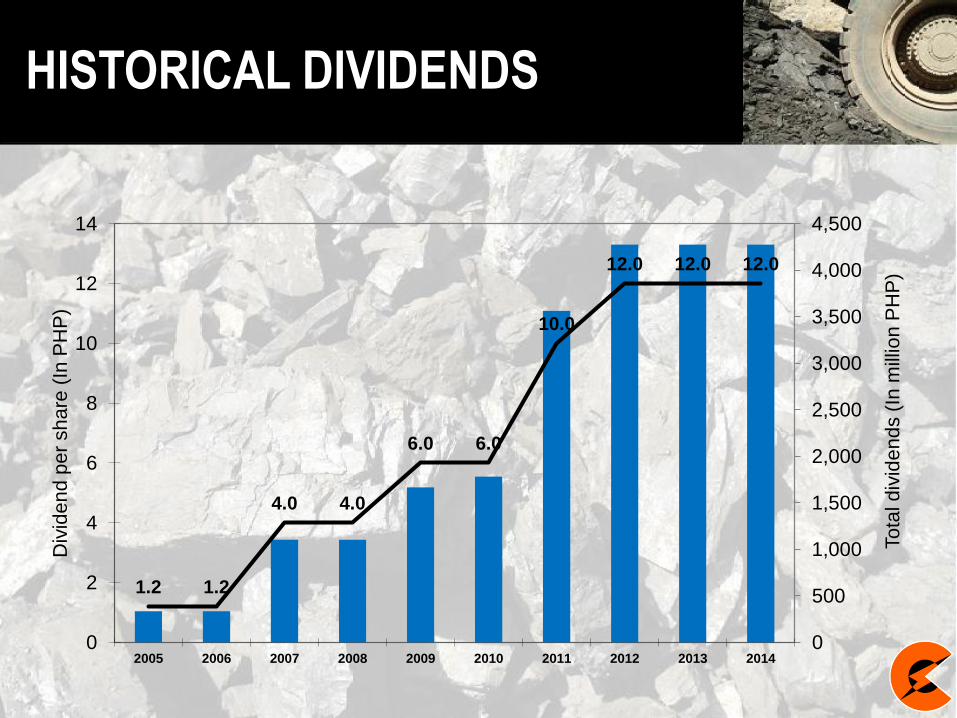
HISTORICAL DIVIDENDS
1.2 1.2
4.0 4.0
6.0 6.0
10.0
12.0 12.0 12.0
0
500
1,000
1,500
2,000
2,500
3,000
3,500
4,000
4,500
0
2
4
6
8
10
12
14
2005 2006 2007 2008 2009 2010 2011 2012 2013 2014
To
tal d
ivid
en
ds (
In m
illio
n P
HP
)
Div
ide
nd
pe
r sh
are
(In
PH
P)

STOCK PRICE MOVEMENT
IPO Price:
PHP 36 SRO
Acquisition of
Sem-Calaca
US Debt
Crisis
Export
maiden
voyage Subprime
Crisis
Shares
Buyback PhP 12
dividend
declaration
West Wall
Slide
200%
stock
dividends

COMMUNITY SOCIAL
RESPONSIBILITY
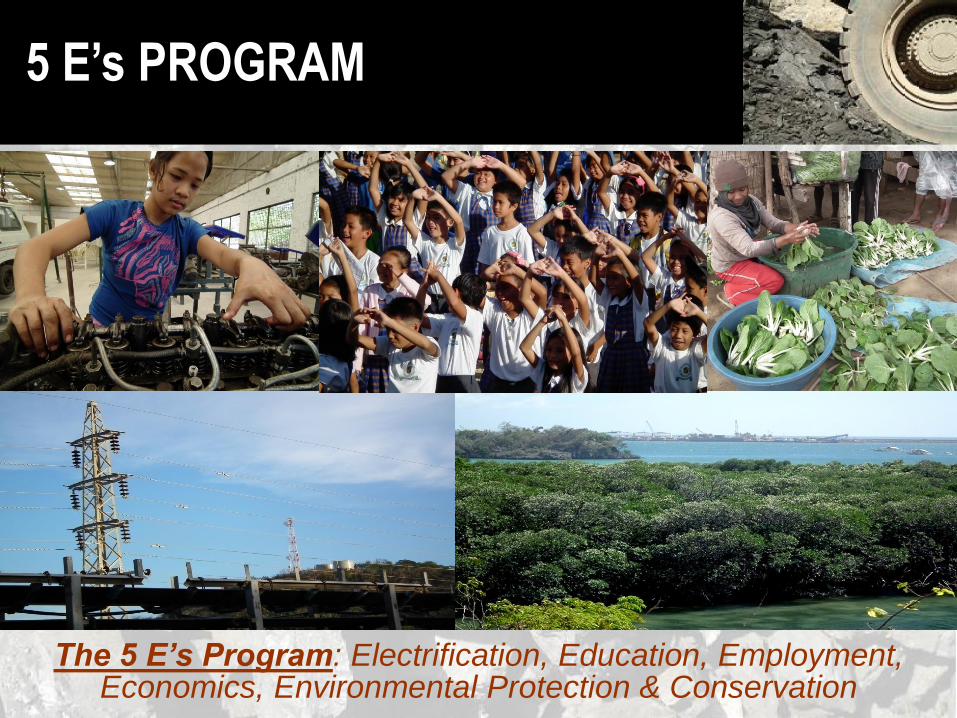
The 5 E’s Program: Electrification, Education, Employment, Economics, Environmental Protection & Conservation
5 E’s PROGRAM