no slide title · 2008-09 $489.5 2009-10 498.7 1.9% 2010-11 507.3 1.7% 2009-11 reductions. nu state...
TRANSCRIPT

1
Budget UpdatesFY 2010-11
2011-13 Biennium
Chris Kabourek
Asst. Vice President/ Director of Budget
April 16, 2010
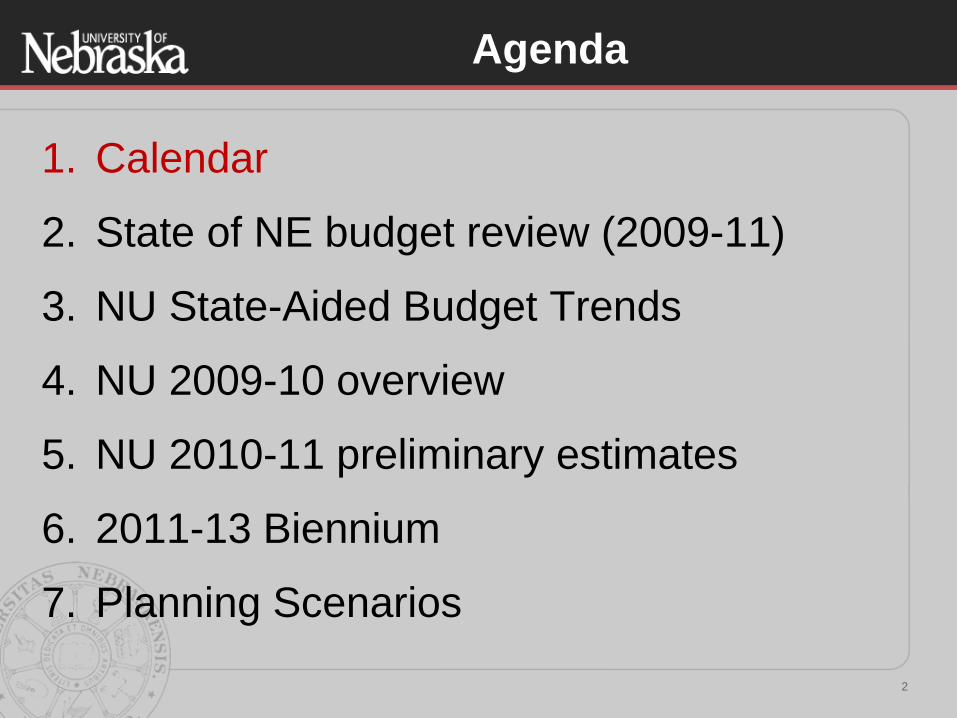
1. Calendar
2. State of NE budget review (2009-11)
3. NU State-Aided Budget Trends
4. NU 2009-10 overview
5. NU 2010-11 preliminary estimates
6. 2011-13 Biennium
7. Planning Scenarios
2
Agenda

Budget Development Calendar
Apr 16, 2010 – Board of Regents Meeting
Jun 11, 2010 – Board of Regents Meeting
(a) 2010-11 Operating Budget and Tuition Rates
(b) 2011-13 Operating & Capital Biennial Requests
July 1, 2010 – FY 2010-11 begins
Aug 2010 – Biennial budget requests submitted to CCPE
Sep 2010 – Biennial budget requests submitted to Governor
Oct 2010 – Forecasting Board 2011-13 revenue forecast
Jan 2011– Governor announces 2011-13 Biennial budget recommendations
July 1, 2011 – FY 2011-12 begins
July 1, 2012 – FY 2012-13 begins
3

1. Calendar
2. State of NE budget review (2009-11)
3. NU State-Aided Budget Trends
4. NU 2009-10 overview
5. NU 2010-11 preliminary estimates
6. 2011-13 Biennium
7. Planning Scenarios
4
Agenda

5
State Budget – May 2009 (Sine Die)(in millions)

6
State Budget – May 2009 (Sine Die)(in millions)
$555M ARRA
Funds
K-12 $234M
Medicaid $267M
General $54M

7
State Budget – October NEFAB(in millions)
$334M
Shortfall
after October
NEFAB
revenue
forecasts
were lowered

8
State Budget – Nov Special Session(in millions)
$334M Shortfall
$267M cuts (80%)
$70M fund
transfers (20%)

9
State Budget – Feb 2010(in millions)
$46M Shortfall
$31M Revenue
Reductions
$15M Spending
Increases (K-12)

10
State Budget – March 2010(in millions)
$46M Shortfall
$31M Revenue
Reductions
$15M Spending
Increases (K-12)
Medicaid ARRA
Funds $19M
$16M one-time
cash transfers
$14M spending
reductions
Addressed with:
IMPACT ON
NU STATE APPROPRIATION
11
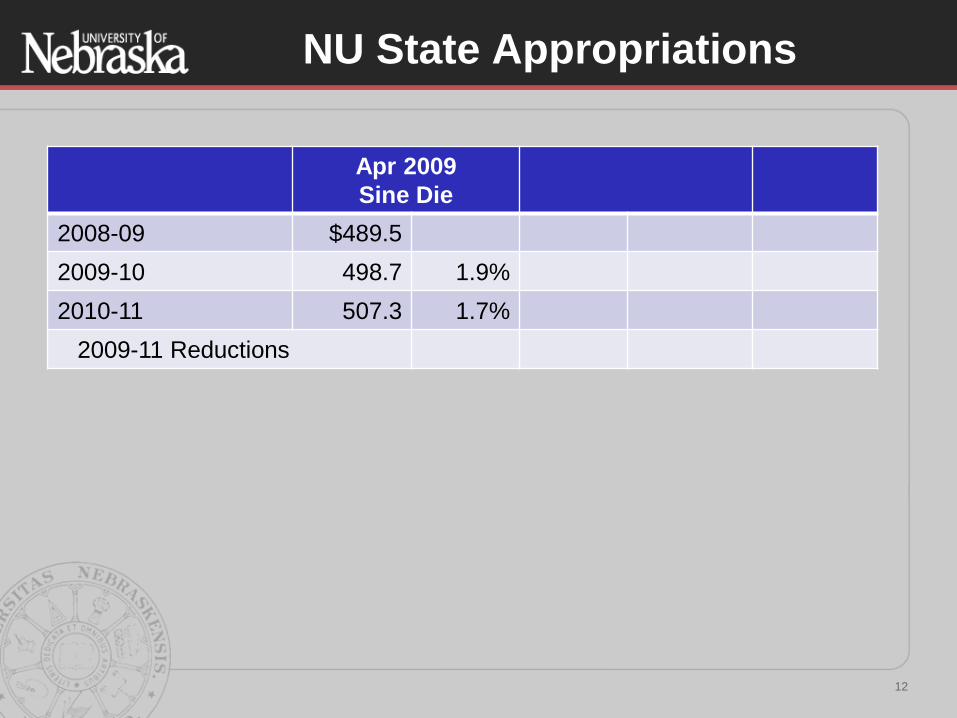
NU State Appropriations
12
Apr 2009
Sine Die
2008-09 $489.5
2009-10 498.7 1.9%
2010-11 507.3 1.7%
2009-11 Reductions

NU State Appropriations
13
Apr 2009
Sine Die
Nov 2009
Special Session
Change
2008-09 $489.5 $489.5
2009-10 498.7 1.9% 489.9 0.1% (8.8)
2010-11 507.3 1.7% 492.1 0.4% (15.2)
2009-11 Reductions (24.0)
ARRA provisions have prevented cuts below
2008-09 funding levels to Higher Education

1. Calendar
2. State of NE budget review (2009-11)
3. NU State-Aided Budget Trends
4. NU 2009-10 overview
5. NU 2010-11 preliminary estimates
6. 2011-13 Biennium
7. Planning Scenarios
14
Agenda

NU Operating Budget
2009-10
15
$1.9 billion total budget
But…..over 60% of funds are Restricted or Designated

Where the Money Comes From
and Where it Goes
16
Resources used for teaching and general university operations
“State-Aided” Funds
•$738 million budget
•Money comes from:
•State appropriations
•Student tuition
•Pays for:
• Instruction
•Student services
•Outreach (Cooperative Ext.)
•Administrative support
•Facilities
___

State-Aided Budget
17

TRENDS
18

19
State-Aided Budget(in millions)
Higher Ed Price Index Source: http://www.commonfund.org ttp://www.commonfund.org

20
State-Aided Budget(in millions)
Higher Ed Price Index Source: http://www.commonfund.org
*Assumes 2.5% inflation in 2010 (per Commonfund projection)

21
State-Aided Budget(in millions)
Higher Ed Price Index Source: http://www.commonfund.org
*Assumes 2.5% inflation in 2010 (per Commonfund projection)
State-Aided spending has been flat in real dollars(adjusted for Higher Ed Price Index (HEPI))

22
State Appropriations(in millions)
Higher Ed Price Index Source: http://www.commonfund.org
*Assumes 2.5% inflation in 2010 (per Commonfund projection)

23
State Appropriation Growth
from 2000 to 2010
Source: Legislative Fiscal Office Budget Reportsttp://www.commonfund.org

24
State Appropriation Growth
from 2000 to 2010
Source: Legislative Fiscal Office Budget Reports ttp://www.commonfund.org

25
State Appropriation Growth
from 2000 to 2010
Source: Legislative Fiscal Office Budget Reports. Includes $93M of ARRA funds to K-12.

26
State Appropriation Growth
from 2000 to 2010
Source: Legislative Fiscal Office Budget Reports. Includes $28M of ARRA funds to Medicaid.

27
State Appropriations(in millions)
Higher Ed Price Index Source: http://www.commonfund.org
*Assumes 2.5% inflation in 2010 (per Commonfund projection)

28
State Appropriations(in millions)
Higher Ed Price Index Source: http://www.commonfund.org
*Assumes 2.5% inflation in 2010 (per Commonfund projection)

29
State Appropriations(in millions)
Higher Ed Price Index Source: http://www.commonfund.org
*Assumes 2.5% inflation in 2010 (per Commonfund projection)
State Appropriations have not kept pace with inflation(adjusted for Higher Ed Price Index (HEPI))

30
Tuition Revenues(in millions)
Higher Ed Price Index Source: http://www.commonfund.org
*Assumes 2.5% inflation in 2010 (per Commonfund projection)

31
Tuition Revenues(in millions)
Higher Ed Price Index Source: http://www.commonfund.org
*Assumes 2.5% inflation in 2010 (per Commonfund projection)

32
Tuition Revenues(in millions)
Higher Ed Price Index Source: http://www.commonfund.org
*Assumes 2.5% inflation in 2010 (per Commonfund projection)
Prices have grown faster than inflation(adjusted for Higher Ed Price Index (HEPI))

Internal Reallocation
“to assign to a different purpose from the
one originally intended”
AKA = Budget Cuts
33
Utilized to:
1. Balance the budget
2. Invest in Priorities
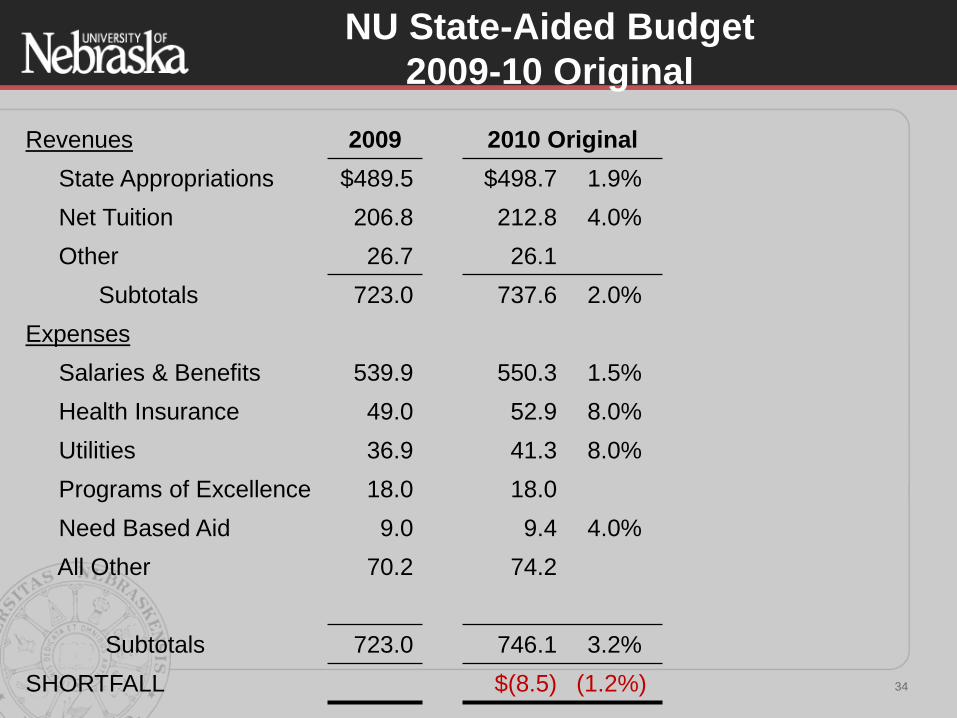
Revenues 2009 2010 Original
State Appropriations $489.5 $498.7 1.9%
Net Tuition 206.8 212.8 4.0%
Other 26.7 26.1
Subtotals 723.0 737.6 2.0%
Expenses
Salaries & Benefits 539.9 550.3 1.5%
Health Insurance 49.0 52.9 8.0%
Utilities 36.9 41.3 8.0%
Programs of Excellence 18.0 18.0
Need Based Aid 9.0 9.4 4.0%
All Other 70.2 74.2
Subtotals 723.0 746.1 3.2%
SHORTFALL $(8.5) (1.2%) 34
NU State-Aided Budget
2009-10 Original

2009-10 Reallocations
$8.5 Million
• 103 FTE eliminated
• 27 filled
• 76 vacant
• Eliminated or reduced state support for
• Public Policy Center
• Nebraska Statewide Arboretum
• Mary Riepmas Ross Media Arts Center
• Eliminated or reduced operating support for
• Travel
• Information technology
• Equipment
• Building services 35

Revenues 2009 2010 Original
State Appropriations $489.5 $498.7 1.9%
Net Tuition 206.8 212.8 4.0%
Other 26.7 26.1
Subtotals 723.0 737.6 2.0%
Expenses
Salaries & Benefits 539.9 550.3 1.5%
Health Insurance 49.0 52.9 8.0%
Utilities 36.9 41.3 8.0%
Programs of Excellence 18.0 18.0
Need Based Aid 9.0 9.4 4.0%
All Other 70.2 74.2
Subtotals 723.0 746.1 3.2%
SHORTFALL $(8.5) (1.2%) 36
NU State-Aided Budget
2009-10 Original

Revenues 2009 2010 Original 2010 Revised
State Appropriations $489.5 $498.7 1.9% $489.9 0.1%
Net Tuition 206.8 212.8 4.0% 212.8 4.0%
Other 26.7 26.1 26.1
Subtotals 723.0 737.6 2.0% 728.8 0.8%
Expenses
Salaries & Benefits 539.9 550.3 1.5% 550.3 1.5%
Health Insurance 49.0 52.9 8.0% 52.9 8.0%
Utilities 36.9 41.3 8.0% 41.3 8.0%
Programs of Excellence 18.0 18.0 18.0
Need Based Aid 9.0 9.4 4.0% 9.4 4.0%
All Other 70.2 74.2 74.2
Subtotals 723.0 746.1 3.2% 746.1 3.2%
SHORTFALL $(8.5) (1.2%) $(17.3) (2.4%) 37
NU State-Aided Budget
2009-10 Revised

Revenues 2009 2010 Original 2010 Revised
State Appropriations $489.5 $498.7 1.9% $489.9 0.1%
Net Tuition 206.8 212.8 4.0% 212.8 4.0%
Other 26.7 26.1 26.1
Subtotals 723.0 737.6 2.0% 728.8 0.8%
Expenses
Salaries & Benefits 539.9 550.3 1.5% 550.3 1.5%
Health Insurance 49.0 52.9 8.0% 52.9 8.0%
Utilities 36.9 41.3 8.0% 41.3 8.0%
Programs of Excellence 18.0 18.0 18.0
Need Based Aid 9.0 9.4 4.0% 9.4 4.0%
All Other 70.2 74.2 74.2
Cuts Implemented (8.5) (1.2%)
Subtotals 723.0 746.1 3.2% 737.6 2.0%
SHORTFALL $(8.5) (1.2%) $(8.8) (1.2%) 38
NU State-Aided Budget
2009-10 Revised

Additional Proposed Cuts
UNL Proposals (to be implemented in 2010-11)
• 15 additional FTE cuts (5.7 FTE filled)
• IANR Communications and Information Technology unit• 5.7 filled and 6.9 vacant positions eliminated
• Lentz Center for Asian Studies state support (1.65 FTE)
• Assoc Vice Chancellor Academic Affairs (1.0 FTE)
• Shift $2M of library expenses to research funds
39
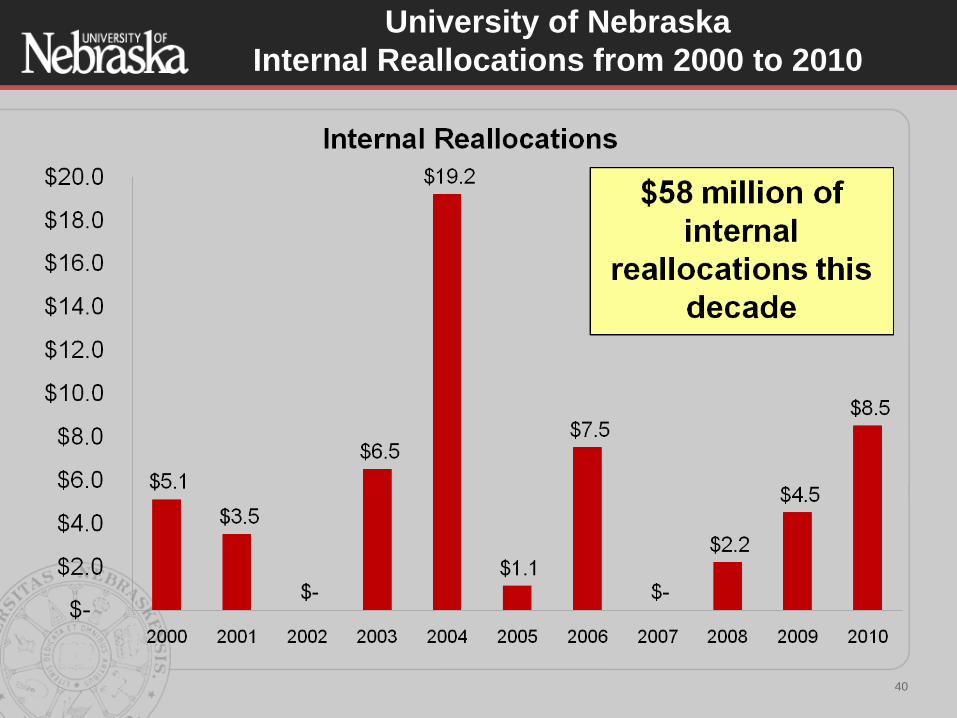
University of Nebraska
Internal Reallocations from 2000 to 2010
40
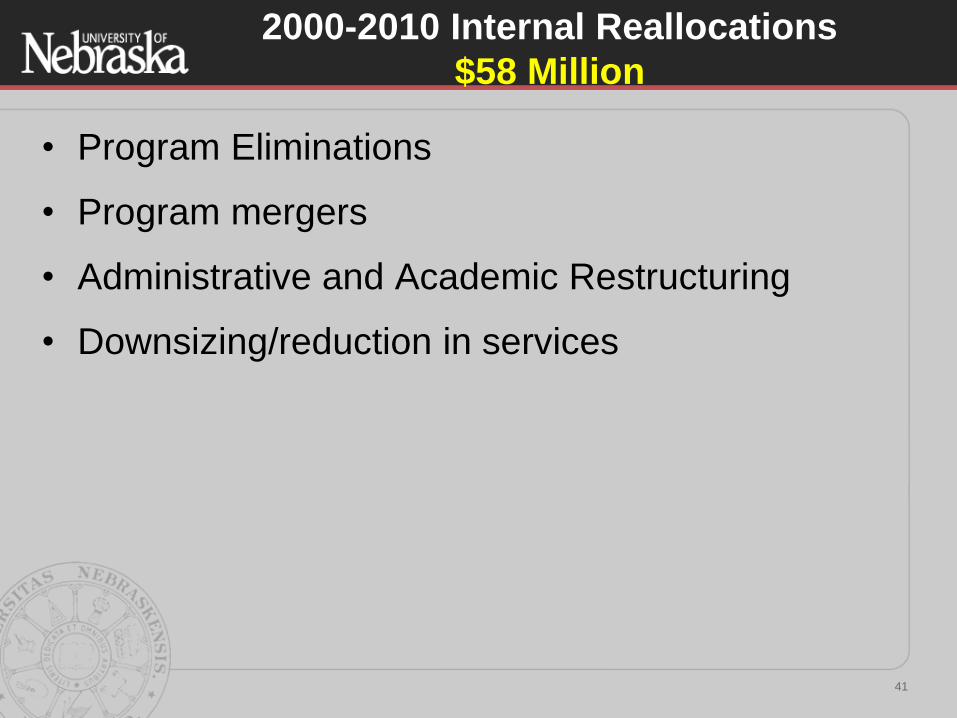
2000-2010 Internal Reallocations
$58 Million
• Program Eliminations
• Program mergers
• Administrative and Academic Restructuring
• Downsizing/reduction in services
41
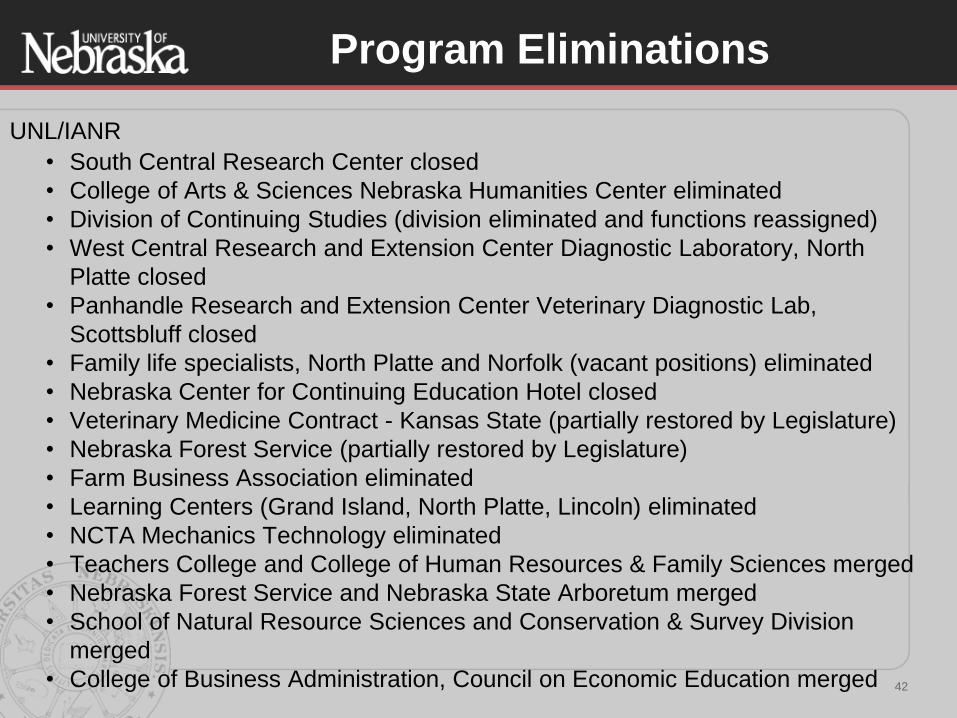
UNL/IANR
• South Central Research Center closed
• College of Arts & Sciences Nebraska Humanities Center eliminated
• Division of Continuing Studies (division eliminated and functions reassigned)
• West Central Research and Extension Center Diagnostic Laboratory, North
Platte closed
• Panhandle Research and Extension Center Veterinary Diagnostic Lab,
Scottsbluff closed
• Family life specialists, North Platte and Norfolk (vacant positions) eliminated
• Nebraska Center for Continuing Education Hotel closed
• Veterinary Medicine Contract - Kansas State (partially restored by Legislature)
• Nebraska Forest Service (partially restored by Legislature)
• Farm Business Association eliminated
• Learning Centers (Grand Island, North Platte, Lincoln) eliminated
• NCTA Mechanics Technology eliminated
• Teachers College and College of Human Resources & Family Sciences merged
• Nebraska Forest Service and Nebraska State Arboretum merged
• School of Natural Resource Sciences and Conservation & Survey Division
merged
• College of Business Administration, Council on Economic Education merged 42
Program Eliminations

UNO
• Learning center eliminated
• Masters degree programs eliminated, Political Science and Sociology
• College of Continuing Studies
• Office of faculty development eliminated
• Bachelors degree in Public Administration eliminated
• Fine Arts, Communications and Radio/TV merged under one college
• Distance education merged with Academic Computing
• Academic Affairs and Student Services merged (two vice chancellor positions
eliminated
• Purchasing office eliminated
• Audio Visual department eliminated
• New student orientation and recruitment services merged
UNK
• Adaptive Physical Education graduate program eliminated
• Center for Excellence in Leadership eliminated
• German and German Education majors eliminated
• Mathematics MS and Statistics and Actuarial Science majors eliminated
UNMC
• College of Pharmacy proposed satellite location eliminated 43
Program Eliminations (cont’d)

Internal Reallocations have
allowed us to invest in
priorities….
44

Affordable access
• Moderate and predictable tuition increases
• Need Based Aid
Quality Programs
• Programs of Excellence
• Student and Faculty Diversity
Accountability
• Continuous evaluation of budget priorities
45
Strategic Framework PrioritiesFunded from Internal Reallocations

1. Calendar
2. State of NE budget review (2009-11)
3. NU State-Aided Budget Trends
4. NU 2009-10 overview
5. NU 2010-11 preliminary estimates
6. 2011-13 Biennium
7. Planning Scenarios
46
Agenda

2010-11 Assumptions
Ongoing Operations
• Health Insurance 5%
• Utilities 8%
• SIS operating/licenses
Campus Specific
• UNO/UNK Faculty Bargaining Contracts
• New building openings
• College of Nursing Norfolk, LB 603 Behavioral Health
To Be Determined:
• Faculty and Staff Salaries
• Tuition rates
• Internal Reallocations47

Southeast Community College 2%
Mid Plains CC (North Platte) 5%
Western NE CC 3% ($2 / SCH)
U of Arizona 20%
Arizona State 19%
U of Northern Arizona 16%
U of Colorado-Boulder 9% (UNL peer)
U of Colorado – Denver 9% (UNO peer)
Utah 8%
Ohio State 7% (UNL peer)
U of Iowa 6% (UNL peer)
Iowa State 6% (UNL peer)
Northern Iowa 6% (UNO & UNK peer)
U of Texas – Austin 5%
LSU 5%
U of Wyoming 5%
48
2010-11 Tuition Increases

1. Calendar
2. State of NE budget review (2009-11)
3. NU State-Aided Budget Trends
4. NU 2009-10 overview
5. NU 2010-11 preliminary estimates
6. 2011-13 Biennium
7. Planning Scenarios
49
Agenda

50
State Budget(in millions)

51
State Budget(in millions)

52
State Budget(in millions)
$670M Shortfall Projected
in 2011-13 Biennium

2011-13 Biennium
• Structural imbalance from supporting ongoing spending
with one-time resources:
• Federal ARRA funds
• Cash fund lapses
• Cash reserve transfers
• $670 million shortfall assumes 7.2% annual revenue growth
53

Further Decline in Financial Status?
54
Current
Avg.
Global
Insight
Avg. All
Forecasts
High Est.
LFO-Fair
Low Est.
LFO-Global
FY 2010-11 NEFAB $3,405 $3,405 $3,405 $3,405 $3,405
FY 2011-12 Est. $3,668 $3,583 $3,644 $3,711 $3,553
FY 2012-13 Est. $3,962 $3,753 $3,851 $3,968 $3,712
FY 2011-12 Est. 7.2% 4.9% 6.6% 8.3% 4.1%
FY 2012-13 Est. 7.2% 4.2% 5.1% 6.2% 4.0%
$ Difference
FY 2011-12 Est. $ - $ (86) $ (24) $ 43 $ (115)
FY 2012-13 Est. $ - $ (209) $ (111) $ 6 $ (250)
Cumulative Total $ - $ (295) $ (135) $ 49 $ (365)

State Cash Reserve(in millions)
55
2008-09 2009-10 (est.) 2010-11 (est.)
Beginning Balance $ 546 $ 578 $ 455
Transfers +32 (123) (133)
Ending Balance $ 578 $ 455 $ 322

1. Calendar
2. State of NE budget review (2009-11)
3. NU State-Aided Budget Trends
4. NU 2009-10 overview
5. NU 2010-11 preliminary estimates
6. 2011-13 Biennium
7. Planning Scenarios
56
Agenda


Access and Affordability
Quality Programs
Workforce and Economic Development
Research Growth
Engagement with the State
Accountability
58
Strategic Framework Priorities

+ Nebraska Revenues bottomed out?• March receipts met forecast
+ Nebraska’s economy in better shape
compared to many other states
+ University of Nebraska in strong position
relative to other states and peer institutions
59
Good News

DISCUSSION
60