no tissue damage by chronic deep brain stimulation in
TRANSCRIPT
No Tissue Damage byChronic Deep BrainStimulation inParkinson’s DiseaseChristine Haberler, MD,* Francois Alesch, MD,†Peter R. Mazal, MD,‡, Peter Pilz, MD,§Kurt Jellinger, MD,i Michaela M. Pinter, MD,¶Johannes A. Hainfellner, MD,* and Herbert Budka, MD*
We report on the pathological findings in the brains of 8Parkinson’s disease patients treated with deep brain stim-ulation (DBS) of the thalamic ventral intermediate nu-cleus (6 cases) and subthalamic nucleus (2 cases). DBSwas performed continuously for up to 70 months. Allbrains showed well-preserved neural parenchyma andonly mild gliosis around the lead track compatible withreactive changes due to surgical placement of the elec-trode. We conclude that chronic DBS does not causedamage to adjacent brain tissue.
Haberler C, Alesch F, Mazal PR, Pilz P,Jellinger K, Pinter MM, Hainfellner JA,
Budka H. No tissue damage by chronic deepbrain stimulation in Parkinson’s disease.
Ann Neurol 2000;48:372–376
In the 1950s and 1960s, thalamotomy was introducedas a treatment for tremor in Parkinson’s disease (PD).It was empirically recognized that high-frequency stim-ulation (.100 Hz) of the thalamic ventral intermedi-ate nucleus (VIM) produces tremor arrest. The discov-ery of L-dopa in 1967 replaced stereotactic surgery. Inthe 1980s, the side effects and limits of chronic L-dopatherapy became obvious and led to the reintroductionof surgical treatment of motor symptoms in PD. Anew less destructive technique, deep brain stimulation(DBS), was developed.1 During the last 10 years, sev-eral groups have demonstrated that chronic DBS ofthe VIM, subthalamic nucleus (STN), or internal glo-bus pallidus is an effective treatment for disablingpharmacotherapy-resistant motor symptoms (tremor,rigor, bradykinesia) in PD (see review by Starr and
co-workers2). Compared with ablative surgery, DBS isa less destructive and more adaptable method, that is,stimulus parameters can be changed to increase efficacyor reduce side effects. Although many patients havebeen successfully treated with DBS, little is knownabout the effects of long-term stimulation on adjacentbrain tissue. So far, only one autopsy report on a PDpatient stimulated discontinuously over 43 months isavailable.3 Here, we report the neuropathological find-ings in 8 PD patients who had continuous DBS for upto 70 months. We show that chronic DBS does notcause damage to adjacent brain tissue.
Patients and MethodsThe brains of 8 patients were investigated. The target sitewas the VIM in 6 patients and the STN in 2 patients. In 4patients, bilateral stimulation was performed. None of thepatients had a previous thalamotomy. Implantation of theleads was performed as described previously.4 In brief, theimplantation is performed under stereotactic conditions withlocal anesthesia using special computed tomography andmagnetic resonance imaging scans as well as ventriculogra-phy. The target is first determined on a pure radioanatomicalbasis. The testing electrode is then inserted within the targetarea, and a neurophysiological examination is performed.Once the optimal point is localized, the permanent electrodeis implanted. Quadripolar leads were implanted in 7 pa-tients, and a monopolar lead was implanted in 1 patient(models SP5535, 3387 and 3389; Medtronic, Minneapolis,MN) Measurements of active contacts were 1.47 mm in di-ameter and 4 mm in length. After a screening phase of a fewdays up to 2 weeks, a pulse generator (ITREL; Medtronic)was connected to the lead and implanted subcutaneously inthe infraclavicular area. Monopolar or bipolar stimulationwas programmed using one or a combination of the fourcontacts. In Patients 1 through 7, stimulation was performedcontinuously. Patient 8 was stimulated irregularly for 2 daysduring a postoperative screening phase and thus served as acontrol to determine the acute changes after implantation.Stimulus parameters are listed in Table 1.
In all patients, the cause of death was unrelated to lead im-plantation or electrical stimulation (cardiovascular failure in Pa-tients 2–4 and 6, myocardial infarction in Patients 1 and 8,anaplastic astrocytoma in Patient 5, and drowning in Patient 7).
Brains were immersion-fixed in 4% formalin. After 2weeks of formalin fixation, leads were carefully removed andthe brain was cut. Tissue blocks were sampled from differentbrain regions containing the lead track, lead tip, and area ofthe active electrodes. In Patients 6 and 7, an evaluation wasperformed on routinely processed archival paraffin blocksretrieved from two municipal Austrian neuropathologylaboratories.
In Patients 1, 3, 6, 7, and 8, tissue blocks were cut per-pendicular to the axis of the lead track, and in Patients 2, 4,and 5, slices were cut parallel to the axis of the lead track(Fig A and B). Tissue blocks were embedded in paraffin, and4- to 8-mm sections were cut and stained. In serial sections,the tip of the lead was localized. The area of the active con-tact was then calculated, taking consideration of tissue
From the *Institute of Neurology and Departments of †Neurosur-gery and ‡Clinical Pathology, University of Vienna, iLudwig Boltz-mann Institute of Clinical Neurobiology, and ¶Neurological Hospi-tal Maria-Theresien-Schlossel, Vienna, and the §Landesnervenklinik,Salzburg, Austria.
Received Dec 29, 1999, and in revised form Apr 13, 2000. Ac-cepted for publication Apr 19, 2000.
Address correspondence to Prof H. Budka, Institute of Neurology,University of Vienna, AKH 04J, Wahringergurtel 18-20, POB 48,A-1097 Wien, Austria.
BRIEF COMMUNICATIONS
372 Copyright © 2000 by the American Neurological Association
shrinkage due to fixation and paraffin embedding.5 In areasadjacent to the active contact, a panel of conventional andimmunocytochemical stains was performed on serial sections.The same stains were performed in areas around the insu-lated part of the lead in Patients 1 through 7. The distancebetween active contact and insulated parts of the leadsranged from 0.5 cm (Patient 3) to 4 cm (Patient 8). Con-ventional stains comprised hematoxylin and eosin, luxolfast blue (myelin sheaths), van Gieson (connective tissue),Bielschowsky silver impregnation (axons), and Kanzlermethods (fibrillary astrogliosis). For immunolabeling, weused a polyclonal antibody against glial fibrillary acidic pro-tein (Dako, Glostrup, Denmark) and monoclonal antibod-ies against neurofilament protein (Clone 2F11; Dako), syn-aptophysin (clone SY 38; Dako), and anti-human humanleukocyte antigen DR to detect activated microglia (cloneCR3/43; Dako). A Dako ChemMate detection kit was usedas a secondary system.6
ResultsDBS persistently improved tremor in Patients 1through 6 (VIM target site) and rigidity and akinesiain Patient 7 (STN target site). The clinical details onPatient 7 have been published previously.7 Patient 8,who was stimulated irregularly during the postoperativescreening phase, showed clinical improvement that didnot differ from a postoperative microthalamotomy ef-fect observed in other patients. This is generally con-sidered to be a sign of good placement of the lead.Voltage or frequency slightly increased in all patientsover the clinical time course (see Table 1).
All brains displayed the morphological substrate ofPD, including loss of pigmented neurons, Lewy bodies,and gliosis in the substantia nigra. Patient 5 showed arecurrent anaplastic astrocytoma of the right frontal andtemporal region. In Patient 6, multiple bilateral smalllacunar infarcts in the basal ganglia, congophilic angiop-athy, and a nonrecent mass hemorrhage in the left oc-cipital lobe were noted. Case 7 fulfilled the criteria for a
neocortical stage of diffuse Lewy body disease accordingto the Newcastle criteria.8 The exact anatomical localiza-tion of the active contacts is indicated in Table 2.
Irrespective of the duration of DBS, the histopatho-logical findings in brain tissue adjacent to the activecontact were similar in all cases, except for Patient 8,who died 2 days after electrode implantation. Tissuechanges around the active contact and nonstimulatedareas adjacent to the insulated parts of the lead did notdiffer (see Fig). Around the lead track, a thin innercapsule of connective tissue was noted. The thicknessof this fibrous sheath ranged from 5 to 25 mm (seeTable 2). There was no correlation between durationof stimulation and thickness of the fibrous sheath. Anarrow rim of fibrillary gliosis (, 500 mm) abutted onthe fibrous capsule (see Fig, C–E). In the adjacentbrain tissue, a zone of less than 1 mm showed looselyscattered glial fibrillary acidic protein–positive reactiveastrocytes. Gliosis was most pronounced in Patients 6and 7, who were stimulated for 3 and 15 months, re-spectively, and also had slight microglial activationaround the lead track (see Fig, O). In the track andadjacent tissue (,500 mm), scarce mononuclear leuko-cytes, siderophages, and single multinucleated giantcells were detectable. In Patient 7, a slight inflamma-tory reaction with multinucleated giant cells engulfingtiny fragments of foreign material was observed. Evenclose to the track, neurons were well preserved andsynaptophysin-immunoreactive structures were present(see Fig, I and K). Quantification of neuronal contentaround the lead track was not performed because ofvariability in exact location, with resulting variability ofadjacent gray matter. No loss of axons or myelinsheaths was detectable (see Fig, D and J). In Cases 2,4, 5, 6, and 7, single axonal spheroids were noted. InPatient 8, who was stimulated only for 2 days, minorfresh hemorrhage, perifocal edema, and numerous ax-
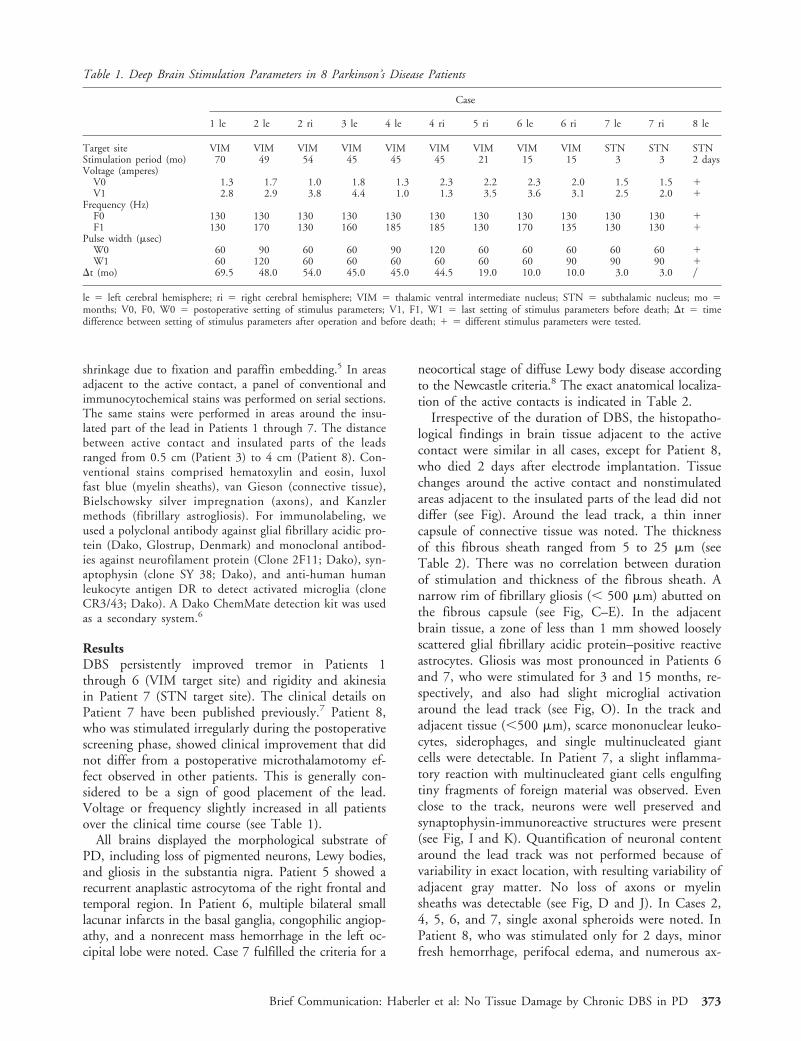
Table 1. Deep Brain Stimulation Parameters in 8 Parkinson’s Disease Patients
Case
1 le 2 le 2 ri 3 le 4 le 4 ri 5 ri 6 le 6 ri 7 le 7 ri 8 le
Target site VIM VIM VIM VIM VIM VIM VIM VIM VIM STN STN STNStimulation period (mo) 70 49 54 45 45 45 21 15 15 3 3 2 daysVoltage (amperes)
V0 1.3 1.7 1.0 1.8 1.3 2.3 2.2 2.3 2.0 1.5 1.5 1V1 2.8 2.9 3.8 4.4 1.0 1.3 3.5 3.6 3.1 2.5 2.0 1
Frequency (Hz)F0 130 130 130 130 130 130 130 130 130 130 130 1F1 130 170 130 160 185 185 130 170 135 130 130 1
Pulse width (msec)W0 60 90 60 60 90 120 60 60 60 60 60 1W1 60 120 60 60 60 60 60 60 90 90 90 1
Dt (mo) 69.5 48.0 54.0 45.0 45.0 44.5 19.0 10.0 10.0 3.0 3.0 y
le 5 left cerebral hemisphere; ri 5 right cerebral hemisphere; VIM 5 thalamic ventral intermediate nucleus; STN 5 subthalamic nucleus; mo 5months; V0, F0, W0 5 postoperative setting of stimulus parameters; V1, F1, W1 5 last setting of stimulus parameters before death; Dt 5 timedifference between setting of stimulus parameters after operation and before death; 1 5 different stimulus parameters were tested.
Brief Communication: Haberler et al: No Tissue Damage by Chronic DBS in PD 373

374 Annals of Neurology Vol 48 No 3 September 2000

onal spheroids were found, representing acute changesafter implantation. Details of the histopathologicalfindings are listed in Table 2.
DiscussionAlthough DBS is a well-established treatment for PD,little is known about effects of chronic DBS on braintissue. Some concern exists with regard to the potentialrisk of chemical changes like water electrolysis to H2
and O2 and the possibility of scarring around the leadwith subsequent decrease of stimulation efficacy. Mor-phological analysis of stimulated tissues is thus needed.Experimental studies in cats9–12 and monkeys13 re-vealed only minor brain tissue damage, including fibril-lary gliosis and mild lesioning of the neural paren-chyma. Animals were stimulated only at irregular shortintervals, maximum stimulation periods lasted only upto 18 months, and potential interspecies differencesshould be considered, however.
Studies with stimulus parameters similar to thoseused in our patients were performed in chronic painpatients14–17 and 1 PD patient.3 In some of these pa-tients, stainless steel was used as lead material; however,it does not seem to have the same degree of biocom-
patibility as the platinum-iridium used in our leads.The chronic pain patients were stimulated for up to 20months, and the PD patient was stimulated for 43months. All these patients, however, were stimulated atirregular intervals,14–17 or DBS was stopped at night.3
The histopathological findings in these cases showedmild gliosis and minor neural damage around the leadtrack3,15–17 or no damage at all.14
We present for the first time data in a series of PDpatients stimulated continuously, including 1 patientwith the longest stimulation period to date of 70months. Comparison between shorter and longer peri-ods of tissue stimulation did not reveal any progressionof histopathological changes. We found no differencesin stimulated and nonstimulated tissues adjacent to thelead track. There were only minor changes compatiblewith posttraumatic tissue reaction to the placement ofthe lead. Clinical long-lasting benefit correlates with theabsence of progressive gliotic scar formation. A slight in-crease in stimulus parameters was necessary during thesubsequent clinical course. This most likely resultedfrom the cessation of an initial microthalamotomy-likeeffect by the surgical trauma after 3 months and laterfrom the progression of PD.
Fig. (A) External surface of a Parkinson’s disease (PD) brain (Case 3) showing entry of a lead in the left frontal lobe. (B) Parasag-ittal section of cerebral hemisphere and thalamus (Case 2) showing the lead track (arrows). PD Case 1. Histology of cross-cut leadtrack in the area of the active contact (C–E, I–K, N) and in a nonstimulated area 4 cm distant from the active contact (F–H, L,M). Myelin sheaths are mostly well preserved (D, G). There is only a small zone of myelin loss (arrows in D and G ), which corre-sponds to fibrillary gliosis (arrows in E and H ). Close to the active contact, neuronal cell bodies (arrows in I ) and axons (darkfibers in J) are well preserved, and synaptophysin-positive structures ( fine brown granular reaction product in K) are present. Thearrowhead in K shows the thin fibrous capsule of the lead track. Distant from the active contact (L, M), changes do not differfrom those around the active contact (I, J). In Case 1 (stimulation for 70 months), reactive gliosis is not present (N), whereas Case7 (stimulation for 3 months) shows mild reactive astrogliosis around the active contact (arrowheads in O). (C, F: hematoxylin-eosinstain, 330; I, L: hematoxylin-eosin stain, 3150; D, G: luxol fast blue stain, 330; E, H: Kanzler stain, 330; J, M: Bielschowskysilver impregnation, 3150; K: synaptophysin, 3150; N, O: glial fibrillary acidic protein, 3150).
Š
Table 2. Histopathology around the Lead Track in 8 Parkinson’s Disease Patients Treated by Deep Brain Stimulation
Case
1 le 2 le 2 ri 3 le 4 le 4 ri 5 ri 6 le 6 ri 7 le 7 ri 8 le
Target site VIM VIM VIM VIM VIM VIM VIM VIM VIM STN STN STNHistological localization VIMa VIM(e) VIM(e) VIM(e) VIM(e) VIMa VIMa VIM(e) VIM(e) CI STN STNStimulation period 70 mo 49 mo 54 mo 45 mo 45 mo 45 mo 21 mo 15 mo 15 mo 3 mo 3 mo 2 daysFibrous sheath (thickness in mm) 5 5 25 25 25 yb 8 5 13 5 5 yFibrillary gliosis , 500 mm 1 1 1 1 1 1 1 1 1 1 1 yReactive astrocytes , 1 mm y y y 1 1 1 y 1 1 1 1 yMultinucleated giant cells y y y y 1 1 1 1 1 2 2 yMononuclear leukocytes 1 1 2 1 1 yb 1 1 1 2 2 yMacrophages y 1 1 1 1 yb 1 1 1 1 2 yMicroglial activation y y nd y nd nd nd 1 1 1 1 yAxonal spheroids y 1 1 y 1 y 1 2 2 1 1 3Fresh hemorrhage y y y y y y y y y y 1 1Perifocal edema y y y y y y y y y y 1 1
aCutting plane of the histological section does not allow precise localization of the active contact.bSome tissue was torn away when electrode was removed at autopsy.
le 5 left cerebral hemisphere; ri 5 right cerebral hemisphere; VIM(e) 5 thalamic ventral intermediate nucleus (externus); STN 5 subthalamic nucleus;CI 5 capsula interna immediately to STN; mo 5 months; 1 5 present; nd 5 not done (too little material available); y 5 absent; 1 5 single; 2 5some; 3 5 numerous.
Brief Communication: Haberler et al: No Tissue Damage by Chronic DBS in PD 375
We conclude that chronic DBS does not cause dam-age to adjacent brain parenchyma.
We thank Helga Katz for excellent technical assistance, Dr ManfredSchmidbauer for kindly providing archival blocks of Case 6, and DrMarin Guentchev for help and support.
References1. Benabid AL, Pollak P, Louveau A, et al. Combined (thalamo-
tomy and stimulation) stereotactic surgery of the VIM thalamicnucleus for bilateral Parkinson disease. Appl Neurophysiol1987;50:344–346
2. Starr PA, Vitek JL, Bakay RA. Ablative surgery and deep brainstimulation for Parkinson’s disease. Neurosurgery 1998;43:989–1013
3. Caparros-Lefebvre D, Ruchoux MM, Blond S, et al. Long-termthalamic stimulation in Parkinson’s disease: postmortem anato-moclinical study. Neurology 1994;44:1856–1860
4. Alesch F, Pinter MM, Helscher RJ, et al. Stimulation of theventral intermediate thalamic nucleus in tremor dominated Par-kinson’s disease and essential tremor. Acta Neurochir (Wien)1995;136:75–81
5. Bock P. Fixierung histologischer praparate. Romeis mikrosko-pische technik. 17th ed. Munchen: Urban und Schwarzenberg,1989
6. Guentchev M, Wanschitz J, Voigtlander T, et al. Selective neu-ronal vulnerability in human prion diseases: fatal familial in-somnia differs from other types of prion diseases. Am J Pathol1999;155:1453–1457
7. Pinter MM, Alesch F, Murg M, et al. Deep brain stimulationof the subthalamic nucleus for control of extrapyramidal fea-tures in advanced idiopathic Parkinson’s disease: one yearfollow-up. J Neural Transm 1999;106:693–709
8. McKeith IG, Galasko D, Kosaka K, et al. Consensus guidelinesfor the clinical and pathologic diagnosis of dementia with Lewybodies (DLB): report of the consortium on DLB internationalworkshop. Neurology 1996;47:1113–1124
9. Woodford BJ, Carter RR, McCreery D, et al. Histopathologicand physiologic effects of chronic implantation of microelec-trodes in sacral spinal cord of the cat. J Neuropathol Exp Neu-rol 1996;55:982–991
10. Mortimer JT, Shealy CN, Wheeler C. Experimental nonde-structive electrical stimulation of the brain and spinal cord.J Neurosurg 1970;32:553–559
11. Stock G, Sturm V, Schmitt HP, Schlor KH. The influence ofchronic deep brain stimulation on excitability and morphologyof the stimulated tissue. Acta Neurochir (Wien) 1979;47:123–129
12. Yuen TG, Agnew WF, Bullara LA, et al. Histological evaluationof neural damage from electrical stimulation: considerations forthe selection of parameters for clinical application. Neurosur-gery 1981;9:292–299
13. Brown WJ, Babb TL, Soper HV, et al. Tissue reactions to long-term electrical stimulation of the cerebellum in monkeys.J Neurosurg 1977;47:366–379
14. Baskin DS, Mehler WR, Hosobuchi Y, et al. Autopsy analysisof the safety, efficacy and cartography of electrical stimulationof the central gray in humans. Brain Res 1986;371:231–236
15. Boivie J, Meyerson BA. A correlative anatomical and clinicalstudy of pain suppression by deep brain stimulation. Pain 1982;13:113–126
16. Gybels J, Dom R, Cosyns P. Electrical stimulation of the cen-tral gray for pain relief in human: autopsy data. Acta NeurochirSuppl (Wien) 1980;30:259–268
17. Kuroda R, Nakatani J, Yamada Y, et al. Location of a DBS-electrode in lateral thalamus for deafferentation pain. An autopsycase report. Acta Neurochir Suppl (Wien) 1991;52:140–142
Familial Alzheimer’s Disease:Site of Mutation InfluencesClinical PhenotypeC. F. Lippa, MD,* J. M. Swearer, PhD,†K. J. Kane, MA,† D. Nochlin, MD,‡ T. D. Bird, MD,§B. Ghetti, MD,i L. E. Nee, MSW,P. St. George-Hyslop, MD, PhD,# D. A. Pollen, MD,†and D. A. Drachman, MD†
Alzheimer’s disease (AD) is caused by multiple geneticand/or environmental etiologies. Because differences inthe genetically determined pathogenesis may cause differ-ences in the phenotype, we examined age at onset andage at death in 90 subjects with dominantly inherited ADdue to different mutations (amyloid precursor protein,presenilin-1, and presenilin-2 genes). We found thatamong patients with dominantly inherited AD, geneticfactors influence both age at onset and age at death.
Lippa CF, Swearer JM, Kane KJ, Nochlin D,Bird TD, Ghetti B, Nee LE,
St. George-Hyslop P, Pollen DA, Drachman DA.Familial Alzheimer’s disease: site of mutation
influences clinical phenotype.Ann Neurol 2000;48:376–379
Most cases of Alzheimer’s disease (AD) are sporadic ornondominant; however, the discovery of genetic muta-tions in three different genes indicates that autosomaldominant AD is also an important cause of this dis-ease.1 Cases of AD with dominant transmission are dueto mutations in the amyloid precursor protein (APP),presenilin (PS)-1 (PS-1), and PS-2 genes.2–4 Mutations
From the *Department of Neurology, Medical College ofPennsylvania-Hahnemann University, Philadelphia, PA; †Depart-ment of Neurology, University of Massachusetts Medical School,Worcester, MA; ‡Department of Pathology, University of Washing-ton School of Medicine, and §Department of Neurology, VeteransAffairs Medical Center and University of Washington School ofMedicine, Seattle, WA; iDepartment of Pathology, Indiana Univer-sity Medical Center, Indianapolis, IN; Family Studies Unit, Na-tional Institute of Neurological Disorders and Stroke, Bethesda,MD; and #Department of Medicine (Neurology) and Medical Bio-physics, University of Toronto, Toronto, Ontario, Canada.
Received Apr 13, 2000. Accepted for publication Apr 21, 2000.
Address correspondence to Dr Swearer, Department of Neurology,University of Massachusetts Medical School, 55 Lake AvenueNorth, Worcester, MA 01655.
376 Copyright © 2000 by the American Neurological Association
of the PS-1 gene on chromosome 145 are the mostcommon abnormalities identified. Because numerousfamilial AD (FAD) kindreds lack mutations of the APPand PS-1 and PS-2 exons, it is possible that intronicmutations of these genes or unidentified genetic abnor-malities exist that lead to autosomal dominant AD.
Despite its heterogeneous nature, all cases of ADhave similar pathological characteristics, with b-amyloidplaques, intraneuronal neurofibrillary tangles, and neu-ronal loss as the hallmarks of the disease. Clinical, his-topathological, and biochemical phenotypic heteroge-neity has been described in AD groups as caused byeither genetic etiologies or unknown etiologies, suggest-ing that the underlying disease process may not beidentical when etiologies are different. Clinical and his-topathological studies show subtle differences in fea-tures among AD groups.1 For example, age at onset(“onset”) and age at death (“death”) may be earlier inPS-1 and APP AD than in sporadic AD. Reports ofdisease onset in specific kindreds show that affectedmembers of PS-1 kindreds often develop symptoms intheir fourth decade of life, APP kindreds in their fifthdecade, and sporadic AD patients usually after the ageof 60 years.6 Even within PS-1 AD groups, onset variesfrom kindred to kindred, and there may be subtle age-related trends in onset depending on the site of thegenetic defect within the PS-1 gene. Of the eight trans-membrane (TM) domains in the PS-1 gene, kindredswith mutations of PS-1 TM loop 2 (TM2), TM3,TM7, and the loop connecting TM1 and TM2 havebeen reported to show extremely early onset.7 Moststudies of FAD kindreds have compared specific kin-dreds with sporadic AD, however. There are few for-mal studies comparing onset and death between groupsof FAD subjects. We studied onset and death in 90subjects with FAD due to different genetic etiologies.
Materials and MethodsPatientsWe obtained brain tissue from 90 subjects with autosomaldominant FAD. There were 60 dementia subjects with con-firmed mutations of the PS-1 gene. This group containedcases with mutations leading to alterations in the TM2 (n 519), TM4 (n 5 9), TM5 (n 5 2), TM6 (n 5 21), andTM8 (n 5 9) portions of the expressed protein. Seventeensubjects with dementia had the same point mutation(N141I) of the PS-2 gene. Thirteen subjects with dementiahad mutations of codon 717 of the APP protein. All 90 sub-jects met clinical criteria for probable AD8 and showed his-topathological features diagnostic of AD according to Na-tional Institute on Aging and Reagan Institute criteria.9
The subjects were all members of well-described FAD kin-dreds. Each subject was evaluated antemortem by a team as-sociated with one of the authors. We assessed onset anddeath using review of medical records. Onset was estimatedfrom the duration of symptoms as determined at the time ofinitial presentation.
Statistical AnalysesANOVA was used to compare the PS-1, PS-2, and APP ADgroups with regard to onset and death. A critical probabilityvalue less than 0.01 was adopted to partially correct for mul-tiple comparisons. Significant differences were further analyzedusing Tukey’s honestly significant difference (HSD) test formultiple comparisons.
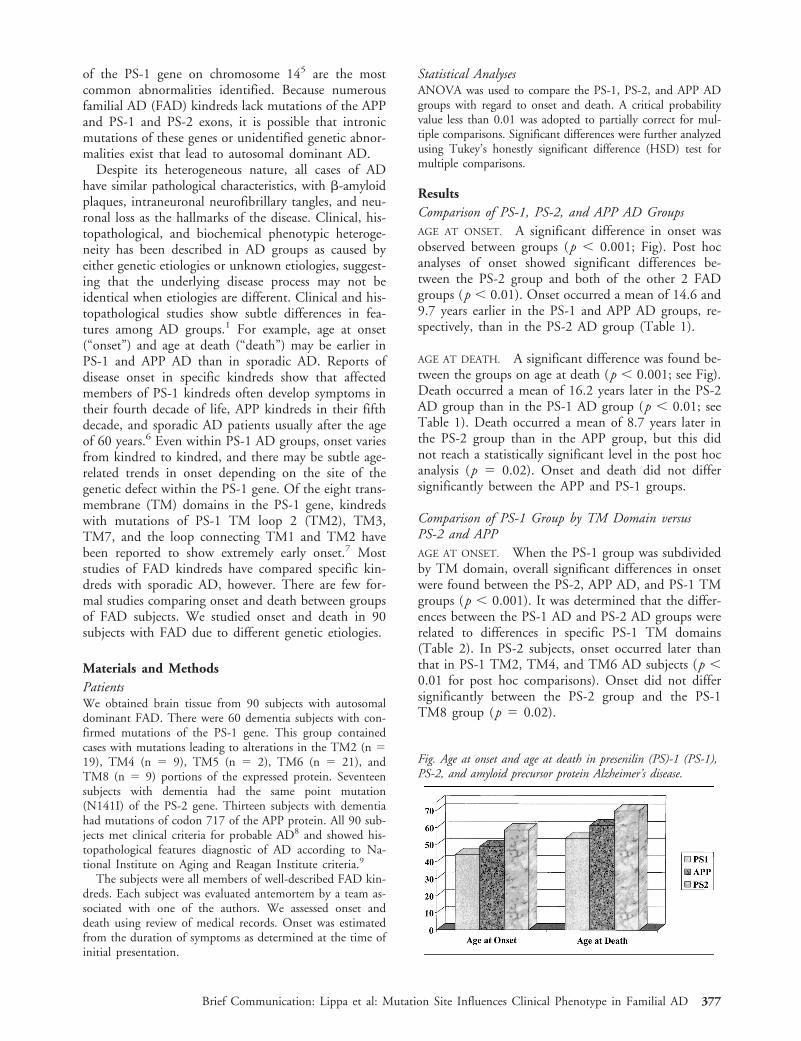
ResultsComparison of PS-1, PS-2, and APP AD GroupsAGE AT ONSET. A significant difference in onset wasobserved between groups (p , 0.001; Fig). Post hocanalyses of onset showed significant differences be-tween the PS-2 group and both of the other 2 FADgroups (p , 0.01). Onset occurred a mean of 14.6 and9.7 years earlier in the PS-1 and APP AD groups, re-spectively, than in the PS-2 AD group (Table 1).
AGE AT DEATH. A significant difference was found be-tween the groups on age at death (p , 0.001; see Fig).Death occurred a mean of 16.2 years later in the PS-2AD group than in the PS-1 AD group (p , 0.01; seeTable 1). Death occurred a mean of 8.7 years later inthe PS-2 group than in the APP group, but this didnot reach a statistically significant level in the post hocanalysis (p 5 0.02). Onset and death did not differsignificantly between the APP and PS-1 groups.
Comparison of PS-1 Group by TM Domain versusPS-2 and APPAGE AT ONSET. When the PS-1 group was subdividedby TM domain, overall significant differences in onsetwere found between the PS-2, APP AD, and PS-1 TMgroups (p , 0.001). It was determined that the differ-ences between the PS-1 AD and PS-2 AD groups wererelated to differences in specific PS-1 TM domains(Table 2). In PS-2 subjects, onset occurred later thanthat in PS-1 TM2, TM4, and TM6 AD subjects (p ,0.01 for post hoc comparisons). Onset did not differsignificantly between the PS-2 group and the PS-1TM8 group (p 5 0.02).
Fig. Age at onset and age at death in presenilin (PS)-1 (PS-1),PS-2, and amyloid precursor protein Alzheimer’s disease.
Brief Communication: Lippa et al: Mutation Site Influences Clinical Phenotype in Familial AD 377
AGE AT DEATH. Significant differences between thegroups were also found with regard to death (p ,0.001). Death was later in the PS-2 AD group than inthe PS-1 TM2, TM4, and TM6 AD groups (p , 0.01for post hoc comparisons; see Table 2). Death did notdiffer significantly between the PS-2 group and theTM8 group. Again, APP AD subjects had a later deaththan PS-1 TM2 and TM4 AD subjects (p , 0.01 forpost hoc comparisons).
Apolipoprotein E GenotypeInformation regarding apolipoprotein E (ApoE) geno-type was available in 61 of the 90 cases. Twenty-eightpercent of the subjects had at least one ApoE epsilon 4allele, and 72% did not. ApoE epsilon 4 distribution inthis sample had no effect on onset (t 5 0.2, p 5 0.67)or death (t 5 0.01, p 5 0.94). Too few subjects had
an ApoE epsilon 2 allele to test for any epistatic ef-fect10 in our APP cases.
DiscussionOnset and death clearly differed between the PS-1,PS-2, and APP AD groups, although differences werepresent depending on the site of mutation, and therewas variability within each group. In general, onset anddeath were later in the PS-2 AD group than in thePS-1 or APP AD group. We also noted differences inonset and death related to the site of the PS-1 muta-tion, with the TM2, TM4, and TM6 groups account-ing for the differences between the PS-1 and PS-2groups.
Despite these trends, patients within the same kin-dred or different kindreds linking to the identical TMregion showed variation in onset and death, and sub-jects with mutations adjacent to one another some-times showed differences in onset and death. Thisvariability would suggest that factors determining on-set and death also depend on other genetic factors orenvironmental modifiers. It is also possible that struc-turally conservative mutations result in later onset anddeath than mutations that lead to major confor-mational changes in the expressed gene. Althoughthe presence and number of ApoE epsilon 4 alleleshas been found to affect onset in late onset AD,11
we found no association between ApoE genotype andonset in our early onset FAD groups. The resultsfrom this study demonstrate that onset and deathvary in FAD cases depending on the specic sites ofmutation.
This study was supported by NIH grant AG13623 (C.F.L.); NIHgrant AG05134, the Stanley and Harriett Friedman Fund, and theSterling Morton Research Trust (J.M.S., D.A.P., D.A.D., K.J.K.);NIH grants AG05136 and AG06781 (D.N.); and NIH grantAG05136 and Veterans Affairs Medical Research Funds (T.D.B.).
References1. Lippa CF. Familial Alzheimer’s disease: genetic influences on
the disease process. Int J Mol Med 1999;4:529–5362. Goate A, Chartier-Harlin M, Mullan M, et al. Segregation of a
missense mutation of the amyloid precursor protein gene withfamilial Alzheimer’s disease. Nature 1991;349:704–706
3. Levy-Lahad E, Wijsman EM, Nemens E, et al. A familial Alz-heimer’s disease locus on 18.chromosome 1. Science 1995;269:970–973
4. Rogaev EI, Sherrington R, Rogaeva EA, et al. Familial Alzhei-mer’s disease in kindreds with missense mutations in a gene onchromosome 1 related to the Alzheimer’s disease type 3 gene.Nature 1995;376:775–778
5. St. George-Hyslop P, Haines J, Rogaev E, et al. Genetic evi-dence for a novel familial Alzheimer’s disease locus on chromo-some 14. Nat Genet 1992;2:330–334
6. Mullan M, Houlden H, Crawford F, et al. Age of onset in
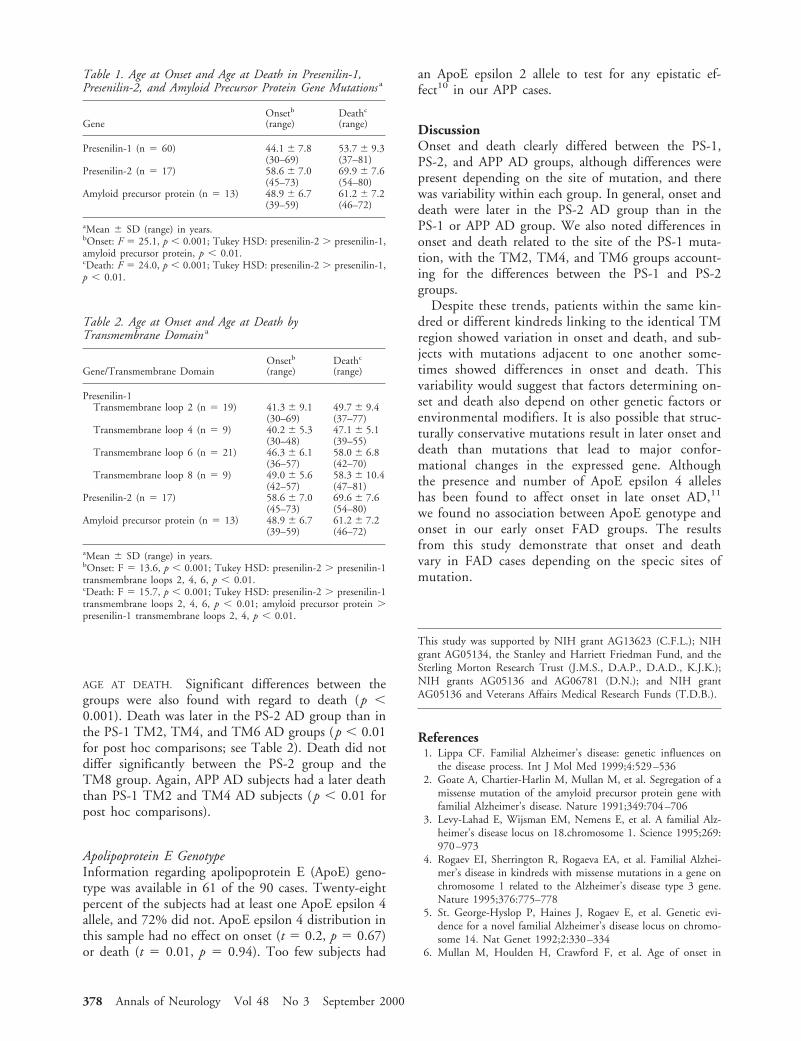
Table 1. Age at Onset and Age at Death in Presenilin-1,Presenilin-2, and Amyloid Precursor Protein Gene Mutations a
GeneOnsetb
(range)Deathc
(range)
Presenilin-1 (n 5 60) 44.1 6 7.8 53.7 6 9.3(30–69) (37–81)
Presenilin-2 (n 5 17) 58.6 6 7.0 69.9 6 7.6(45–73) (54–80)
Amyloid precursor protein (n 5 13) 48.9 6 6.7 61.2 6 7.2(39–59) (46–72)
aMean 6 SD (range) in years.bOnset: F 5 25.1, p , 0.001; Tukey HSD: presenilin-2 . presenilin-1,amyloid precursor protein, p , 0.01.cDeath: F 5 24.0, p , 0.001; Tukey HSD: presenilin-2 . presenilin-1,p , 0.01.
Table 2. Age at Onset and Age at Death byTransmembrane Domain a
Gene/Transmembrane DomainOnsetb
(range)Deathc
(range)
Presenilin-1Transmembrane loop 2 (n 5 19) 41.3 6 9.1 49.7 6 9.4
(30–69) (37–77)Transmembrane loop 4 (n 5 9) 40.2 6 5.3 47.1 6 5.1
(30–48) (39–55)Transmembrane loop 6 (n 5 21) 46.3 6 6.1 58.0 6 6.8
(36–57) (42–70)Transmembrane loop 8 (n 5 9) 49.0 6 5.6 58.3 6 10.4
(42–57) (47–81)Presenilin-2 (n 5 17) 58.6 6 7.0 69.6 6 7.6
(45–73) (54–80)Amyloid precursor protein (n 5 13) 48.9 6 6.7 61.2 6 7.2
(39–59) (46–72)
aMean 6 SD (range) in years.bOnset: F 5 13.6, p , 0.001; Tukey HSD: presenilin-2 . presenilin-1transmembrane loops 2, 4, 6, p , 0.01.cDeath: F 5 15.7, p , 0.001; Tukey HSD: presenilin-2 . presenilin-1transmembrane loops 2, 4, 6, p , 0.01; amyloid precursor protein .presenilin-1 transmembrane loops 2, 4, p , 0.01.
378 Annals of Neurology Vol 48 No 3 September 2000
familial early onset Alzheimer’s disease correlates with geneticaetiology. Am J Med Genet 1993;48:129–130
7. Wegiel J, Wisniewski HM, Kuchna I, et al. Cell-type–specificenhancement of amyloid-beta deposition in a novel presenilin-1mutation (P117L). J Neuropathol Exp Neurol 1998;57:831–838
8. McKhann G, Drachman DA, Folstein M, et al. Clinical diag-nosis of Alzheimer’s disease: report of the NINCDS-ADRDAWork Group under the auspices of Department of Health andHuman Services Task Force on Alzheimer’s Disease. Neurology1984;34:939–944
9. National Institute on Aging, and Reagan Institute WorkingGroup on Diagnostic Criteria for the Neuropathological Assess-ment of Alzheimer’s Disease. Consensus recommendations forthe postmortem diagnosis of Alzheimer’s disease. Neurobiol Ag-ing 1997;18(Suppl):S1–S2
10. Sorbi S, Nacimias B, Forleo P, et al. Epistatic effect of APP717: mutation and apolipoprotein E genotype in familial Alz-heimer’s disease. Ann Neurol 1995;38:124–127
11. Corder EH, Saunders AM, Strittmatter WJ, et al. Gene dose ofapolipoprotein E type 4 allele and the risk of Alzheimer’s dis-ease in late onset families. Science 1993;261:921–923
Severe CongenitalMyasthenic Syndrome dueto Homozygosity of the1293insG ε-AcetylcholineReceptor Subunit MutationJ. P. Sieb, MD,*¶ S. Kraner, MS,*† B. Schrank, MD,‡B. Reitter, MD,§ T. H. H. Goebel, MD,i
S. J. Tzartos, PhD,# and O. K. Steinlein, MD†
Recently, a congenital myasthenic syndrome (CMS) withend-plate acetylcholine receptor (AChR) deficiency dueto missense mutations in the genes for the AChR subunitwas described. The first observed patient with this CMSwas heteroallelic for the two «-AChR subunit mutations«1101insT and «1293insG. This patient had only a mod-erate phenotype with mild muscle weakness and abnor-
mal fatigue. We have now found homozygosity for the«1293insG mutation in a severely affected CMS patient,who lost the ability to walk in midchildhood and showsprofound weakness and muscle wasting. Our observationallows a genotype-phenotype correlation illustrating howdifferences in the AChR mutation haplotype can pro-foundly influence disease severity.
Sieb JP, Kraner S, Schrank B, Reitter B,Goebel THH, Tzartos SJ, Steinlein OK. Severe
congenital myasthenic syndrome due tohomozygosity of the 1293insG (ε-acetylcholine
receptor subunit mutation.Ann Neurol 2000;48:379–383
Congenital myasthenic syndromes (CMS) arise frompresynaptic, synaptic, or postsynaptic defects of neuro-muscular transmission. Mutations in the acetylcholinereceptor (AChR) subunit genes are a common cause ofpostsynaptic CMS. They cause myasthenic weakness bychanging the response of the AChR ion channel to ace-tylcholine or resulting in end-plate AChR deficiency.1
CMS with end-plate AChR deficiency due to missensemutations in the AChR subunit genes was first de-scribed by Engel and co-workers.2 These authors iden-tified a 55-year-old myasthenic woman carrying two dif-ferent frame-shifting ε-AChR subunit gene (CHRNE)mutations. In the heteroallelic state, these CHRNEmutations resulted in only mild muscular weakness andabnormal fatigue. We report on a patient homozygousfor the more severe of the two mutations previouslydescribed by Engel and co-workers.2 These differencesin the AChR subunit mutation haplotype correlatephenotypic disease severity with genotypic changes.
Materials and MethodsAll studies were approved by the Ethics Committee of theUniversity Hospital Bonn, Germany, and informed consentwas obtained from all individuals included in the study.
Muscle BiopsyMuscle specimens were obtained from the gastrocnemius andquadriceps muscles at the ages of 9 and 19 years, respec-tively, and were analyzed as previously described.3 For dem-onstration of the AChR with tetramethyl-rhodamine–labeleda-bungarotoxin (Molecular Probes, Eugene, OR), 5-mm cry-ostat sections were used. The tetramethyl-rhodamine–labeleda-bungarotoxin stains were combined with two-color immu-nofluorescence for laminin b2 (gift from U. Wewer, Copen-hagen, Denmark) for localizing end plates. The g-subunit ofthe AChR was localized in cryostat sections with two-colorimmunofluorescence by consecutive application of fluorescein-labeled a-bungarotoxin, anti-AChR g-subunit (Mab66),4 andrhodamine red-conjugated mouse anti-rat IgG (Jackson Lab-oratories, West Grove, PA). The Mab168 antibody5 wasused for detection of the ε-subunit of the AChR. All stainswere compared with those at end plates of nonweak controlsubjects.
From the Departments of *Neurology and †Human Genetics, Uni-versity of Bonn, Bonn; ‡Deutsche Klinik fur Diagnostik, Wiesba-den; Departments of §Pediatrics and iNeuropathology, Universityof Mainz, Mainz; and ¶Max-Planck-Institute of Psychiatry, Munich,Germany; and #Department of Biochemistry, Hellenic Pasteur In-stitute, Athens, Greece.
Received Feb 8, 2000, and in revised form Apr 13. Accepted forpublication Apr 14, 2000.
Address correspondence to Dr Steinlein, Institute for Human Genet-ics, University of Bonn, Wilhelmst 31, Bonn D-53105, Germany.
Copyright © 2000 by the American Neurological Association 379
For additional immunohistochemical studies, the followingantibodies were used: (1) dystrophin (Dys 1,2,3; Novocastra,Newcastle upon Tyne, UK); (2) merosin 80 (Chemicon, Te-mecula, CA) and 300 (Novocastra); (3) b-dystroglycan (No-vocastra); (4) the sarcoglycans a (Novocastra), b (Novocastra),g (Novocastra), and d (gift from V. Nigro, Naples, Italy); (5)emerin (Novocastra); (6) spectrin (Novocastra); (7) caveolin(Dako, Hamburg, Germany); (8) utrophin, n-terminus (No-vocastra); (9) developmental myosin (Novocastra); (10) vimen-tin (Dako); and (11) neural cell adhesive molecules (N-CAM;Dako). For detection of the primary antibodies, the avidin-biotinylated peroxidase technique (Vectastain ABC kit; Vector,Burlingame, CA) was used.
Genetic StudiesSingle-strand confirmation analysis (SSCA) and heteroduplexanalysis were used to screen for mutations in the CHRNEgene. The genomic sequences were obtained from the data-base sequence of clone hRPK.177_H_5mapl7 (accessionnumber AC005973). Polymerase chain reaction and SSCA-heteroduplex analysis were performed using standard proto-cols. Direct sequencing of polymerase chain reaction prod-ucts was performed on an ABI 377 sequencer using theBigDye Terminator Cycle Sequencing Ready Reaction kit(Applied Biosystems, Foster City, CA).
ResultsClinical DataThe patient is a 20-year-old woman from a consan-guineous Moroccan marriage (Fig 1). Her parents and7 living siblings are healthy. Two siblings died duringearly childhood because of severe respiratory infections.This patient started walking at the age of 13 months.After 2 years of age, the strength of her limb muscles
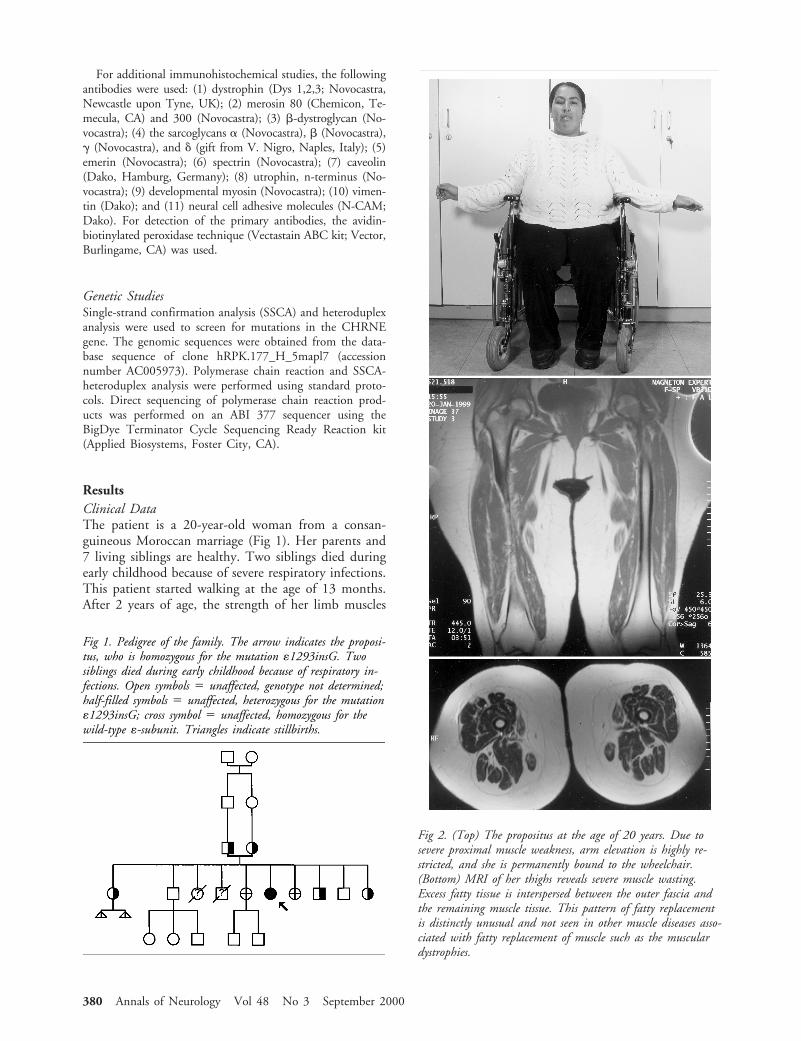
Fig 1. Pedigree of the family. The arrow indicates the proposi-tus, who is homozygous for the mutation «1293insG. Twosiblings died during early childhood because of respiratory in-fections. Open symbols 5 unaffected, genotype not determined;half-filled symbols 5 unaffected, heterozygous for the mutation«1293insG; cross symbol 5 unaffected, homozygous for thewild-type «-subunit. Triangles indicate stillbirths.
Fig 2. (Top) The propositus at the age of 20 years. Due tosevere proximal muscle weakness, arm elevation is highly re-stricted, and she is permanently bound to the wheelchair.(Bottom) MRI of her thighs reveals severe muscle wasting.Excess fatty tissue is interspersed between the outer fascia andthe remaining muscle tissue. This pattern of fatty replacementis distinctly unusual and not seen in other muscle diseases asso-ciated with fatty replacement of muscle such as the musculardystrophies.
380 Annals of Neurology Vol 48 No 3 September 2000
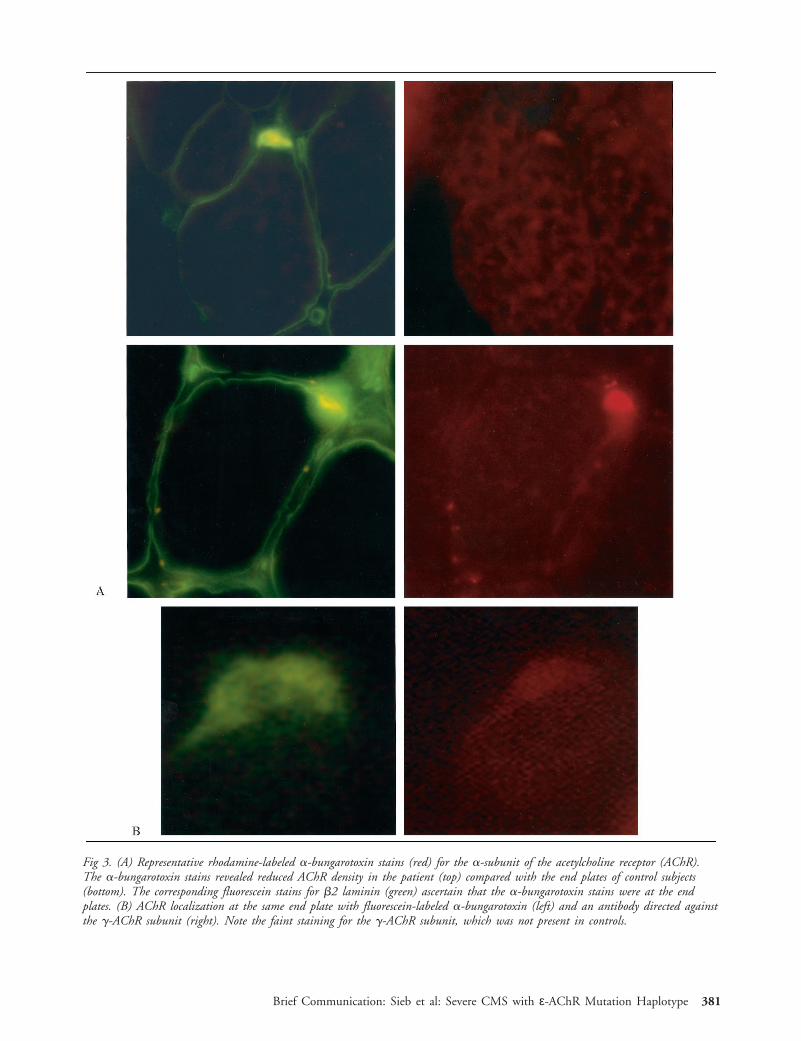
Fig 3. (A) Representative rhodamine-labeled a-bungarotoxin stains (red) for the a-subunit of the acetylcholine receptor (AChR).The a-bungarotoxin stains revealed reduced AChR density in the patient (top) compared with the end plates of control subjects(bottom). The corresponding fluorescein stains for b2 laminin (green) ascertain that the a-bungarotoxin stains were at the endplates. (B) AChR localization at the same end plate with fluorescein-labeled a-bungarotoxin (left) and an antibody directed againstthe g-AChR subunit (right). Note the faint staining for the g-AChR subunit, which was not present in controls.
Brief Communication: Sieb et al: Severe CMS with ε-AChR Mutation Haplotype 381

decreased steadily. She lost the ability to walk between6 and 8 years of age. At the time of examination, sheshowed severe generalized weakness and muscle wasting(Fig 2). She is permanently wheelchair-bound. Cur-rently, she can perform only limited activities involvingthe forearm and hand muscles because of severe weak-ness of her upper extremities. She has nearly completeexternal ophthalmoplegia and mild facial weakness.Paraspinal muscle weakness resulted in progressive ky-phoscoliosis. Therapy with 60 to 120 mg of pyridostig-mine daily had only limited benefit. Tests for AChRantibodies were repeatedly negative. Stimulation at3 Hz done at the age of 19 years resulted in a 22%decrement of evoked compound muscle action poten-tials in the deltoid muscle and a 40% decrement in theabductor digiti quinti muscle. There were no repetitivecompound muscle action potentials in response to sin-gle nerve stimuli. Magnetic resonance imaging showedsevere muscle wasting (see Fig 2).
At the end plates, a-bungarotoxin rhodamine-labeled staining was of reduced intensity comparedwith that for normal muscle (Fig 3A). Immunofluores-cence studies with an antibody against the g-AChRsubunit revealed expression of the fetal subunit at thepatient’s end plates (see Fig 3B) but not in controls.All observed end plates of the patient were negative forthe ε-AChR subunit.
Muscle histological findings revealed a marked type2 fiber hypotrophy (Fig 4). The atrophic type 2 fibersstrongly expressed vimentin but no N-CAM (CD56)(see Fig 4). Several small and large myofibers expressedneonatal myosin. Immunohistochemical analysis for
proteins known to be involved in the pathogenesis ofmuscular dystrophies showed no abnormality. The mus-cle histological findings excluded the presence of muscu-lar dystrophy in addition to the CMS in this patient.
Genetic StudiesSSCA of the whole coding region and direct sequenc-ing revealed a homozygous insertion at nucleotide1293 in exon 12 of the CHRNE gene (ε1293insG) inthe propositus. Both parents and 3 of the patient’shealthy siblings were heterozygous for the ε1293insGmutation (see Fig 1). Two siblings had no mutations,and 2 were not available for analysis.
DiscussionEngel and co-workers2 recently described mild CMSwith end-plate AChR deficiency in a 55-year-oldwoman. That patient had moderate ptosis and ophthal-moparesis and mild weakness of facial muscles, neckflexors, and selected limb muscles as well as abnormalfatigue on exertion. Molecular genetic analysis of AChRsubunit genes revealed the presence of two different mu-tations in the ε-AChR subunit gene: (1) insertion of athymine after ε-nucleotide 1101 (ε1101insT), whichgenerates an immediate nonsense codon, and (2) inser-tion of a guanine after ε-nucleotide 1293 (ε1293insG),which generates three missense codons followed by anonsense codon.
In contrast to the case reported by Engel and co-workers,2 our patient is severely handicapped because of
Fig 4. (Left) Type 2 fiber atrophy in the patient. The small size of the type 2 fibers and the normal size of the type 1 fibers areapparent (adenosine triphosphatase reaction with preincubation at pH 4.6, magnification 3190). Representative immunoreactivityfor neural cell adhesive molecules (N-CAM) (right) and vimentin (middle). The atrophic type 2 fibers strongly expressed vimentinbut no N-CAM (3400). Muscle specimens were obtained from the quadriceps muscle at the age of 19 years.
382 Annals of Neurology Vol 48 No 3 September 2000

pronounced generalized weakness and muscle wasting.She was found to be homozygous for the ε1293insG-mutation. Engel and co-workers2 performed single-channel recordings from mutant AChR ion channelsharboring the ε1101insT mutation and the ε1293insGmutation, respectively.2 Compared with the wild-typechannels, ε1101insT-AChR ion channels have similarconductance and opening durations but fewer openingepisodes. No channel activity was recorded from cellstransfected with the ε1293insG-AChR. The phenotypicdifferences between the patient described by Engel andco-workers2 and our patient are most probably a resultof the different kinetic properties of these mutant AChRion channels. In the case presented by Engel and co-workers,2 AChR ion channels harboring the ε1101insTmutation, which leads only to mild kinetic changes, mayadditionally improve the neuromuscular transmissionbecause of residual expression of the mutant ε-AChRsubunit. In our patient, the homozygous ε1293insGmutation completely abolishes the function ofε-subunits translated from both CHRNE genes; thus,the neuromuscular transmission most likely depends al-most completely on the expression of immature AChRion channels, containing the g-subunit instead of theε-subunit. Immunofluorescence studies were indeed ableto show expression of g-subunits at the end plates of ourpatient. The expression of these immature g-subunitsmay lead to phenotypic rescue from the potentially fatalnull CHRNE mutation in our patient.2
The repeated muscle biopsies revealed a markedtype 2 fiber atrophy (see Fig 4). Selective atrophy oftype 2 fibers is a nonspecific finding that is often ob-served in patients suffering from neuromuscular trans-mission defects.3 Remarkably, in our case, most of theatrophic type 2 fibers strongly expressed vimentin butno N-CAM (CD56). The intermediate filament vi-mentin is strongly expressed in fetal myotubes and canbe immunohistochemically detected until week 36 ofgestation.6 Similarly, N-CAM expression occurs duringmyogenesis and appears in mature muscle fibers only atthe neuromuscular junctions.7 Regenerating muscle re-capitulates normal phases of myofiber development, in-cluding the reappearance of strong vimentin andN-CAM immunoreactivity. This continued vimentinexpression in the absence of N-CAM may indicate adisturbance in muscle fiber maturation due to impairednerve-muscle cell interaction at the neuromuscularjunction.
In conclusion, the genotype-phenotype differences inthe underlying mutation haplotype may explain thevariability of clinical symptoms and severity of diseaseobserved in AChR-deficient CMS. The identificationof additional patients carrying identical mutations inthe heteroallelic versus homoallelic state should behelpful in further studying the complex phenotype-genotype relations in CMS patients.
This work was supported in part by grants from the Deutsche For-schungsgemeinschaft (Si472/3-1), Deutsche Gesellschaft fur Muske-lkranke (Freiburg i. Br.), University of Bonn (BONFOR program),and Faculty of Medicine, Johannes Gutenberg University(MAIFOR program).
We are grateful to Dr W. S. Loui for carefully reading themanuscript.
References1. Engel AG, Ohno K, Sine SM. Congenital myasthenic
syndromes: recent advances. Arch Neurol 1999;56:163–1672. Engel AG, Ohno K, Bouzat C, et al. End-plate acetylcholine
receptor deficiency due to nonsense mutations in the ε-subunit.Ann Neurol 1996;40:810–817
3. Dubowitz V. Muscle biopsy: a practical approach. 2nd ed.London: Bailliere Tindall, 1985
4. Tzartos SJ, Starzinski-Powitz A. Decrease in acetylcholine-receptor content of human myotube cultures mediated by mono-clonal antibodies to alpha, beta and gamma subunits. FEBS Lett1986;196:91–95
5. Tzartos S, Langeberg L, Hochschwender S, et al. Characteristicsof monoclonal antibodies to denaturated Torpedo and to nativecalf acetylcholine receptors: species, subunit and region specifity.J Neuroimmunol 1986;10:235–253
6. Sarnat HB. Vimentin and desmin in maturing skeletal muscleand developmental myopathies. Neurology 1992;42:1616–1624
7. Figarella-Branger D, Nedelec J, Pellissier JF, et al. Expression ofvarious isoforms of neural cell adhesive molecules and theirhighly polysialylated counterparts in diseased human muscles.J Neurol Sci 1990;98:21–36
Brief Communication: Sieb et al: Severe CMS with ε-AChR Mutation Haplotype 383
Acquired HippocampalDamage after TemporalLobe Seizures in 2 InfantsEliane Roulet Perez, MD,* Philippe Maeder, MD,†Kathleen Meagher Villemure,‡ Virgini Chaves Vischer,*Jean-Guy Villemure, MD,§ and Thierry Deonna, MD*
Two infants developed unilateral hippocampal swellingon magnetic resonance imaging after prolonged seizuresof temporal origin. Subsequent images suggested hip-pocampal sclerosis. The first child had febrile status epi-lepticus with exanthem subitum and developed refractorycomplex partial seizures. Histological findings after tem-poral lobectomy confirmed hippocampal sclerosis butalso revealed sequelae of a focal encephalitis and micro-dysgenesis of the hippocampus. The second child hadsigns of brain dysgenesis, but acquired hippocampaldamage affecting each side successively was documentedby serial magnetic resonance imaging. These cases illus-trate that different clinical conditions combining preex-isting and acquired pathological characteristics can leadto hippocampal sclerosis.
Roulet Perez E, Maeder P, Meagher Villemure K,Chaves Vischer V, Villemure J-G, Deonna T.
Acquired hippocampal damage after temporal lobeseizures in 2 infants.
Ann Neurol 2000;48:384–387
Hippocampal sclerosis (HS) is a frequent pathologicalfinding in adults with intractable temporal lobe epi-lepsy (TLE) and is being increasingly recognized inchildren as a result of improved magnetic resonanceimaging (MRI).1 The etiology of HS is still the subjectof controversy, probably reflecting the fact that HS canbe the end result of different pathological conditions,2
including genetic predisposition3 and acquired damage.4
Clinical series of surgical patients with TLE report asignificantly increased incidence of prolonged or focalfebrile convulsions during early childhood, suggestingthat part of the process may be seizure-induced.1,5,6
Signs of acute unilateral hippocampal damage onMRI followed by atrophy were first reported in a childafter prolonged afebrile temporal lobe seizures7 and in
a few infants after prolonged focal febrile convulsions.8
A prospective study assessing hippocampal volumes byMRI within 48 hours after status epilepticus is ongo-ing, but first results indicate that hippocampal edemamay develop after prolonged febrile convulsions.9
We report on 2 babies with unilateral swelling of thehippocampus after prolonged temporal lobe seizuresand subsequent shrinkage suggesting HS. Three yearslater, the first child underwent temporal lobectomy forrefractory TLE. Histological findings confirmed HSbut also revealed hippocampal microdysgenesis and se-quelae of a focal encephalitis, which was probably atthe origin of the initial acute event. The second childhad signs of brain dysgenesis, but acquired hippocam-pal damage affecting each side successively could bedocumented by serial MRI.
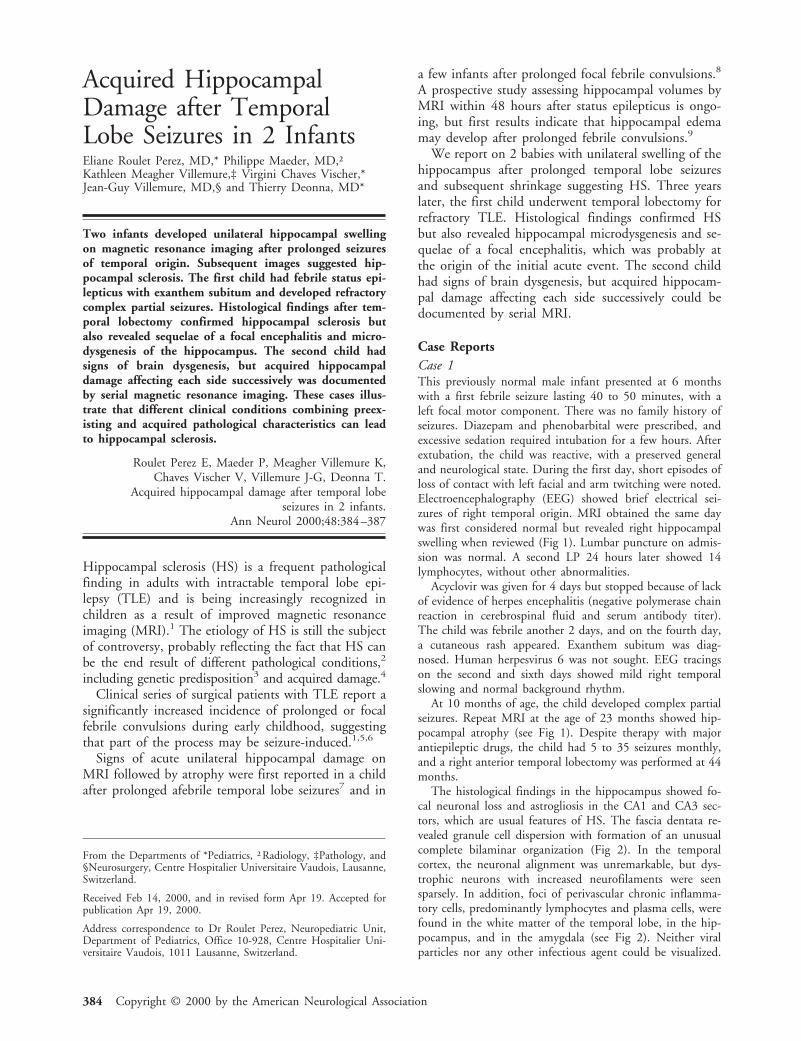
Case ReportsCase 1This previously normal male infant presented at 6 monthswith a first febrile seizure lasting 40 to 50 minutes, with aleft focal motor component. There was no family history ofseizures. Diazepam and phenobarbital were prescribed, andexcessive sedation required intubation for a few hours. Afterextubation, the child was reactive, with a preserved generaland neurological state. During the first day, short episodes ofloss of contact with left facial and arm twitching were noted.Electroencephalography (EEG) showed brief electrical sei-zures of right temporal origin. MRI obtained the same daywas first considered normal but revealed right hippocampalswelling when reviewed (Fig 1). Lumbar puncture on admis-sion was normal. A second LP 24 hours later showed 14lymphocytes, without other abnormalities.
Acyclovir was given for 4 days but stopped because of lackof evidence of herpes encephalitis (negative polymerase chainreaction in cerebrospinal fluid and serum antibody titer).The child was febrile another 2 days, and on the fourth day,a cutaneous rash appeared. Exanthem subitum was diag-nosed. Human herpesvirus 6 was not sought. EEG tracingson the second and sixth days showed mild right temporalslowing and normal background rhythm.
At 10 months of age, the child developed complex partialseizures. Repeat MRI at the age of 23 months showed hip-pocampal atrophy (see Fig 1). Despite therapy with majorantiepileptic drugs, the child had 5 to 35 seizures monthly,and a right anterior temporal lobectomy was performed at 44months.
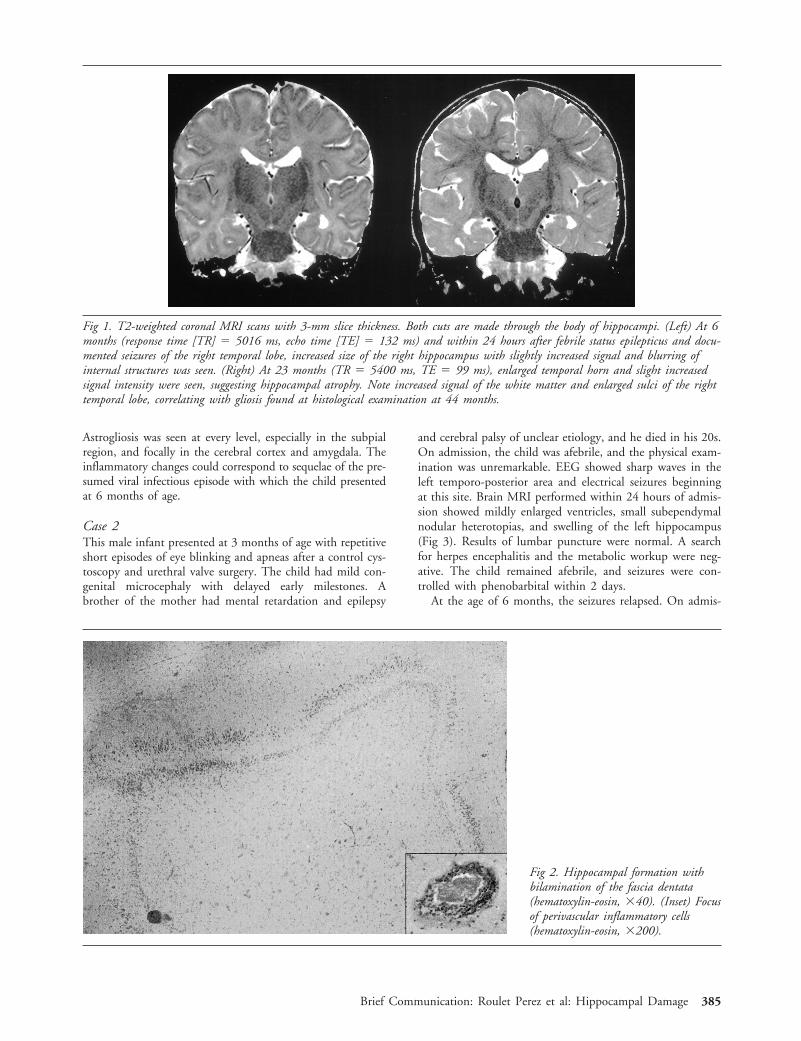
The histological findings in the hippocampus showed fo-cal neuronal loss and astrogliosis in the CA1 and CA3 sec-tors, which are usual features of HS. The fascia dentata re-vealed granule cell dispersion with formation of an unusualcomplete bilaminar organization (Fig 2). In the temporalcortex, the neuronal alignment was unremarkable, but dys-trophic neurons with increased neurofilaments were seensparsely. In addition, foci of perivascular chronic inflamma-tory cells, predominantly lymphocytes and plasma cells, werefound in the white matter of the temporal lobe, in the hip-pocampus, and in the amygdala (see Fig 2). Neither viralparticles nor any other infectious agent could be visualized.
From the Departments of *Pediatrics, †Radiology, ‡Pathology, and§Neurosurgery, Centre Hospitalier Universitaire Vaudois, Lausanne,Switzerland.
Received Feb 14, 2000, and in revised form Apr 19. Accepted forpublication Apr 19, 2000.
Address correspondence to Dr Roulet Perez, Neuropediatric Unit,Department of Pediatrics, Office 10-928, Centre Hospitalier Uni-versitaire Vaudois, 1011 Lausanne, Switzerland.
384 Copyright © 2000 by the American Neurological Association
Astrogliosis was seen at every level, especially in the subpialregion, and focally in the cerebral cortex and amygdala. Theinflammatory changes could correspond to sequelae of the pre-sumed viral infectious episode with which the child presentedat 6 months of age.
Case 2This male infant presented at 3 months of age with repetitiveshort episodes of eye blinking and apneas after a control cys-toscopy and urethral valve surgery. The child had mild con-genital microcephaly with delayed early milestones. Abrother of the mother had mental retardation and epilepsy
and cerebral palsy of unclear etiology, and he died in his 20s.On admission, the child was afebrile, and the physical exam-ination was unremarkable. EEG showed sharp waves in theleft temporo-posterior area and electrical seizures beginningat this site. Brain MRI performed within 24 hours of admis-sion showed mildly enlarged ventricles, small subependymalnodular heterotopias, and swelling of the left hippocampus(Fig 3). Results of lumbar puncture were normal. A searchfor herpes encephalitis and the metabolic workup were neg-ative. The child remained afebrile, and seizures were con-trolled with phenobarbital within 2 days.
At the age of 6 months, the seizures relapsed. On admis-
Fig 2. Hippocampal formation withbilamination of the fascia dentata(hematoxylin-eosin, 340). (Inset) Focusof perivascular inflammatory cells(hematoxylin-eosin, 3200).
Fig 1. T2-weighted coronal MRI scans with 3-mm slice thickness. Both cuts are made through the body of hippocampi. (Left) At 6months (response time [TR] 5 5016 ms, echo time [TE] 5 132 ms) and within 24 hours after febrile status epilepticus and docu-mented seizures of the right temporal lobe, increased size of the right hippocampus with slightly increased signal and blurring ofinternal structures was seen. (Right) At 23 months (TR 5 5400 ms, TE 5 99 ms), enlarged temporal horn and slight increasedsignal intensity were seen, suggesting hippocampal atrophy. Note increased signal of the white matter and enlarged sulci of the righttemporal lobe, correlating with gliosis found at histological examination at 44 months.
Brief Communication: Roulet Perez et al: Hippocampal Damage 385
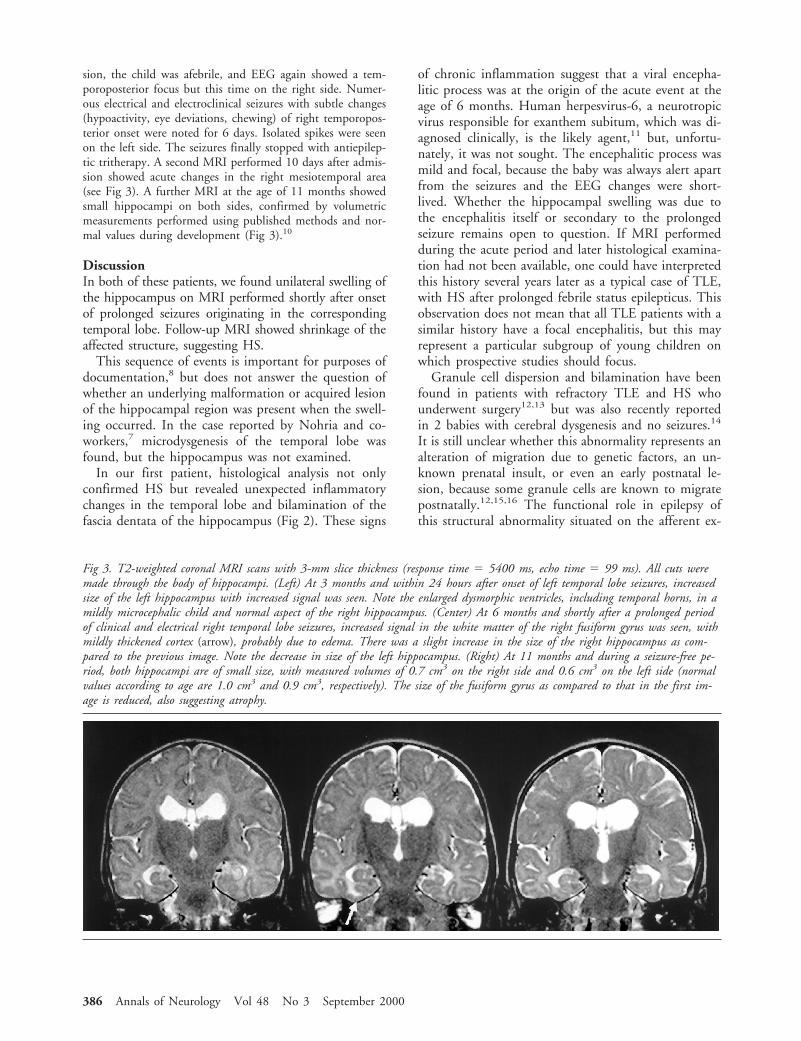
sion, the child was afebrile, and EEG again showed a tem-poroposterior focus but this time on the right side. Numer-ous electrical and electroclinical seizures with subtle changes(hypoactivity, eye deviations, chewing) of right temporopos-terior onset were noted for 6 days. Isolated spikes were seenon the left side. The seizures finally stopped with antiepilep-tic tritherapy. A second MRI performed 10 days after admis-sion showed acute changes in the right mesiotemporal area(see Fig 3). A further MRI at the age of 11 months showedsmall hippocampi on both sides, confirmed by volumetricmeasurements performed using published methods and nor-mal values during development (Fig 3).10
DiscussionIn both of these patients, we found unilateral swelling ofthe hippocampus on MRI performed shortly after onsetof prolonged seizures originating in the correspondingtemporal lobe. Follow-up MRI showed shrinkage of theaffected structure, suggesting HS.
This sequence of events is important for purposes ofdocumentation,8 but does not answer the question ofwhether an underlying malformation or acquired lesionof the hippocampal region was present when the swell-ing occurred. In the case reported by Nohria and co-workers,7 microdysgenesis of the temporal lobe wasfound, but the hippocampus was not examined.
In our first patient, histological analysis not onlyconfirmed HS but revealed unexpected inflammatorychanges in the temporal lobe and bilamination of thefascia dentata of the hippocampus (Fig 2). These signs
of chronic inflammation suggest that a viral encepha-litic process was at the origin of the acute event at theage of 6 months. Human herpesvirus-6, a neurotropicvirus responsible for exanthem subitum, which was di-agnosed clinically, is the likely agent,11 but, unfortu-nately, it was not sought. The encephalitic process wasmild and focal, because the baby was always alert apartfrom the seizures and the EEG changes were short-lived. Whether the hippocampal swelling was due tothe encephalitis itself or secondary to the prolongedseizure remains open to question. If MRI performedduring the acute period and later histological examina-tion had not been available, one could have interpretedthis history several years later as a typical case of TLE,with HS after prolonged febrile status epilepticus. Thisobservation does not mean that all TLE patients with asimilar history have a focal encephalitis, but this mayrepresent a particular subgroup of young children onwhich prospective studies should focus.
Granule cell dispersion and bilamination have beenfound in patients with refractory TLE and HS whounderwent surgery12,13 but was also recently reportedin 2 babies with cerebral dysgenesis and no seizures.14
It is still unclear whether this abnormality represents analteration of migration due to genetic factors, an un-known prenatal insult, or even an early postnatal le-sion, because some granule cells are known to migratepostnatally.12,15,16 The functional role in epilepsy ofthis structural abnormality situated on the afferent ex-
Fig 3. T2-weighted coronal MRI scans with 3-mm slice thickness (response time 5 5400 ms, echo time 5 99 ms). All cuts weremade through the body of hippocampi. (Left) At 3 months and within 24 hours after onset of left temporal lobe seizures, increasedsize of the left hippocampus with increased signal was seen. Note the enlarged dysmorphic ventricles, including temporal horns, in amildly microcephalic child and normal aspect of the right hippocampus. (Center) At 6 months and shortly after a prolonged periodof clinical and electrical right temporal lobe seizures, increased signal in the white matter of the right fusiform gyrus was seen, withmildly thickened cortex (arrow), probably due to edema. There was a slight increase in the size of the right hippocampus as com-pared to the previous image. Note the decrease in size of the left hippocampus. (Right) At 11 months and during a seizure-free pe-riod, both hippocampi are of small size, with measured volumes of 0.7 cm3 on the right side and 0.6 cm3 on the left side (normalvalues according to age are 1.0 cm3 and 0.9 cm3, respectively). The size of the fusiform gyrus as compared to that in the first im-age is reduced, also suggesting atrophy.
386 Annals of Neurology Vol 48 No 3 September 2000
citatory pathways to the hippocampus is also un-known.17 It may be a marker of a decreased focal ep-ileptic threshold and contribute to maintaining anepileptic process triggered by an external agent.
The second child had definite signs of brain dysgen-esis, with microcephaly, nodular heterotopias, enlargeddysmorphic ventricles, and early developmental delay.In this context, a structural abnormality of the hip-pocampal region preceding seizure onset can be postu-lated, although it was not visible on MRI. Actually,because the first MRI scan was obtained when the leftside was involved, we had the opportunity of noticingthe absence of a macroscopic lesion on the right side,which underwent acute changes at the age of 6 months.At this time, the gray and white matter of the fusiformgyrus adjacent to the right hippocampus seemed swollen(see Fig 3 center), presumably due to cytotoxic edema.18
These serial findings on MRI underline the acquirednature of at least part of the hippocampal pathologicalchanges, which can be attributed to the prolonged clin-ical and subclinical focal seizure activity. An encepha-litic, ischemic, or metabolic disorder can reasonably beruled out in this case. This evolution resembles the re-ported clinical syndrome of early-life bilateral HS,19
except that our child had clear preexisting pathologicalfindings in the brain, which later evolved in two sepa-rate episodes.
Of course, these 2 cases cannot be taken as generalmodels for explaining the pathogenesis of HS. They doillustrate the fact that different clinical conditions com-bining preexisting and acquired pathological character-istics2,20 can lead to acute hippocampal damage andsclerosis, however. These complex situations can nowbe analyzed with early serial MRI together with EEGstudies and, in some cases, histological data on the re-sected temporal lobe and hippocampus.
This work was supported by the Swiss National Research Fund(grant 32-5299.97 (E.R.P.)).
We thank M. Perlmutter for her assistance in the preparation of thismanuscript.
References1. Harvey AS, Grattan-Smith JD, Desmond PM, et al. Febrile sei-
zures and hippocampal sclerosis: frequent and related findingsin intractable temporal lobe epilepsy of childhood. Pediatr Neu-rol 1995;12:201–206
2. Mathern GW, Babb TL, Armstrong DL. Hippocampal sclero-sis. In: Engel J, Jr, Pedley TA, eds. Epilepsy: a comprehensivetextbook. Philadelphia: Lippicott-Raven, 1997:133–155
3. Fernandez G, Effenberger O, Vinz B, et al. Hippocampal mal-formation as a cause of familial febrile convulsions and subse-quent hippocampal sclerosis. Neurology 1998;50:909–917
4. Jackson GD, McIntosh AM, Briellmann RS, et al. Hippocam-pal sclerosis studied in identical twins. Neurology 1998;51:78–84
5. French JA, Williamson PD, Thadani M, et al. Characteristics ofmedial temporal lobe epilepsy. I. Results of history and physicalexamination. Ann Neurol 1993;34:774–780
6. Shinnar S. Prolonged febrile seizures and mesial temporal scle-rosis. Ann Neurol 1998;43:411–412
7. Nohria V, Lee N, Tien RD, et al. Magnetic resonance imagingevidence of hippocampal sclerosis in progression: a case report.Epilepsia 1994;35:1332–1336
8. VanLandingham KE, Heinz ER, Cavazos JE, et al. Magneticresonance imaging evidence of hippocampal injury after pro-longed focal febrile convulsions. Ann Neurol 1998;43:413–426
9. Scott RC, Gadian G, Neville B, et al. Hippocampal volumewithin 48 hours of status epilepticus. Eur J Pediatr Neurol1999;3:A17 (Abstract)
10. Utsunomiya H, Takano K, Okazaki M, et al. Development ofthe temporal lobe in infants and children: analysis by MR-basedvolumetry. AJNR Am J Neuroradiol 1999;20:717–723
11. Suga S, Yoshikawa T, Asano Y, et al. Clinical and virologicalanalyses of 21 infants with exanthem subitum (roseola infan-tum) and central nervous system complications. Ann Neurol1993;33:597–603
12. Houser CR. Granule cell dispersion in the dentate gyrus of hu-mans with temporal lobe epilepsy. Brain Res 1990;553:195–204
13. Raymond AA, Fish DR, Stevens JM, et al. Association of hip-pocampal sclerosis with cortical dysgenesis in patients with ep-ilepsy. Neurology 1994;44:1841–1845
14. Harding BJ, Thom M. Bilateral granule cell dispersion in thehippocampi of 3 infants at autopsy. J Neuropathol Exp Neurol1999;58:519 (Abstract)
15. Mathern GW, Leite JP, Pretorius JK, et al. Children with se-vere epilepsy: evidence of hippocampal neuron losses and aber-rant mossy fiber sprouting during postnatal granule cell migra-tion and differentiation. Dev Brain Res 1994;78:70–80
16. Babb TL. Hippocampal sclerosis and dual pathology: experi-mental and clinical evidence for developmental lesions. In: Tux-horn I, Holthausen H, Boenigk H, eds. Pediatric epilepsy syn-dromes and their surgical management. London: John Libbey,1997:227–233
17. Meagher-Villemure K, Villemure JG. Hippocampal abnormali-ties preceding hippocampal sclerosis in epileptic patients. CanJ Neurol Sci 1999;26:344 (Abstract)
18. Henry TR, Drury I, Brunberg JA, et al. Focal cerebral magneticresonance changes associated with partial status epilepticus. Epi-lepsia 1994;35:35–41
19. DeLong GR, Heinz ER. The clinical syndrome of early life bi-lateral hippocampal sclerosis. Ann Neurol 1997;42:11–17
20. Lewis DV. Febrile convulsions and mesial temporal sclerosis.Curr Opin Neurol 1999;12:197–201
Brief Communication: Roulet Perez et al: Hippocampal Damage 387

Gene PolymorphismAffecting a1-Antichymotrypsin andInterleukin-1 Plasma LevelsIncreases Alzheimer’sDisease RiskFederico Licastro, MD,* Steve Pedrini, MSc,*Cinzia Ferri, MSc,† Valeria Casadei, MD,†Marzia Govoni, MSc,* Annalisa Pession, MSc,*Francesca Luisa Sciacca, MD,† Fabrizio Veglia, PhD,†Giorgio Annoni, MD,‡ Massimiliano Bonafe, MD,*Fabiola Olivieri, MSc,§ Claudio Franceschi, MD,§ andLuigi Maria Edoardo Grimaldi, MD†
Plasma levels of a1-antichymotrypsin (ACT) and inter-leukin-1b (IL-1b) were increased in patients with prob-able Alzheimer’s disease (AD). A common polymorphismwithin ACT and IL-1b genes affected plasma levels ofACT or IL-1b, and AD patients with the ACT T,T orIL-1b T,T genotype showed the highest levels of plasmaACT or IL-1b, respectively. The concomitant presenceof the ACT T,T and IL-1b T,T genotypes increased therisk of AD (odds ratio: 5.606, confidence interval: 1.654–18.996) and decreased the age at onset of the disease.
Licastro F, Pedrini S, Ferri C, Casadei V,Govoni M, Pession A, Sciacca FL, Veglia F,
Annon G, Bonafe M, Olivieri F, Franceschi C,Grimaldi LME. Gene polymorphism affectinga1-antichymotrypsin and interleukin-1 plasma
levels increases Alzheimer’s disease risk.Ann Neurol 2000;48:388–391
The major cause of cognitive deterioration in the el-derly is Alzheimer’s disease (AD), a disease with complexand heterogeneous pathogenetic mechanisms.1 Geneticfactors have been found associated with the sporadic ornonfamilial form of the disease,2 and allele 4 of apoli-poprotein E (ApoE)3,4 significantly increases the risk ofAD. Other genetic and environmental factors might also
be implicated in the disease, because allelic variants of afew molecules could not account for all sporadic AD.
Molecules that regulate inflammation are of great in-terest, because inflammation is often associated withneurodegenerative hallmarks in the AD brain. Reactiveastrocytosis is present in the cortex and hippocampusof AD brain,5 and activated glia are localized within ornear AD lesions.6 Cytokines released by astroglia mayplay a role in neuronal death,7 and interleukin-1 (IL-1)–containing microglia are increased in Down’s syndromeand AD brains.8 Activated astrocytes surrounding amy-loid plaques express increased a1-antichymotrypsin(ACT) messenger RNA,9 an acute phase protein, andincreased ACT protein levels are present in ADbrains.10 Moreover, ACT and IL-1 may be functionallylinked, because IL-1 promoted overexpression of ACTmessenger RNA in activated astrocytes.11 Subjects takinganti-inflammatory medications have a reduced risk ofdeveloping AD.12
Markers of abnormal immune regulation such as in-creased blood levels of IL-1b13 and ACT14 in patientswith AD have also been found, and the polymorphicalleles in the promoter region of IL-1a and IL-1bgenes have been shown to increase AD risk.15 There-fore, inflammation might be intrinsically associatedwith neurodegenerative processes leading to AD, andACT and IL-1b molecules might have a special role inAD pathogenesis.
To further investigate the relevance of these moleculesin sporadic AD, the effects of ACT and IL-1b genepolymorphisms on plasma levels of ACT and IL-1b andon the risk of developing AD were investigated.
Patients and MethodsPatients and ControlsDiagnosis of probable AD was performed according to standardclinical procedures and followed the NINCDS-ADRDA16 andDiagnostic and Statistical Manual of Mental Disorders (thirdrevised edition) criteria.17 Cognitive performances and alter-ations were measured according to the Mini-Mental StateEvaluation (MMSE) and Global Deterioration Scale. Onlycontrols and AD patients without clinical signs of systemicinflammation (eg, normal body temperature or absence ofconcomitant inflammatory disease) were chosen. AD patientsor controls with an abnormal erythrocyte sedimentation rateor blood albumin, transferrin, or C-reactive protein levelswere not included. According to this procedure, 118 patientswith probable AD (mean [6SE] age, 74 6 1 years, MMSEscore, 14 6 0.8) and 144 controls (mean age, 83 6 1 years,MMSE score, .26) entered the pilot study on plasma ACTand IL-1b. The ACT and IL-1b genotype investigation in-cluded 281 patients with probable AD (172 women, meanage, 76 6 1 years; 109 men, mean age, 72 6 1 years;MMSE score: 15 6 0.5) and 201 nondemented controls (64women, mean age, 75 6 1 years; 137 men, mean age, 66 61 years; age range, 50–92 years; MMSE score, .26). Pa-tients and controls were Caucasian and recruited from north-
From the *Dipartimento di Patologia Sperimentale, School of Med-icine, University of Bologna, and †Neuroimmunology Unit, De-partment of Neuroscience, San Raffaele Hospital and ‡Departmentof Geriatrics, University of Milan, Milan, and §Instituto NationaleRicerca e Ricovero Anziani, Ancona, Italy.
Received Feb 9, 2000, and in revised form Apr 6 and Apr 24. Ac-cepted for publication Apr 24, 2000.
Address correspondence to Dr Licastro, Dipartimento di PatologiaSperimentale, School of Medicine, University of Bologna, Via SanGiacomo 14, 40126 Bologna, Italy.
388 Copyright © 2000 by the American Neurological Association

ern Italy. Informed consent from each control and a relativeof each AD patient was obtained.
Plasma Levels of ACT and IL-1bBlood levels of IL-1b (Endogen, Milan, Italy) and ACT(The Binding Site, Birmingham, UK) were measured as pre-viously described.18
Genetic ScreeningDNA was obtained from blood mononuclear cells by a com-mercial kit (QiAmp blood kit; Kagan, Crawley, UK). Thetriallelic Apoe ε2–4 polymorphism was assessed by a poly-merase chain reaction–based method.19 The ACT biallelicpolymorphism in the signal peptide (15 Ala 3 Thr) and theC-to-T restriction fragment length polymorphism within theIL-1b promoter region were assessed as previously de-scribed.15,19
Statistical AnalysisGenotype and allele distribution were analyzed by x2 test.The odds ratio (OR) was also calculated as described else-where.19 The Hardy-Weinberg equilibrium was verified inboth AD and control populations. ACT and IL-1b plasmalevels were compared by ANOVA One Way. The adjustedOR was estimated by logistic regression analysis (Cochran-Manel-Haenszel statistics). The effect of genotypes on theage at onset of AD was assessed by the Kaplan-Meier analysisand log rank statistic.
ResultsPlasma proteins were reduced in demented patients(AD, 41 6 1 g/L; controls, 50 6 1 g/L; p , 0.0001).Therefore, plasma ACT was calculated as the percent-age of plasma protein to minimize variability and wasincreased in patients (AD, 1.005 6 0.03%; controls,0.778 6 0.04%; p , 0.001). As shown in Figure A,among AD patients, those with the ACT T,T genotypehad the highest levels of the serpin (T,T vs A,A geno-type; p , 0.05). Levels of ACT from AD patients withthe ACT T,T genotype were still increased when datawere expressed as absolute values (ACT T,T: 444 6 20mg/L vs ACT A,A 1 A,T: 382 6 18 mg/L; p 5 0.05),although no difference in total plasma protein betweenAD groups (42 6 2, 41 6 2, and 41 6 2 g/L, respec-tively) was present.
Plasma IL-1b was increased in patients (AD, 0.479 60.15 pg/ml, controls, 0.14 6 0.02 pg/ml; p , 0.02), wasdetectable in a larger proportion of AD patients thancontrols (14% vs 0.7%, respectively; p 5 0.0001) andwas highest in AD patients with the IL-1b T,T geno-type (T,T vs C,C genotype; p , 0.03; see Fig B). Differ-ences between the 3 AD groups were also present whenIL-1b was expressed as a percentage of plasma protein(C,C 5 7%, C,T 5 12%; T,T 5 36% 3 10210).
We then investigated whether any combination ofthe ACT A,T and IL-1b C,T genotypes might modifythe risk of AD. The concomitant presence of both
ACT T,T and IL-1b T,T genotypes significantlyincreased the risk of AD (Table; OR, 5.606, CI,1.654–18.996, p 5 0.002) independently from theApoE4 status (ApoE4–adjusted OR, 10.009, CI,2.779–36.437; p 5 0.001). The presence of the ACTT,T genotype alone or the IL-1b T,T genotype aloneconferred a slight increase in the risk for the disease(OR, 2.56, CI, 1.3–5.2, p 5 0.009 and OR, 2.33, CI,1.3–4.18, p 5 0.004, respectively).
The presence of both genotypes slightly decreasedthe age at onset of AD in patients older than 65 years(mean age of ACT T,T/IL-1bT,T carriers, 68.86 62.25 years; mean age of noncarriers, 73.28 6 0.69years; p 5 0.062). This difference was at the limit ofstatistical significance, because the number of ACTT,T/IL-1bT,T homozygous patients was small. Whenthe analysis was restricted to late onset AD (age . 65years) with the ACT T,T genotype, a small but statis-tically significant decrease in age at onset of the diseasewas also observed (ACT T,T: 70.37 6 1.25 years,ACT A carriers: 73.72 6 0.77 years; p 5 0.0241).
Fig. (A) Effect of a1-antichymotrypsin (ACT) A,T genotypeson plasma levels of ACT (expressed as percentage of total plasmaprotein) in Alzheimer’s disease (AD) patients (AD with ACTT,T vs AD with ACT A,A 1 A,T; p , 0.05). (B) Effect ofinterleukin-1b (IL-1b) C,T genotypes on plasma levels ofIL-1b in AD (AD with IL-1b T,T vs AD with IL-1b C,C 1C,T; p , 0.03).
Brief Communication: Licastro et al: ACT and IL-1b Polymorphism in AD 389

ConclusionsOur findings suggest that different genetic backgroundsmight affect diverse abilities of synthesizing, releasing, orabsorbing inflammation-related factors in patients withAD. Polymorphisms of ACT and IL-1b genes influ-enced the blood turnover of these molecules in AD, be-cause they were associated with different levels of cir-culating ACT or IL-1b. At the moment, we cannotascribe the increment of blood ACT or IL-1b levels toan obvious activation of peripheral immunocytes. Aprevious investigation18 showed no association betweenmetabolic activation of the reticular endothelial cellsystem and increased levels of ACT and IL-1b in ADand suggested a possible brain origin of these factors.Furthermore, patients were selected to minimize thepresence of subclinical peripheral inflammation.
In the Italian population, the ACT T,T and IL-1bT,T genotypes were slightly and independently in-creased in patients with AD as shown here and else-where.15,19 The concomitant presence of these geno-types was increased in AD patients and identified agroup of subjects with an elevated risk of late-onsetAD. The present data support the notion that ACTand IL-1b genes might be functionally linked topathogenetic mechanisms associated with AD. The di-verse genetic backgrounds of these molecules might in-fluence the risk of developing AD by differentially af-fecting the brain capacity to respond to inflammatorystimulation.
Our recent observations showing that ACT plasmalevels in AD patients positively correlated with the de-gree of cognitive deterioration18 as assessed by theMMSE or Global Deterioration Scale and that brainACT correlated with the number of activated astro-cytes20 indirectly support these speculations. It is un-clear whether ACT increase is a primary or a secondaryevent in AD; nevertheless, it seems to be associatedwith cognitive deterioration, because ACT levels werealso elevated in nondemented elderly subjects withmarginal cognitive impairment (data not shown).
The group of patients with both ACT T,T andIL-1b T,T genotypes was small but showed a high riskof AD and a decreased age at onset of the disease. Thisage-related effect was only observable in patients older
than 65 years. Therefore, genetic background, brain in-flammation, and age might differentially interact insubgroups of patients, and inflammation might play aspecial role in sporadic late-onset AD.
Finally, we speculated that patients with diverse ge-netic backgrounds for inflammatory molecules mightdifferentially benefit from anti-inflammatory therapiesaimed at delaying the progress of the disease.
This research was supported by the Italian MURST (40% and60%) and Italian ARAD.
References1. Katzman RN. Medical progress: Alzheimer’s disease. N Engl
J Med 1986;274:964–9732. Rubinsztein DC. The genetics of Alzheimer’s disease. Prog
Neurobiol 1997;52:447–4543. Corder EH, Saunders AM, Strittmatter WJ, et al. Gene dose of
apolipoprotein E type 4 allele and the risk of Alzheimer’s dis-ease in late onset families. Science 1993;261:921–923
4. Poirier J, Davignon J, Bouthillier D, et al. Apolipoprotein Epolymorphism and Alzheimer’s disease. Lancet 1993;342:697–699
5. Beach TG, Walker R, McGeer EG. Patterns of gliosis in Alz-heimer’s disease and aging cerebrum. Glia 1989;2:420–436
6. McGeer PL, Rogers J, McGeer EG. Neuroimmune mechanismsin Alzheimer’s disease pathogenesis. Alzheimer Dis Assoc Dis-ord 1994;8:149–158
7. Griffin WS, Sheng JG, Royston MC, et al. Glial-neuronal in-teractions in Alzheimer’s disease: the potential role of a “cyto-kine cycle” in disease progression. Brain Pathol 1998;818:65–72
8. Griffin WS, Stanley LC, Ling C, et al. Brain interleukin-1 andS-100 immunoreactivity are elevated in Down’s syndrome andAlzheimer’s disease. Proc Natl Acad Sci USA 1989;86:7611–7615
9. Abraham CR, Selkoe DJ, Potter H. Immunochemical identifi-cation of the serine protease inhibitor alpha-1-antichymotrypsinin the brain amyloid deposits. Cell 1988;52:487–502
10. Licastro F, Campbell IL, Kincaid C, et al. A role for apoE inregulating the levels of alpha-1-antichymotrypsin in the agingmouse brain and in Alzheimer disease. Am J Pathol 1999;155:869–875
11. Lieb K, Fielbich BL, Schaller H, et al. Interleukin-1b and tu-mor necrosis factor-a induce expression of a1-antichymotrypsinin human astrocytoma cells by activation of nuclear factor-kappa B. J Neurochem 1996;67:2039–2044
12. Breitner JCS, Gau BA, Welsh KA, et al. Inverse association of
Table. Frequency of the a1-Antichymotrypsin T,T/Interleukin-1b T,T Genotypes in Alzheimer’s Disease Patients andNondemented Controls
Subjects with a1-AntichymotrypsinT,T/Interleukin-1b T,T Genotypes n Odds Ratio p (95% CI)
Alzheimer’s disease patients 22 (7.8%)a 281 5.606 0.0001 (1.654–18.996)Controls 3 (1.5%)a 201
aStatistical significance according to x2 test: p 5 0.002.
Apolipoprotein E4–adjusted odds ratio in subjects with the a1-antichymotrypsin T,T/interleukin-1b T,T genotypes: 10.009, confidence in-terval: 2.779–36.437; p 5 0.001.
390 Annals of Neurology Vol 48 No 3 September 2000

anti-inflammatory treatments and Alzheimer’s disease. Neurol-ogy 1994;44:227–232
13. Alvarez XA, Franco A, Fernandez-Novoa F, Cacabelos R. Bloodlevels of histamine, IL-1b and TNF-a in patients with mild tomoderate Alzheimer disease. Mol Chem Neuropathol 1996;29:237–252
14. Licastro F, Morini MC, Polazzi E, Davis LJ. Increased seruma-1-antichymotrypsin in patients with probable Alzheimer’sdisease: an acute phase reactant without the peripheral acutephase response. J Neuroimmunol 1995;57:71–75
15. Grimaldi LME, Casadei VM, Ferri C, et al. Association of earlyonset Alzheimer’s disease with an interleukin-1a gene polymor-phism. Ann Neurol 2000;47:351–365
16. McKhann G, Drachman D, Folstein M, et al. Clinical diagno-sis of Alzheimer’s disease: report of the NINCDS-ADRDAWork Group under the auspices of Department of Health andHuman Services Task Force on Alzheimer’s Disease. Neurology1984;34:939–944
17. American Psychiatric Association. Diagnostic and StatisticalManual of Mental Disorders: DSM-III-R, 3rd revised ed.Washington, DC: American Psychiatric Association, 1987
18. Licastro F, Pedrini S, Caputo L, et al. Increased plasma levels ofinterleukin-1, interleukin-6 and a-1-antichymotrypsin in pa-tients with Alzheimer’s disease: peripheral inflammation or sig-nals from the brain? J Neuroimmunol 2000;103:97–102
19. Licastro F, Pedrini S, Govoni M, et al. Apolipoprotein E anda-1-antichymotrypsin allele polymorphism in sporadic and fa-milial Alzheimer’s disease. Neurosci Letters 1999;270:129–132
20. Licastro F, Mallory M, Hansen LA, Masliah E. Increased levelsof alpha-1-antichymotrypsin in brains of patients with Alzhei-mer’s disease correlate with activated astrocytes and are affectedby APOE 4 genotype. J Neuroimmunol 1998;88:105–110
Limited DonepezilInhibition ofAcetylcholinesteraseMeasured with PositronEmission Tomography inLiving AlzheimerCerebral CortexDavid E. Kuhl, MD,* Satoshi Minoshima, MD, PhD,*Kirk A. Frey, MD, PhD,*† Norman L. Foster, MD,†Michael R. Kilbourn, PhD,* and Robert A. Koeppe, PhD*
Based on surrogate assays of peripheral red blood cells,reports state that widely prescribed doses of donepezilhydrochloride provide nearly complete inhibition of ce-rebral cortical acetylcholinesterase activity in the treat-ment of Alzheimer’s disease (AD). To test this, directpositron emission tomography measures of cerebral ace-tylcholinesterase activity were made in AD patients be-fore and after treatment with donepezil (5 and 10 mg/day) for at least 5 weeks and compared with similarmeasures in normal controls who were untreated or afteracute administration of another AChE inhibitor, phy-sostigmine salicylate (1.5 mg/hr). After physostigmine,acetylcholinesterase inhibition averaged 52% in normalcerebral cortex. After donepezil, cerebral cortical inhibi-tion in AD brain averaged only 27%. Clinical trials ofthis donepezil dose schedule are not testing the effect ofnearly complete cerebral cortical inhibition.
Kuhl DE, Minoshima S, Frey KA, Foster NL,Kilbourn MR, Koeppe RA. Limited donepezil
inhibition of acetylcholinesterase measured withpositron emission tomography in living Alzheimer
cerebral cortex. Ann Neurol 2000;48:391–395
The use of cholinomimetic drugs to improve cognitivefunctioning in Alzheimer’s disease (AD) is based onpresynaptic cholinergic deficits found consistently inAD cerebral cortex as well as studies of acetylcholine(ACh) in animal and human behavior.1 A common ra-tionale is to increase the availability of ACh within
From the *Division of Nuclear Medicine, Department of InternalMedicine, and †Department of Neurology, University of Michigan,Ann Arbor, MI.
Received Mar 1, 2000, and in revised form Apr 19. Accepted forpublication May 11, 2000.
Address correspondence to Dr Kuhl, Division of Nuclear Medicine,University of Michigan Hospital, Room B1 G505/0028, Ann Ar-bor, MI 48109-0028.
Copyright © 2000 by the American Neurological Association 391
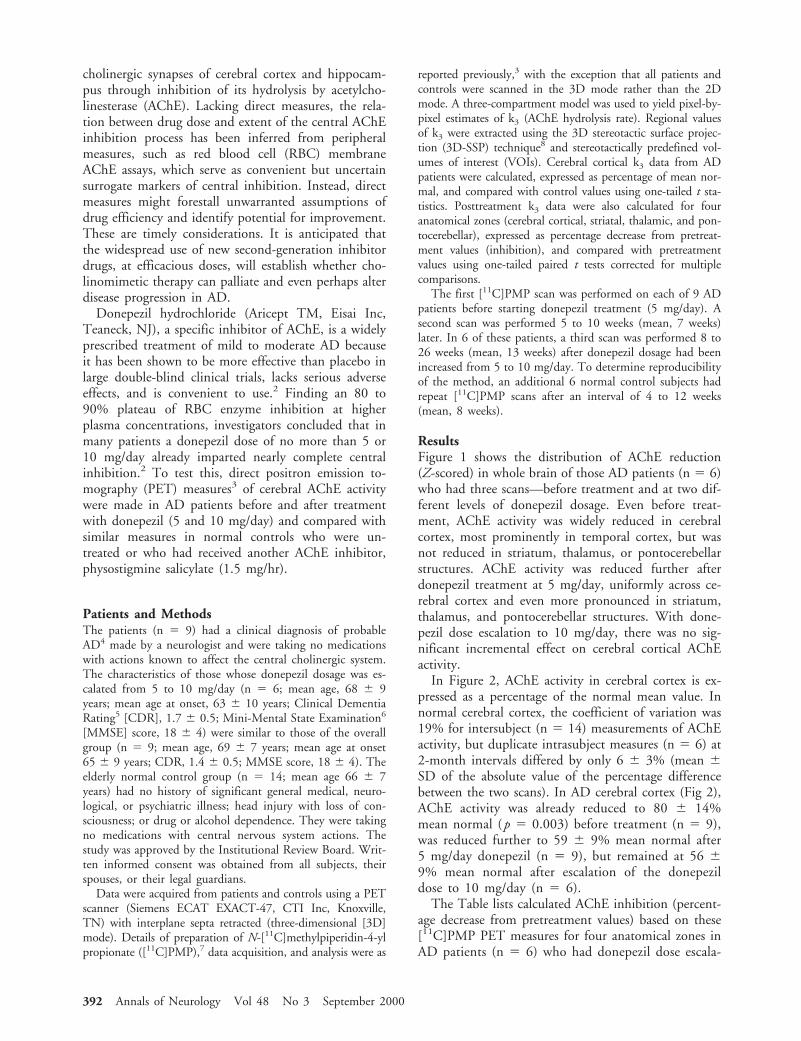
cholinergic synapses of cerebral cortex and hippocam-pus through inhibition of its hydrolysis by acetylcho-linesterase (AChE). Lacking direct measures, the rela-tion between drug dose and extent of the central AChEinhibition process has been inferred from peripheralmeasures, such as red blood cell (RBC) membraneAChE assays, which serve as convenient but uncertainsurrogate markers of central inhibition. Instead, directmeasures might forestall unwarranted assumptions ofdrug efficiency and identify potential for improvement.These are timely considerations. It is anticipated thatthe widespread use of new second-generation inhibitordrugs, at efficacious doses, will establish whether cho-linomimetic therapy can palliate and even perhaps alterdisease progression in AD.
Donepezil hydrochloride (Aricept TM, Eisai Inc,Teaneck, NJ), a specific inhibitor of AChE, is a widelyprescribed treatment of mild to moderate AD becauseit has been shown to be more effective than placebo inlarge double-blind clinical trials, lacks serious adverseeffects, and is convenient to use.2 Finding an 80 to90% plateau of RBC enzyme inhibition at higherplasma concentrations, investigators concluded that inmany patients a donepezil dose of no more than 5 or10 mg/day already imparted nearly complete centralinhibition.2 To test this, direct positron emission to-mography (PET) measures3 of cerebral AChE activitywere made in AD patients before and after treatmentwith donepezil (5 and 10 mg/day) and compared withsimilar measures in normal controls who were un-treated or who had received another AChE inhibitor,physostigmine salicylate (1.5 mg/hr).
Patients and MethodsThe patients (n 5 9) had a clinical diagnosis of probableAD4 made by a neurologist and were taking no medicationswith actions known to affect the central cholinergic system.The characteristics of those whose donepezil dosage was es-calated from 5 to 10 mg/day (n 5 6; mean age, 68 6 9years; mean age at onset, 63 6 10 years; Clinical DementiaRating5 [CDR], 1.7 6 0.5; Mini-Mental State Examination6
[MMSE] score, 18 6 4) were similar to those of the overallgroup (n 5 9; mean age, 69 6 7 years; mean age at onset65 6 9 years; CDR, 1.4 6 0.5; MMSE score, 18 6 4). Theelderly normal control group (n 5 14; mean age 66 6 7years) had no history of significant general medical, neuro-logical, or psychiatric illness; head injury with loss of con-sciousness; or drug or alcohol dependence. They were takingno medications with central nervous system actions. Thestudy was approved by the Institutional Review Board. Writ-ten informed consent was obtained from all subjects, theirspouses, or their legal guardians.
Data were acquired from patients and controls using a PETscanner (Siemens ECAT EXACT-47, CTI Inc, Knoxville,TN) with interplane septa retracted (three-dimensional [3D]mode). Details of preparation of N-[11C]methylpiperidin-4-ylpropionate ([11C]PMP),7 data acquisition, and analysis were as
reported previously,3 with the exception that all patients andcontrols were scanned in the 3D mode rather than the 2Dmode. A three-compartment model was used to yield pixel-by-pixel estimates of k3 (AChE hydrolysis rate). Regional valuesof k3 were extracted using the 3D stereotactic surface projec-tion (3D-SSP) technique8 and stereotactically predefined vol-umes of interest (VOIs). Cerebral cortical k3 data from ADpatients were calculated, expressed as percentage of mean nor-mal, and compared with control values using one-tailed t sta-tistics. Posttreatment k3 data were also calculated for fouranatomical zones (cerebral cortical, striatal, thalamic, and pon-tocerebellar), expressed as percentage decrease from pretreat-ment values (inhibition), and compared with pretreatmentvalues using one-tailed paired t tests corrected for multiplecomparisons.
The first [11C]PMP scan was performed on each of 9 ADpatients before starting donepezil treatment (5 mg/day). Asecond scan was performed 5 to 10 weeks (mean, 7 weeks)later. In 6 of these patients, a third scan was performed 8 to26 weeks (mean, 13 weeks) after donepezil dosage had beenincreased from 5 to 10 mg/day. To determine reproducibilityof the method, an additional 6 normal control subjects hadrepeat [11C]PMP scans after an interval of 4 to 12 weeks(mean, 8 weeks).
ResultsFigure 1 shows the distribution of AChE reduction(Z-scored) in whole brain of those AD patients (n 5 6)who had three scans—before treatment and at two dif-ferent levels of donepezil dosage. Even before treat-ment, AChE activity was widely reduced in cerebralcortex, most prominently in temporal cortex, but wasnot reduced in striatum, thalamus, or pontocerebellarstructures. AChE activity was reduced further afterdonepezil treatment at 5 mg/day, uniformly across ce-rebral cortex and even more pronounced in striatum,thalamus, and pontocerebellar structures. With done-pezil dose escalation to 10 mg/day, there was no sig-nificant incremental effect on cerebral cortical AChEactivity.
In Figure 2, AChE activity in cerebral cortex is ex-pressed as a percentage of the normal mean value. Innormal cerebral cortex, the coefficient of variation was19% for intersubject (n 5 14) measurements of AChEactivity, but duplicate intrasubject measures (n 5 6) at2-month intervals differed by only 6 6 3% (mean 6SD of the absolute value of the percentage differencebetween the two scans). In AD cerebral cortex (Fig 2),AChE activity was already reduced to 80 6 14%mean normal ( p 5 0.003) before treatment (n 5 9),was reduced further to 59 6 9% mean normal after5 mg/day donepezil (n 5 9), but remained at 56 69% mean normal after escalation of the donepezildose to 10 mg/day (n 5 6).
The Table lists calculated AChE inhibition (percent-age decrease from pretreatment values) based on these[11C]PMP PET measures for four anatomical zones inAD patients (n 5 6) who had donepezil dose escala-
392 Annals of Neurology Vol 48 No 3 September 2000
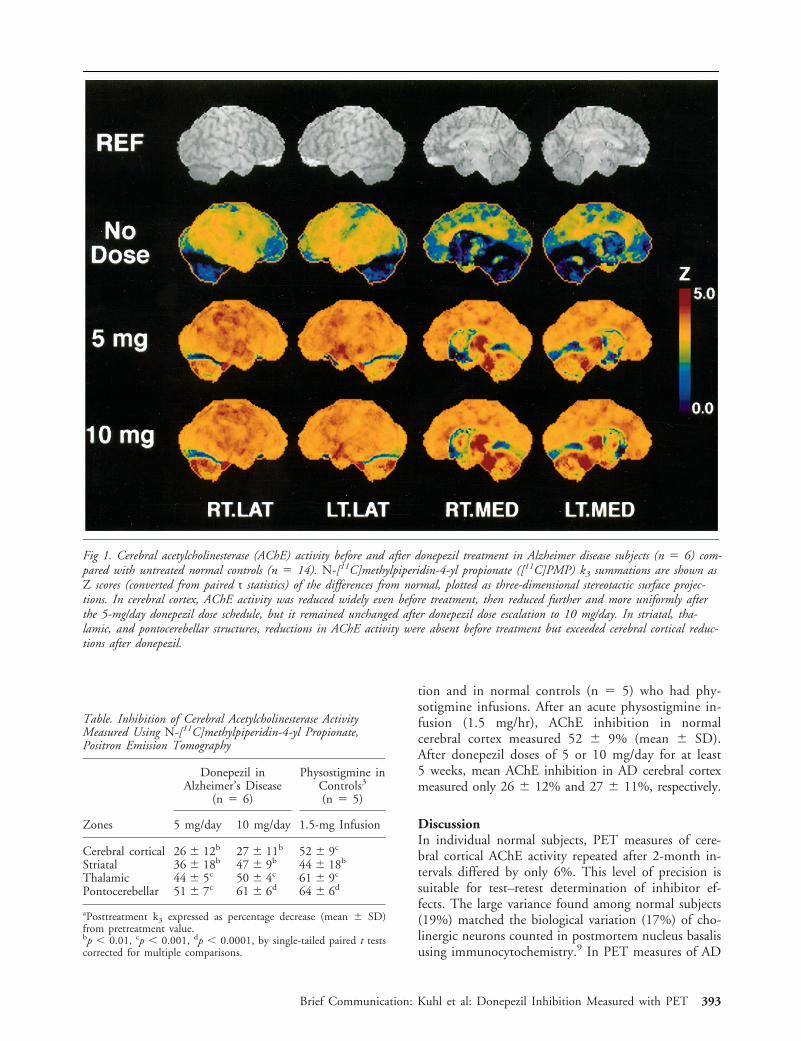
tion and in normal controls (n 5 5) who had phy-sotigmine infusions. After an acute physostigmine in-fusion (1.5 mg/hr), AChE inhibition in normalcerebral cortex measured 52 6 9% (mean 6 SD).After donepezil doses of 5 or 10 mg/day for at least5 weeks, mean AChE inhibition in AD cerebral cortexmeasured only 26 6 12% and 27 6 11%, respectively.
DiscussionIn individual normal subjects, PET measures of cere-bral cortical AChE activity repeated after 2-month in-tervals differed by only 6%. This level of precision issuitable for test–retest determination of inhibitor ef-fects. The large variance found among normal subjects(19%) matched the biological variation (17%) of cho-linergic neurons counted in postmortem nucleus basalisusing immunocytochemistry.9 In PET measures of AD
Fig 1. Cerebral acetylcholinesterase (AChE) activity before and after donepezil treatment in Alzheimer disease subjects (n 5 6) com-pared with untreated normal controls (n 5 14). N-[11C]methylpiperidin-4-yl propionate ([11C]PMP) k3 summations are shown asZ scores (converted from paired t statistics) of the differences from normal, plotted as three-dimensional stereotactic surface projec-tions. In cerebral cortex, AChE activity was reduced widely even before treatment, then reduced further and more uniformly afterthe 5-mg/day donepezil dose schedule, but it remained unchanged after donepezil dose escalation to 10 mg/day. In striatal, tha-lamic, and pontocerebellar structures, reductions in AChE activity were absent before treatment but exceeded cerebral cortical reduc-tions after donepezil.
Table. Inhibition of Cerebral Acetylcholinesterase ActivityMeasured Using N-[11C]methylpiperidin-4-yl Propionate,Positron Emission Tomography
Zones
Donepezil inAlzheimer’s Disease
(n 5 6)
Physostigmine inControls3
(n 5 5)
5 mg/day 10 mg/day 1.5-mg Infusion
Cerebral cortical 26 6 12b 27 6 11b 52 6 9c
Striatal 36 6 18b 47 6 9b 44 6 18b
Thalamic 44 6 5c 50 6 4c 61 6 9c
Pontocerebellar 51 6 7c 61 6 6d 64 6 6d
aPosttreatment k3 expressed as percentage decrease (mean 6 SD)from pretreatment value.bp , 0.01, cp , 0.001, dp , 0.0001, by single-tailed paired t testscorrected for multiple comparisons.
Brief Communication: Kuhl et al: Donepezil Inhibition Measured with PET 393
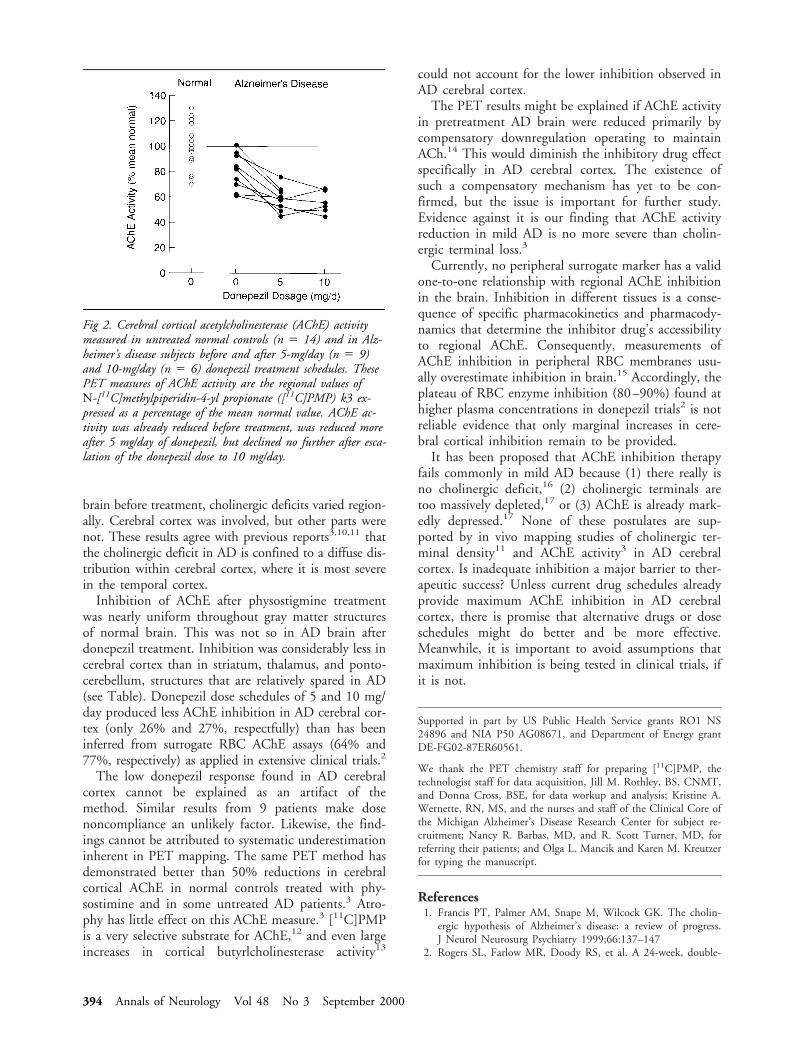
brain before treatment, cholinergic deficits varied region-ally. Cerebral cortex was involved, but other parts werenot. These results agree with previous reports3,10,11 thatthe cholinergic deficit in AD is confined to a diffuse dis-tribution within cerebral cortex, where it is most severein the temporal cortex.
Inhibition of AChE after physostigmine treatmentwas nearly uniform throughout gray matter structuresof normal brain. This was not so in AD brain afterdonepezil treatment. Inhibition was considerably less incerebral cortex than in striatum, thalamus, and ponto-cerebellum, structures that are relatively spared in AD(see Table). Donepezil dose schedules of 5 and 10 mg/day produced less AChE inhibition in AD cerebral cor-tex (only 26% and 27%, respectfully) than has beeninferred from surrogate RBC AChE assays (64% and77%, respectively) as applied in extensive clinical trials.2
The low donepezil response found in AD cerebralcortex cannot be explained as an artifact of themethod. Similar results from 9 patients make dosenoncompliance an unlikely factor. Likewise, the find-ings cannot be attributed to systematic underestimationinherent in PET mapping. The same PET method hasdemonstrated better than 50% reductions in cerebralcortical AChE in normal controls treated with phy-sostimine and in some untreated AD patients.3 Atro-phy has little effect on this AChE measure.3 [11C]PMPis a very selective substrate for AChE,12 and even largeincreases in cortical butyrlcholinesterase activity13
could not account for the lower inhibition observed inAD cerebral cortex.
The PET results might be explained if AChE activityin pretreatment AD brain were reduced primarily bycompensatory downregulation operating to maintainACh.14 This would diminish the inhibitory drug effectspecifically in AD cerebral cortex. The existence ofsuch a compensatory mechanism has yet to be con-firmed, but the issue is important for further study.Evidence against it is our finding that AChE activityreduction in mild AD is no more severe than cholin-ergic terminal loss.3
Currently, no peripheral surrogate marker has a validone-to-one relationship with regional AChE inhibitionin the brain. Inhibition in different tissues is a conse-quence of specific pharmacokinetics and pharmacody-namics that determine the inhibitor drug’s accessibilityto regional AChE. Consequently, measurements ofAChE inhibition in peripheral RBC membranes usu-ally overestimate inhibition in brain.15 Accordingly, theplateau of RBC enzyme inhibition (80–90%) found athigher plasma concentrations in donepezil trials2 is notreliable evidence that only marginal increases in cere-bral cortical inhibition remain to be provided.
It has been proposed that AChE inhibition therapyfails commonly in mild AD because (1) there really isno cholinergic deficit,16 (2) cholinergic terminals aretoo massively depleted,17 or (3) AChE is already mark-edly depressed.17 None of these postulates are sup-ported by in vivo mapping studies of cholinergic ter-minal density11 and AChE activity3 in AD cerebralcortex. Is inadequate inhibition a major barrier to ther-apeutic success? Unless current drug schedules alreadyprovide maximum AChE inhibition in AD cerebralcortex, there is promise that alternative drugs or doseschedules might do better and be more effective.Meanwhile, it is important to avoid assumptions thatmaximum inhibition is being tested in clinical trials, ifit is not.
Supported in part by US Public Health Service grants RO1 NS24896 and NIA P50 AG08671, and Department of Energy grantDE-FG02-87ER60561.
We thank the PET chemistry staff for preparing [11C]PMP, thetechnologist staff for data acquisition, Jill M. Rothley, BS, CNMT,and Donna Cross, BSE, for data workup and analysis; Kristine A.Wernette, RN, MS, and the nurses and staff of the Clinical Core ofthe Michigan Alzheimer’s Disease Research Center for subject re-cruitment; Nancy R. Barbas, MD, and R. Scott Turner, MD, forreferring their patients; and Olga L. Mancik and Karen M. Kreutzerfor typing the manuscript.
References1. Francis PT, Palmer AM, Snape M, Wilcock GK. The cholin-
ergic hypothesis of Alzheimer’s disease: a review of progress.J Neurol Neurosurg Psychiatry 1999;66:137–147
2. Rogers SL, Farlow MR, Doody RS, et al. A 24-week, double-
Fig 2. Cerebral cortical acetylcholinesterase (AChE) activitymeasured in untreated normal controls (n 5 14) and in Alz-heimer’s disease subjects before and after 5-mg/day (n 5 9)and 10-mg/day (n 5 6) donepezil treatment schedules. ThesePET measures of AChE activity are the regional values ofN-[11C]methylpiperidin-4-yl propionate ([11C]PMP) k3 ex-pressed as a percentage of the mean normal value. AChE ac-tivity was already reduced before treatment, was reduced moreafter 5 mg/day of donepezil, but declined no further after esca-lation of the donepezil dose to 10 mg/day.
394 Annals of Neurology Vol 48 No 3 September 2000
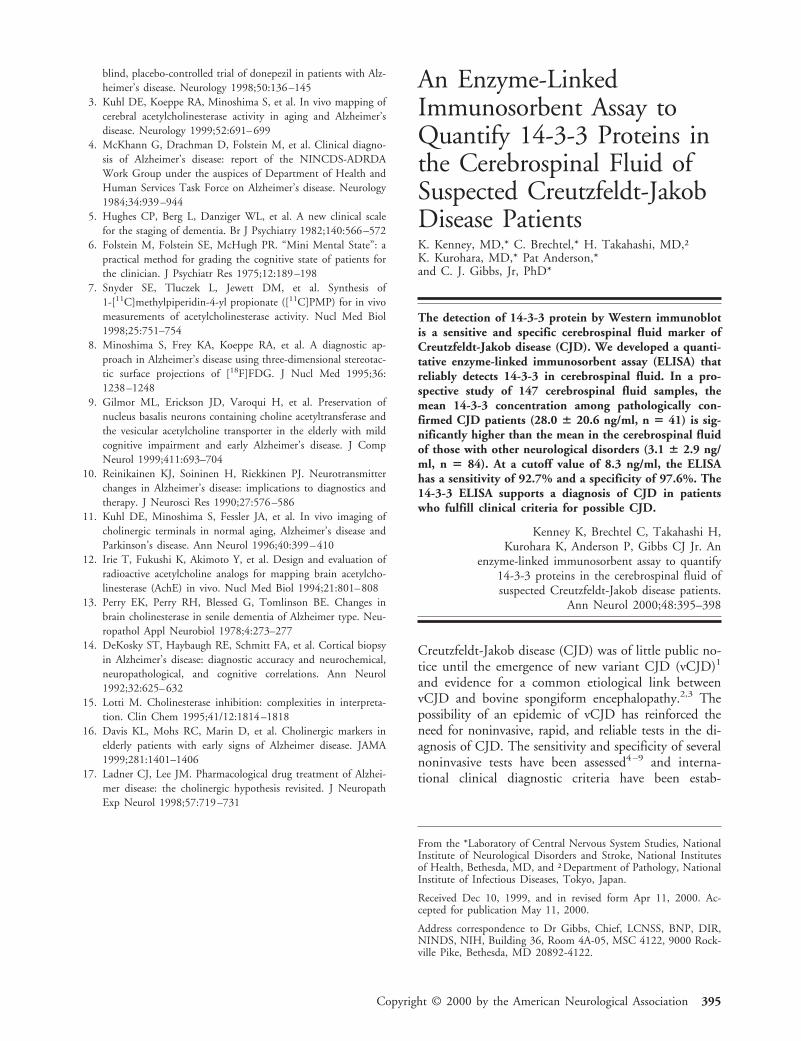
blind, placebo-controlled trial of donepezil in patients with Alz-heimer’s disease. Neurology 1998;50:136–145
3. Kuhl DE, Koeppe RA, Minoshima S, et al. In vivo mapping ofcerebral acetylcholinesterase activity in aging and Alzheimer’sdisease. Neurology 1999;52:691–699
4. McKhann G, Drachman D, Folstein M, et al. Clinical diagno-sis of Alzheimer’s disease: report of the NINCDS-ADRDAWork Group under the auspices of Department of Health andHuman Services Task Force on Alzheimer’s disease. Neurology1984;34:939–944
5. Hughes CP, Berg L, Danziger WL, et al. A new clinical scalefor the staging of dementia. Br J Psychiatry 1982;140:566–572
6. Folstein M, Folstein SE, McHugh PR. “Mini Mental State”: apractical method for grading the cognitive state of patients forthe clinician. J Psychiatr Res 1975;12:189–198
7. Snyder SE, Tluczek L, Jewett DM, et al. Synthesis of1-[11C]methylpiperidin-4-yl propionate ([11C]PMP) for in vivomeasurements of acetylcholinesterase activity. Nucl Med Biol1998;25:751–754
8. Minoshima S, Frey KA, Koeppe RA, et al. A diagnostic ap-proach in Alzheimer’s disease using three-dimensional stereotac-tic surface projections of [18F]FDG. J Nucl Med 1995;36:1238–1248
9. Gilmor ML, Erickson JD, Varoqui H, et al. Preservation ofnucleus basalis neurons containing choline acetyltransferase andthe vesicular acetylcholine transporter in the elderly with mildcognitive impairment and early Alzheimer’s disease. J CompNeurol 1999;411:693–704
10. Reinikainen KJ, Soininen H, Riekkinen PJ. Neurotransmitterchanges in Alzheimer’s disease: implications to diagnostics andtherapy. J Neurosci Res 1990;27:576–586
11. Kuhl DE, Minoshima S, Fessler JA, et al. In vivo imaging ofcholinergic terminals in normal aging, Alzheimer’s disease andParkinson’s disease. Ann Neurol 1996;40:399–410
12. Irie T, Fukushi K, Akimoto Y, et al. Design and evaluation ofradioactive acetylcholine analogs for mapping brain acetylcho-linesterase (AchE) in vivo. Nucl Med Biol 1994;21:801–808
13. Perry EK, Perry RH, Blessed G, Tomlinson BE. Changes inbrain cholinesterase in senile dementia of Alzheimer type. Neu-ropathol Appl Neurobiol 1978;4:273–277
14. DeKosky ST, Haybaugh RE, Schmitt FA, et al. Cortical biopsyin Alzheimer’s disease: diagnostic accuracy and neurochemical,neuropathological, and cognitive correlations. Ann Neurol1992;32:625–632
15. Lotti M. Cholinesterase inhibition: complexities in interpreta-tion. Clin Chem 1995;41/12:1814–1818
16. Davis KL, Mohs RC, Marin D, et al. Cholinergic markers inelderly patients with early signs of Alzheimer disease. JAMA1999;281:1401–1406
17. Ladner CJ, Lee JM. Pharmacological drug treatment of Alzhei-mer disease: the cholinergic hypothesis revisited. J NeuropathExp Neurol 1998;57:719–731
An Enzyme-LinkedImmunosorbent Assay toQuantify 14-3-3 Proteins inthe Cerebrospinal Fluid ofSuspected Creutzfeldt-JakobDisease PatientsK. Kenney, MD,* C. Brechtel,* H. Takahashi, MD,†K. Kurohara, MD,* Pat Anderson,*and C. J. Gibbs, Jr, PhD*
The detection of 14-3-3 protein by Western immunoblotis a sensitive and specific cerebrospinal fluid marker ofCreutzfeldt-Jakob disease (CJD). We developed a quanti-tative enzyme-linked immunosorbent assay (ELISA) thatreliably detects 14-3-3 in cerebrospinal fluid. In a pro-spective study of 147 cerebrospinal fluid samples, themean 14-3-3 concentration among pathologically con-firmed CJD patients (28.0 6 20.6 ng/ml, n 5 41) is sig-nificantly higher than the mean in the cerebrospinal fluidof those with other neurological disorders (3.1 6 2.9 ng/ml, n 5 84). At a cutoff value of 8.3 ng/ml, the ELISAhas a sensitivity of 92.7% and a specificity of 97.6%. The14-3-3 ELISA supports a diagnosis of CJD in patientswho fulfill clinical criteria for possible CJD.
Kenney K, Brechtel C, Takahashi H,Kurohara K, Anderson P, Gibbs CJ Jr. An
enzyme-linked immunosorbent assay to quantify14-3-3 proteins in the cerebrospinal fluid ofsuspected Creutzfeldt-Jakob disease patients.
Ann Neurol 2000;48:395–398
Creutzfeldt-Jakob disease (CJD) was of little public no-tice until the emergence of new variant CJD (vCJD)1
and evidence for a common etiological link betweenvCJD and bovine spongiform encephalopathy.2,3 Thepossibility of an epidemic of vCJD has reinforced theneed for noninvasive, rapid, and reliable tests in the di-agnosis of CJD. The sensitivity and specificity of severalnoninvasive tests have been assessed4–9 and interna-tional clinical diagnostic criteria have been estab-
From the *Laboratory of Central Nervous System Studies, NationalInstitute of Neurological Disorders and Stroke, National Institutesof Health, Bethesda, MD, and †Department of Pathology, NationalInstitute of Infectious Diseases, Tokyo, Japan.
Received Dec 10, 1999, and in revised form Apr 11, 2000. Ac-cepted for publication May 11, 2000.
Address correspondence to Dr Gibbs, Chief, LCNSS, BNP, DIR,NINDS, NIH, Building 36, Room 4A-05, MSC 4122, 9000 Rock-ville Pike, Bethesda, MD 20892-4122.
Copyright © 2000 by the American Neurological Association 395

lished.10 Since we reported that the detection of cere-brospinal fluid (CSF) 14-3-3 protein is a sensitive andspecific marker for CJD,11 the 14-3-3 Western blot(WB) immunoassay’s sensitivity and specificity hasbeen corroborated by other laboratories12 and is nowroutinely used worldwide. In 1998, the World HealthOrganization recommended that the clinical diagnosticcriteria for probable CJD be amended to include eitherthe detection of 14-3-3 protein in CSF or the diagnos-tic electroencephalogram.13 Unfortunately, the WB as-say is not informative regarding the magnitude of the14-3-3 proteins or the relative contributions of the dif-ferent 14-3-3 isoenzymes during the different stages ofdisease. Here we present a quantitative 14-3-3 ELISA,its validation, sensitivity, and specificity, and a compar-ison with the WB immunoassay.
Materials and MethodsMaterials14-3-3 protein was prepared from normal bovine brain14 byDr Paul Wagner (National Cancer Institute, National Insti-tutes of Health, Bethesda, MD) and provided to us. Mono-clonal anti–14-3-3 antibody (produced by immunizationwith recombinant 14-3-3b antigen) was provided by Dr Hi-dehiro Takahashi (Department of Pathology, National Insti-tute of Infectious Diseases, Tokyo, Japan).
14-3-3 Antigen Capture AssayWe developed and optimized an indirect double sandwichELISA as follows: Monoclonal capture anti–14-3-3 antibodywas pipetted into each well of a microplate (NUNC Im-muno Maxisorp FB, Roskilde, Denmark), and the plate wasincubated overnight. Bovine 14-3-3 protein standards, rang-ing from 2.1 to 135.0 ng/ml, were prepared daily from afrozen stock solution in serial two-fold dilutions. Each wellwas loaded with 14-3-3 standard, diluent, or CSF test sam-ple, and the microplate was incubated at 37°C. The platewas washed three times and blocked with a solution of BSA,sucrose, and nonfat dry milk. The detector antibody, rabbitanti–14-3-3b polyclonal antibody (Santa Cruz Biotechnol-ogy, Santa Cruz, CA), was loaded into each well, and themicroplate was incubated for 1.5 hours. After washing,peroxidase-labeled goat anti-rabbit IgG antibody (KPL,Gaithersburg, MD) was loaded into each well, and the mi-croplate was incubated at 37°C. TMB was added for color-imetric detection. The enzymatic reaction was stopped, andabsorbance values were measured. Each CSF sample was runin duplicate in a blinded fashion. A control series of standard14-3-3 antigen and diluent was included on every micro-plate.
14-3-3 Western Blot MethodWe performed the WB as previously described by Hsich andassociates16 or by a modified protocol to incorporate precastgels. Molecular weight markers and CSF controls (fromconfirmed CJD and non-CJD patients) were included onevery gel.
CSF Samples and CJD Diagnostic CriteriaCSF samples were prospectively collected from patients sus-pected of having CJD. Each patient with suspected CJD wasassigned to one of four clinical diagnostic categories—definiteCJD, probable CJD, possible CJD, or other neurological dis-order (OND)—according to accepted criteria.10 Follow-upclinical and pathological information was sought by question-naire on each patient every 3 to 6 months. All CSF sampleswere kept frozen.
Of the 84 CSFs in the OND category in this study, 53did not fulfill clinical criteria for possible CJD at initial pre-sentation and were assigned to OND; of these, most hadeither a long-standing pure dementia or an acute reversibleencephalopathy. Thirty-one specimens were from patientswho initially fulfilled clinical criteria for possible CJD butwho on subsequent testing or clinical follow-up were diag-nosed with conditions other than CJD. These diagnoses arelisted in Table 1.
Precision and Statistical EvaluationIntra-assay precision was calculated by determining 14 sets of14-3-3 standards simultaneously. Inter-assay precision wascalculated by determining the same range of standards onconsecutive days. The unpaired Student’s t test was used tocompare mean CSF 14-3-3 concentrations in two instances,definite CJD versus OND and definite plus probable CJDversus OND. In all cases, p values less than 0.05 were consid-ered to be statistically significant. Confidence intervals werecalculated by the exact method for a binomial parameter.
ResultsStandardization of ELISAA standard curve is linear for 14-3-3 concentrationsranging from 2.1 to 135 ng/ml with a correlation co-
Table 1. Alternate Diagnoses in Patients Suspected of CJD a
Diagnosis No.
Encephalopathy 5Encephalitis 4CNS vasculitis 2Meningitis 2Neurosyphilis 2Motor neuron disease 2Multi-infarct dementia 2Subacute ataxia 2Alzheimer’s 1Alzheimer’s 1 Lewy bodies 1Glioblastoma multiforme 1Glioma, temporal lobe 1Gliosis 1Leukoencephalopathy 1Myoclonic epilepsy 1Normal brain 1Non-CJD pathology 1Status epilepticus 1
aThese patients initially fulfilled criteria for possible CJD, but wereultimately diagnosed with conditions other than CJD.
CJD 5 Creutzfeldt-Jakob disease.
396 Annals of Neurology Vol 48 No 3 September 2000

efficient (R2) of 1.00. The minimum detectable 14-3-3concentration is 2.1 ng/ml (determined by adding 2SD to the mean background value). The intra-assayand interassay coefficients of variation (CV) for stan-dards in the 2.1- to 135-ng/ml working range are 0.03are 0.10, respectively. Storage of the CSF at room tem-perature for up to 24 hours, and in one case for 6 days,did not significantly degrade the signal (data notshown). Thus, specimens may be sent to laboratories atroom temperature by overnight mail and frozen at thetesting laboratory site.
Diagnostic ApplicationThere was a significant increase (p , 0.0001, Stu-dent’s t test) in mean 14-3-3 CSF levels between def-inite CJD patients (28.0 6 20.6 ng/ml) and OND(3.1 6 2.9 ng/ml), as well as a significant increase(p , 0.0001, Student’s t test) between probable CJDpatients (56.4 6 84.0 ng/ml) and OND (Fig). Com-bined definite and probable CJD had a mean 14-3-3CSF level of 38.1 6 53.0 ng/ml (p , 0.0001, Stu-dent’s t test). With a 14-3-3 cutoff value of 8.3 ng/ml
and considering definite CJD versus OND, the ELISAhas a sensitivity of 92.7% and a specificity of 97.6%.The positive and negative predictive values are 95%and 96.5%, respectively. The WB has a sensitivity of95.1% and specificity of 97.6% on the same specimencohort. Combining both definite and probable CJDversus OND specimens, the ELISA has a sensitivity of88.9% and the WB of 93.7%. Table 2 compares thestatistical accuracy of the 14-3-3 ELISA with that ofthe 14-3-3 WB in these patient specimens.
DiscussionWe have developed a sensitive and precise ELISA forthe quantification of 14-3-3 protein in CSF. TheELISA analysis of CSF from patients stratified by di-agnosis category indicates a significantly higher 14-3-3concentration in definite and probable CJD patientsthan in the CSF of patients with other neurologicaldisorders.
The ELISA had three false-negative results amongspecimens from definite (14-3-3 values of 2.1, 2.5, 3.5ng/ml) and four among probable CJD patients (14-3-3values of 3.5, 2.1, 6.4, 5.0 ng/ml), whereas the WBhad two each within the same specimen groups (thesefour were negative by both tests), for a total of sevenversus four false-negatives. The three ELISA false-negatives that were positive by WB had values of 2.1,3.5 and 5.0 ng/ml. The ELISA had two false-positiveresults: a patient each with CNS vasculitis (20.4 ng/ml)and temporal lobe glioma (12.4 ng/ml). The WB assayalso had two false-positives: a patient each with asepticmeningitis (5.4 ng/ml) and status epilepticus (6.3 ng/ml). We do not know why there were differencesamong both the false-positive and false-negative groupsby the two assays. It could be explained by the differ-ences in antibody sensitivities, particularly because themonoclonal antibody used in the ELISA detects differ-ent 14-3-3 isoforms from the polyclonal antibody used
Fig. CSF 14-3-3 levels in patients stratified by CJDdiagnosis category. The squares represent CSF 14-3-3 by ELISA in patients with definite CJD (n 541); diamonds, CSF 14-3-3 analyses in patientswith probable CJD (n 5 19; 3 probable patients’levels are not shown because their levels were greaterthan 100 ng/ml); and the circles represent CSF 14-3-3 levels in patients with OND (n 5 84). Thehorizontal line just below 10 corresponds to a 14-3-3 level of 8.3 ng/ml for reference.
Table 2. Detection of 14-3-3 Protein in Cerebrospinal Fluidin Patients with CJD and Other Neurological Disorders
ELISAa (%) Western Blot (%)
CJD 56/63 (88.9) 59/63 (93.7)Definite 38/41 (92.7) 39/41 (95.1)Probable 18/22 (81.8) 20/22 (90.9)
Other neurologicaldisorder
2/84 (02.4) 2/84 (2.4)
Sensitivity (definiteCJD)
(92.7) (95.1)
Sensitivity (definite 1probable CJD)
(88.9) (93.7)
Specificity (97.6) (97.6)
aUsing a selected cutoff of over 8.3 ng/ml.
CJD 5 Creutzfeldt-Jakob disease.
Brief Communication: Kenney et al: 14-3-3 Proteins in CJD Patients 397

in the WB assay. The specimens in this study wererestricted to those submitted prospectively to our lab-oratory by referring physicians considering the diagno-sis of CJD in their patients. The numbers overall arelimited, and more accurate sensitivity and specificitydeterminations will be made as more specimens aretested.
There are clear advantages to using the ELISA overthe WB method for the detection of CSF 14-3-3 pro-tein. Its quantitative nature yields greater informationin longitudinal studies of experimentally induced TSEs.It tells us about the magnitude and duration of theproteins’ presence. Further, ELISA obviates some ofthe inconsistencies inherent in the WB protocol. Vari-ations in the number, location, and intensity of band-ing patterns can confound the assessment of the WB.Finally, the ELISA method facilitates the simultaneousprocessing of numerous CSF samples and is readilyadaptable to a clinical laboratory setting.
In this study, an ELISA that quantifies 14-3-3 pro-tein in CSF was developed. The method was validatedin CSF samples from patients suspected of havingCJD. A statistically significant increase was shown inCSF 14-3-3 level of patients with definite and probableCJD versus OND. When appropriately applied to pa-tients fulfilling clinical criteria for possible CJD, theELISA has a high sensitivity and specificity and sup-ports a clinical diagnosis of CJD.
References1. Will RG, Ironside JW, Zeidler M, et al. A new variant of
Creutzfeldt-Jakob disease in the UK. Lancet 1996;347:921–9252. Collinge J, Sidle KC, Meads J, et al. Molecular analysis of prion
strain variation and the aetiology of “new variant” CJD. Nature1996;383:685–690
3. Bruce ME, Will RG, Ironside JW, et al. Transmission to miceindicate that “new variant” CJD is caused by the BSE agent.Nature 1997;389:498–501
4. Finkenstaedt M, Szudra A, Zerr I, et al. Magnetic resonanceimaging of Creutzfeldt-Jakob disease. Radiology 1996;199:793–798
5. Zerr I, Bodemer M, Racker S, et al. Cerebrospinal fluid con-centration of neuron-specific enolase in diagnosis of Creutz-feldt-Jakob disease. Lancet 1995;345:1609–1610
6. Otto M, Stein H, Szudra A, et al. Elevated level of S-100 pro-tein concentration in CSF of patients with Creutzfeldt-Jakobdisease. Akt Neurol 1996;23:71 (Abstract)
7. Otto M, Wiltfang J, Tumani H, et al. Elevated levels of tau-protein in CSF of patients with Creutzfeldt-Jakob disease. Neu-rosci Lett 1997;225:210–212
8. Jimi T, Wakayama Y, Shibuya S, et al. High levels of nervoussystem–specific proteins in cerebrospinal fluid in patients withearly stage Creutzfeldt-Jakob disease. Clin Chim Acta 1992;211:37–46
9. Manaka H, Kato T, Kurita K, et al. Marked increase in cere-brospinal fluid ubiquitin in Creutzfeldt-Jakob disease. NeurosciLett 1992;139:47–49
10. Kretzschmar HA, Ironside JW, DeArmond SJ, Tateishi J. Di-agnostic criteria for sporadic Creutzfeldt-Jakob disease. ArchNeurol 1996;53:913–920
11. Hsich G, Kenney K, Gibbs CJ, et al. The 14-3-3 brain proteinin cerebrospinal fluid as a marker for transmissible spongiformencephalopathies. N Engl J Med 1996;335:924–930
12. Zerr I, Bodemer M, Gefeller O, et al. Detection of 14-3-3 pro-tein in the cerebrospinal fluid supports the diagnosis ofCreutzfeldt-Jakob disease. Ann Neurol 1998;43:32–40
13. Report of a WHO consultation. Global surveillance, diagnosisand therapy of human transmissible spongiform encephalopa-thies. World Health Organization, Geneva, Switzerland, 1998.WHO/EMC/ZDI/98.9
14. Ichimura T, Isobe T, Okuyama T et al. Brain 14-3-3 protein isan activator protein that activates tryptophan 5-monooxygenaseand tyrosine 3-monooxygenase in the presence of Ca21,calmodulin-dependent protein kinase II. FEBS Lett 1987;219:79–82
CorrectionIn the article by Leone et al (2000;48:27–38) in the Julyissue of Annals of Neurology, there were several errors:1. In the list of authors: The correct spelling of the
third author’s name is L. Bilaniuk, MD, and An-drew Freese’s degrees are MD, PhD.
2. On page 34, right column, last paragraph: The thirdsentence should read “At baseline, the T1 signalshowed an abnormal prolongation within the subcor-tical and deep white matter, and the T2-weightedimages showed a reciprocal abnormal signal (hyper-intensity) that was particularly evident on FLAIR.”
3. On page 36, left column: The first line should read“. . . tensity on T1-weighted images, suggesting newmyelination of the cor- . . .”
4. Also on page 36, left column, first paragraph: Thesecond full sentence should read “T2-weighted im-ages at this time continued to show an abnormal hy-perintensity consistent with spongiform pathologybut with little interval change over the entire year af-ter delivery.”
398 Annals of Neurology Vol 48 No 3 September 2000