nodal insights for generation owners and modeling with auroraxmp
TRANSCRIPT

© PA Knowledge Limited 2014 1
NODAL INSIGHTS 2014 Electric Market Forecasting Conference September 17-19, 2014

© PA Knowledge Limited 2014 2
Overview
Nodal Background
• Constraints -- $ matter
• What’s in a Hub price? What’s in a Zonal price?
Shift Factors and Congestion
Pricing Considerations
• Congestion
• Marginal Losses
Nodal vs. Zonal – the role of Interregional and Local Constraints

© PA Knowledge Limited 2014 3
Four constraints account for 50+% of projected 2015 PJM congestion
______________________________
Source: PJM Market Efficiency Analysis Base Congestion Results
0%
2%
4%
6%
8%
10%
12%
14%
16%
18%
20%
0%
10%
20%
30%
40%
50%
60%
70%
80%
90%
100%
© PA Knowledge Limited 2014 4
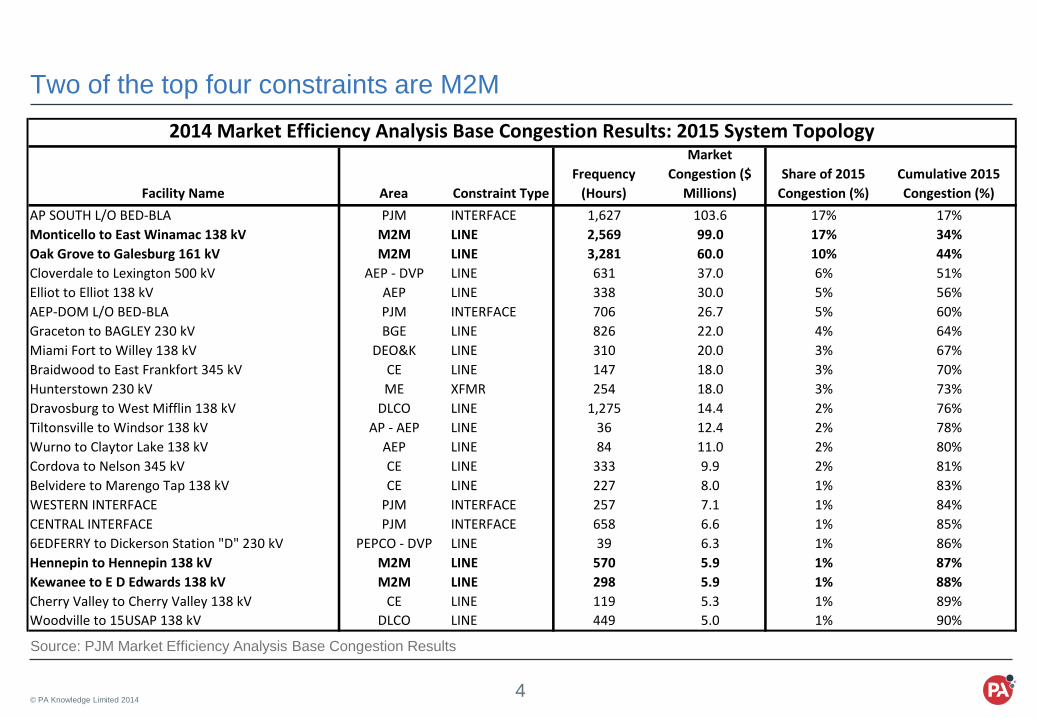
Two of the top four constraints are M2M
Source: PJM Market Efficiency Analysis Base Congestion Results
Facility Name Area Constraint TypeFrequency
(Hours)
Market Congestion ($
Millions)Share of 2015
Congestion (%)Cumulative 2015 Congestion (%)
AP SOUTH L/O BED-BLA PJM INTERFACE 1,627 103.6 17% 17%Monticello to East Winamac 138 kV M2M LINE 2,569 99.0 17% 34%Oak Grove to Galesburg 161 kV M2M LINE 3,281 60.0 10% 44%Cloverdale to Lexington 500 kV AEP - DVP LINE 631 37.0 6% 51%Elliot to Elliot 138 kV AEP LINE 338 30.0 5% 56%AEP-DOM L/O BED-BLA PJM INTERFACE 706 26.7 5% 60%Graceton to BAGLEY 230 kV BGE LINE 826 22.0 4% 64%Miami Fort to Willey 138 kV DEO&K LINE 310 20.0 3% 67%Braidwood to East Frankfort 345 kV CE LINE 147 18.0 3% 70%Hunterstown 230 kV ME XFMR 254 18.0 3% 73%Dravosburg to West Mifflin 138 kV DLCO LINE 1,275 14.4 2% 76%Tiltonsville to Windsor 138 kV AP - AEP LINE 36 12.4 2% 78%Wurno to Claytor Lake 138 kV AEP LINE 84 11.0 2% 80%Cordova to Nelson 345 kV CE LINE 333 9.9 2% 81%Belvidere to Marengo Tap 138 kV CE LINE 227 8.0 1% 83%WESTERN INTERFACE PJM INTERFACE 257 7.1 1% 84%CENTRAL INTERFACE PJM INTERFACE 658 6.6 1% 85%6EDFERRY to Dickerson Station "D" 230 kV PEPCO - DVP LINE 39 6.3 1% 86%Hennepin to Hennepin 138 kV M2M LINE 570 5.9 1% 87%Kewanee to E D Edwards 138 kV M2M LINE 298 5.9 1% 88%Cherry Valley to Cherry Valley 138 kV CE LINE 119 5.3 1% 89%Woodville to 15USAP 138 kV DLCO LINE 449 5.0 1% 90%
2014 Market Efficiency Analysis Base Congestion Results: 2015 System Topology
© PA Knowledge Limited 2014 5
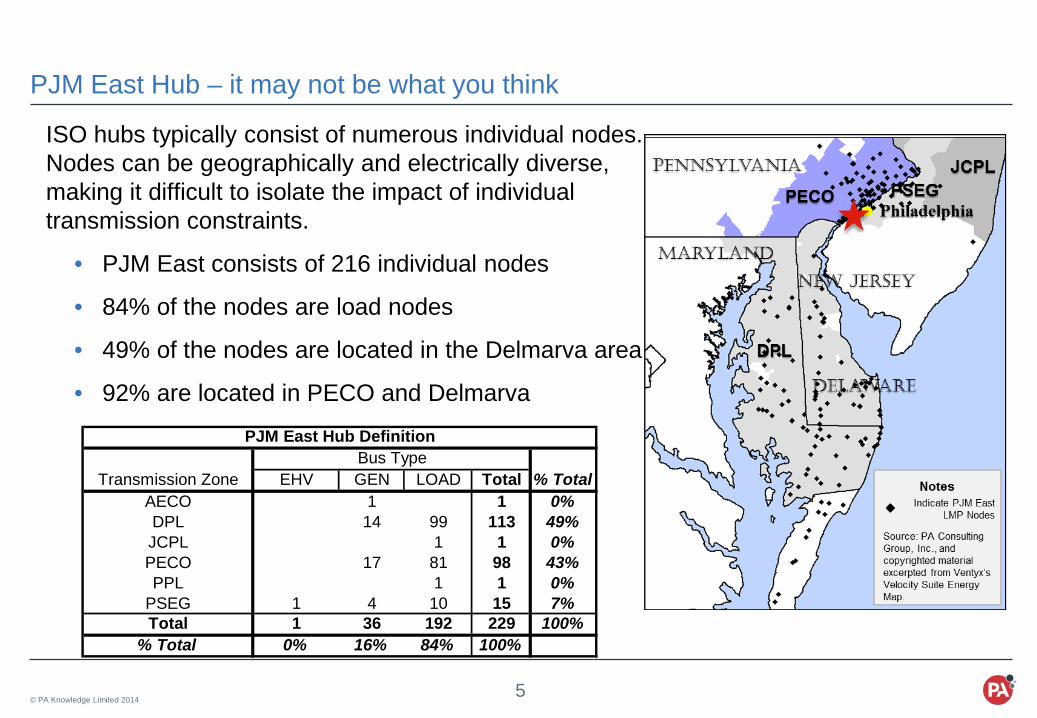
PJM East Hub – it may not be what you think
ISO hubs typically consist of numerous individual nodes. Nodes can be geographically and electrically diverse, making it difficult to isolate the impact of individual transmission constraints.
• PJM East consists of 216 individual nodes
• 84% of the nodes are load nodes
• 49% of the nodes are located in the Delmarva area
• 92% are located in PECO and Delmarva
Transmission Zone EHV GEN LOAD Total % TotalAECO 1 1 0%DPL 14 99 113 49%JCPL 1 1 0%PECO 17 81 98 43%PPL 1 1 0%
PSEG 1 4 10 15 7%Total 1 36 192 229 100%
% Total 0% 16% 84% 100%
Bus TypePJM East Hub Definition

© PA Knowledge Limited 2014 6
Load buses dominate the composition of PJM Hub definitions
HubTotal Buses EHV GEN LOAD Total
AEP GEN HUB 39 100% 100%AEP-DAYTON HUB 1108 11% 89% 100%ATSI GEN HUB 64 100% 100%CHICAGO GEN HUB 131 100% 100%CHICAGO HUB 190 5% 95% 100%DOMINION HUB 626 12% 88% 100%EASTERN HUB 216 0% 15% 84% 100%N ILLINOIS HUB 219 11% 89% 100%NEW JERSEY HUB 367 100% 100%OHIO HUB 761 4% 96% 100%WESTERN HUB 99 4% 27% 69% 100%
© PA Knowledge Limited 2014 7
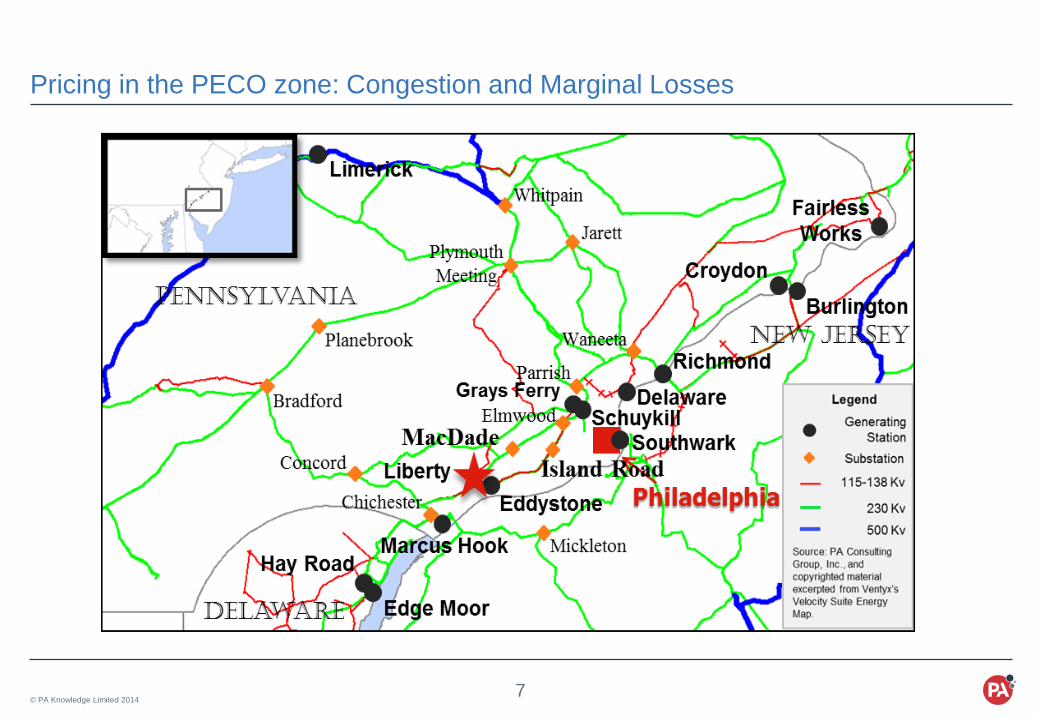
Pricing in the PECO zone: Congestion and Marginal Losses

© PA Knowledge Limited 2014 8
While average losses basis differentials can be larger than congestion basis differentials, variation in congestion basis differentials is an order of magnitude greater.
Liberty Basis Basis Component Year*Average Basis
($/MWh)Standard Deviation
Coefficient of Variation
2009 (1.48) 1.69 1142010 (2.56) 5.74 2242011 (1.66) 2.82 1702012 (2.98) 4.69 1572009 (1.25) 0.80 642010 (1.60) 1.22 762011 (1.52) 1.17 772012 (1.46) 0.74 512009 (0.23) 1.26 5442010 (0.96) 5.15 5382011 (0.14) 2.48 1,7822012 (1.53) 4.46 2932009 (0.31) 0.34 1102010 (0.90) 5.52 6162011 (0.36) 2.21 6112012 (0.22) 0.25 1122009 (0.37) 0.28 752010 (0.45) 0.43 952011 (0.31) 0.40 1272012 (0.24) 0.12 512009 0.06 0.23 4102010 (0.44) 5.32 1,1982011 (0.05) 2.09 4,1922012 0.02 0.22 1,321
* 2012 values for the period through 3/31/2012
Variation in Basis Differentials
Libe
rty
Basi
s to
PEC
O Z
one
Total LMP Basis
Loss Basis
Congestion Basis
Total LMP Basis
Loss Basis
Congestion Basis
Libe
rty
Basi
s to
PJM
Eas
t Hub
Uni
t Bas
is to
PEC
O Z
one
Uni
t Bas
is to
PJM
Eas
t Hub

© PA Knowledge Limited 2014 9
Shift factors represent the change in power flow on a line when an injection is made at one bus and a corresponding change in withdrawal is made at the reference bus
Shift factors are calculated for a specific system topology. Shift factors change when the topology changes or line impedance changes. Shift factors do not change if the injection/withdrawal amount increases for any set of locations.
Source: CAISO

© PA Knowledge Limited 2014 10
Generators that drive flows on the Eddystone-Island Road Constraint
Unit(s) S.F. Description Eddystone 3 .252 380 MW oil/gas-fired steam (Exelon Generating) Eddystone CT .250 (4) 18-20 MW oil-fired CTs (Exelon Generating) Eddystone 4 .247 380 MW oil/gas-fired steam (Exelon Generating) Liberty CC .231 540 MW gas-fired CC (Equipower Resources) Marcus Hook .139 808 MW gas-fired CC (NextEra Energy) Hay Road 4 .116 182 MW gas-fired CT (Calpine) Edge Moor 5 .116 445 MW oil/gas-fired steam (Calpine) Hay Road 1, 3 .088 (2) 121 MW gas-fired CT (Calpine) Edge Moor 3, 4 .088 86 MW and 174 MW gas-fired steam (Calpine)
Units that Increase Congestion on the Eddystone–Island Road Constraint
Unit(s) S.F. Description Southwark -.175 (4) 18 MW oil-fired CTs (Exelon Generation) Schuylkill CT -.170 (2) 18 MW oil-fired CTs (Exelon Generation) Grays Ferry Cogeneration -.167 150 MW gas-fired CC (Veolia Environnement S.A.) Schuylkill -.164 175 MW oil-fired steam (Exelon Generation) Delaware CT -.100 (4) 18 MW oil-fired CTs (Exelon Generating) Richmond -.058 (2) 65 MW oil-fired CTs (Exelon Generating) Fairless Works -.036 (2) 680 MW gas-fired CCs (Dominion) Croydon -.035 (8) 60 MW oil-fired CTs (Exelon Generating) Burlington GT -.035 (13) mostly 40-50 MW oil/gas-fired CTs (PSEG) Limerick 1 -.025 1190 MW nuclear (Exelon Generating) Limerick 2 -.018 1190 MW nuclear (Exelon Generating)
Units that offset Congestion on the Eddystone–Island Road Constraint

© PA Knowledge Limited 2014 11
Pricing across PJM reflects local and broader regional constraints
Western Hub
AEP – Dayton Hub
NI Hub
© PA Knowledge Limited 2014 12
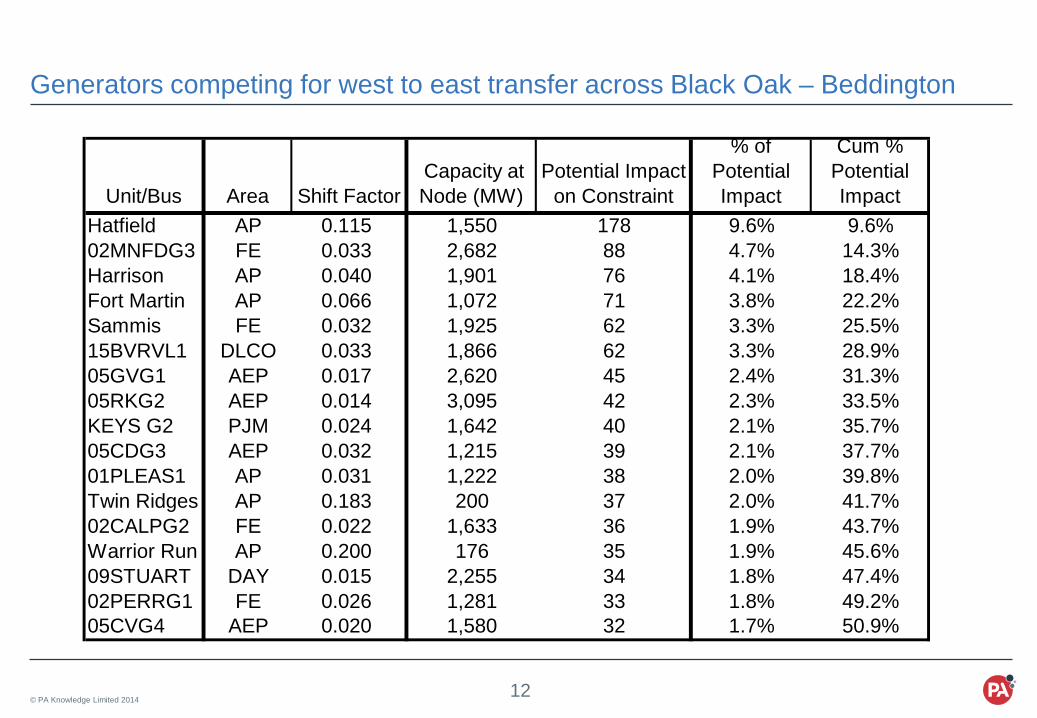
Generators competing for west to east transfer across Black Oak – Beddington
Unit/Bus Area Shift Factor Capacity at Node (MW)
Potential Impact on Constraint
% of Potential Impact
Cum % Potential Impact
Hatfield AP 0.115 1,550 178 9.6% 9.6%02MNFDG3 FE 0.033 2,682 88 4.7% 14.3%Harrison AP 0.040 1,901 76 4.1% 18.4%Fort Martin AP 0.066 1,072 71 3.8% 22.2%Sammis FE 0.032 1,925 62 3.3% 25.5%15BVRVL1 DLCO 0.033 1,866 62 3.3% 28.9%05GVG1 AEP 0.017 2,620 45 2.4% 31.3%05RKG2 AEP 0.014 3,095 42 2.3% 33.5%KEYS G2 PJM 0.024 1,642 40 2.1% 35.7%05CDG3 AEP 0.032 1,215 39 2.1% 37.7%01PLEAS1 AP 0.031 1,222 38 2.0% 39.8%Twin Ridges AP 0.183 200 37 2.0% 41.7%02CALPG2 FE 0.022 1,633 36 1.9% 43.7%Warrior Run AP 0.200 176 35 1.9% 45.6%09STUART DAY 0.015 2,255 34 1.8% 47.4%02PERRG1 FE 0.026 1,281 33 1.8% 49.2%05CVG4 AEP 0.020 1,580 32 1.7% 50.9%
© PA Knowledge Limited 2014 13
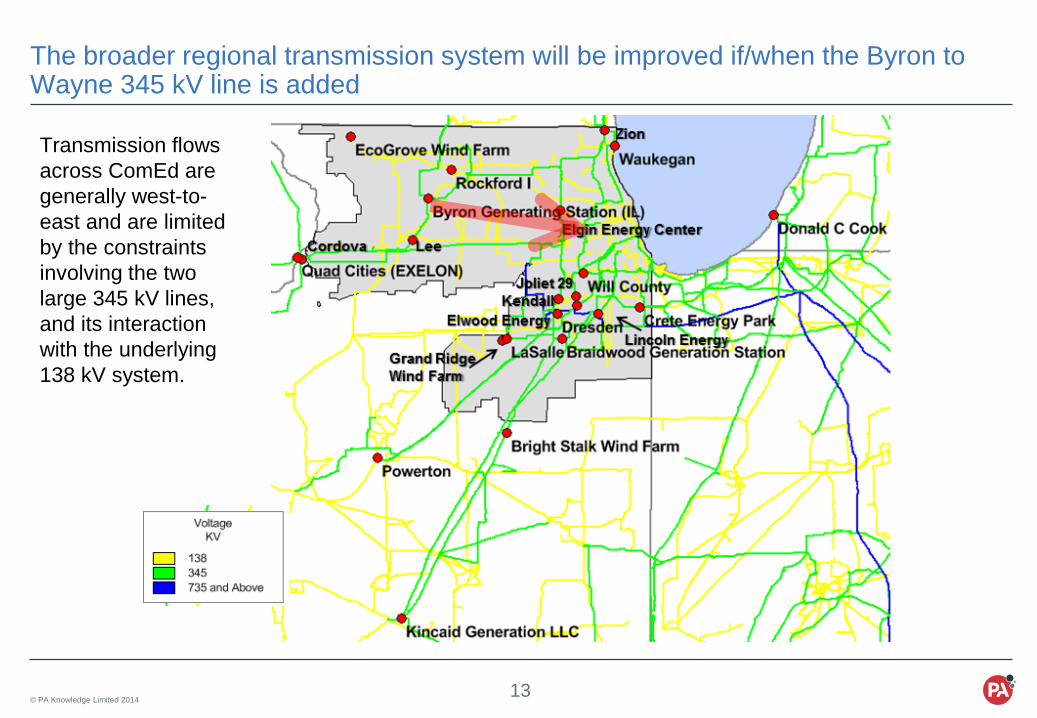
The broader regional transmission system will be improved if/when the Byron to Wayne 345 kV line is added
Transmission flows across ComEd are generally west-to-east and are limited by the constraints involving the two large 345 kV lines, and its interaction with the underlying 138 kV system.
© PA Knowledge Limited 2014 14
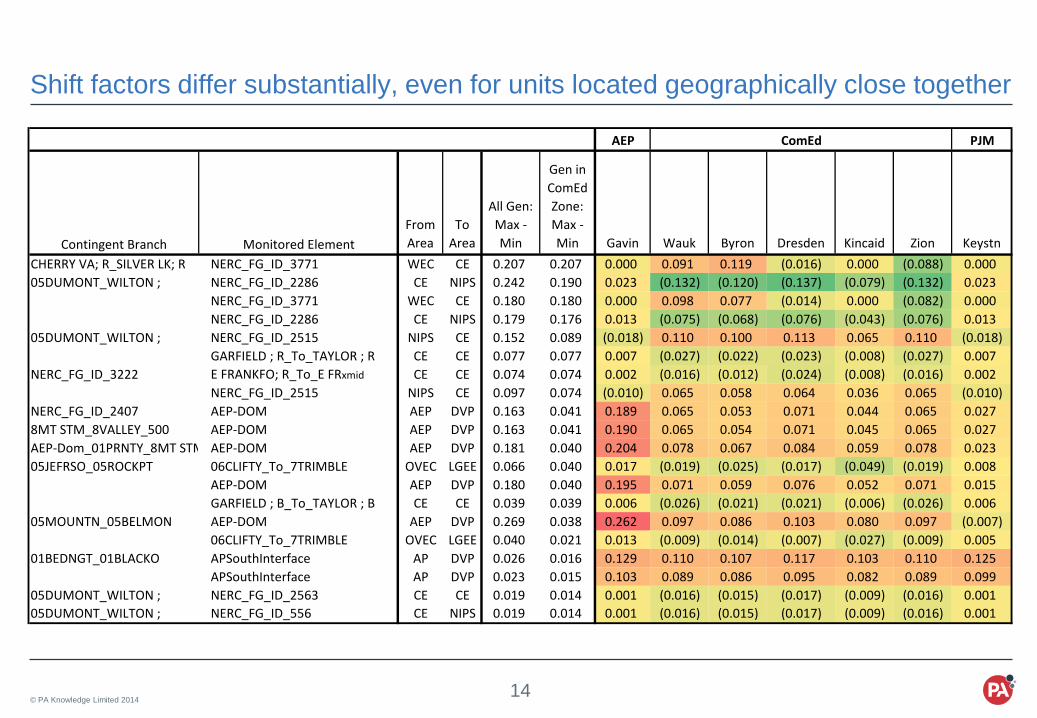
Shift factors differ substantially, even for units located geographically close together
AEP PJM
Contingent Branch Monitored ElementFrom Area
To Area
All Gen: Max - Min
Gen in ComEd Zone: Max - Min Gavin Wauk Byron Dresden Kincaid Zion Keystn
CHERRY VA; R_SILVER LK; R NERC_FG_ID_3771 WEC CE 0.207 0.207 0.000 0.091 0.119 (0.016) 0.000 (0.088) 0.00005DUMONT_WILTON ; NERC_FG_ID_2286 CE NIPS 0.242 0.190 0.023 (0.132) (0.120) (0.137) (0.079) (0.132) 0.023
NERC_FG_ID_3771 WEC CE 0.180 0.180 0.000 0.098 0.077 (0.014) 0.000 (0.082) 0.000NERC_FG_ID_2286 CE NIPS 0.179 0.176 0.013 (0.075) (0.068) (0.076) (0.043) (0.076) 0.013
05DUMONT_WILTON ; NERC_FG_ID_2515 NIPS CE 0.152 0.089 (0.018) 0.110 0.100 0.113 0.065 0.110 (0.018)GARFIELD ; R_To_TAYLOR ; R CE CE 0.077 0.077 0.007 (0.027) (0.022) (0.023) (0.008) (0.027) 0.007
NERC_FG_ID_3222 E FRANKFO; R_To_E FRxmid CE CE 0.074 0.074 0.002 (0.016) (0.012) (0.024) (0.008) (0.016) 0.002NERC_FG_ID_2515 NIPS CE 0.097 0.074 (0.010) 0.065 0.058 0.064 0.036 0.065 (0.010)
NERC_FG_ID_2407 AEP-DOM AEP DVP 0.163 0.041 0.189 0.065 0.053 0.071 0.044 0.065 0.0278MT STM_8VALLEY_500 AEP-DOM AEP DVP 0.163 0.041 0.190 0.065 0.054 0.071 0.045 0.065 0.027AEP-Dom_01PRNTY_8MT STM AEP-DOM AEP DVP 0.181 0.040 0.204 0.078 0.067 0.084 0.059 0.078 0.02305JEFRSO_05ROCKPT 06CLIFTY_To_7TRIMBLE OVEC LGEE 0.066 0.040 0.017 (0.019) (0.025) (0.017) (0.049) (0.019) 0.008
AEP-DOM AEP DVP 0.180 0.040 0.195 0.071 0.059 0.076 0.052 0.071 0.015GARFIELD ; B_To_TAYLOR ; B CE CE 0.039 0.039 0.006 (0.026) (0.021) (0.021) (0.006) (0.026) 0.006
05MOUNTN_05BELMON AEP-DOM AEP DVP 0.269 0.038 0.262 0.097 0.086 0.103 0.080 0.097 (0.007)06CLIFTY_To_7TRIMBLE OVEC LGEE 0.040 0.021 0.013 (0.009) (0.014) (0.007) (0.027) (0.009) 0.005
01BEDNGT_01BLACKO APSouthInterface AP DVP 0.026 0.016 0.129 0.110 0.107 0.117 0.103 0.110 0.125APSouthInterface AP DVP 0.023 0.015 0.103 0.089 0.086 0.095 0.082 0.089 0.099
05DUMONT_WILTON ; NERC_FG_ID_2563 CE CE 0.019 0.014 0.001 (0.016) (0.015) (0.017) (0.009) (0.016) 0.00105DUMONT_WILTON ; NERC_FG_ID_556 CE NIPS 0.019 0.014 0.001 (0.016) (0.015) (0.017) (0.009) (0.016) 0.001
ComEd
© PA Knowledge Limited 2014 15
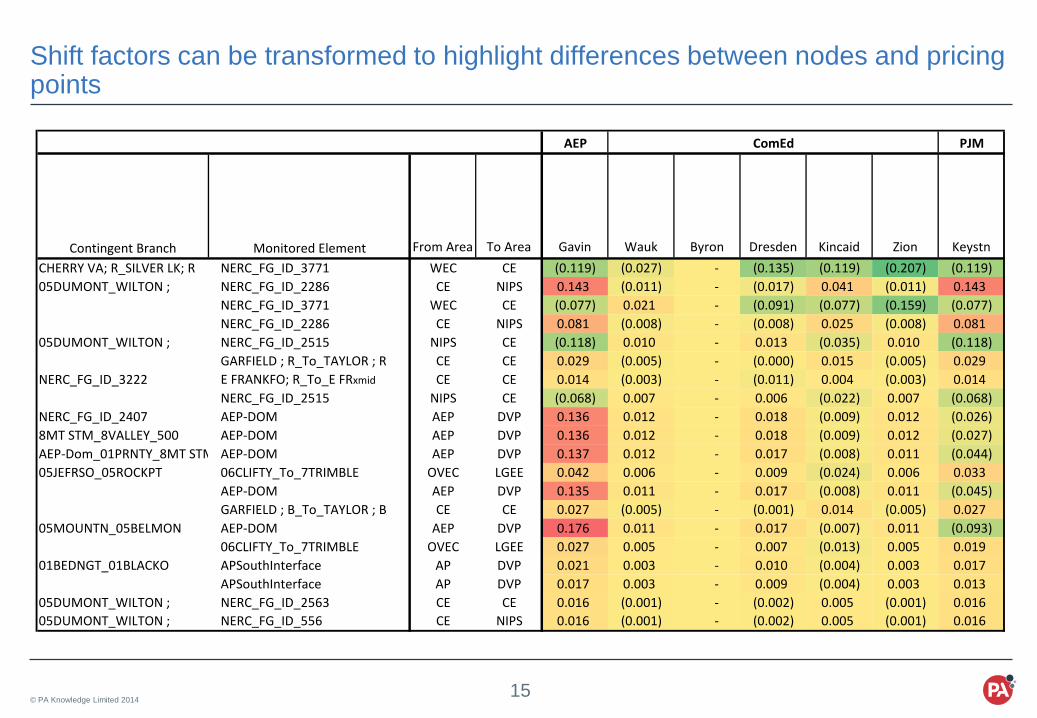
Shift factors can be transformed to highlight differences between nodes and pricing points
AEP PJM
Contingent Branch Monitored Element From Area To Area Gavin Wauk Byron Dresden Kincaid Zion KeystnCHERRY VA; R_SILVER LK; R NERC_FG_ID_3771 WEC CE (0.119) (0.027) - (0.135) (0.119) (0.207) (0.119)05DUMONT_WILTON ; NERC_FG_ID_2286 CE NIPS 0.143 (0.011) - (0.017) 0.041 (0.011) 0.143
NERC_FG_ID_3771 WEC CE (0.077) 0.021 - (0.091) (0.077) (0.159) (0.077)NERC_FG_ID_2286 CE NIPS 0.081 (0.008) - (0.008) 0.025 (0.008) 0.081
05DUMONT_WILTON ; NERC_FG_ID_2515 NIPS CE (0.118) 0.010 - 0.013 (0.035) 0.010 (0.118)GARFIELD ; R_To_TAYLOR ; R CE CE 0.029 (0.005) - (0.000) 0.015 (0.005) 0.029
NERC_FG_ID_3222 E FRANKFO; R_To_E FRxmid CE CE 0.014 (0.003) - (0.011) 0.004 (0.003) 0.014NERC_FG_ID_2515 NIPS CE (0.068) 0.007 - 0.006 (0.022) 0.007 (0.068)
NERC_FG_ID_2407 AEP-DOM AEP DVP 0.136 0.012 - 0.018 (0.009) 0.012 (0.026)8MT STM_8VALLEY_500 AEP-DOM AEP DVP 0.136 0.012 - 0.018 (0.009) 0.012 (0.027)AEP-Dom_01PRNTY_8MT STM AEP-DOM AEP DVP 0.137 0.012 - 0.017 (0.008) 0.011 (0.044)05JEFRSO_05ROCKPT 06CLIFTY_To_7TRIMBLE OVEC LGEE 0.042 0.006 - 0.009 (0.024) 0.006 0.033
AEP-DOM AEP DVP 0.135 0.011 - 0.017 (0.008) 0.011 (0.045)GARFIELD ; B_To_TAYLOR ; B CE CE 0.027 (0.005) - (0.001) 0.014 (0.005) 0.027
05MOUNTN_05BELMON AEP-DOM AEP DVP 0.176 0.011 - 0.017 (0.007) 0.011 (0.093)06CLIFTY_To_7TRIMBLE OVEC LGEE 0.027 0.005 - 0.007 (0.013) 0.005 0.019
01BEDNGT_01BLACKO APSouthInterface AP DVP 0.021 0.003 - 0.010 (0.004) 0.003 0.017APSouthInterface AP DVP 0.017 0.003 - 0.009 (0.004) 0.003 0.013
05DUMONT_WILTON ; NERC_FG_ID_2563 CE CE 0.016 (0.001) - (0.002) 0.005 (0.001) 0.01605DUMONT_WILTON ; NERC_FG_ID_556 CE NIPS 0.016 (0.001) - (0.002) 0.005 (0.001) 0.016
ComEd
© PA Knowledge Limited 2014 16
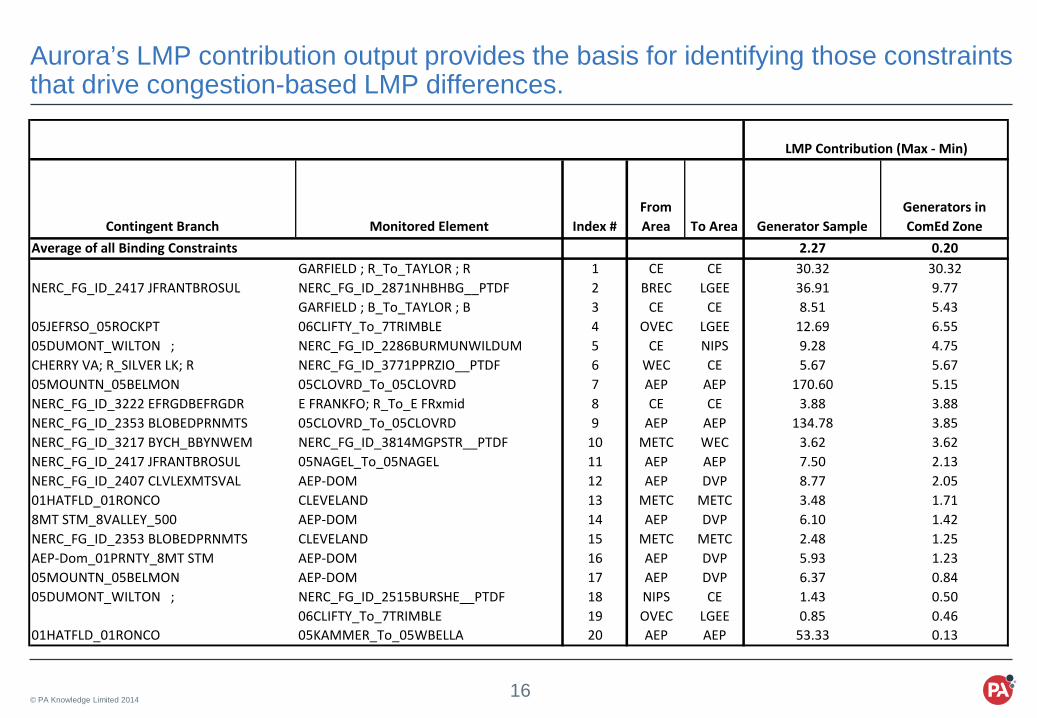
Aurora’s LMP contribution output provides the basis for identifying those constraints that drive congestion-based LMP differences.
Contingent Branch Monitored Element Index #From Area To Area Generator Sample
Generators in ComEd Zone
Average of all Binding Constraints 2.27 0.20GARFIELD ; R_To_TAYLOR ; R 1 CE CE 30.32 30.32
NERC_FG_ID_2417 JFRANTBROSUL NERC_FG_ID_2871NHBHBG__PTDF 2 BREC LGEE 36.91 9.77GARFIELD ; B_To_TAYLOR ; B 3 CE CE 8.51 5.43
05JEFRSO_05ROCKPT 06CLIFTY_To_7TRIMBLE 4 OVEC LGEE 12.69 6.5505DUMONT_WILTON ; NERC_FG_ID_2286BURMUNWILDUM 5 CE NIPS 9.28 4.75CHERRY VA; R_SILVER LK; R NERC_FG_ID_3771PPRZIO__PTDF 6 WEC CE 5.67 5.6705MOUNTN_05BELMON 05CLOVRD_To_05CLOVRD 7 AEP AEP 170.60 5.15NERC_FG_ID_3222 EFRGDBEFRGDR E FRANKFO; R_To_E FRxmid 8 CE CE 3.88 3.88NERC_FG_ID_2353 BLOBEDPRNMTS 05CLOVRD_To_05CLOVRD 9 AEP AEP 134.78 3.85NERC_FG_ID_3217 BYCH_BBYNWEM NERC_FG_ID_3814MGPSTR__PTDF 10 METC WEC 3.62 3.62NERC_FG_ID_2417 JFRANTBROSUL 05NAGEL_To_05NAGEL 11 AEP AEP 7.50 2.13NERC_FG_ID_2407 CLVLEXMTSVAL AEP-DOM 12 AEP DVP 8.77 2.0501HATFLD_01RONCO CLEVELAND 13 METC METC 3.48 1.718MT STM_8VALLEY_500 AEP-DOM 14 AEP DVP 6.10 1.42NERC_FG_ID_2353 BLOBEDPRNMTS CLEVELAND 15 METC METC 2.48 1.25AEP-Dom_01PRNTY_8MT STM AEP-DOM 16 AEP DVP 5.93 1.2305MOUNTN_05BELMON AEP-DOM 17 AEP DVP 6.37 0.8405DUMONT_WILTON ; NERC_FG_ID_2515BURSHE__PTDF 18 NIPS CE 1.43 0.50
06CLIFTY_To_7TRIMBLE 19 OVEC LGEE 0.85 0.4601HATFLD_01RONCO 05KAMMER_To_05WBELLA 20 AEP AEP 53.33 0.13
LMP Contribution (Max - Min)
© PA Knowledge Limited 2014 17
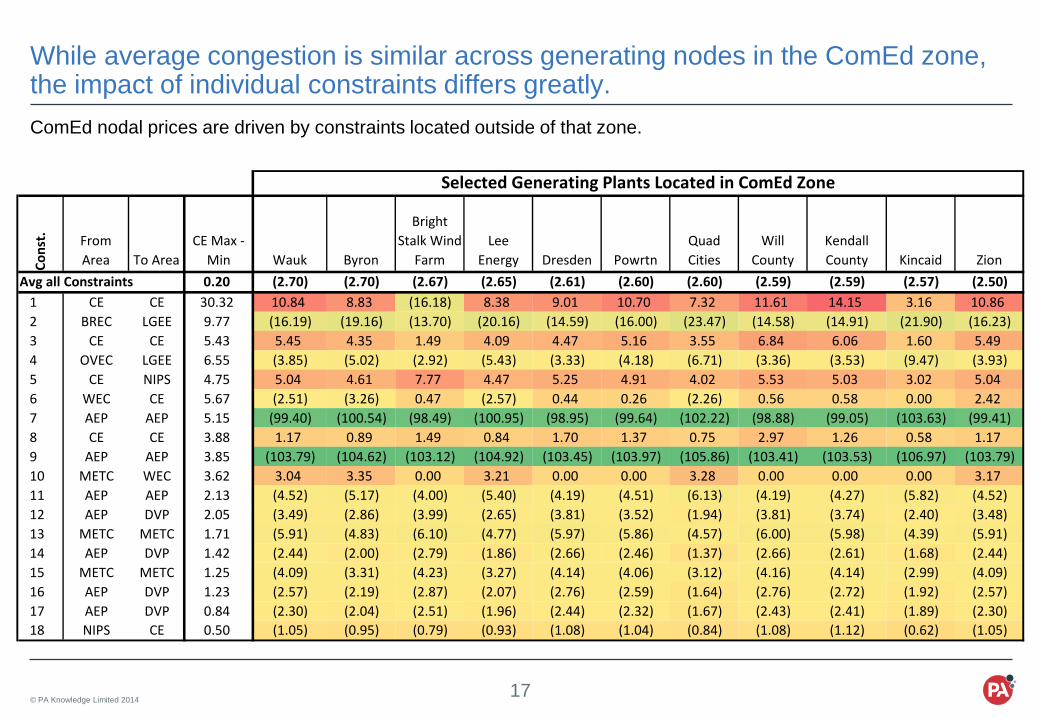
While average congestion is similar across generating nodes in the ComEd zone, the impact of individual constraints differs greatly. ComEd nodal prices are driven by constraints located outside of that zone.
Cons
t. From Area To Area
CE Max - Min Wauk Byron
Bright Stalk Wind
FarmLee
Energy Dresden PowrtnQuad Cities
Will County
Kendall County Kincaid Zion
Avg all Constraints 0.20 (2.70) (2.70) (2.67) (2.65) (2.61) (2.60) (2.60) (2.59) (2.59) (2.57) (2.50)1 CE CE 30.32 10.84 8.83 (16.18) 8.38 9.01 10.70 7.32 11.61 14.15 3.16 10.862 BREC LGEE 9.77 (16.19) (19.16) (13.70) (20.16) (14.59) (16.00) (23.47) (14.58) (14.91) (21.90) (16.23)3 CE CE 5.43 5.45 4.35 1.49 4.09 4.47 5.16 3.55 6.84 6.06 1.60 5.494 OVEC LGEE 6.55 (3.85) (5.02) (2.92) (5.43) (3.33) (4.18) (6.71) (3.36) (3.53) (9.47) (3.93)5 CE NIPS 4.75 5.04 4.61 7.77 4.47 5.25 4.91 4.02 5.53 5.03 3.02 5.046 WEC CE 5.67 (2.51) (3.26) 0.47 (2.57) 0.44 0.26 (2.26) 0.56 0.58 0.00 2.427 AEP AEP 5.15 (99.40) (100.54) (98.49) (100.95) (98.95) (99.64) (102.22) (98.88) (99.05) (103.63) (99.41)8 CE CE 3.88 1.17 0.89 1.49 0.84 1.70 1.37 0.75 2.97 1.26 0.58 1.179 AEP AEP 3.85 (103.79) (104.62) (103.12) (104.92) (103.45) (103.97) (105.86) (103.41) (103.53) (106.97) (103.79)10 METC WEC 3.62 3.04 3.35 0.00 3.21 0.00 0.00 3.28 0.00 0.00 0.00 3.1711 AEP AEP 2.13 (4.52) (5.17) (4.00) (5.40) (4.19) (4.51) (6.13) (4.19) (4.27) (5.82) (4.52)12 AEP DVP 2.05 (3.49) (2.86) (3.99) (2.65) (3.81) (3.52) (1.94) (3.81) (3.74) (2.40) (3.48)13 METC METC 1.71 (5.91) (4.83) (6.10) (4.77) (5.97) (5.86) (4.57) (6.00) (5.98) (4.39) (5.91)14 AEP DVP 1.42 (2.44) (2.00) (2.79) (1.86) (2.66) (2.46) (1.37) (2.66) (2.61) (1.68) (2.44)15 METC METC 1.25 (4.09) (3.31) (4.23) (3.27) (4.14) (4.06) (3.12) (4.16) (4.14) (2.99) (4.09)16 AEP DVP 1.23 (2.57) (2.19) (2.87) (2.07) (2.76) (2.59) (1.64) (2.76) (2.72) (1.92) (2.57)17 AEP DVP 0.84 (2.30) (2.04) (2.51) (1.96) (2.44) (2.32) (1.67) (2.43) (2.41) (1.89) (2.30)18 NIPS CE 0.50 (1.05) (0.95) (0.79) (0.93) (1.08) (1.04) (0.84) (1.08) (1.12) (0.62) (1.05)
Selected Generating Plants Located in ComEd Zone

© PA Knowledge Limited 2014 18
Congestion contribution can be transformed to highlight differences among nodes and pricing points
Cons
t. From Area To Area
CE Max - Min Wauk Byron
Bright Stalk Wind
FarmLee
Energy Dresden PowrtnQuad Cities
Will County
Kendall County Kincaid Zion
Avg all Constraints 0.20 (0.01) - 0.03 0.04 0.08 0.10 0.10 0.10 0.10 0.12 0.191 CE CE 30.32 2.01 - (25.01) (0.46) 0.17 1.87 (1.51) 2.77 5.31 (5.67) 2.032 BREC LGEE 9.77 2.97 - 5.46 (1.00) 4.57 3.16 (4.31) 4.59 4.25 (2.74) 2.933 CE CE 5.43 1.10 - (2.87) (0.26) 0.11 0.80 (0.81) 2.48 1.71 (2.75) 1.144 OVEC LGEE 6.55 1.17 - 2.10 (0.41) 1.69 0.84 (1.68) 1.66 1.49 (4.45) 1.105 CE NIPS 4.75 0.44 - 3.17 (0.14) 0.65 0.31 (0.59) 0.92 0.42 (1.59) 0.436 WEC CE 5.67 0.75 - 3.73 0.69 3.70 3.51 1.00 3.82 3.84 3.26 5.677 AEP AEP 5.15 1.14 - 2.05 (0.41) 1.59 0.90 (1.68) 1.66 1.49 (3.09) 1.138 CE CE 3.88 0.28 - 0.60 (0.05) 0.81 0.48 (0.14) 2.08 0.37 (0.31) 0.289 AEP AEP 3.85 0.84 - 1.51 (0.30) 1.17 0.65 (1.23) 1.22 1.09 (2.34) 0.83
10 METC WEC 3.62 (0.32) - (3.35) (0.14) (3.35) (3.35) (0.08) (3.35) (3.35) (3.35) (0.18)11 AEP AEP 2.13 0.66 - 1.18 (0.22) 0.98 0.67 (0.95) 0.98 0.91 (0.64) 0.6512 AEP DVP 2.05 (0.63) - (1.13) 0.21 (0.95) (0.66) 0.92 (0.95) (0.88) 0.46 (0.62)13 METC METC 1.71 (1.08) - (1.27) 0.07 (1.13) (1.03) 0.26 (1.17) (1.14) 0.45 (1.08)14 AEP DVP 1.42 (0.44) - (0.78) 0.15 (0.66) (0.46) 0.63 (0.66) (0.61) 0.32 (0.43)15 METC METC 1.25 (0.78) - (0.92) 0.05 (0.82) (0.75) 0.20 (0.85) (0.83) 0.33 (0.78)16 AEP DVP 1.23 (0.38) - (0.68) 0.13 (0.57) (0.40) 0.55 (0.57) (0.53) 0.27 (0.37)17 AEP DVP 0.84 (0.26) - (0.47) 0.09 (0.39) (0.28) 0.38 (0.39) (0.36) 0.16 (0.26)18 NIPS CE 0.50 (0.09) - 0.17 0.03 (0.12) (0.08) 0.12 (0.13) (0.17) 0.33 (0.09)19 OVEC LGEE 0.46 0.10 - 0.18 (0.04) 0.15 0.08 (0.15) 0.15 0.14 (0.28) 0.1020 AEP DVP 0.23 0.05 - 0.09 (0.02) 0.07 0.04 (0.07) 0.07 0.07 (0.14) 0.05
Selected Generating Plants Located in ComEd Zone

© PA Knowledge Limited 2014 19
Transformation also makes it easier to identify constraints that drive broader interregional congestion
PJM 500 Penelec
Index #From Area To Area Gavin DC Cook Wauk Byron
Bright Stalk Wind Farm
Lee Energy Dresden Powrtn
Quad Cities
Will County
Kendall County Kincaid Zion Keystone
Average - 0.64 0.66 0.66 0.69 0.71 0.75 0.76 0.76 0.76 0.77 0.79 0.86 2.271 CE CE - -0.05 13.38 11.37 -13.64 10.92 11.55 13.24 9.86 14.15 16.69 5.70 13.40 0.002 BREC LGEE - -22.25 -29.63 -32.60 -27.14 -33.60 -28.02 -29.43 -36.91 -28.01 -28.34 -35.34 -29.66 -7.903 CE CE - 0.32 7.09 6.00 3.13 5.74 6.11 6.80 5.19 8.48 7.70 3.24 7.14 0.324 OVEC LGEE - -4.24 -7.07 -8.24 -6.14 -8.64 -6.55 -7.40 -9.92 -6.58 -6.74 -12.69 -7.14 -1.765 CE NIPS - -0.64 5.91 5.47 8.64 5.33 6.12 5.78 4.89 6.39 5.89 3.88 5.91 0.006 WEC CE - 0.02 -2.51 -3.26 0.47 -2.57 0.44 0.26 -2.26 0.56 0.58 0.00 2.42 0.007 AEP AEP - 36.29 31.14 30.00 32.06 29.60 31.60 30.90 28.33 31.66 31.49 26.91 31.14 170.608 CE CE - -0.29 1.32 1.04 1.64 0.99 1.85 1.52 0.90 3.12 1.42 0.73 1.32 0.009 AEP AEP - 12.03 8.25 7.41 8.92 7.11 8.58 8.06 6.18 8.63 8.50 5.07 8.24 134.78
10 METC WEC - 0.00 3.04 3.35 0.00 3.21 0.00 0.00 3.28 0.00 0.00 0.00 3.17 0.0011 AEP AEP - -2.26 -5.89 -6.54 -5.37 -6.77 -5.56 -5.88 -7.50 -5.56 -5.64 -7.19 -5.89 -0.8112 AEP DVP - 5.28 6.73 7.36 6.23 7.58 6.42 6.70 8.28 6.42 6.48 7.82 6.74 8.7713 METC METC - 1.78 -1.52 -0.44 -1.70 -0.37 -1.57 -1.47 -0.18 -1.61 -1.58 0.01 -1.52 1.0014 AEP DVP - 3.66 4.66 5.10 4.32 5.25 4.45 4.65 5.74 4.45 4.49 5.42 4.67 6.1015 METC METC - 1.21 -1.12 -0.34 -1.26 -0.30 -1.17 -1.09 -0.15 -1.20 -1.17 -0.02 -1.13 -0.4216 AEP DVP - 3.25 4.11 4.49 3.81 4.62 3.92 4.09 5.04 3.92 3.96 4.76 4.12 5.9317 AEP DVP - 3.34 3.90 4.16 3.69 4.25 3.77 3.88 4.54 3.77 3.80 4.32 3.90 6.3718 NIPS CE - 0.14 -1.22 -1.13 -0.96 -1.10 -1.25 -1.21 -1.01 -1.25 -1.30 -0.79 -1.22 0.0019 OVEC LGEE - -0.28 -0.48 -0.58 -0.40 -0.61 -0.43 -0.50 -0.73 -0.43 -0.44 -0.85 -0.48 -0.1720 AEP AEP - 5.18 4.74 4.78 4.72 4.79 4.70 4.73 4.83 4.72 4.72 4.73 4.75 53.33
AEP ComEd