noember global insight - rbc dominion securities · global insight commodities oil “cost ......
TRANSCRIPT

P E R S P E C T I V E S F R O M T H E G L O B A L P O R T F O L I O A D V I S O R Y C O M M I T T E E
NOVEMBER 2015
I N T H I S I S S U E > >
FOCUS ARTICLEEMERGING LEADERSHIP
For Important and Required Non-U.S. Analyst Disclosures, see page 22.
R B C W E A L T H M A N A G E M E N T
GLOBAL INSIGHT
COMMODITIESOIL “COST CRUNCH”
GLOBAL FIXED INCOMELOWER FOR (NOT MUCH) LONGER?
GLOBAL EQUITYRALLY
The Power of TransformaTionOpportunities are lighting up in the utilities sector as fears of rising interest rates have shrouded innovative secular shifts.
Janelle nelson | Page 4

2 GLOBAL INSIGHT | November 2015
Global InsightNovember 2015
All values in U.S. dollars and priced as of October 30, 2015, market close, EST, unless otherwise noted.
Table of ConTenTs
4 The Power of TransformaTion
Investors should look past risks posed by the impending interest rate hike cycle and focus on the wave of innovation that is creating “21st century utilities.” We think the recent pullback offers an attractive entry point to plug into the earnings and dividend growth potential that looks to be accelerating.
7 emerging LeadershiP
Emerging market growth opportunities have crumbled this year, but India’s promise stands out. Pro-business initiatives, important reforms, and supportive monetary policies have the potential to accelerate the country’s economic growth.
12 gLobaL equiTy: raLLy All major equity markets reversed course and rallied on the heels of the summer correction. The economic expansion in the U.S. and other developed economies is intact, persuading us the secular bull will ultimately reassert itself.
15 gLobaL fixed income: Lower for (how much) Longer?A Federal Reserve interest rate hike in 2015 appears to be back on the table for the December policy meeting. But loose monetary policy remains the order of the day in Canada and Europe as economic conditions there continue to underwhelm.
Inside the Markets
3 rbC’s invesTmenT sTanCe
12 Global equiTy
15 Global fixed inCome
17 CommodiTies
18 CurrenCies
19 Key foreCasTs
20 marKeT sCoreCard

3 GLOBAL INSIGHT | November 2015
Global Asset Class View
rbC’s invesTmenT sTanCe
Views Explanation (+/=/–) represents the Global Portfolio Advisory Committee’s (GPAC) view over a 12-month investment time horizon.
+ Positive implies the potential for better-than-average performance for the asset class or for the region relative to other asset classes or regions.
= In-line implies the potential for average performance for the asset class or for the region relative to other asset classes or regions.
– Negative implies the potential for below-average performance for the asset class or for the region relative to other asset classes or regions.
Global Asset Views
Source - RBC Wealth Management
Asset Class
View
— = +Equities
Fixed Income
See “Views Explanation” below for details
Expect below average
performance
Expect above average performance
equities – average Performance =�� True to form during bull markets, the recent equity correction was swift,
and most markets rebounded nearly as fast. While developed markets could
consolidate their recent gains over the near term, we remain constructive about
the intermediate- and long-term prospects.
�� We don’t see a major downturn on the horizon for the global economy. Growth
should shuffle along led by the U.S., most developed economies, and a handful
of better-positioned emerging economies. China’s economy will likely slow
further. However, monetary and fiscal stimulus, combined with services sector
growth, should help it avoid a hard landing.
�� Valuations are below or near average for most markets, and earnings growth
should persist in Europe and pick up moderately in the U.S. in 2016.
fixed income – Below-average Performance –�� Global fixed income markets are laser-focused on monetary policy and the
potential divergence that could soon develop with the Federal Reserve headed
toward raising interest rates and the European Central Bank, among others,
likely easing further. Prospects for a Fed rate hike in December increased
following the slightly hawkish policy statement from the central bank’s recent
meeting.
�� Regardless of when the first hike comes, we continue to believe the Fed is
aiming to merely gradually wind down extraordinary monetary policies
established during the financial crisis and normalize interest rates above the
0% level rather than tighten monetary conditions outright. We expect the Fed
Funds rate to rise slowly and eventually crest at a lower level than in previous
cycles.

4 GLOBAL INSIGHT | November 2015
Focus Article
The Power of TransformaTion
Fear of rising interest rates has given investors pause on electric utilities. While rates impact the group, we believe investors may be missing the bigger picture. Structural shifts underway in the industry position U.S. electric utilities for more durable dividend and earnings growth than in recent decades. That “pause” may, in fact, represent opportunity.
where were You when the lights went out? On August 14, 2003, a 3,500 megawatt power surge created a domino effect, causing the second-widest blackout in North American history. More than 55 million people from New York to Toronto to Detroit lost power for almost two days. Police and public workers were on high alert, but most residents reacted with surprising calm. Municipalities and electric utilities used the episode as a call to arms to address aging and inefficient infrastructure.
Change is the result of hard work, debate, and compromise. Infrastructure has been rebuilt and upgraded. More efficient power generation has been integrated into the power base. More recently, unprofitable capacity power auctions have been restructured to provide proper incentives. Finally, technological innovation is allowing renewables to become increasingly economic compared to traditional hydrocarbon sources.
We believe equity investors will benefit from these secular shifts. Utility revenue growth improvement should support stronger earnings and dividend growth than has been evident over the past 10–15 years.
growth Potential charging uP
As recently as two years ago, regulated electric utilities traded at a 35% premium to the S&P 500, according to RBC Capital Markets. Today they trade at a 2.6% premium
Janelle nelson Minneapolis, United States [email protected]
Regulated Utilities Hitting the Sweet Spot of Earnings & Dividend Growth
Source - Company reports, RBC Capital Markets estimates. Data is based on a weighted average of large-cap U.S.-based regulated electric utilities.
40%
45%
50%
55%
60%
65%
70%
75%
80%
$1.00
$1.50
$2.00
$2.50
$3.00
$3.50
$4.00
$4.50
2006 2008 2010 2012 2014 2016E
Dividend Payout Ratio
Earn
ings
and
Div
iden
d Pe
r Sha
re
Earnings Per Share Dividend Per Share Dividend Payout Ratio
Stronger EPS growth combined with a return to normalized dividend payout ratios could result in faster dividend growth trends.

5 GLOBAL INSIGHT | November 2015
The Power of Transformation
after a third-quarter rally. Investor preference for growth stocks and the fear of rising interest rates have driven the underperformance. But these issues have opened a window of opportunity for investors seeking above-average return potential with below-market risk.
We believe investors may miss key trends that support an improved growth outlook. Stronger utility asset base growth combined with sustainable return on equity (ROE) means stronger revenue growth. With good cost controls and management of that asset base, RBC Capital Markets sees 4%–6% EPS growth that could accelerate to 5%–7% should current trends persist. In addition, the sector has been less sensitive to moves in interest rates than in past cycles (see chart).
We also believe dividends, which are already twice that of the broader market, could grow more quickly. The percentage of earnings paid to investors in the form of a dividend is at 63% versus the 35-year average of 74%, leaving room to accelerate dividend growth.
Thus, we view the opportunity as twofold. First, we see potential for capital appreciation because the group is trading below what we view as “fair value,” due to better growth in assets and stable ROEs. Second, dividend growth could accelerate, rising to an average of 4%–4.5% from 3%–3.5%.
While utility growth may not be as high as other sectors (e.g., technology or biotechnology) it tends to be lower risk and more durable. The utilities sector is considered less risky than the market, carrying a “beta” of one-half to two-thirds that of the S&P 500.
Debunking the Myth … Utilities Not Just Bond Equivalents Anymore
Source - ThomsonReuters, RBC Capital Markets
1
2
3
4
5
6
7
8
9
Dec 1990 Dec 1994 Dec 1998 Dec 2002 Dec 2006 Dec 2010 Dec 2014
Yiel
d (%
)
UTY Proxy Dividend
10-Year Treasury Bond
Fast and more durable growth than in past periods has made utilities less sensitive to interest rates.
Source - Edison Electric Institute
How the System Works
6 GLOBAL INSIGHT | November 2015
The Power of Transformation
more imPortantlY … how do utilities make moneY?Regional public utility commissions (PUCs) have regulatory oversight for utility operations. This includes investment and investor return requests made by the utility. Utilities make money based on approved customer rates. Serving as virtual monopolies in geographic regions, utilities invest in capital projects to support customers’ needs. A basic formula is:
Total Revenue Requirement = Expenses + (Rate Base x ROE)
The “rate base” is the firm’s capital assets minus accumulated depreciation. The allowed ROE helps ensure a reasonable level of profitability while expenses (fuel costs and support) are generally passed on to the consumer. Regulators set a utility’s allowed ROE at a level that allows the company to attract and service the capital it needs to maintain the operational integrity of its utility assets and to expand generating capacity as needed.
A “rate case” is submitted to the PUC to evaluate that the rate requested is reasonable and justified. Various regulatory mechanisms have been increasingly introduced to “tweak” this basic model, but in general, this formula applies. Rate cases in the current environment reflect significant increases in required capex, contributing to strong earnings growth potential.
Allowed ROEs are scrutinized by state PUCs. Despite a steady drop in long-term interest rates, ROEs have not declined as much as RBC Capital Markets expected. The primary drivers of this have been aging infrastructure and environmental mandates, which have necessitated a significant rise in rate case filings; spending hit $100B in 2014, up from $40B in 2005. RBC Capital Markets believes spending will moderate over the next few years to about $90B annually.
need for efficient and reliaBle infrastructure drives investment
Stringent state and federal environmental guidelines have forced the retirement of inefficient power generation. As recently as 2000, coal-fired power represented around 52% of total power generation. Today, it is closer to 39% and on trend to reach 34% by 2040, according to the Energy Information Administration. These trends, combined with government incentives, have also driven the integration of renewables into the power generation base.
Reduced carbon emissions could be the next catalyst favorable to renewables development. Hawaii passed a bill calling for 100% renewables by 2045. California’s Governor Jerry Brown recently signed into law a bill calling for 50% renewables by 2030. Most states have taken measured approaches to integrating renewables, mindful of unintended costs.
In conclusion, the lasting impact of the 2003 blackout was not stories about where you were, but the resolve that cranked the wheels of the utility industry to meet the demands of the 21st century. The recent interest rate fears provide investors with a window of opportunity to do well and do good.
The combination of defensiveness
and above-average yield has
made regulated electric utilities a steady partner in
individual investor portfolios.

7 GLOBAL INSIGHT | November 2015
Focus Article
emerGinG leadershiP
India has been a source of good news amid this year’s emerging market pain. Following years of false starts that failed to unlock India’s huge economic potential the election of Narendra Modi in 2014 and his subsequent reforms have put the country on a bold new path. Can India eventually don the mantle of emerging market leader?
The election of Prime Minister Narendra Modi in a landslide victory last year may have marked the beginning of an important new chapter for India. The Bharatiya Janata Party (BJP) won a majority in the lower house, a first in over 30 years. Modi is widely regarded as a solid, pro-business leader with an impressive track record.
A year later, encouraging signs are emerging. Economic growth appears to be accelerating when most other emerging economies are cooling, as the Modi government successfully advances its reform agenda. Meanwhile, lower oil prices have helped reduce inflation and India’s current account deficit.
This focus article looks at the key initiatives and reforms proposed so far. While Modi’s commitment to eliminate corruption and accelerate short-term growth is generally well appreciated, most of the benefits from proposed reforms will likely take years to materialize. India has the potential to lead emerging economies by generating strong, sustainable growth for years to come. But, there are risks to this story.
Background: oBvious Potential, But a few false starts India benefits from a very large, young, and entrepreneurial working-age population. GDP per capita is less than 25% of China’s, leaving plenty of room for catch-up. Yet over the past decade, the Indian economy has struggled to live up to this potential. The need for reform became increasingly evident as protectionism and bureaucracy held back growth.
India has experienced a fall in investments over the past few years. The lack of infrastructure has long presented a roadblock to stronger growth, yet many large-scale projects were cancelled as bureaucracy and corruption made permitting challenging.
The previous government introduced several worthwhile initiatives over the years, but rarely delivered as it faced several corruption scandals. Meanwhile, loose monetary policy from the Reserve Bank of India (RBI) combined with fiscal stimulus pushed inflation to uncomfortably high levels. The rupee fell precipitously, the Indian stock market retreated, foreign capital was withdrawn, and the country’s fiscal and current account deficits widened considerably.
introducing “modinomics”Modi’s election victory was attributed to two major factors:
�� Strong Desire for Change: The prior government, Indian National Congress (in an alliance with the United Progressive Alliance), was plagued by corruption and
farnaz shahed Toronto, Canada [email protected]
Jean-françois dion Toronto, Canada [email protected]

8 GLOBAL INSIGHT | November 2015
Emerging Leadership
failed to deliver on many of its promises. The broad popular support for Modi in a country characterized by considerable diversity in religious practices reflects widespread frustration with the previous regime and strong desire for change.
�� Modi’s Proven Track Record: Modi had been the chief minister of Gujarat, one of India’s 26 states. Under his leadership, Gujarat experienced significant improvements in infrastructure, a boost in foreign investment, industrial expansion, and GDP growth twice that of the national average.
a closer look at keY initiatives
Typically, when a country transitions from a low-income to middle-income economy, the industrial sector expands faster than the agricultural and services sectors. However, in India’s case, the industrials sector’s contribution to total GDP has been stagnant at about 15% for over three decades. Meanwhile, India’s relatively high education standards and the widespread use of English led to stronger growth in the services sector, which has contributed significantly to GDP growth. Employment growth, however, has lagged given the services sector’s lower labour intensity relative to the industrial sector. As the Indian economy continues to expand, the country will need to focus on the development of its industrial base in order to provide jobs for a fast-growing working-age population. Modi is pushing forward a number of initiatives to address the issue:
�� The “Make in India” Campaign: This campaign was launched with the goal of positioning India as a manufacturing hub. The Delhi-Mumbai Industrial Corridor (DMIC) is slated for development as a global manufacturing and investment destination. The goal is to increase manufacturing’s share of GDP to 25% from 15% by creating sustainable smart cities where manufacturing will be the key economic driver. This initiative should also have a positive ripple effect on the industrials, telecom, IT, retail, and health care sectors. The campaign looks to create 100 million new manufacturing jobs by 2022.
�� Simplification of Taxes for Foreign and Domestic Business Investments: The 2015 budget cut the corporate tax rate to 25% from 30% over four years while eliminating some more targeted incentives.
�� The “Pradhan Mantri Jan-Dhan Yojana” (Prime Minister’s People Money Scheme): Only 35% of India’s adult population held bank accounts at the end of 2013, while an even smaller percentage used banks for financial transactions on a regular basis. The
Manufacturing PMI: Liftoff
Source - RBC Dominion Securities, Bloomberg
Leading indicators remain supportive and indicative of the India growth story.
48
49
50
51
52
53
54
55
Oct 2012 Apr 2013 Oct 2013 Apr 2014 Oct 2014 Apr 2015

9 GLOBAL INSIGHT | November 2015
Emerging Leadership
The Indian government
committed $17B to the rollout of a
national optical fibre network
connecting 600 million people.
Jan-Dhan Yojana program has resulted in the opening of over 100 million new bank accounts so far. This, along with the national identity card campaign known as Adhaar launched by the earlier government, should prevent leakage of subsidies to ghost beneficiaries by allowing the dissemination of public subsidies only to those entitled to receive them.
�� Developing “Smart Cities”: Over the past decade, per-capita GDP grew four times faster in urban areas relative to rural India, where approximately 30% of the population still lives below the poverty line. As part of the smart cities initiative, 100 smart cities and satellite towns are expected to be built around existing cities over the next few decades, which should help accelerate rural to urban migration. For 2015, $1.2B in government funding has been allocated to this initiative, with a focus on completing the first three smart cities. They make extensive use of technology to avoid some of the problems residents of large cities often face due to poor planning and maintenance. The focus will be on transportation, IT, communication, infrastructure, health care, and education.
�� National Optical Fibre Network (NOFN): In 2011, the Indian government committed $17B to the rollout of a national optical fibre network and the digitization of 250,000 villages, designed to accelerate the socioeconomic development of rural areas by connecting 600 million people.
strong new leadershiP at the reserve Bank of india In September 2013, Raghuram Rajan became governor of the Reserve Bank of India (RBI). He was previously chief economic adviser to India’s ministry of finance and also chief economist at the International Monetary Fund (IMF) from 2003 to 2007. He has promoted sustainable growth by tackling high inflation and driving real interest rates into positive territory. Rajan announced a number of measures to reduce volatility, improve investor confidence, and increase investment inflows as soon as he was nominated and appears to have successfully restored credibility, controlled inflation, and stabilized the rupee.
inflationarY Pressure easing, recent rate cut should fuel growth A positive real deposit interest rate (the difference between rates paid on deposits and the rate of inflation) is generally a positive economic driver. However, because of high inflation rates, India in the past struggled with deeply negative real rates.
Indian Inflation
Source - RBC Dominion Securities, Bloomberg
-5%
0%
5%
10%
15%
2008 2009 2010 2011 2012 2013 2014 2015
Wholesale Price Index (y/y)Consumer Price Index (y/y)
India inflation has declined rapidly and appears well-contained.

10 GLOBAL INSIGHT | November 2015
Emerging Leadership
Interest Rate Differential Spread
Source - RBC Dominion Securities, Bloomberg
-4
-2
0
2
4
6
8
10
-4
-2
0
2
4
6
8
10
200
0
200
1
200
2
200
3
200
4
200
5
200
6
200
7
200
8
200
9
2010
2011
2012
2013
2014
Real Rates IndiaReal Rates USAReal Interest Rate Differential Spread
More recently, the key drivers of inflation—rural wage growth, government spending, and global commodity prices—have rapidly moved in the right direction allowing the emergence of positive real rates across the board. Real deposit rates have been positive since January 2014, and currently stand at about 3.5%.
Falling oil prices (oil accounts for one-third of India’s imports) helped contain inflation and allowed Rajan to cut repo rates by 125 basis points to 6.75%. Fuel subsidies for households and a large import bill mean that a decline in oil prices reduces the trade and fiscal deficits for the country. The decline in rates should help support domestic demand and GDP growth.
longer-term growth Potential
Indian GDP has grown at 7.6% per annum over the past decade. The new government’s focus on tackling infrastructure bottlenecks, accelerating urbanization, and invigorating the manufacturing sector could potentially push growth closer to double digits.
India’s population is comparable to China’s (1.25 billion vs. 1.35 billion), yet GDP per capita is only $1,500 compared to China’s $6,800. India’s demographics are particularly encouraging, as more than 50% of the country’s population is under the age of 25 and two-thirds is under 35. By 2020, the average age in India is expected to be 29 years compared to 37 for China (see below chart).
India’s Population
Source - RBC Dominion Securities, CIA World Factbook
-
50,000,000
100,000,000
150,000,000
200,000,000
250,000,000
300,000,000
0-14years
15-24 years
25-54years
55-64years
65 yearsand over
Male
Female
A positive interest rate differential spread buffers emerging market economies such as India from U.S. rate hikes.
India will soon surpass China as the most populous country in the world with the benefit of a relatively younger working-age population.

11 GLOBAL INSIGHT | November 2015
Emerging Leadership
India’s Sensex Index has rallied almost 30% over
the past two years.
keY risks
Political Stability: BJP is a one-man show and, while the Prime Minister has surrounded himself with individuals who helped him build Gujarat into a progressive state, quite a bit rests on Modi’s shoulders and on his ability to deliver. While BJP is in a fairly comfortable position now, as opposition parties appear to be floundering, their re-emergence over the next four years cannot be ruled out, in our view.
Rebound in Oil Prices: Low fuel prices have helped solve India’s inflation and deficit problems. A stronger-than-expected rebound in oil prices could represent a headwind.
U.S. Monetary Policy: All else equal, lower rates in the U.S. are better for capital flows into India. India’s aforementioned positive real rate of interest (currently about 3.5%) offers an attractive alternative in a world that is generally plagued by low rates. While the current level of real rates in India offers a buffer against U.S. rate hikes, capital flows to India could begin to slow should U.S. rates rise sharply in the coming years.
an investment storY with “legs”The stars may have aligned for India. The combination of a pro-business prime minister pushing for structural reform, an RBI governor keen on fostering pro-growth policies, and lower oil prices should help unleash some of the country’s enormous economic potential. In a fast-growing economy, there is a tendency to take greater risks and amass debt. However, at this juncture, we believe that the benefits of increased investment in the country outweigh the risks.
It may take some time for the proposed reforms to yield the expected acceleration in economic growth and, ultimately, stronger earnings growth for Indian companies. India’s Sensex Index has rallied almost 30% over the past two years, pushing valuation to just over 17 times consensus forward earnings. Valuations still seem reasonable given what we believe is a multiyear opportunity ahead, yet patience is likely to be required and the political situation should be monitored closely.
12 GLOBAL INSIGHT | November 2015
rally
All the major equity markets rallied off their distressed summer lows. The S&P 500 put in the most energetic performance, finishing October not far below its all-time high set in May. The commodity-heavy indexes—Canada’s TSX and the FTSE All-Share—produced the most anemic response, recovering less than 50% of the ground lost in the spring/summer swoon.
Our long-term outlook has not changed. The economic expansion in the U.S. and most other developed economies is intact and will remain so until credit conditions become much tighter than they are today. In our view, that lies some considerable time off, perhaps years. With earnings forecast to grow and stocks reasonably priced in relation to those earnings in the U.S. (attractively in most other markets), we expect the long-term uptrend in share prices, in place since the financial crisis lows of 2009, will reassert itself in the coming months.
However, for now, global equity markets remain in correction/consolidation mode. Tax-loss selling may be a factor in the final weeks of the year. That said, as 2016 progresses, we expect investors will have growing conviction that:
�� Some stability has returned to the energy complex, permitting a more-confident recalibration of earnings power and values in this important market segment;
�� Global growth prospects are improving as concerns about a possible hard landing for the Chinese economy diminish; and
�� The expansion in developed economies is sustainable and has further to run underpinned by constructive monetary policies.
Global Equity
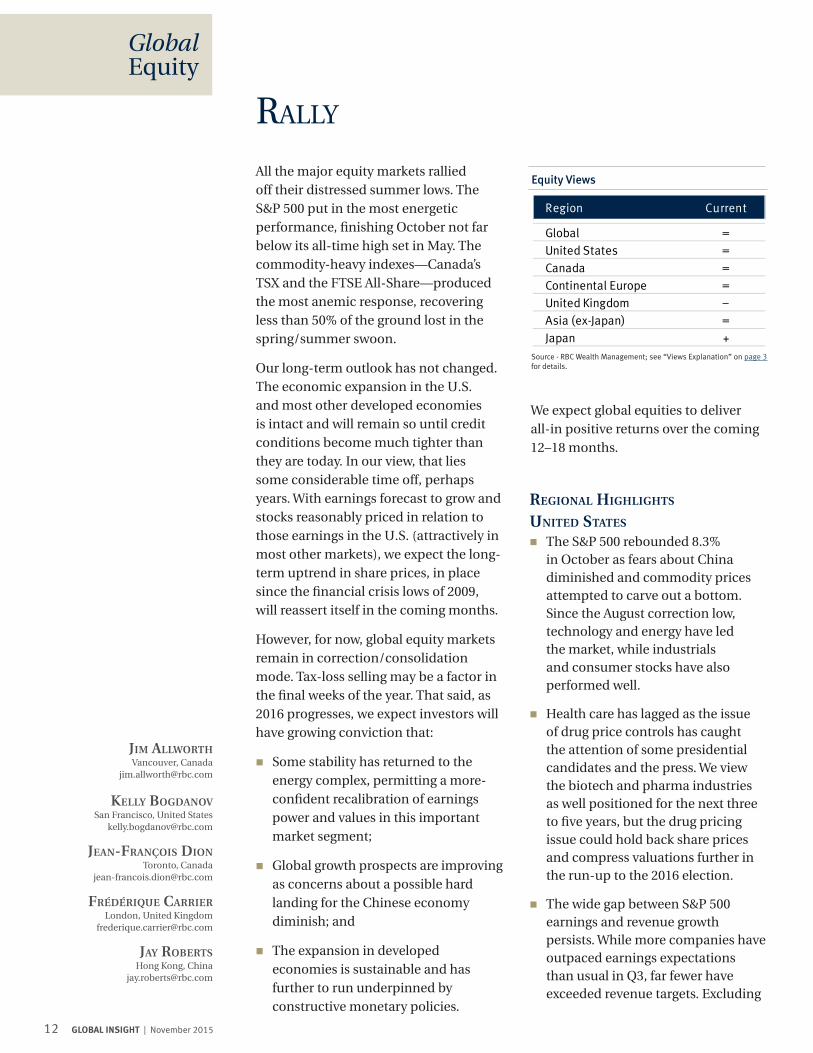
Source - RBC Wealth Management; see “Views Explanation” on page 3 for details.
Equity Views
Region Current
Global =United States =Canada =Continental Europe =United Kingdom –Asia (ex-Japan) =Japan +
Jim allworth Vancouver, Canada [email protected]
kellY Bogdanov San Francisco, United States [email protected]
Jean-françois dion Toronto, Canada [email protected]
frédérique carrier London, United Kingdom [email protected]
JaY roBerts Hong Kong, China [email protected]
We expect global equities to deliver all-in positive returns over the coming 12–18 months.
regional highlights
united states
�� The S&P 500 rebounded 8.3% in October as fears about China diminished and commodity prices attempted to carve out a bottom. Since the August correction low, technology and energy have led the market, while industrials and consumer stocks have also performed well.
�� Health care has lagged as the issue of drug price controls has caught the attention of some presidential candidates and the press. We view the biotech and pharma industries as well positioned for the next three to five years, but the drug pricing issue could hold back share prices and compress valuations further in the run-up to the 2016 election.
�� The wide gap between S&P 500 earnings and revenue growth persists. While more companies have outpaced earnings expectations than usual in Q3, far fewer have exceeded revenue targets. Excluding

13 GLOBAL INSIGHT | November 2015
Global Equity
October Performance of Major Equity Markets and Indexes
1.7%
4.5%
7.0%
7.8%
8.0%
8.3%
8.6%
9.7%
10.8%
12.3%
S&P/TSX
FTSE All-Share
MSCI EM
MSCI World
STOXX Europe
S&P 500
Hang Seng
Nikkei 225
Shanghai Comp
German DAX
Source - RBC Wealth Management, Bloomberg
Germany led the way followed by Asia. Canada’s TSX lagged due to heavy commodity exposure.
surprise Liberal Party majority in the federal election came with a pledge to double infrastructure investments over the next decade. The additional spending should create a tailwind for some infrastructure, construction, and engineering companies and may have a noticeable medium-term impact on economic growth in some regions, in our opinion.
�� While the energy sector enjoyed a small rally in October on the back of M&A activity and short covering, crude oil prices remain at depressed levels on concern over persistent oversupply. We see interesting long-term value in some of the well-capitalized, high-quality names, but advocate a nimble and prudent approach to investing in the sector.
�� Overall, we remain market weight with a negative bias for Canadian equities.
continental euroPe & u.k.�� With the start of earnings season,
we are looking for clues concerning the effect of China’s slowdown on earnings. With global growth expectations scaled back, forecasts in Europe (including the U.K.) have been trimmed recently, with expectations for the energy and materials sectors, in the U.K. in particular, continuing to decline. The consensus expectation is -3.9%
the much-beleaguered energy sector, which could see earnings tumble more than 60% y/y, S&P 500 earnings are on track to rise 6%–7% y/y in Q3—not so bad. However, ex-energy revenues may only grow by an anemic 1.5%–2%.
�� In this challenging environment, we continue to favor domestically oriented companies, growth stocks, and dividend growers.
canada
�� A muted growth outlook combined with a challenging environment for key commodities creates a difficult backdrop for Canadian equities.
�� Bank shares, up from recent lows, trade at valuations that seem undemanding relative to historical ranges. Concern over slowing loan growth, pressure on net interest margins, and the risk of increasing credit losses remain key challenges. So far, life insurance companies have successfully navigated the recent turbulence in equity and credit markets. We continue to recommend a market weight position in Canadian financials, balancing attractive valuations with a challenging near-term outlook.
�� We see opportunities in some of the high-quality names in the Canadian industrials sector. The

14 GLOBAL INSIGHT | November 2015
Global Equity
y/y growth for the quarter. We would expect domestic companies’ earnings to show more resilience. Earnings for 2016 are expected to bounce and be up 9% in Europe and 6% in the U.K., according to consensus estimates.
�� European Central Bank President Mario Draghi’s comments regarding the possibility of additional monetary stimulus in December helped weaken the euro. This weakness would be a welcome respite for exporters who have struggled with a strengthening euro since the spring. It could also boost investor sentiment in the short term. The flattening of the yield curve is of concern for financial companies, some of which could struggle to meet dividend expectations. We continue to like the pharmaceuticals sector, though we follow with interest the pricing debate in the U.S. We also see opportunities in the consumer discretionary and the telecoms sectors wherein regulatory fears are overdone, in our view.
asia
�� Asian equities continue to recover from the steep correction over the summer. The MSCI AC Asia Pacific ex-Japan Index has risen over 10% from its low in September and is down 3% in 2015. Price movements in mainland Chinese stocks have been relatively stable. Last month, the Shanghai Composite posted its first positive month since its dramatic correction.
�� We downgraded our outlook for Asia ex-Japan equities to neutral in September, largely due to events in Chinese markets. However, we continue to note that a number of Asian equity markets are trading at low valuations even after the recent rally.
�� Chinese authorities released a brief and general statement regarding the development of its 13th five-year plan. The government targets “medium-high growth” over the next five years with an aim to double GDP and per-capita income from the 2010 level by 2020. On October 23, Premier Li Keqiang said that China would need to achieve annual growth of 6.5% to reach the target. We expect a full version of the proposal to be published shortly and final approval in the spring.
�� The Bank of Japan (BoJ) left monetary policy unchanged in October. Under the current program, the BoJ is purchasing approximately ¥80T ($660B) in assets per year. Even so, RBC Capital Markets forecasts the yen to decline versus the dollar into 2016, noting that further monetary policy expansion is not a necessary condition for further weakness in the currency.
�� The Japanese authorities continue their battle to maintain inflation, which has been impacted by low commodity prices. The BoJ cut its forecasts for core inflation (which includes energy and excludes fresh food) for this fiscal year (ending in March) to 0.1% from 0.7%, and next fiscal year to 1.4% from 1.9%. The bank also pushed back its forecast for when its 2% inflation goal will be achieved. Excluding energy, the inflation data is more encouraging: prices rose by 0.9% in September (August: 0.8%).
�� Sustaining price increases is a critical part of our thesis for Japanese equities. We maintain our positive stance. The TOPIX Index is up 10.7% in 2015, but saw a significant correction in August and September, falling over 18%. It remains 8% below its August high.

15 GLOBAL INSIGHT | November 2015
lower for (noT muCh) lonGer?
An interest rate hike by the Federal Reserve in 2015 is still under consideration despite the central bank passing on the chance to raise rates at its October policy meeting. The Fed explicitly placed a potential rate hike at its December policy meeting on the table but indicated its decision will be data dependent. In addition to labor market data, the Fed will be looking for evidence that inflation, which remains stubbornly low, has
firmed closer to its target of 2% ahead of its policy meetings on December 15–16.
The Bank of Canada chose to hold its benchmark interest rate unchanged at 0.5% in October. Recent economic data has been uneven, suggesting that the benefit of two interest rate cuts earlier in the year continues to work through the economy. The preferred share market still appears attractive for long-term investors after capitulation selling sent the market to an all-time low on October 14. While a recent 10% bounce from these lows is likely to suffer a pullback of some magnitude given the rapidity of the move, valuations remain compelling.
European Central Bank (ECB) President Mario Draghi indicated in October that additional monetary stimulus could be forthcoming at the ECB’s December policy meeting. Draghi’s hint of further stimulus fuelled a rally in corporate bonds that is likely to continue should economic data confirm further policy support is warranted.
raJan Bansi
Toronto, Canada [email protected]
tom garretson Minneapolis, United States [email protected]
RBC Capital Markets, LLC
alana awad Toronto, Canada [email protected]
christoPher girdler London, United Kingdom [email protected]
Global Fixed Income
*1-yr base lending rate for working capital, PBoC Source - RBC Investment Strategy Committee, RBC Capital Markets, Global Portfolio Advisory Committee (GPAC), Consensus Economics
Central Bank Rate (%)
0.05
3.85
1.25
0.05
0.50
1.00
0.10
4.60*
0.50
0.05
0.50
0.25
Japan
China
U.K.
Eurozone
Canada
U.S.10/30/15
1-Year Out
Sovereign Yield Curves
Source - Bloomberg
0.0%
0.5%
1.0%
1.5%
2.0%
2.5%
3.0%
3.5%
1Yr 5Yr 9Yr 13Yr 17Yr 21Yr 25Yr 29Yr
U.S.
U.K.
Canada
regional highlights
united states
�� The Fed managed to get the markets back onside at the October FOMC meeting by stating explicitly that it is now assessing incoming economic data in order to make a decision on a potential rate hike “at its next meeting”—to take place in December. Despite the explicit guidance, the market is still only pricing 50/50 odds, with the burden back on better data to get the market closer to 100% by then. We think the bar for the Fed will simply be some stability in labor markets after the recent soft patch without a tightening of broad financial conditions that caused the pause in September.
�� Investment-grade corporate bond spreads ended October tighter for just the second time this year as attractive valuations, modest stabilization in oil prices, and a decline in broader market volatility eased investor concerns.
�� Corporate bonds have underperformed Treasuries for the last two quarters, but we see scope

16 GLOBAL INSIGHT | November 2015
Global Fixed Income
0.60
NA
2.75
1.00
1.75
2.75
0.30
3.02
1.90
0.50
1.55
2.15
Japan
China
U.K.
Eurozone*
Canada
U.S.
1o/30/2015
1-Year Out
10-Year Rate (%)
*Eurozone utilizes German bunds.Source - RBC Investment Strategy Committee, RBC Capital Markets, GPAC
for a return to outperformance as 2015 comes to a close with the Fed’s stamp of approval on the economy likely to be favorable for credit markets.
canada
�� On October 21, the Bank of Canada (BoC) held the overnight target rate at 0.50%. The BoC is expected to take its time adjusting policy as inflation, economic growth, and employment are improving, but at a slower pace than the BoC would like. Investors can use this to add duration with 5–8 year maturity bonds as interest rates are expected to remain lower for longer.
�� The Canadian preferred share market rallied roughly 10% after hitting its all-time low on October 14. Much of this move has been driven by technical factors such as inflows into ETFs and index rebalancing. An improvement in investors’ reaction to new issuance will likely be required for this rally to remain intact. Recently, new issues have not been well received by the market and have driven the prices of existing issues lower.
continental euroPe & u.k.�� Without formally announcing an
increase in its quantitative easing program last month, the ECB continues to provide dovish rhetoric and effectively left the door open for such an increase as well as potentially moving the deposit rate further into negative territory by year-end. We think expectations for further ECB intervention should be the catalyst to keep a lid on German yields and periphery spreads at or around the levels reached last month.
�� We believe the Gilt market is likely to continue trading in line with U.S. Treasuries. Domestic data continues to improve, but with U.K. inflation well below target, we do not believe the Bank of England will look to hike rates anytime soon.
�� Increased risk appetite has driven corporate bond spreads tighter on relatively little issuer news. The recent volatility of spreads is a concern, but we view market-wide moves as opportunities for those issuers in which fundamentals remain strong. Coming out of earnings season, we expect issuance to pick up, which could limit further tightening of spreads into year-end.
Source - RBC Wealth Management, Bloomberg, Barclays
Dissipating Volatility Drives U.S. Corporate Spreads Tighter
10
15
20
25
30
35
40
45
1.25%
1.30%
1.35%
1.40%
1.45%
1.50%
1.55%
1.60%
1.65%
1.70%
1.75%
May 2015 Jul 2015 Sep 2015
Market Volatility (VIX)
IG S
prea
ds
Investment-Grade Corporate Spreads
Volatility (VIX Index)
U.S. corporate spreads have tightened to the lowest levels since August as market volatility has moderated.

17 GLOBAL INSIGHT | November 2015
2015E 2016E
Oil (WTI $/bbl) 50.50 57.00
Natural Gas ($/mmBtu) 2.78 3.25
Gold ($/oz) 1,165 1,200
Copper ($/lb) 2.45 2.50
Corn ($/bu) 3.95* 4.10
Wheat ($/bu) 4.95* 5.10
*Q4 2015 forecastsSource - RBC Capital Markets forecasts (oil, natural gas, gold, and copper), Bloomberg consensus forecasts (corn and wheat)
Commodities
Commodity Forecasts After several years of rapid production growth, U.S. shale oil has become a key technology-driven disruptor of the global oil industry. With OPEC flooding the market, shale oil has become the new de facto global swing producer because of the relatively short investment period to first production, steep well declines, and its relatively high cost nature.
As a lower-for-longer scenario for oil plays out, the industry is, by necessity, becoming more efficient. The pressure on producer profit margins has been pushed down to the drilling and completions service providers, with 20%–30% reductions broadly experienced throughout the industry. As a result of this pressure, the break-even costs for U.S. shale oil have moved markedly lower, which is shifting an important component of the industry cost curve downward.
In the currently oversupplied market, oil prices have settled into a rough range of $40–$60/bbl this year. Prices in this range are just low enough to discourage continued shale oil investment in many regions because it is not economically viable. This outcome for prices is not unreasonable
Source - RBC Capital Markets
U.S. Shale Oil Break-Even Supply Cost Estimates
$0
$20
$40
$60
$80
$100
2014 2015 2014 2015 2014 2015 2014 2015
Eagle-Ford (Condensate) Williston (Bakken) Eagle Ford (Oil Window) Permian Basin
$62-$86
$60-$69
$69-$85
$57-$67
$65-$87
$56-$67$54-$78
$44-$53
Reflects variation in capital & operating cost inputs
so long as the prevailing outlook remains for the industry to be oversupplied for the foreseeable future.
In the longer term, the focus on efficiencies today may have a lasting effect even if the energy services market becomes more balanced or indeed tight. Furthermore, ongoing experimentation with the number of frac stages per well, fluid chemistry, quantity, and type of proppant (e.g., sand) is a secular trend towards lower cost production. The net impact of these two factors is a likely permanent shift lower in the marginal cost of production for a key source of global supply. Shifting the cost curve lower in this fashion is likely to reduce the equilibrium range of oil prices even during periods of more balanced future market conditions.
An approximate range of $75–$100/bbl prevailed for five years leading up to the recent price collapse. With the current view of marginal supply costs for this new swing producer, we could reasonably expect oil prices to remain in a more subdued range of $55–$75/bbl in balanced market conditions, with the potential for spikes on supply disruptions or military action and price lulls during periods of oversupply.
mark allen Toronto, Canada [email protected]
oil “CosT CrunCh”
18 GLOBAL INSIGHT | November 2015
alan roBinson Seattle, United States [email protected]
u.s. dollar �� Historically, on average, the dollar
has rallied ahead of the first Fed rate hike and has sold off thereafter. We remain positive on the dollar at least through this first hike, and note that the U.S. economy has less sensitivity to currency strength than its peers.
euro �� October’s European Central Bank
meeting underscored the urgency to fight eurozone deflation and to ensure the euro is kept from strengthening beyond its recent ranges.
�� We now expect a 20 basis point cut to the deposit rate to -0.4% in December, as well as an extension to the quantitative easing program. This should keep a lid on the euro over the near term.
canadian dollar �� As expected, the Bank of Canada
sounded a dovish tone at its October meeting. It pushed forward by a quarter its timeline for the economy to return to full potential, now forecast for the middle of 2017.
�� Consequently, we believe any interest rate hikes are off the table for the foreseeable future, and we expect the loonie to continue its weakening trend until energy prices rebound, possibly in 2016.
British Pound �� We remain bullish on sterling given
the robust labor market and overall economy in the U.K. This appears to be a consensus view and, as such, the pound has struggled during periods of global risk-off behavior. Concerns over the potential for an exit from the European Union have compounded this weakness.
�� Ultimately, we expect the U.K. to raise rates within a few quarters of the first Fed hike. This should provide a tailwind to the currency that should eclipse these concerns.
JaPanese Yen
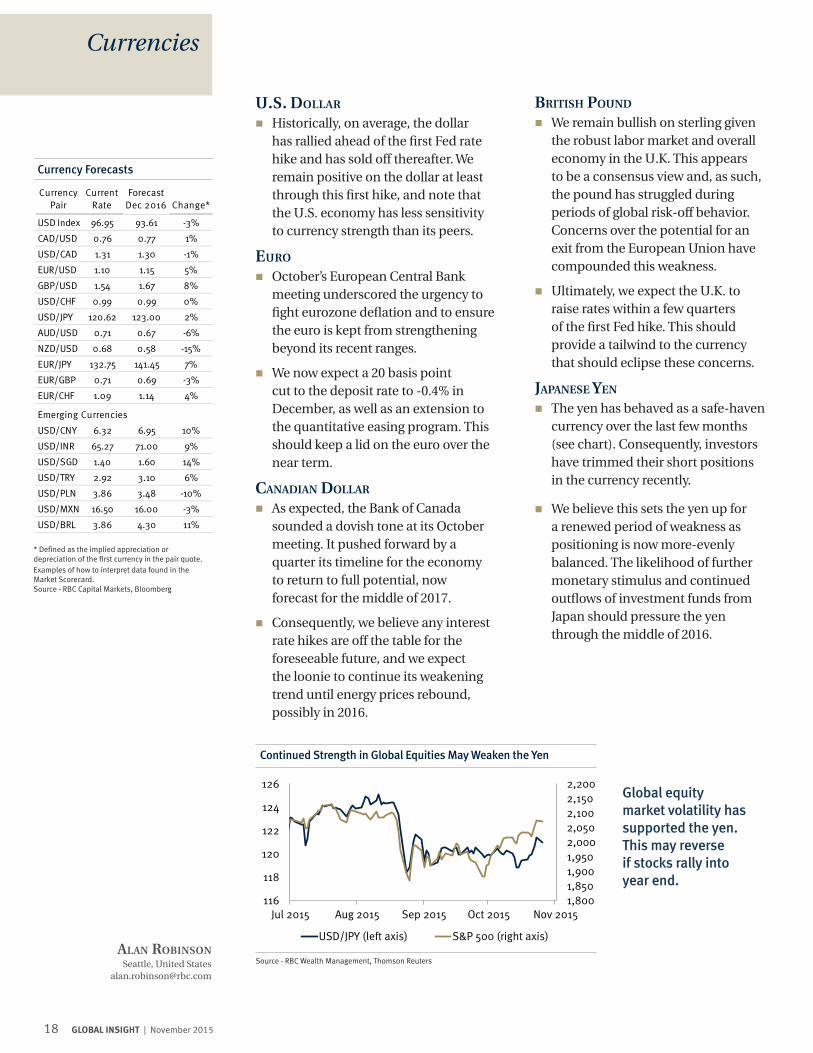
�� The yen has behaved as a safe-haven currency over the last few months (see chart). Consequently, investors have trimmed their short positions in the currency recently.
�� We believe this sets the yen up for a renewed period of weakness as positioning is now more-evenly balanced. The likelihood of further monetary stimulus and continued outflows of investment funds from Japan should pressure the yen through the middle of 2016.
Currency Pair
Current Rate
Forecast Dec 2016 Change*
USD Index 96.95 93.61 -3%
CAD/USD 0.76 0.77 1%
USD/CAD 1.31 1.30 -1%
EUR/USD 1.10 1.15 5%
GBP/USD 1.54 1.67 8%
USD/CHF 0.99 0.99 0%
USD/JPY 120.62 123.00 2%
AUD/USD 0.71 0.67 -6%
NZD/USD 0.68 0.58 -15%
EUR/JPY 132.75 141.45 7%
EUR/GBP 0.71 0.69 -3%
EUR/CHF 1.09 1.14 4%
Emerging Currencies
USD/CNY 6.32 6.95 10%
USD/INR 65.27 71.00 9%
USD/SGD 1.40 1.60 14%
USD/TRY 2.92 3.10 6%
USD/PLN 3.86 3.48 -10%
USD/MXN 16.50 16.00 -3%
USD/BRL 3.86 4.30 11%
* Defined as the implied appreciation or depreciation of the first currency in the pair quote. Examples of how to interpret data found in the Market Scorecard. Source - RBC Capital Markets, Bloomberg
Currency Forecasts
Currencies
Source - RBC Wealth Management, Thomson Reuters
Continued Strength in Global Equities May Weaken the Yen
1,8001,8501,9001,9502,0002,0502,1002,1502,200
116
118
120
122
124
126
Jul 2015 Aug 2015 Sep 2015 Oct 2015 Nov 2015
USD/JPY (left axis) S&P 500 (right axis)
Global equity market volatility has supported the yen. This may reverse if stocks rally into year end.

19 GLOBAL INSIGHT | November 2015
Canada — In Transition�� Q3 likely first quarter of positive growth in 2015. House
construction firm, business capex (mostly energy) and government weak. Consumer attitude restrained by resource sector job loss.
�� Mfg. sales ex-petroleum products growing consistently, led by autos. Energy capex plans down sharply. Loonie weakness helping services, tourism, and now mfg.
Eurozone — Improving�� Q2 was 9th successive quarter of positive growth. Spain
has reported solid a Q3, its 10th positive result running. France picking up, Italy improving. Private sector lending up year over year for 8 mos. running after almost 3-year decline.
�� PMIs consistently solid, driven increasingly by domestic demand. Refugee crisis could weigh on consumer sentiment. Inventories may drag on final quarter.
United Kingdom — Growing�� Q3 GDP growth rate eased to up 2.3% y/y. Led by
large services sector, trade. Construction, industrial production weaker. Oil sector subtracted from growth. Employment and income growth strong. PMIs and new orders positive but off best levels.
�� Growth pace sustainable for 2015, but uncertainty around EU membership referendum may weigh on business investment/confidence.
China — Slowing�� Q2 GDP at 7.0% in line with gov’t full-year target, but
internals are mixed/weaker. Fixed asset investment slowing, as is loan growth. Manufacturing PMI improved in August but still in contraction territory, exports growing. Employment, wages growing, consumer confidence improving.
�� Government has cut rates six times, more could come. Some firming in house prices.
Japan — Conflicted�� GDP growth sagged in Q2, but up year over year.
Leading indicators softer, PMIs, corporate earnings, and business confidence firm.
�� Employment, wages growing, consumer confident, spending mixed. Weak oil prices putting inflation targets in jeopardy.
United States — Solid Growth�� Q3 growth slowed to 1.5% mostly due to inventory
drag. Private sector domestic demand up by 3.3% y/y. Home sales, permits, near 8-year high. Unemployment claims at 40-year low. Consumer incomes and spending, construction activity, and capex growing. Leading indicators, confidence point to continued solid domestic growth.
1.9%2.4% 2.5% 2.5%
1.5% 1.6% 0.0% 1.5%
2013 2014 2015E 2016E
2.2% 1.9% 3.2% 3.2%1.8%1.8%1.5%1.7%2012 2013 2014E 2015E
Real GDP Growth Inflation Rate
(
2.0% 2.4%
1.0%1.5%1.0%
1.9%1.0%
1.8%
2013 2014 2015E 2016E
1.7%
2.6% 2.5% 2.5%2.6%
1.5% 0.0% 1.8%
2013 2014 2015E 2016E
7.8% 7.4%6.5% 6.2%
2.6%2.0% 1.5%
2.5%
2013 2014 2015E 2016E
-0.4%
0.9% 1.5% 2.0%1.3%
0.4%0.0% 1.0%
2013 2014 2015E 2016E
1.5%
0.0%0.8%
1.5%0.3%
2.8%
0.5%1.5%
2013 2014 2015E 2016E
Key Forecasts
Source - RBC Investment Strategy Committee, RBC Capital Markets, GPAC

20 GLOBAL INSIGHT | November 2015
Index (local currency) Level 1 Month YTD 12 Months
S&P 500 2,079.36 8.3% 1.0% 3.0%
Dow Industrials (DJIA) 17,663.54 8.5% -0.9% 1.6%
NASDAQ 5,053.75 9.4% 6.7% 9.1%
Russell 2000 1,161.86 5.6% -3.6% -1.0%
S&P/TSX Comp 13,529.17 1.7% -7.5% -7.4%
FTSE All-Share 3,484.60 4.5% -1.4% -0.5%
STOXX Europe 600 375.47 8.0% 9.6% 11.5%
German DAX 10,850.14 12.3% 10.7% 16.3%
Hang Seng 22,640.04 8.6% -4.1% -5.7%
Shanghai Comp 3,382.56 10.8% 4.6% 39.8%
Nikkei 225 19,083.10 9.7% 9.4% 16.3%
India Sensex 26,656.83 1.9% -3.1% -4.3%
Singapore Straits Times 2,998.35 7.4% -10.9% -8.4%
Brazil Ibovespa 45,868.82 1.8% -8.3% -16.0%
Mexican Bolsa IPC 44,542.76 4.5% 3.2% -1.1% Bond Yields 10/30/15 12/31/14 10/31/14 12-mo. Chg
US 2-Yr Tsy 0.724% 0.629% 0.491% 0.23%
US 10-Yr Tsy 2.142% 2.037% 2.335% -0.19%
Canada 2-Yr 0.576% 0.519% 1.023% -0.45%
Canada 10-Yr 1.542% 1.432% 2.048% -0.51%
UK 2-Yr 0.626% 0.563% 0.655% -0.03%
UK 10-Yr 1.922% 1.762% 2.247% -0.33%
Germany 2-Yr -0.315% -0.252% -0.056% -0.26%
Germany 10-Yr 0.517% 0.587% 0.841% -0.32% Commodities (USD) Price 1 Month YTD 12 Months
Gold (spot $/oz) 1,142.16 2.4% -3.6% -2.7%
Silver (spot $/oz) 15.55 7.1% -1.0% -3.8%
Copper ($/metric ton) 5,129.50 -0.9% -19.4% -24.1%
Uranium ($/lb) 36.50 0.0% -8.8% 0.0%
Oil (WTI spot/bbl) 46.59 3.3% -12.5% -42.2%
Oil (Brent spot/bbl) 49.56 2.5% -13.6% -42.3%
Natural Gas ($/mmBtu) 2.32 -8.0% -19.7% -40.1%
Agriculture Index 295.23 1.6% -8.4% -7.4% Currencies Rate 1 Month YTD 12 Months
US Dollar Index 96.95 0.6% 7.4% 11.5%
CAD/USD 0.76 1.8% -11.1% -13.8%
USD/CAD 1.31 -1.8% 12.6% 16.1%
EUR/USD 1.10 -1.5% -9.0% -12.1%
GBP/USD 1.54 2.0% -1.0% -3.5%
AUD/USD 0.71 1.7% -12.7% -18.9%
USD/CHF 0.99 1.5% -0.6% 2.6%
USD/JPY 120.62 0.6% 0.7% 7.4%
EUR/JPY 132.75 -0.9% -8.4% -5.6%
EUR/GBP 0.71 -3.5% -8.1% -8.9%
EUR/CHF 1.09 -0.1% -9.6% -9.8%
USD/SGD 1.40 -1.5% 5.7% 9.0%
USD/CNY 6.32 -0.6% 1.8% 3.3%
USD/BRL 3.86 -2.3% 45.1% 55.6%
Equity returns do not include dividends, except for the German DAX. Equity performance and bond yields in local currencies. U.S. Dollar Index measures USD vs. six major currencies. Currency rates reflect market convention (CAD/USD is the exception). Currency returns quoted in terms of the first currency in each pairing. Examples of how to interpret currency data: CAD/USD 0.76 means 1 Canadian dollar will buy 0.76 U.S. dollar. CAD/USD -13.8% return means the Canadian dollar has fallen 13.8% vs. the U.S. dollar during the past 12 months. USD/JPY 120.62 means 1 U.S. dollar will buy 120.62 yen. USD/JPY 7.4% return means the U.S. dollar has risen 7.4% vs. the yen during the past 12 months.
Source - RBC Wealth Management, RBC Capital Markets, Bloomberg; data through 10/30/15.
Market Scorecard
Diverging economies favor GBP.
Germany led the global equity rally in October as fears about China and global growth receded. It also leads year to date.
Crude oil bounced modestly following steep losses in September.
Strong correlation with oil price.
Treasury yields rose across the yield curve, more so at the short end.

21 GLOBAL INSIGHT | November 2015
This document is produced by the Global Portfolio Advisory Committee within RBC Wealth Management’s Portfolio Advisory Group. The RBC Wealth Management Portfolio Advisory Group provides support related to asset allocation and portfolio construction for the firm’s Investment Advisors / Financial Advisors who are engaged in assembling portfolios incorporating individual marketable securities. The Committee leverages the broad market outlook as developed by the RBC Investment Strategy Committee, providing additional tactical and thematic support utilizing research from the RBC Investment Strategy Committee, RBC Capital Markets, and third-party resources.
Global Portfolio Advisory Committee members: Jim Allworth – Co-chair; Investment Strategist, RBC Dominion Securities Inc.
Rajan Bansi – Co-chair; Head of Fixed Income Strategies, RBC Wealth Management Portfolio Advisory Group, RBC Dominion Securities Inc.
Maarten Jansen – Head, Investments & Trading, RBC Wealth Management Global Wealth Services Group, RBC Dominion Securities Inc.
Mark Allen – Portfolio Advisor, RBC Wealth Management Portfolio Advisory Group, RBC Dominion Securities Inc.
Matt Barasch – Head of Canadian Equities, RBC Wealth Management Portfolio Advisory Group, RBC Dominion Securities Inc.
Craig Bishop – Lead Strategist, U.S. Fixed Income Strategies Group, RBC Wealth Management Portfolio Advisory Group, RBC Capital Markets, LLC
Kelly Bogdanov – Portfolio Analyst, RBC Wealth Management Portfolio Advisory Group, RBC Capital Markets, LLC
Frédérique Carrier – Director, European Equities, Royal Bank of Canada Investment Management (U.K.) Ltd.
Janet Engels – Head of U.S. Equities, RBC Wealth Management Portfolio Advisory Group, RBC Capital Markets, LLC
Alan Robinson – Portfolio Advisor, RBC Wealth Management Portfolio Advisory Group, RBC Capital Markets, LLC
Jay Roberts – Head of Equity Advisory, Wealth Management Hong Kong, RBC Dominion Securities Inc.
The RBC Investment Strategy Committee (RISC), consists of senior investment professionals drawn from individual, client-focused business units within RBC, including the Portfolio Advisory Group. The RBC Investment Strategy Committee builds a broad global investment outlook and develops specific guidelines that can be used to manage portfolios. RISC is chaired by Daniel Chornous, CFA, Chief Investment Officer of RBC Global Asset Management Inc.
researCh resourCes

22 GLOBAL INSIGHT | November 2015
required disClosuresAnalyst Certification All of the views expressed in this report accurately reflect the personal views of the responsible analyst(s) about any and all of the subject securities or issuers. No part of the compensation of the responsible analyst(s) named herein is, or will be, directly or indirectly, related to the specific recommendations or views expressed by the responsible analyst(s) in this report.
Important DisclosuresIn the U.S., RBC Wealth Management operates as a division of RBC Capital Mar-kets, LLC. In Canada, RBC Wealth Management includes, without limitation, RBC Dominion Securities Inc., which is a foreign affiliate of RBC Capital Markets, LLC. This report has been prepared by RBC Capital Markets, LLC which is an indirect wholly-owned subsidiary of the Royal Bank of Canada and, as such, is a related issuer of Royal Bank of Canada.
Non-U.S. Analyst Disclosure: Mark Allen, Jim Allworth, Alana Awad, Rajan Bansi, Matt Barasch, Jean-François Dion, Farnaz Shahed, and Jay Roberts, employees of RBC Wealth Management USA’s foreign affiliate RBC Dominion Securities Inc.; and Frédérique Carrier, Davide Boglietti, and Christopher Girdler, employees of RBC Wealth Management USA’s foreign affiliate Royal Bank of Canada Investment Management (UK) Limited; contributed to the preparation of this publication. These individuals are not registered with or qualified as research analysts with the U.S. Financial Industry Regulatory Authority (“FINRA”) and, since they are not associated persons of RBC Wealth Management, they may not be subject to NASD Rule 2711 and Incorporated NYSE Rule 472 govern-ing communications with subject companies, the making of public appear-ances, and the trading of securities in accounts held by research analysts.
In the event that this is a compendium report (covers six or more companies), RBC Wealth Management may choose to provide important disclosure informa-tion by reference. To access current disclosures, clients should refer to http://www.rbccm.com/GLDisclosure/PublicWeb/DisclosureLookup.aspx?EntityID=2 to view disclosures regarding RBC Wealth Management and its affiliated firms. Such information is also available upon request to RBC Wealth Management Publishing, 60 South Sixth St, Minneapolis, MN 55402.
References to a Recommended List in the recommendation history chart may include one or more recommended lists or model portfolios maintained by RBC Wealth Management or one of its affiliates. RBC Wealth Management recom-mended lists include the Guided Portfolio: Prime Income (RL 6), the Guided Portfolio: Large Cap (RL 7), the Guided Portfolio: Dividend Growth (RL 8), the Guided Portfolio: Midcap 111 (RL9), the Guided Portfolio: ADR (RL 10), and the Guided Portfolio: Global Equity (U.S.) (RL 11). RBC Capital Markets recommend-ed lists include the Strategy Focus List and the Fundamental Equity Weightings (FEW) portfolios. The abbreviation ‘RL On’ means the date a security was placed on a Recommended List. The abbreviation ‘RL Off’ means the date a security was removed from a Recommended List.
Distribution of RatingsFor the purpose of ratings distributions, regulatory rules require member firms to assign ratings to one of three rating categories - Buy, Hold/Neutral, or Sell - regardless of a firm’s own rating categories. Although RBC Capital Markets, LLC ratings of Top Pick (TP)/Outperform (O), Sector Perform (SP) and Underperform (U) most closely correspond to Buy, Hold/Neutral and Sell, respectively, the meanings are not the same because our ratings are determined on a relative basis (as described below).
Explanation of RBC Capital Markets, LLC Equity Rating SystemAn analyst’s “sector” is the universe of companies for which the analyst provides research coverage. Accordingly, the rating assigned to a particular stock represents solely the analyst’s view of how that stock will perform over the next 12 months relative to the analyst’s sector average. Although RBC Capital Markets, LLC ratings of Top Pick (TP)/Outperform (O), Sector Perform (SP), and Underperform (U) most closely correspond to Buy, Hold/Neutral and Sell, re-spectively, the meanings are not the same because our ratings are determined on a relative basis (as described below).
Ratings: Top Pick (TP): Represents analyst’s best idea in the sector; expected to provide significant absolute total return over 12 months with a favorable risk-reward ratio. Outperform (O): Expected to materially outperform sector average over 12 months. Sector Perform (SP): Returns expected to be in line with sector average over 12 months. Underperform (U): Returns expected to be materially below sector average over 12 months.
Risk Rating: As of March 31, 2013, RBC Capital Markets, LLC suspends its Average and Above Average risk ratings. The Speculative risk rating reflects a security’s lower level of financial or operating predictability, illiquid share trading volumes, high balance sheet leverage, or limited operating history that result in a higher expectation of financial and/or stock price volatility.
Valuation and Price Target ImpedimentsWhen RBC Wealth Management assigns a value to a company in a research report, FINRA Rules and NYSE Rules (as incorporated into the FINRA Rulebook) require that the basis for the valuation and the impediments to obtaining that valuation be described. Where applicable, this information is included in the text of our research in the sections entitled “Valuation” and “Price Target Impediment”, respectively.
The analyst(s) responsible for preparing this research report received com-pensation that is based upon various factors, including total revenues of RBC Capital Markets, LLC, and its affiliates, a portion of which are or have been generated by investment banking activities of the member companies of RBC Capital Markets, LLC and its affiliates.
Other DisclosuresPrepared with the assistance of our national research sources. RBC Wealth Management prepared this report and takes sole responsibility for its content and distribution. The content may have been based, at least in part, on material provided by our third-party correspondent research services. Our third-party correspondent has given RBC Wealth Management general permission to use its research reports as source materials, but has not reviewed or approved this report, nor has it been informed of its publication. Our third-party correspon-dent may from time to time have long or short positions in, effect transactions in, and make markets in securities referred to herein. Our third-party correspon-dent may from time to time perform investment banking or other services for, or solicit investment banking or other business from, any company mentioned in this report.
RBC Wealth Management endeavors to make all reasonable efforts to provide research simultaneously to all eligible clients, having regard to local time zones in overseas jurisdictions. In certain investment advisory accounts, RBC Wealth Management will act as overlay manager for our clients and will initiate transactions in the securities referenced herein for those accounts upon receipt of this report. These transactions may occur before or after your receipt of this report and may have a short-term impact on the market price of the securities in which transactions occur. RBC Wealth Management research is posted to our proprietary Web sites to ensure eligible clients receive coverage initiations and changes in rating, targets, and opinions in a timely manner. Additional distribution may be done by sales personnel via e-mail, fax, or regular mail. Clients may also receive our research via third-party vendors. Please contact your RBC Wealth Management Financial Advisor for more information regarding RBC Wealth Management research.
Conflicts Disclosure: RBC Wealth Management is registered with the Securi-ties and Exchange Commission as a broker/dealer and an investment adviser,
As of September 30, 2015
Rating Count Percent Count PercentBuy [Top Pick & Outperform] 958 54.40 281 29.33Hold [Sector Perform] 701 39.81 118 16.83Sell [Underperform] 102 5.79 4 3.92
Investment Banking Serv ices Prov ided During Past 12 Months
Distribution of Ratings - RBC Capital Markets, LLC Equity Research

23 GLOBAL INSIGHT | November 2015
offering both brokerage and investment advisory services. RBC Wealth Man-agement’s Policy for Managing Conflicts of Interest in Relation to Investment Research is available from us on our Web site at http://www.rbccm.com/GLDis-closure/PublicWeb/DisclosureLookup.aspx?EntityID=2. Conflicts of interests related to our investment advisory business can be found in Part II of the Firm’s Form ADV or the Investment Advisor Group Disclosure Document. Copies of any of these documents are available upon request through your Financial Advisor. We reserve the right to amend or supplement this policy, Part II of the ADV, or Disclosure Document at any time.
The authors are employed by one of the following entities: RBC Wealth Manage-ment USA, a division of RBC Capital Markets, LLC, a securities broker-dealer with principal offices located in Minnesota and New York, USA; by RBC Dominion Securities Inc., a securities broker-dealer with principal offices located in Toronto, Canada; by RBC Investment Services (Asia) Limited, a subsidiary of RBC Dominion Securities Inc., a securities broker-dealer with principal offices located in Hong Kong, China; and by Royal Bank of Canada Investment Manage-ment (U.K.) Limited, an investment management company with principal offices located in London, United Kingdom.
The Global Industry Classification Standard (“GICS”) was developed by and is the exclu-sive property and a service mark of MSCI Inc. (“MSCI”) and Standard & Poor’s Financial Services LLC (“S&P”) and is licensed for use by RBC. Neither MSCI, S&P, nor any other party involved in making or compiling the GICS or any GICS classifications makes any express or implied warranties or representations with respect to such standard or clas-sification (or the results to be obtained by the use thereof), and all such parties hereby expressly disclaim all warranties of originality, accuracy, completeness, merchantability and fitness for a particular purpose with respect to any of such standard or classification. Without limiting any of the foregoing, in no event shall MSCI, S&P, any of their affiliates or any third party involved in making or compiling the GICS or any GICS classifications have any liability for any direct, indirect, special, punitive, consequential or any other damages (including lost profits) even if notified of the possibility of such damages.
DisclaimerThe information contained in this report has been compiled by RBC Wealth Management, a division of RBC Capital Markets, LLC, from sources believed to be reliable, but no representation or warranty, express or implied, is made by Royal Bank of Canada, RBC Wealth Management, its affiliates or any other person as to its accuracy, completeness or correctness. All opinions and estimates contained in this report constitute RBC Wealth Management’s judg-ment as of the date of this report, are subject to change without notice and are provided in good faith but without legal responsibility. Past performance is not a guide to future performance, future returns are not guaranteed, and a loss of original capital may occur. Every province in Canada, state in the U.S., and most countries throughout the world have their own laws regulating the types of securities and other investment products which may be offered to their residents, as well as the process for doing so. As a result, the securities discussed in this report may not be eligible for sale in some jurisdictions. This report is not, and under no circumstances should be construed as, a solicitation to act as securities broker or dealer in any jurisdiction by any person or company that is not legally permitted to carry on the business of a securities broker or dealer in that jurisdiction. Nothing in this report constitutes legal, accounting or tax advice or individually tailored investment advice. This material is prepared for general circulation to clients, including clients who are affiliates of Royal Bank of Canada, and does not have regard to the particular circumstances or needs of any specific person who may read it. The investments or services contained in this report may not be suitable for you and it is recommended that you consult an independent investment advisor if you are in doubt about the suitability of such investments or services. To the full extent permitted by law neither Royal Bank of Canada nor any of its affiliates, nor any other person, accepts any liability whatsoever for any direct or consequential loss arising from any use of this report or the information contained herein. No matter contained
in this document may be reproduced or copied by any means without the prior consent of Royal Bank of Canada. In the U.S., RBC Wealth Management operates as a division of RBC Capital Markets, LLC. In Canada, RBC Wealth Management includes, without limitation, RBC Dominion Securities Inc., which is a foreign af-filiate of RBC Capital Markets, LLC. This report has been prepared by RBC Capital Markets, LLC. Additional information is available upon request.
To U.S. Residents: This publication has been approved by RBC Capital Markets, LLC, Member NYSE/FINRA/SIPC, which is a U.S. registered broker-dealer and which accepts responsibility for this report and its dissemination in the United States. RBC Capital Markets, LLC, is an indirect wholly-owned subsidiary of the Royal Bank of Canada and, as such, is a related issuer of Royal Bank of Canada. Any U.S. recipient of this report that is not a registered broker-dealer or a bank acting in a broker or dealer capacity and that wishes further information regard-ing, or to effect any transaction in, any of the securities discussed in this report, should contact and place orders with RBC Capital Markets, LLC. International investing involves risks not typically associated with U.S. investing, including currency fluctuation, foreign taxation, political instability and different account-ing standards.
To Canadian Residents: This publication has been approved by RBC Dominion Securities Inc. RBC Dominion Securities Inc.* and Royal Bank of Canada are separate corporate entities which are affiliated. *Member-Canadian Investor Protection Fund. ®Registered trademark of Royal Bank of Canada. Used under license. RBC Wealth Management is a registered trademark of Royal Bank of Canada. Used under license.
To European Residents: Clients of United Kingdom subsidiaries may be entitled to compensation from the UK Financial Services Compensation Scheme if any of these entities cannot meet its obligations. This depends on the type of busi-ness and the circumstances of the claim. Most types of investment business are covered for up to a total of £50,000. The Channel Islands subsidiaries are not covered by the UK Financial Services Compensation Scheme; the offices of Royal Bank of Canada (Channel Islands) Limited in Guernsey and Jersey are covered by the respective compensation schemes in these jurisdictions for deposit taking business only.
To Hong Kong Residents: This publication is distributed in Hong Kong by RBC Investment Services (Asia) Limited and RBC Investment Management (Asia) Limited, licensed corporations under the Securities and Futures Ordinance or, by Royal Bank of Canada, Hong Kong Branch, a registered institution under the Securities and Futures Ordinance. This material has been prepared for general circulation and does not take into account the objectives, financial situation, or needs of any recipient. Hong Kong persons wishing to obtain further informa-tion on any of the securities mentioned in this publication should contact RBC Investment Services (Asia) Limited, RBC Investment Management (Asia) Limited or Royal Bank of Canada, Hong Kong Branch at 17/Floor, Cheung Kong Center, 2 Queen’s Road Central, Hong Kong (telephone number is 2848-1388).
To Singapore Residents: This publication is distributed in Singapore by RBC (Singapore Branch) and RBC (Asia) Limited, registered entities granted offshore bank status by the Monetary Authority of Singapore. This material has been prepared for general circulation and does not take into account the objectives, financial situation, or needs of any recipient. You are advised to seek indepen-dent advice from a financial adviser before purchasing any product. If you do not obtain independent advice, you should consider whether the product is suitable for you. Past performance is not indicative of future performance.
Copyright © RBC Capital Markets, LLC 2015 - Member NYSE/FINRA/SIPCCopyright © RBC Dominion Securities Inc. 2015 - Member Canadian Investor Protection Fund Copyright © RBC Europe Limited 2015Copyright © Royal Bank of Canada 2015All rights reserved