noise mapping using gis - kfupm
TRANSCRIPT

A H M A D J A R A D A H 2 0 0 1 3 2 7 3 0
NOISE MAPPING USING GIS
OUTLINE
• Introduction
• Noise Mapping
• Techniques
• Case Studies
• Conclusion

INTRODUCTION
• Noise can be defined simply as the disturbance
evoked by sound.
• Noise can represent 1 type of environmental
pollution. (NOISE POLLUTION).
• Noise in some cases can cause harm to human
ears. In addition, it can have psychological effects
on human performance.

INTRODUCTION
• Noise pollution is currently increasing at an alarming
rate.
• Reasons include:
• Increased population
• Concentration in major cities
• Increased traffic
• Many countries around the world are enforcing
laws and directives to control noise pollution
• Reflecting noise levels on maps is the easiest way to
represent the problem

NOISE MAPPING
• Noise map is a map the shows noise levels in a
geographical area in a certain period of time (i.e.
between 7:00am and 5:00pm)

NOISE MAPPING
• European law states that cities with population of
over 250,000 are required to have a noise map.
• This issue encouraged the use of GIS in creating
such maps.
• The power of GIS provides:
• Central Database management
• Visual presentation

TECHNIQUES
• There are 2 types of data in noise mapping:
• Field Measured Data
• Modeling (predicted) Data
• Many techniques are used in noise mapping, and
this includes:
• 2D noise maps
• 2 ½D noise maps
• 3D noise maps
TECHNIQUES
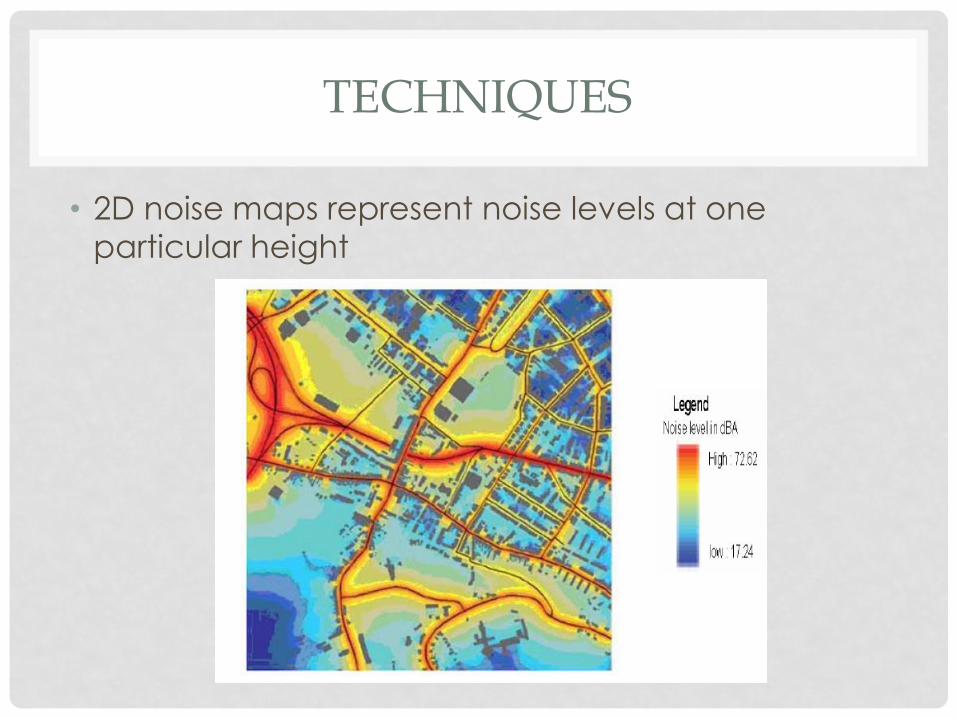
• 2D noise maps represent noise levels at one
particular height

TECHNIQUES
• 2 ½ D noise maps represent noise levels at one
elevation for the same x,y coordinates
• 3D maps show all the information on x,y,z axis.

CASE STUDIES
• Adeliade, South
Australia, Australia
• 2d Map
• Based on Field
Measurements
• Annual Update
• 2 Consultants:
• GIS
• Acoustics

CASE STUDIES
• Duplin City,
Ireland
• Daytime and
nighttime
maps
http://www.dublincity.ie/WATERWASTEENVIRONMENT/NOISE
MAPSANDACTIONPLANS/Pages/default.aspx

CASE STUDIES
• San Francisco,
California, USA
• Developed by the
Department of Health

CASE STUDIES
• Barcelona City (Internet GIS)

CONCLUSION
• Implementation of GIS in noise mapping
contributed positively of the control noise pollution.
• Many researchers now find it easier to conduct
studies on noise levels.
• This has also helped urban planners to improve city
and villages pollution.