noise technical report beyer community park san …
TRANSCRIPT

NOISE TECHNICAL REPORT
BEYER COMMUNITY PARK SAN DIEGO, CALIFORNIA
Prepared for:
City of San Diego Public Works Department
525 B Street, Suite 500, M.S. 908A San Diego, California 92101
Prepared by:
Roma Stromberg, M.S. INCE
7220 Trade Street, Suite 207B San Diego, CA 92121
P 858-265-6397 F 858-430-2571
April 2019

This page intentionally left blank.

Beyer Community Park Project –Noise Technical Report_GR_Final_07012018 Page i
TABLE OF CONTENTS
Section Page
GLOSSARY OF TERMS AND ACRONYMS .......................................................................................... iv
1.0 INTRODUCTION .................................................................................................................... 5
1.1 Purpose of Study .............................................................................................................. 5
1.2 Project Location................................................................................................................ 5
1.3 Project Description ........................................................................................................... 5
2.0 NOISE AND VIBRATION TERMINOLOGY ............................................................................... 8
2.1 Fundamentals of Noise .................................................................................................... 8
2.2 Vibration ......................................................................................................................... 11
3.0 REGULATORY FRAMEWORK............................................................................................... 13
3.1 Federal Regulations ........................................................................................................ 13
3.2 State Regulations ........................................................................................................... 13
3.3 Local Regulations ............................................................................................................ 14
4.0 EXISTING CONDITIONS ....................................................................................................... 20
4.1 Noise Environment ......................................................................................................... 20
4.2 Noise Measurements and Observations ........................................................................ 21
4.3 Noise-Sensitive Receptors .............................................................................................. 22
5.0 IMPACT ANALYSIS .............................................................................................................. 24
5.1 Construction ................................................................................................................... 24
5.2 Vibration ......................................................................................................................... 25
5.3 Traffic Noise ................................................................................................................... 29
5.4 Operational Noise .......................................................................................................... 32
6.0 MITIGATION MEASURES .................................................................................................... 37
6.1 Operation ....................................................................................................................... 37
6.2 Construction Noise Reduction Measures ....................................................................... 37
7.0 REFERENCES ....................................................................................................................... 40

Page ii Beyer Community Park Project –Noise Technical Report_GR_Final_03312019
LIST OF FIGURES Figure Page Figure 1. Project Location ............................................................................................................ 6
Figure 2. Proposed Project .......................................................................................................... 7
Figure 3. Noise Measurement Locations ................................................................................... 23
Figure 4. Beyer Community Park Peak Hour Operational Noise Levels .................................... 35
Figure 5. Beyer Community Park Peak Hour Operational Noise Contours ............................... 36
LIST OF TABLES Table Table 1 - Typical Noise Levels ....................................................................................................... 10
Table 2 - Land Use/Noise Compatibility Guidelines...................................................................... 15
Table 3 - City of San Diego Table of Applicable Limits .................................................................. 19
Table 4 - Short-Term Noise Measurement Summary (dBA) ......................................................... 21
Table 5 – Typical Construction Equipment Noise Levels .............................................................. 25
Table 6 – Vibration Source Levels for Construction Equipment ................................................... 27
Table 7 – Construction Equipment Vibration Levels and Effects on Humans and Buildings ........ 28
Table 8 – Change in Existing Traffic Noise Levels Along Roadways as a Result of Project (CNEL) 31
APPENDICES A: Noise Measurement Field Data B: Roadway Construction Noise Model (RCNM), Version 1.1 C: Vibration Level Impact D: SoundPLAN Modeling Data E: FHWA Existing and Existing Plus Project Worksheets

Beyer Community Park Project –Noise Technical Report_GR_Final_07012018 Page iii
This page intentionally left blank.

Page iv Beyer Community Park Project –Noise Technical Report_GR_Final_03312019
GLOSSARY OF TERMS AND ACRONYMS ALUC Airport Land Use Commission ADT average daily traffic CEQA California Environmental Quality Act CNEL Community Noise Equivalent Level City City of San Diego dB decibel dBA a-weighted decibel EIR Environmental Impact Report EPA Environmental Protection Agency FHWA Federal Highway Administration FTA Federal Transit Administration Hz Hertz I-805 Interstate 805 in/sec inches per second KHz kilohertz Ldn day/night average sound level Lmax maximum noise level LD Larson-Davis, Inc. Leq equivalent noise level over a period of time MHPA Multiple Habitat Planning Area mPa microPascals mph miles per hour ppv peak particle velocity RCNM Road Construction Noise Model rms root mean square SANDAG San Diego Association of Governments SLM sound level meter SPL Sound Pressure Level VdB Vibration Decibels

Beyer Community Park Project –Noise Technical Report_GR_Final_07012018 Page 5
1.0 INTRODUCTION
1.1 Purpose of Study
The purpose of this report is to provide an assessment of the noise impacts resulting from development of and use of the Beyer Community Park project in light of applicable standards, and to identify mitigation measures that may be necessary to reduce those impacts.
1.2 Project Location
The proposed project is located south of the southerly terminus of Beyer Boulevard, Delany Drive and Fantasy Lane; and east of vacant land located east of East Beyer Boulevard in the southeastern portion of the City of San Diego, California. The project location is shown in Figure 1.
1.3 Project Description
The project proposes to construct a new +/-15-acre community park on approximately 43‐acres in the San Ysidro Community. The site is currently vacant, open space property containing three parcels (APN’S# 638-070-7100, 638-170-1800 & 638-170-1900). The park will consist of lighted turf sports fields, a children’s play area, skate park, fitness area, half basketball court, picnic/ gathering spaces, a dog park, planting area, storm water basins, a comfort station, trails and parking. The access to the project site will be from Beyer Boulevard. Two driveways will be accessible from Beyer Boulevard. The first is located on the south end of Enright Drive which is currently a cul‐de‐sac. The second is located at the south end of Delany Drive, which is also an existing cul‐de‐sac. The east side of Enright Drive will be improved with a new sidewalk, fencing, and landscaping. The proposed site plan is shown in Figure 2.

Beyer ParkFIGURE 1
Project Location
Date:
4/30/
2018
Autho
r: SOURCE: ESRI, Google Earth´Do
cumen
t Path
: C:\U
sers\U
ser\De
sktop
\Work
\GEPe
rmit\B
eyer B
lvd Fig
ure 1.m
xd
Project Location
0 200 400 600 800100Feet
Beyer Blvd
Otay M
esa Rd
San Ysidro Middle School
§̈¦805
Otay M
esa Rd

0 30 60 1201" = 60'-0"SCALE : BEYER PARK
WBS # SHEETOF SHEETS
S-00752
DATE08/17/2018
ECE
2
hn
iL c. AC
www.scpe elt ho
CHs T DDNAAB L
W HTI
MI N
A
o4
N V ,219
idt es gn.c1-632}91
138,
im{ed6
31 9
f elimisca
Z 3
m62
4
GTN
GNA R T I SOR N M E
SNI
N V
IGI
,PU IPX R E S S IS E N S I T
RCIT A
OEL
98-632} 716{ 9 2
G
.I N D E S IY
CO NI V I T
N
xS11 i 9DeAvenu , San iego, CAth 2101iSu te 005 ,11
SAN DIEGO, CA
6
0 30 60 1201" = 60'-0"SCALE : BEYER PARK
WBS # SHEETOF SHEETS
S-00752
DATE3/7/2019
SAN DIEGO, CA
-
0 30 60 1201" = 60'-0"SCALE : BEYER PARK
WBS # SHEETOF SHEETS
S-00752
DATE3/7/2019
SAN DIEGO, CA
-
X
XXX
X
XX
XX
XX
X
X
X
X
X
XX
X
X
X
X
X
X
X
X
X
X
X
X
X
XX
X
X
X
XX
XX
X
X
X
X
X
XX X X
X
X
X
XX
XX
XX
X
X
X
X
X
X
X
XX
XX
X
XXX
X
XX
X
X
X
X
XX
X
X
X
X
XX
X
X
XX
X
X
X
X
X
X
XX
X
X
X
XX X
X
X
X
XX
XX
X
X
X XX
X
XX
X
XX
XX
X
X
X
X
X
X
X
XXX
X
X
X
X
X
X
X
XX
A
A
C
B
C
A
A B
D
C
BA
AD
CB
EC
BCB
AEBA
CDBA
A
BA
C
BAB
AA
C
AB
BA
A
AAB
A
B
C
A
BAA
A
BAA
BCBA
BABAB
B
BA
A
A
A
AA
AB
AA
C
A
A
B
A
C
A
AB
C
B
A B
B
A
A
C
A C
B
BA
AA
A
AA
B
AA
AA B
CA
BAA
A
A
A
CA
A
A
BA
BA AC
A
A
AB
CA
A
BA
C
B
B
C
AB
D
C
C
C
C
C
C
A
A
BA
CC B A A
C
C
C
C
C
C
C
C
CC
A
0 30 60 1201" = 60'-0"SCALE : BEYER PARK
WBS # SHEETOF SHEETS
S-00752
DATE3/7/2019
SAN DIEGO, CA
-
MHPA BOUNDARY
WETLAND
FAULT LINE
LANDSLIDE LIMIT
100’
BU
FFER
50’
SETBACK
25’
BUFF
ER
KeyTurf Field(1) Adult (225’x360’)(3) U12 (150’x300’)
1’ HT. WALL
16” HT. WALL (qty. 4)
18” HT. WALL (qty. 2)
18” HT. WALL
Picnic Area
10’ Ht. Chainlink Fence at soccer
5’ Ht. Chainlink Fence at skate park
Total Spaces Required 63 Soccer Field (2 ac) 30 Parkland (6.5 ac) 33 Total Spaces Provided 69 Standard Stalls 60 Accessible Stalls 3 Future HOV/EV 6Enright Drive Street Parking 15
Large Dog Park DG with Permeable Paver Plaza
Small Dog Park DG with Permeable Paver Plaza
Children’s Play Area, 2-5 and 5-12 with rock climbing rock
Skate Park with Lighting
Comfort Station - 500sf. max. each with a total of 5 stalls
Storage Building (+/- 500 sf) and Trash Enclosure
Enright Drive street improvements and sidewalk
Electrical Transformer
3’ Ht. Lodgepole Fence
42” Ht. Lodgepole Fence with chainlink mesh
Existing Trail
12’ Wide Maintenance Access Road
Proposed Trail
Parking lot
Fitness Node + Mile Marker Signage(3 laps = 1 mile)
Monument Sign
Amphitheater Seat Walls
Half Basketball Court
1
1
2
2
1510
3
4
4
5
5
6 6
7
78
9
9
9
10
8
16
16
18
9
11
12
12
13
13
13
13
14
15
16
16
14
18
11
17
18
18
20
18
19
19
20
3
17
22
18
1921
19
20
21
22
21
Beyer Park will use a variety of lighting fixtures to light the parking lot, walkways, and sports field. All lighting will be directed and installed with shields to prevent light from disrupting adjacent residential properties and directed away from the MHPA.
Site LightingParking
S-00752SHEET
OF 8 SHEETS
SAN DIEGO, CABEYER PARK
WBS #
04/04/2019DATE
BEYER PARK
WBS # SHEET
OF SHEETS
S-00752
DATE08/17/2018
ECHs T DDMI NGGNSI ,PU IRO .C
SAN DIEGO, CA
69449 BALBOA AVE, STE 270SAN DIEGO, CA 92123 619.299.5550
EXISTING CONDITIONS0 30 60 120
1" = 60'-0"SCALE : BEYER PARK
WBS # SHEETOF SHEETS
S-00752
DATE08/17/2018
ECE
2
hn
iL c. AC
www.scpe elt ho
CHs T DDNAAB L
W HTI
MI N
A
o4
N V ,219
idt es gn.c1-632}91
138,
im{ed6
31 9
f elimisca
Z 3
m62
4
GTN
GNA R T I SOR N M E
SNI
N V
IGI
,PU IPX R E S S IS E N S I T
RCIT A
OEL
98-632} 716{ 9 2
G
.I N D E S IY
CO NI V I T
N
xS11 i 9DeAvenu , San iego, CAth 2101iSu te 005 ,11
SAN DIEGO, CA
6
SITE PLAN
3

Page 8 Beyer Community Park Project –Noise Technical Report_GR_Final_03312019
2.0 NOISE AND VIBRATION TERMINOLOGY
2.1 Fundamentals of Noise
2.1.1 Sound, Noise, and Acoustics
Sound can be described as the mechanical energy of a vibrating object transmitted by pressure waves through a liquid or gaseous medium (e.g., air) to a hearing organ, such as a human ear. Noise is defined as loud, unexpected, or annoying sound. In the science of acoustics, the fundamental model consists of a sound (or noise) source, a receiver, and the propagation path between the two. The loudness of the noise source and the obstructions or atmospheric factors affecting the propagation path to the receiver determines the sound level and characteristics of the noise perceived by the receiver. The field of acoustics deals primarily with the propagation and control of sound, with associated factors summarized below. Frequency Continuous sound can be described by frequency (pitch) and amplitude (loudness), with a low-frequency sound perceived as low in pitch. Frequency is expressed in terms of cycles per second, or Hertz (Hz). A frequency of 250 cycles per second, for example, is referred to as 250 Hz), with higher frequencies sometimes more conveniently expressed in kilohertz (kHz), or thousands of Hz. The audible frequency range for humans is generally between 20 and 20,000 Hz (or 20 kHz). Sound Pressure Levels and Decibels The amplitude of pressure waves generated by a sound source determines the loudness of that source. Sound pressure amplitude is measured in micro-Pascals (mPa), with one mPa representing approximately one hundred billionth of normal atmospheric pressure. Sound pressure amplitudes for different kinds of noise environments can range from less than 100 to 100,000,000 mPa. Because of this huge range of values, sound is rarely expressed in terms of mPa. Instead, a logarithmic scale is used to describe sound pressure level (SPL) in terms of decibels (dB). The threshold of audible sound is about 0 dB for a healthy human ear, which corresponds to 20 mPa. Sound Propagation When sound propagates over a distance, it changes in level and frequency content. Sound from a localized source (i.e., a point source) propagates uniformly outward in a spherical pattern. The sound level attenuates (or decreases) at a rate of six dB for each doubling of distance from a point source. Sound levels from a line source attenuate at a rate of three dB for each doubling of distance. A large object or barrier in the path between a noise source and a receiver can substantially attenuate noise levels at the receiver. The amount of attenuation provided by shielding depends on the size of the object and the frequency content of the noise source. Natural terrain features (e.g., hills and dense/deep woods) and human-made features (e.g., buildings and walls) can substantially reduce noise levels. Walls are often

Beyer Community Park Project –Noise Technical Report_GR_Final_07012018 Page 9
constructed between a source and a receiver specifically to reduce noise. A barrier that breaks the line of sight between a source and a receiver will typically result in at least five dB of noise reduction, with taller barriers providing increased noise reduction. Vegetation, such as highway landscaping, between the source and receiver is rarely effective in reducing noise, as it does not create a solid barrier. Human Perception of Noise
The decibel scale alone does not adequately characterize how humans perceive noise, as the dominant frequencies of a sound have a substantial effect on the human response to that sound. Although the intensity (energy per unit area) of the sound is a purely physical quantity, the loudness or human response is determined by the characteristics of the human ear. Human hearing is limited in the range of audible frequencies, as well as in the way it perceives the SPL within that range. In general, people are most sensitive to the frequency range of 1,000 to 8,000 Hz, and perceive sounds within that range better than sounds of the same amplitude in higher or lower frequencies. To approximate the response of the human ear, sound levels of individual frequency bands are weighted, depending on the human sensitivity to those frequencies. An “A-weighted” sound level (expressed in units of dBA) can then be calculated from this information. Noise levels are typically reported in terms of A-weighted decibels or dBA. Table 1, Typical A-weighted Noise Levels, describes levels for various noise sources. Human Response to Changes in Noise Levels A doubling of sound energy results in a three-dB increase in sound. The subjective human perception of a doubling of loudness, however, will usually be different than what is measured with precise instrumentation. In typical noisy environments, changes in noise of one to two dB are generally not perceptible, although it is widely accepted that people are able to begin to detect sound level increases of three dB in typical noisy environments. In addition, a five-dB increase is generally perceived as distinctly noticeable, and a 10-dB increase is generally perceived as a doubling of loudness. Accordingly, a doubling of sound energy (e.g., doubling the volume of traffic on a highway) that would result in a three-dB increase in sound would generally be perceived as barely detectable by the human ear.
2.1.2 Noise Descriptors
Noise in the daily human environment fluctuates over time; these changes can be minor or substantial, depending on individual factors. Specifically, noise fluctuations can be influenced by conditions such as: (1) whether noise levels occur in regular or random patterns; (2) if noise level fluctuations are rapid or slow; and (3) if noise levels vary widely or are relatively constant. Various noise descriptors have been developed to describe time-varying noise levels, with the following noise descriptors most commonly used in transportation noise analysis. Equivalent Sound Level (Leq) Leq represents an average of the sound energy occurring over a specified period. In effect, Leq is the steady-state sound level containing the same acoustical energy as the time-

Page 10 Beyer Community Park Project –Noise Technical Report_GR_Final_03312019
varying sound that actually occurs during the same period. The one-hour A-weighted equivalent sound level (Leq[h]), for example, is the energy average of A-weighted sound levels occurring during a one-hour period. One hour is the normal (default) assumed time period for Leq unless stated otherwise.
Table 1 - Typical Noise Levels
Common Outdoor Activities
Noise Level (dBA) Common Indoor Activities
110 Rock Band
Jet fly-over at 1,000 feet
100
Gas lawn mower at 3 feet
90
Diesel truck at 50 feet at 50 mph* Food blender at 3 feet
80 Garbage disposal at 3 feet
Noisy urban area, daytime
Gas lawn mower at 100 feet 70 Vacuum cleaner at 10 feet
Commercial area Normal speech at 3 feet
Heavy traffic at 300 feet 60
Large business office
Quiet urban daytime 50 Dishwasher in next room
Quiet urban nighttime 40 Theater, large conference room (background)
Quiet suburban nighttime
30 Library
Quiet rural nighttime Bedroom at night, concert hall (background)
20
Broadcast/recording studio
10
0 Source: California Department of Transportation, 2013.
Beyer Community Park Project –Noise Technical Report_GR_Final_07012018 Page 11
Percentile-Exceeded Sound Level (LXX) LXX represents the sound level exceeded for a given percentage of a specified period. For example, L10 is the sound level exceeded 10 percent of the time, and L90 is the sound level exceeded 90 percent of the time. Maximum Sound Level (Lmax) Lmax is the maximum sound level measured during a specified time period with “slow/1-second” time-averaging. Day-Night Level (Ldn) Ldn is the energy average of A-weighted sound levels occurring over a 24-hour period, with a 10-dB penalty applied to A-weighted sound levels occurring during nighttime hours between 10 PM and 7 AM Community Noise Equivalent Level (CNEL) Similar to Ldn, CNEL is the energy average of the A-weighted sound levels occurring over a 24-hour period, with a 10-dB penalty applied to A-weighted sound levels occurring during the nighttime hours between 10 PM and 7 AM, and a 5-dB penalty applied to the A-weighted sound levels occurring during evening hours between 7 PM and 10 PM.
2.2 Vibration
2.2.1 Fundamentals of Vibration
Vibration is defined as any oscillatory motion induced in a structure or mechanical device as a direct result of some type of input excitation. Sources of ground-borne vibrations include natural phenomena (earthquakes, volcanic eruptions, sea waves, landslides, etc.) or manmade (explosions, trains, machinery, traffic, construction equipment, etc.). Vibration sources may be transient, steady-state (continuous), or pseudo steady-state. Examples of transient construction vibrations are those that occur from blasting with explosives, impact pile driving, demolition, and wrecking balls. Ambient and source vibration information are expressed in terms of the peak particle velocity (PPV) in inches per second (in/sec). The root mean square (RMS) of a signal is the average of the squared amplitude of the signal in decibels (re 1 micro-inch per second). Because the net average of a vibration signal is zero, the RMS amplitude is used to describe the “smoothed” vibration amplitude. The RMS of a signal is the average of the squared amplitude of the signal. The RMS amplitude is always less than the PPV and is always positive. The RMS average is typically calculated over a one-second period.
2.2.2 Human Perception and Typical Levels of Ground-borne Vibration and Noise
The background vibration velocity level in residential areas is usually 50 vibration decibels (VdB) or lower; this is well below the level perceptible by humans, which is approximately 65 VdB. Most perceptible indoor vibration is caused by sources within buildings, such as operation of mechanical equipment, movement of people, or slamming of doors. Typical

Page 12 Beyer Community Park Project –Noise Technical Report_GR_Final_03312019
outdoor sources of perceptible ground-borne vibration are construction equipment, steel-wheeled trains, and traffic on rough roads. If the roadway is smooth, the vibration from traffic is rarely perceptible.

Beyer Community Park Project –Noise Technical Report_GR_Final_07012018 Page 13
3.0 REGULATORY FRAMEWORK
3.1 Federal Regulations
3.2.1 Federal Noise Control Act of 1972
The U.S. Environmental Protection Agency (EPA) Office of Noise Abatement and Control was originally established to coordinate federal noise control activities. After its inception, EPA’s Office of Noise Abatement and Control issued the Federal Noise Control Act of 1972, establishing programs and guidelines to identify and address the effects of noise on public health, welfare, and the environment. In response, the EPA published Information on Levels of Environmental Noise Requisite to Protect Public Health and Welfare with an Adequate Margin of Safety (Levels of Environmental Noise). The Levels of Environmental Noise recommended that the Ldn should not exceed 55 dBA outdoors or 45 dBA indoors to prevent significant activity interference and annoyance in noise-sensitive areas. In addition, the Levels of Environmental Noise identified five (5) dBA as an “adequate margin of safety” for a noise level increase relative to a baseline noise exposure level of 55 dBA Ldn (i.e., there would not be a noticeable increase in adverse community reaction with an increase of five dBA or less from this baseline level). The EPA did not promote these findings as universal standards or regulatory goals with mandatory applicability to all communities, but rather as advisory exposure levels below which there would be no risk to a community from any health or welfare effect of noise. In 1981, EPA administrators determined that subjective issues such as noise would be better addressed at lower levels of government. Consequently, in 1982 responsibilities for regulating noise control policies were transferred to State and local governments. However, noise control guidelines and regulations contained in EPA rulings in prior years remain in place by designated Federal agencies, allowing more individualized control for specific issues by designated Federal, State, and local government agencies.
3.2 State Regulations 3.2.1 California Noise Control Act of 1973
Sections 46000 through 46080 of the California Health and Safety Code, known as the California Noise Control Act of 1973, find that excessive noise is a serious hazard to the public health and welfare, and that exposure to certain levels of noise can result in physiological, psychological, and economic damage. The Act also finds that there is a continuous and increasing bombardment of noise in the urban, suburban, and rural areas. The Act declares that the State of California has a responsibility to protect the health and welfare of its citizens by the control, prevention, and abatement of noise. It is the policy of the state to provide an environment for all Californians free from noise that jeopardizes their health or welfare.

Page 14 Beyer Community Park Project –Noise Technical Report_GR_Final_03312019
3.2.2 California Environmental Quality Act of 1970 (CEQA)
Under CEQA, lead agencies are directed to assess conformance to local or other agency noise standards; measure and identify the potentially significant exposure of people to (or generation of) excessive ground-borne vibration or noise levels; and measure and identify potentially significant permanent or temporary increases in ambient noise levels. Implementation of CEQA ensures that during the decision-making stage of development, decision-makers and the public will be informed of any potentially excessive noise levels and available mitigation measures to reduce them to acceptable levels.
3.3 Local Regulations 3.3.1 City of San Diego General Plan, Noise Element
The Noise Element of the City of San Diego General Plan includes the following policies intended to minimize noise through standards, site planning, and noise mitigation. Noise and Land Use Compatibility Goal: Consider existing and future noise levels when making land use planning
decisions to minimize people’s exposure to excessive noise. Policies: NE-A.1. Separate excessive noise-generating uses from residential and other noise-
sensitive land uses with a sufficient spatial buffer of less sensitive uses. NE-A.2. Assure the appropriateness of proposed developments relative to existing and
future noise levels by consulting the guidelines for noise-compatible land use (shown on Table 2) to minimize the effects on noise-sensitive land uses.
NE-A.3. Limit future residential and other noise-sensitive land uses in areas exposed to
high levels of noise. NE-A.4. Require an acoustical study consistent with Acoustical Study Guidelines for
proposed developments in areas where the existing or future noise level exceeds or would exceed the “compatible” noise level thresholds as indicated on the Land Use-Noise Compatibility Guidelines (below), so that noise mitigation measures can be included in the proposed project design to meet the noise guidelines.
Acoustical Study Guidelines. An acoustical study should include, but is not limited to the following analysis: • Provide noise level measurements to describe existing local conditions and the
predominant noise sources.

Beyer Community Park Project –Noise Technical Report_GR_Final_07012018 Page 15
Table 2 - Land Use/Noise Compatibility Guidelines
Land Use Category Exterior Noise Exposure (dBA CNEL)
< 60 60-65 65-70 70-75 75+
Parks and Recreational
Parks; Active and Passive Recreation
Outdoor Spectator Sports; Golf Courses; Athletic Fields; Water Recreational Facilities; Indoor Recreational Facilities
Agricultural
Crop Raising & Farming; Aquaculture; Dairies; Horticulture Nurseries & Greenhouses; Animal Raising, Maintain & Keeping; Commercial Stables
Residential
Single Dwelling Units; Mobile Homes 45
Multiple Dwelling Units * For uses affected by aircraft noise, refer to General Plan Policies NE-D.2. and NE-D.3.
45 45*
Institutional
Hospitals; Nursing Facilities; Intermediate Care Facilities; Kindergarten through grade 12 Educational Facilities; Libraries; Museums; Child Care Facilities
45
Other Educational Facilities including Vocational/Trade Schools and Colleges; or Universities
45 45
Cemeteries
Retail Sales
Building Supplies/Equipment; Food, Beverages & Groceries; Pets & Pet Supplies; Sundries; Pharmaceutical, & Convenience Sales; Wearing Apparel & Accessories
50 50
Commercial Services
Building Services; Business Support; Eating & Drinking; Financial Institutions; Maintenance & Repair; Personal Services; Assembly & Entertainment (includes public and religious assembly); Radio & Television Studios; Golf Course Support
50 50
Visitor Accommodations 45 45 45
Offices
Business & Professional; Government; Medical, Dental & Health Practitioner; Regional & Corporate Headquarters
50 50
Vehicle and Vehicular Equipment Sales and Services Use
Commercial or Personal Vehicle Repair & Maintenance; Commercial or Personal Vehicle Sales & Rentals; Vehicle Equipment & Supplies; Sales & Rentals; Vehicle Parking

Page 16 Beyer Community Park Project –Noise Technical Report_GR_Final_03312019
Wholesale; Distribution; Storage Use Category
Equipment & Materials Storage Yards; Moving & Storage Facilities; Warehouse; Wholesale Distribution
Industrial
Heavy Manufacturing; Light Manufacturing; Marine Industry; Trucking & Transportation Terminals; Mining & Extractive Industries
Research and Development 50
Compatible Indoor Uses
Standard construction methods should attenuate exterior noise to an acceptable indoor noise level.
Outdoor
Uses Activities associated with the land use may be carried out.
45, 50 Conditionally Compatible Indoor Uses
Building structure must attenuate exterior noise to the indoor noise level indicated by the number (45 or 50) for occupied areas.
Outdoor
Uses
Feasible noise mitigation techniques should be analyzed and incorporated to make the outdoor activities acceptable.
Incompatible
Indoor Uses New construction should not be undertaken.
Outdoor
Uses Severe noise interference makes outdoor activities unacceptable.
Source: City of San Diego General Plan, 2008.
• Measure existing single event noise levels (SENEL, SEL, or Time Above) within airport influence areas.
• Estimate existing and projected noise levels (CNEL) and compare them to levels on
Table 2. For parks, may consider motor vehicle traffic measurements during the one-hour period where the worst-case traffic noise levels are expected to occur.
• Recommend appropriate mitigation measures to achieve acceptable noise levels on
Table 2.
• Estimate noise exposure levels with recommended mitigation measures.
• Describe a post-project assessment to evaluate the effectiveness of the proposed mitigation measures.
NE-A.5. Prepare noise studies to address existing and future noise levels from noise
sources that are specific to a community when updating community plans.

Beyer Community Park Project –Noise Technical Report_GR_Final_07012018 Page 17
Motor Vehicle Traffic Noise Goal: Minimal excessive motor vehicle traffic noise on residential and other noise-
sensitive land uses. Policies: NE-B.1. Encourage noise-compatible land uses and site planning adjoining existing and
future highways and freeways. NE-B.2. Consider traffic calming design, traffic control measures, and low-noise pavement
surfaces that minimize motor vehicle traffic noise. NE-B.3. Require noise reducing site design, and/or traffic control measures for new
development in areas of high noise to ensure that the mitigated levels meet acceptable decibel limits.
NE-B.4. Require new development to provide facilities which support the use of
alternative transportation modes such as walking, bicycling, carpooling and, where applicable, transit to reduce peak-hour traffic.
NE-B.5. Designate local truck routes to reduce truck traffic in noise-sensitive land uses
areas. NE-B.6. Work with Caltrans to landscape freeway-highway rights-of-way buffers and
install low noise pavement surfaces, berms, and noise barriers to mitigate state freeway and highway traffic noise.
NE-B.7. Promote the use of berms, landscaping, setbacks, and architectural design where
appropriate and effective, rather than conventional wall barriers to enhance aesthetics.
NE-B.8. Enforce the state vehicle code to ensure that motor vehicles are equipped with a
functioning muffler and are not producing excessive noise levels. NE-B.9. When parks are located in noisier areas, seek to reduce exposure through site
planning, including locating the most noise sensitive uses, such as children’s play areas and picnic tables, in the quieter areas of the site; and in accordance with the other policies of this section.
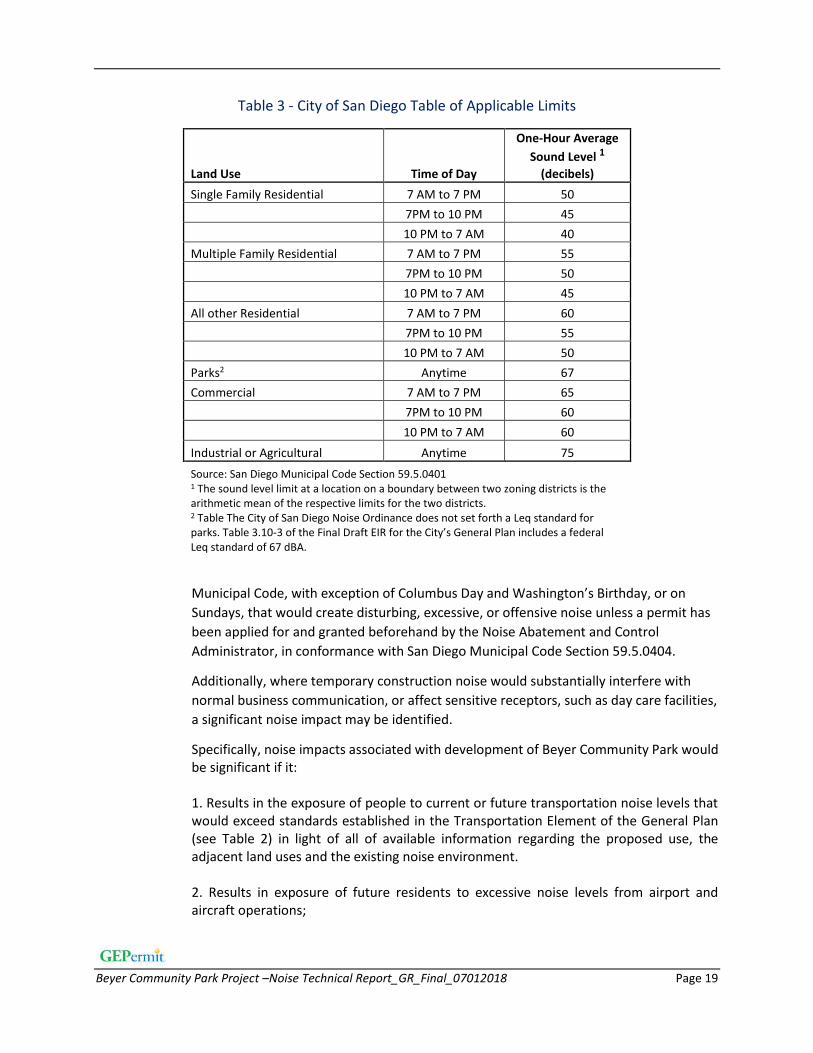
3.3.2 City of San Diego Municipal Code City of San Diego Municipal Code Chapter 5 Article 9.5, Noise Abatement and Control, declares that the making, creation, or continuance of excessive noises are detrimental to public health, comfort, convenience, safety, welfare, and prosperity of the residents of San Diego. Section 59.5.0401 establishes sound level limits. The exterior noise limits for each land use classification are summarized in Table 3, City of San Diego Table of
Page 18 Beyer Community Park Project –Noise Technical Report_GR_Final_03312019
Applicable Limits. One hour average sound levels are not to exceed the applicable limit given in this table. The noise subject to these limits is defined as part of the total noise at the specified location. Per San Diego Municipal Code Section 59.5.0404, construction noise levels measured at or beyond the property lines of any property zoned residential shall not exceed an average sound level greater than 75 dB during the 12-hour period from 7:00 AM to 7:00 PM Further, construction activity is prohibited between the hours of 7:00 PM of any day, and 7:00 AM of the following day, or on legal holidays as specified in Section 21.04 of the San Diego Municipal Code. Exceptions are allowed and subject to a permit granted by the Noise Abatement and Control Administrator.
3.3.2 City of San Diego California Environmental Quality Act Significance Determination Thresholds The City developed and published Significance Determination Thresholds for use in California Environmental Quality Act (CEQA) (City of San Diego 2016a). These thresholds, briefly discussed below, are used herein to evaluate potential noise impacts associated with development of Beyer Community Park. Noise is one factor to be considered in determining whether a new land use would be compatible with the existing land uses in any particular area. Land use compatibility noise factors are presented in Table 2. Compatible land uses are lightly shaded. Incompatible land uses are more darkly shaded. The transition zone between compatible and incompatible should be evaluated by the environmental planner to determine whether the use would be acceptable based on all available information and the extent to which the noise from the proposed project would affect the surrounding uses. The City’s CEQA Thresholds includes a discussion regarding compliance with the City’s Noise Ordinance. Specifically, a project which is likely to generate noise levels at the property line that exceed the City’s Noise Ordinance Standards (see Table 3) is considered potentially significant. If a non-residential use, such as a commercial, industrial or school use, is proposed to abut an existing residential use, the decibel level at the property line should be the arithmetic mean of the decibel levels allowed for each use as set forth in Section 59.5.0401 of the Municipal Code. Although the noise level above could be consistent with the City’s Noise Ordinance Standards, a noise level above 65 CNEL at the residential property line could be considered a significant environmental impact. The City’s CEQA Guidelines discuss thresholds regarding construction activities. Temporary construction noise which exceeds 75 dB (A) Leq at a sensitive receptor would be considered significant. Construction noise levels measured at or beyond the property lines of any property zoned residential shall not exceed an average sound level greater than 75-decibels (dB) during the 12-hour period from 7:00 AM to 7:00 PM. In addition, construction activity is prohibited between the hours of 7:00 PM of any day and 7:00 AM of the following day, or on legal holidays as specified in Section 21.04 of the San Diego
Beyer Community Park Project –Noise Technical Report_GR_Final_07012018 Page 19
Table 3 - City of San Diego Table of Applicable Limits
Land Use Time of Day
One-Hour Average
Sound Level 1
(decibels)
Single Family Residential 7 AM to 7 PM 50
7PM to 10 PM 45
10 PM to 7 AM 40
Multiple Family Residential 7 AM to 7 PM 55
7PM to 10 PM 50
10 PM to 7 AM 45
All other Residential 7 AM to 7 PM 60
7PM to 10 PM 55
10 PM to 7 AM 50
Parks2 Anytime 67
Commercial 7 AM to 7 PM 65
7PM to 10 PM 60
10 PM to 7 AM 60
Industrial or Agricultural Anytime 75
Source: San Diego Municipal Code Section 59.5.0401 1 The sound level limit at a location on a boundary between two zoning districts is the arithmetic mean of the respective limits for the two districts. 2 Table The City of San Diego Noise Ordinance does not set forth a Leq standard for parks. Table 3.10-3 of the Final Draft EIR for the City’s General Plan includes a federal Leq standard of 67 dBA.
Municipal Code, with exception of Columbus Day and Washington’s Birthday, or on
Sundays, that would create disturbing, excessive, or offensive noise unless a permit has
been applied for and granted beforehand by the Noise Abatement and Control
Administrator, in conformance with San Diego Municipal Code Section 59.5.0404.
Additionally, where temporary construction noise would substantially interfere with
normal business communication, or affect sensitive receptors, such as day care facilities,
a significant noise impact may be identified.
Specifically, noise impacts associated with development of Beyer Community Park would be significant if it: 1. Results in the exposure of people to current or future transportation noise levels that would exceed standards established in the Transportation Element of the General Plan (see Table 2) in light of all of available information regarding the proposed use, the adjacent land uses and the existing noise environment. 2. Results in exposure of future residents to excessive noise levels from airport and aircraft operations;
Page 20 Beyer Community Park Project –Noise Technical Report_GR_Final_03312019
3. Allows collocation of incompatible land uses (i.e. residential and industrial) where exposure of people to noise levels would likely exceed the City’s Noise Abatement and Control Ordinance (see Table 3).
3.3.3 City of San Diego Multiple Species Conservation Program
Page 48 of the Multiple Species Conservation Program, City of San Diego Multiple Species
Conservation Program (MSCP) Subarea Plan (1997) states that land uses that are within or
adjacent to the Multi-Habitat Planning Area (MHPA) should be designed to minimize noise
impacts. Berms or walls should be constructed adjacent to commercial areas, recreational areas,
and any other use that may introduce noises that could impact or interfere with wildlife utilization
of the MHPA.
Further, excessively noisy uses or activities adjacent to breeding areas must incorporate noise
reduction measures and be curtailed during the breeding season of sensitive species. Adequate
noise reduction measures should also be incorporated for the remainder of the year. For the
purposes of this study, and per direction from project biologists, 60 dBA Leq is the threshold for
potentially significant impacts to species within the MHPA.
4.0 EXISTING CONDITIONS
4.1 Noise Environment
The project site is located in an undeveloped area in the southeastern portion of the City of San Diego, approximately 560 feet east of Interstate 805 and approximately 555 feet northeast of the San Diego Trolley Line. Land uses adjacent to the site include single family residential to the north and vacant land to the south, east and west. Brown Field Airport is located approximately 2.3 miles northeast of the project site. Per the San Ysidro Community Plan Update Acoustic Analysis Technical Report (2016b), the average distance to the 65 CNEL noise contour along the I-805 is approximately 400 to 450 feet from the freeway centerline. The project site is not exposed to traffic noise levels associated with Interstate 805 that exceed what is considered normally acceptable for park uses per the City’s Land Use-Noise Compatibility Guidelines shown in Table 2. Noise levels associated with the San Diego Trolley (SDT) Blue Line along the railway corridor were calculated based on a noise prediction model from the San Diego Association of Governments’ (SANDAG’s) Noise and Vibration Impacts Technical Report for the Mid-Coast Corridor Transit Project (SANDAG 2014). The model calculated rail noise based on factors specific to the SDT Blue Line’s Light Rail Vehicle (LRV) operations. The modeled noise levels indicate that existing noise levels attributable to trolley operations is approximately 60 CNEL at 25 feet from the centerline of the tracks, which is within the trolley right-of-way (ROW). Trolley noise will not be what is considered normally acceptable for park uses per the City’s Land Use-Noise Compatibility Guidelines shown in Table 2.

Beyer Community Park Project –Noise Technical Report_GR_Final_07012018 Page 21
Serving as the Airport Land Use Commission (ALUC), the San Diego County Regional Airport Authority establishes the policies and criteria that affect properties in the AIA. Current policies addressing airport land use compatibility are contained in the ALUCP as amended in 2010 and are implemented by the Airport Approach and Airport Environs overlay zones of the San Diego Municipal Code. As depicted on ALUCP Exhibit III-1, Compatibility Policy Map: Noise, the project site is located outside of the 60-65 CNEL contour. While high elevation aircraft may pass over the site, the project site is not exposed to airport-related noise levels exceeding 60 CNEL.
4.2 Noise Measurements and Observations
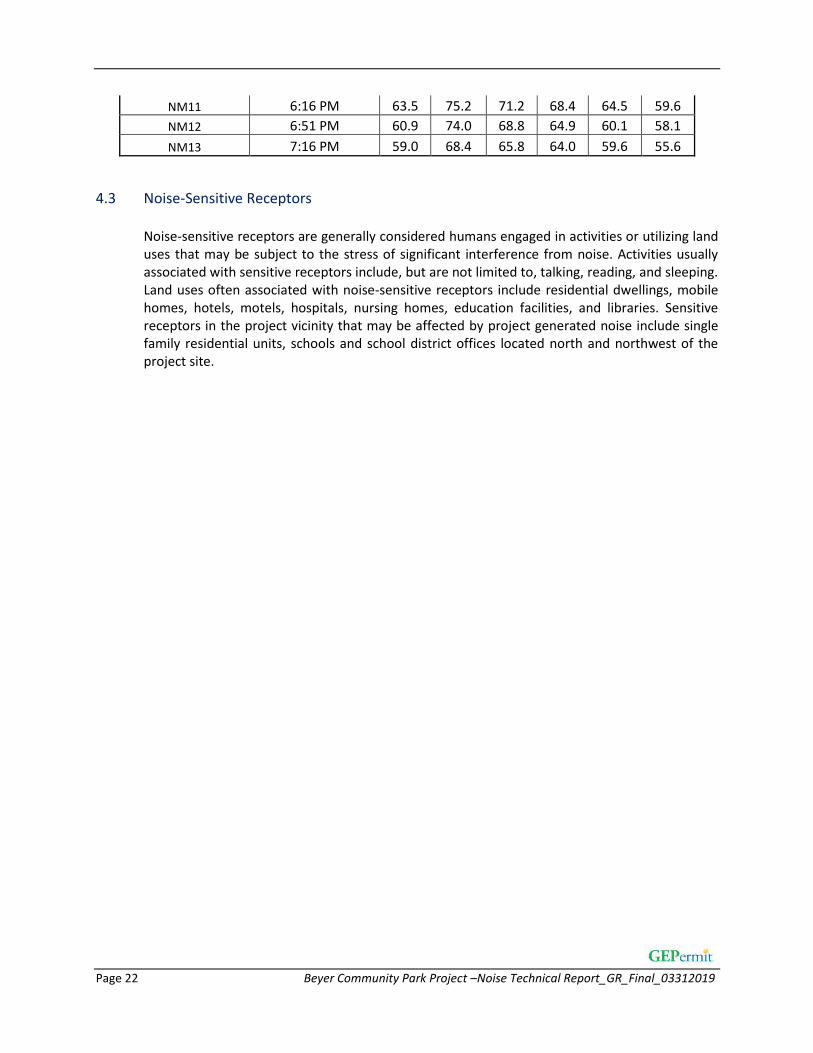
Thirteen 10-minute daytime noise measurements were taken in the project vicinity (see Figure 3) between 12:00 PM and 7:30 PM on April 8, 2018. Field worksheets and noise measurement output data are included in Appendix A. The following equipment was used to measure existing daytime noise levels in the study area:
• Larson Davis System Sound Track LxT sound level meter
• Larson Davis Model CA250 Calibrator
• Windscreen and tripod for the sound level meter The sound level meter was field-calibrated immediately prior to the noise measurements to ensure accuracy. All measurements were made with a meter that conforms to the American National Standards Institute (ANSI) specifications for sound level meters (ANSI SI.4-1983 R2001). All instruments were maintained with National Bureau of Standards traceable calibration per the manufacturers’ standards. The dominant noise source in the project area was background traffic noise associated with Interstate 805 and Interstate 5. Other noise sources included local vehicle traffic, rustling leaves, high altitude aircraft, emergency vehicles, bird song, after school activities and pedestrians. Ambient noise measurements ranged between 50.2 and 63.5 dBA Leq. Noise measurements are summarized in Table 4.
Table 4 - Short-Term Noise Measurement Summary (dBA)
Daytime
Site Location Time Started Leq Lmax L(2) L(8) L(25) L(50)
NM1 12:03 PM 53.3 64.3 58.7 55.5 53.2 52.2
NM2 12:31 PM 50.2 59.5 55.6 53.3 50.6 49.0
NM3 12:53 PM 56.0 76.8 64.3 54.5 51.5 49.6
NM4 1:17 PM 61.8 77.7 70.3 62.5 59.8 58.3
NM5 1:43 PM 61.6 78.1 71.3 64.8 60.5 56.5
NM6 2:18 PM 60.4 75.2 68.7 64.3 59.5 56.5
NM7 3:01 PM 53.9 61.0 56.7 55.4 54.5 53.7
NM8 3:31 PM 55.2 72.0 63.9 59.0 52.4 49.2
NM9 4:41 PM 52.0 71.9 59.6 52.4 48.6 46.7
NM10 5:57 PM 62.6 74.4 70.5 67.5 63.4 57.5
Page 22 Beyer Community Park Project –Noise Technical Report_GR_Final_03312019
NM11 6:16 PM 63.5 75.2 71.2 68.4 64.5 59.6
NM12 6:51 PM 60.9 74.0 68.8 64.9 60.1 58.1
NM13 7:16 PM 59.0 68.4 65.8 64.0 59.6 55.6
4.3 Noise-Sensitive Receptors
Noise-sensitive receptors are generally considered humans engaged in activities or utilizing land uses that may be subject to the stress of significant interference from noise. Activities usually associated with sensitive receptors include, but are not limited to, talking, reading, and sleeping. Land uses often associated with noise-sensitive receptors include residential dwellings, mobile homes, hotels, motels, hospitals, nursing homes, education facilities, and libraries. Sensitive receptors in the project vicinity that may be affected by project generated noise include single family residential units, schools and school district offices located north and northwest of the project site.

NM9
NM8
NM4
NM5
NM6
NM7
NM3
NM2
NM1
NM13
NM12
NM11
NM10
Beyer ParkFIGURE 3
Noise Measurement Locations
Date:
4/30/
2018
Autho
r: SOURCE: ESRI, Google Earth´Do
cumen
t Path
: C:\U
sers\U
ser\De
sktop
\Work
\GEPe
rmit\B
eyer B
lvd Fig
ure 3.m
xd
Noise Measurement Location
0 540 1,080 1,620 2,160270Feet
§̈¦805
Beyer Blvd
San Ysidro Middle School
Otay Mesa Rd
§̈¦5
STSTST
ST

Page 24 Beyer Community Park Project –Noise Technical Report_GR_Final_03312019
5.0 IMPACT ANALYSIS
5.1 Construction
Existing single-family detached residential dwelling units located north, west and southwest of the project site may be affected by short-term noise impacts associated the transport of workers, the movement of construction materials to and from the project site, ground clearing, excavation, grading, and building activities. Construction noise will vary depending on the construction process, type of equipment involved, location of the construction site with respect to sensitive receptors, the schedule proposed to carry out each task (e.g., hours and days of the week) and the duration of the construction work. Site preparation is expected to produce the highest sustained construction noise levels. Typical noise sources and noise levels associated with the site grading phase of construction are shown in Table 5. Typical operating cycles for these types of construction equipment may involve one or two minutes of full power operation followed by three to four minutes at lower power settings. Noise levels will be loudest during grading phase. A construction noise scenario was modeled using a version of the Federal Highway Administration’s Roadway Construction Noise Model (RCNM). RCNM utilizes standard noise emission levels for many different types of equipment and includes utilization percentage, impact, and shielding parameters. Noise modeling input parameters and output are provided in Appendix B. A likely worst-case construction noise scenario during grading assumes the use of a grader, a dozer, and two (2) excavators, two (2) backhoes and two (2) scrapers all operating simultaneously at the acoustical center of the project site. Assuming a usage factor of 40 percent for each piece of equipment, unmitigated noise levels at 50 feet from the acoustic center of the construction noise have the potential to reach 83 dBA Leq and 85 dBA Lmax during grading. Construction noise is not expected to exceed 75 dBA Leq past a distance of 200 feet from the acoustic center of the site or exceed 60 dBA Leq past a distance of 1,200 feet from the acoustic center of the project site. These noise levels however, would be short-term during grading activities of the northern portion of the project site and would quickly lessen as the activity moves further from the existing homes. Per San Diego Municipal Code Section 59.5.0404, construction noise levels measured at or beyond the property lines of any property zoned residential shall not exceed an average sound level greater than 75 dB during the 12-hour period from 7:00 AM to 7:00 PM Further, construction activity is prohibited between the hours of 7:00 PM of any day, and 7:00 AM of the following day, or on legal holidays as specified in Section 21.04 of the San Diego Municipal Code. Exceptions are allowed and subject to a permit granted by the Noise Abatement and Control Administrator. Measures to reduce noise levels associated with project construction are presented in Section 6.0 of this report. Implementation of these measures and adherence to the permitted hours for construction, will reduce construction levels to below significant.
A construction noise level of 83 dB(A) Leq at 50 feet would attenuate to 60 dB(A) Leq at approximately 1,200 feet. If construction noise exceeds 60 dBA Leq at occupied habitat within the MHPA during the breeding season, indirect impacts to noise sensitive wildlife species would be considered significant. Mitigation to minimize impacts are presented in Section 6 of this report.

Beyer Community Park Project –Noise Technical Report_GR_Final_07012018 Page 25
Table 5 – Typical Construction Equipment Noise Levels
Type of Equipment Range of Maximum
Sound Levels
Measured (dBA at
50 feet)
Suggested
Maximum Sound
Levels for Analysis
(dBA at 50 feet)
Rock Drills 83-99 96
Jack Hammers 75-85 82
Pneumatic Tools 78-88 85
Pumps 74-84 80
Dozers 77-90 85
Scrappers 83-91 87
Haul Trucks 83-94 88
Cranes 79-86 82
Portable Generators 71-87 80
Rollers 75-82 80
Tractors 77-82 80
Front-End Loaders 77-90 86
Hydraulic Excavators 81-90 86
Graders 79-89 86
Air Compressors 76-89 86
Trucks 81-87 86
Source: Bolt, Beranek & Newman; Noise Control for Buildings and Manufacturing Plants, 1987.
5.2 Vibration This impact discussion analyzes the potential for the proposed project to cause an exposure of
persons to or generation of excessive groundborne vibration or groundborne noise levels.
Vibration levels in the project area may be influenced by construction. A vibration impact would
generally be considered significant if it involves any construction-related or operations-related
impacts in excess of 0.2+ inches per second (in/sec) PPV.
The way in which vibration is transmitted through the earth is called propagation. Propagation of earthborn vibrations is complicated and difficult to predict because of the endless variations in the soil through which waves travel. There are three main types of vibration propagation: surface, compression and shear waves. Surface waves, or Raleigh waves, travel along the ground’s surface.
Page 26 Beyer Community Park Project –Noise Technical Report_GR_Final_03312019
These waves carry most of their energy along an expanding circular wave front, similar to ripples produced by throwing a rock into a pool of water. Compression waves, or P-waves, are body waves that carry their energy along an expanding spherical wave front. The particle motion in these waves is longitudinal (i.e., in a “push-pull” fashion). P-waves are analogous to airborne sound waves. Shear waves, or S-waves, are also body waves that carry energy along an expanding spherical wave front. However, unlike P-waves, the particle motion is transverse or “side-to-side and perpendicular to the direction of propagation”. As vibration waves propagate from a source, the energy is spread over an ever-increasing area such that the energy level striking a given point is reduced with the distance from the energy source. This geometric spreading loss is inversely proportional to the square of the distance. Wave energy is also reduced with distance as a result of material damping in the form of internal friction, soil layering, and void spaces. The amount of attenuation provided by material damping varies with soil type and condition as well as the frequency of the wave. Construction operations generally include a wide range of activities that can generate groundborne vibration. Vibratory compactors or rollers, pile drivers, and pavement breakers can generate perceptible amounts of vibration at up to 200 feet. Heavy trucks can also generate groundborne vibrations, which can vary depending on vehicle type, weight, and pavement conditions. Potholes, pavement joints, discontinuities, or the differential settlement of pavement all increase the vibration levels from vehicles passing over a road surface. Construction vibration is normally of greater concern than vibration from normal traffic flows on streets and freeways with smooth pavement conditions. Typically, particle velocity or acceleration (measured in gravities) is used to describe vibration. Table 6 shows the peak particle velocities (PPV) of some common construction equipment and Table 7 shows typical human reactions to various levels of PPV as well as the effect of PPV on buildings. Construction activity can result in varying degrees of ground vibration, depending on the equipment used on the site. Operation of construction equipment causes ground vibrations that spread through the ground and diminish in strength with distance. Buildings respond to these vibrations with varying results ranging from no perceptible effects at the low levels to slight damage at the highest levels. Table 6 gives approximate vibration levels for particular construction activities. This data provides a reasonable estimate for a wide range of soil conditions. The nearest existing structure to the project site is located approximately 50 feet north of the proposed disturbance area. As shown in Table 7, the threshold at which there may be a risk of architectural damage to normal houses with plastered walls and ceilings is 0.20 PPV in/second.

Beyer Community Park Project –Noise Technical Report_GR_Final_07012018 Page 27
Table 6 – Vibration Source Levels for Construction Equipment
Equipment Peak Particle Velocity Approximate
Vibration Level
(inches/second) at 25
feet
LV (dVB) at 25 feet
Pile driver (impact) 1.518 (upper range) 112
0.644 (typical) 104
Pile driver (sonic) 0.734 upper range 105
0.170 typical 93
Clam shovel drop (slurry wall) 0.202 94
Hydromill 0.008 in soil 66
(slurry wall) 0.017 in rock 75
Vibratory Roller 0.21 94
Hoe Ram 0.089 87
Large bulldozer 0.089 87
Caisson drill 0.089 87
Loaded trucks 0.076 86
Jackhammer 0.035 79
Small bulldozer 0.003 58
Source: Transit Noise and Vibration Impact Assessment, Federal Transit Administration, May 2006.

Page 28 Beyer Community Park Project –Noise Technical Report_GR_Final_03312019
Table 7 – Construction Equipment Vibration Levels and Effects on Humans and Buildings
Peak Particle Velocity (in/sec)
Effects Transient
Sources1
Continuous/Frequent
Intermittent Sources2
Potentially Damaged Structure Type
Extremely fragile historic buildings, ruins, ancient monuments 0.12 0.08
Fragile buildings 0.20 0.10
Historic and some old buildings 0.50 0.25
Older residential structures 0.50 0.30
New residential structures 1.00 0.50
Modern industrial/commercial buildings 2.00 0.50
Human Response
Barely perceptible 0.04 0.01
Distinctly perceptible 0.25 0.04
Strongly perceptible 0.90 0.10
Severe 2.00 0.40
Source: California Department of Transportation, 2004.
1 Transient sources create a single isolated vibration event, such as blasting and drop balls.
2 Continuous/frequent intermittent sources include impact pile drivers, vibratory pile drivers, and vibratory compaction
equipment.

Beyer Community Park Project –Noise Technical Report_GR_Final_07012018 Page 29
Primary sources of vibration during construction would be vibratory rollers or bulldozers. As shown in Table 6, a vibratory roller could produce 0.21 PPV at 25 feet or a large bulldozer could produce up to 0.089 PPV at 25 feet. At a distance of 50 feet (distance from project site property line to nearest residential structure) a vibratory roller would yield a worst-case 0.11 PPV (in/sec) and a large bull dozer would yield a worst-case 0.074 PPV (in/sec). Both activities would generate groundborne vibration below any risk of architectural damage. Calculation sheets are included in this report as Appendix C. Construction equipment is anticipated to be located at least 25 feet or more from any existing sensitive receptor. Temporary vibration levels associated with project construction would be less than significant. Annoyance related impacts would be short-term and would only occur during site grading and construction activities within 100 feet of a sensitive receptor. Impacts related to groundborne vibration would be less than significant.
5.3 Traffic Noise
Noise impacts associated with project generated vehicle traffic were assessed for the following roadways. The following trip generation, roadway classification, existing and projected trip volumes are summarized from the traffic study prepared for the project (STC Traffic 2018) except where stated otherwise. 5.3.1 Affected Roadways
Beyer Boulevard
Beyer Boulevard west of Otay Mesa Road to E. Beyer Boulevard is a four‐lane Collector
oriented in an east‐west direction. The posted speed limit west of Otay Mesa Road/E.
Beyer Boulevard is 35 mph.
Beyer Boulevard east of Otay Mesa Road to E. Beyer Boulevard is a two‐lane Sub‐
Collector. Currently the street ends where it intersects Enright Drive. According to Otay Mesa Community Plan Update, Beyer Boulevard will not be extended east. Sensitive receptors along Beyer Boulevard include single family homes adjacent to Beyer Boulevard between East of E. Byer Boulevard/Otay Mesa Road and an adult school at the northwest intersection of Byer Boulevard and Otay Mesa Road. There are currently 813 average daily trips (ADTs) along Beyer Boulevard east of E. Beyer Boulevard/Otay Mesa Road and 6,363 ADTs along Beyer Boulevard west of E. Beyer Boulevard/Otay Mesa Road. The proposed project will add 458 ADTs along Beyer Boulevard east of E. Beyer Boulevard/Otay Mesa Road and 366 ADTs on Beyer Boulevard between E. Beyer Boulevard/Otay Mesa Road and Interstate 805.
Page 30 Beyer Community Park Project –Noise Technical Report_GR_Final_03312019
Enright Drive
Enright Drive is a residential local street oriented in north‐south direction with cul‐
de‐sac to the south and intersecting Beyer Boulevard at the north end. A speed of 25
was utilized for modeling this road. There are multiple single family homes situated along Enright Drive. Although existing ADT volumes along Enright Drive were not provided in the traffic study, they can be estimated by calculating the existing trip generation by using the existing ADTs counted along Beyer Boulevard east of E. Beyer Boulevard/Otay Mesa Road (813) and dividing it by the number of existing single family homes that access Beyer Boulevard at this location. Using this methodology, there are currently 136 ADTs on Enright Drive. The proposed project is expected to add 229 ADTs along Enright Drive. Delaney Drive
Delany Drive is a residential local street oriented in north‐south direction with cul‐
de‐sac to the south and intersecting Beyer Boulevard at the north end. A speed of 25
was utilized for modeling this road. There are multiple single family homes situated along Delaney Drive. The traffic study also did not include existing ADT trip data for Delaney Drive. Using the methodology described above, there are currently 362 ADTs along Delaney Drive. The proposed project is expected to add 229 ADTs along Delaney Drive. E. Beyer Boulevard
E. Beyer Boulevard within the project study area is a two‐lane Collector oriented in the
north‐south direction. The posted speed limit is 35 mph. There are currently single and
multiple family homes located along the west side of E. Beyer Boulevard. The current ADT volume is 5,537. The project is expected to add 23 ADTs to E. Beyer Boulevard south of Beyer Boulevard. Otay Mesa Road
Otay Mesa Road within the project study area is a two‐lane Collector oriented in the
north‐south direction. The posted speed limit is 35 mph. There are schools (an adult
school and a middle school), school district offices and single family homes located along the Otay Mesa Road. The traffic study did not provide the current ADT volume for this roadway. The project is expected to add 69 ADTs along Otay Mesa Road north of Beyer Boulevard. Considering that hundreds of homes, a middle school, a high school and an adult school all take access or feed onto this roadway the project’s contribution of 69 ADTs will not result in a readily audible increase in noise levels.

Beyer Community Park Project –Noise Technical Report_GR_Final_07012018 Page 31
5.3.2 Project Generated Vehicle Traffic Noise
Noise levels projected for the affected road segments in this report were calculated using the methods in the Highway Noise Prediction Model published by the Federal Highway Administration as modified for CNEL and the “Calveno” energy curves (FHWA Highway Traffic Noise Prediction Model, FHWA-RD-77-108, December, 1978). The FHWA Model uses the traffic volume, vehicle mix, speed, and roadway geometry to compute the equivalent noise level. The FHWA Traffic Noise Prediction Model – FHWA-RD-77-108, was utilized to model existing and existing plus project noise levels at a distance of 50 feet from the centerline of each road segment. The resulting noise levels are for comparative purposes and are not intended to be utilized for land use compatibility assessment. The noise level difference between the existing condition and the existing condition with full project buildout under peak hour operations represents the greatest possible increase associated with project generated vehicle traffic. The project’s impact would only decrease as the project area is built out and more vehicles are added to the roadway system. A summary of the FHWA output is provided in Table 8. FHWA worksheets are included in Appendix D.
Table 8 – Change in Existing Traffic Noise Levels along Roadways as a Result of Project (CNEL)
Roadway Segment
CNEL at 50 Feet
Existing Without Project
Existing Plus
Project
Change in Noise
Level
Exceeds Applicable Noise
Land Use Compatibility
Standard?
Increase Greater than 3
dB?
Potential Significant
Impact
Beyer Boulevard
Interstate 805 to E. Beyer Boulevard /Otay Mesa Road
64.93 65.17 0.24 No (70 CNEL for
Adult School) No No
East of E. Beyer Boulevard/Otay Mesa Road
55.99 57.93 1.94 No (65 CNEL for
Single Family Residential)
No No
Enright Drive
South of Beyer Boulevard
45.43 49.72 4.29 No (65 CNEL for
Single Family Residential)
Yes No
Delaney Drive
South of Beyer Boulevard
49.69 51.82 2.13 No (65 CNEL for
Single Family Residential)
No No
E. Beyer Boulevard
South of Beyer Boulevard
64.33 64.34 0.01
No (65 CNEL for Single Family
Residential and 70 CNEL for Multiple
Family Residential)
No No
Project trip generation and distribution was obtained from the project’s Traffic Impact Analysis (STC Traffic 2018). A mix of 97 percent cars, 2 percent medium trucks and 1 percent heavy trucks was to model roads designated as collectors and smaller.

Page 32 Beyer Community Park Project –Noise Technical Report_GR_Final_03312019
As shown in Table 8, modeled existing traffic noise levels range between 45.43-64.93 CNEL and the modeled existing plus project traffic noise levels range between 49.72-65.17 CNEL at 50 feet from the centerline of each modeled road segment. Project generated vehicular trips from all of the modeled roadways segments with the exception of Enright Drive will result in nominal increases in ambient noise levels (less than 3 dB) over the existing condition and would not exceed the City’s 3 dB threshold discussed previously. Although project generated vehicle traffic will result in an increase of 4.3 CNEL along Enright Drive, the resulting noise level will not exceed the applicable noise/land use compatibility standard of 65 CNEL. Project generated vehicle noise would not result in substantial significant increases in ambient noise levels. No mitigation is required.
5.4 Operational Noise On-site noise sources associated with development of the proposed project will include vehicles starting and stopping, passenger loading and unloading; occasional car alarm activation, landscape maintenance, kids playing, fans shouting during games, skate park noise, ballfield/basketball noise, and noise associated with the dog park. These noise sources are discussed in more detail below. In order to determine if it is likely that the proposed commercial activities would violate Ordinance 59.5.0401 or the criteria outlined in the MSCP MHPA, noise associated with the proposed park was modeled using the SoundPLAN model. The SoundPLAN model arrives at a predicted noise level through a series of adjustments to the Reference Energy Mean Emission Level (REMEL). Adjustments are then made to the REMEL to account for total ADT, roadway classification, width, speed, and truck mix, roadway grade and site conditions (hard or soft surface). Areas adjacent to all modeled roadways were assumed to be “hard site”, a mix of hard soils and pavement. SoundPLAN input data is included as Appendix G. Noise reference levels were calibrated and adjusted appropriately for use in the SoundPLAN model. Parking Lot Noise The default noise levels calculated by SoundPLAN based on project trip generation and number of available parking spots was utilized to model noise associated with proposed parking lots. Noise levels with each parking lot vary depending on their size. Noise associated with parking lots include, but are not limited to idling cars, doors closing, and starting engine noise. Ballfield/Basketball Noise Sports areas within the parks would include sports fields and basketball courts for impromptu sports play, and noise levels from these areas would not include loudspeakers. Noise generated from the sports areas would consist of people conversing or yelling intermittently. The default SoundPLAN noise level for ball fields with substantial noise was used to represent these uses.
Beyer Community Park Project –Noise Technical Report_GR_Final_07012018 Page 33
Children’s Play Areas. The primary noise sources associated with children’s play areas are children and adult laughter and conversation, with occasional shouting or crying. The default SoundPLAN noise level was utilized to model noise associated with the proposed children’s play areas. Skate Park Noise Activities at skate park facilities typical involve the use of a combination of in line skates, skateboards, bicycles and scooters. The maximum noise output from skateboard parks is primarily associated with the thumps and bangs as skaters land on the horizontal platform sections. In comparison the curved sections are relatively quiet, probably because of the presence of rubber tire on the bicycles, skates and scooters and the fact that these sections are usually traversed with the vehicles in continual contact with the unit surface. The noise produced by a skate park will depend on the size of the park, the number and type of units installed on the site and the number of participants. GEPermit compiled and reviewed several studies with skate park measurement data. Noise level data taken at Sunnyvale Skate Park in Sunnyvale, California (Illingworth & Rodkin, Inc. 2011) was ultimately utilized to represent the proposed facility, as it was deemed to be the most representative. Noise measurements were conducted at the Sunnyvale Skatepark on Saturday, February 12, 2011 from 12:45 p.m. to 2:30 p.m. The surface area of the Sunnyvale skatepark is approximately 18,000 square feet and includes some similar features such as ramps, bowls, banks, quarter pipes, and grind rails. Based on observations, about 25 to 30 skateboarders were in the skatepark at any given time, of which, about 5 to 12 were actively skating at any given moment. According to a frequent visitor of the park, this level of use was about the busiest the skatepark gets. Four measurements (M1-M4) were made from beyond the north and northwest edge of the skatepark. M1 was made 75 feet north of the nearest edge of the skatepark and resulted in noise levels of 57 dBA Leq and 72 dBA Lmax. M2 was 60 feet northwest of the nearest edge of the skatepark and resulted in noise levels of 56 dBA Leq and 68 dBA Lmax. M3 was 75 feet northwest of the nearest edge of the skatepark and resulted in noise levels of 55 dBA Leq and 68 dBA Lmax. M4 was 13 feet north of the nearest edge of the skatepark and resulted in noise levels of 64 dBA Leq and 77 dBA Lmax. The Lmax noise levels at locations directly north of locations M1 and M4 were due to use of a grind rail, the northernmost feature of the skatepark. Dog Park Noise GEPermit staff visited several dog parks to make observations regarding the nature of noise at dog parks and noticed that dogs at dog parks are generally quiet because they are happy and bark only occasionally while playing. The type of annoying persistent barking that is often associated with neglected dogs that are left alone in backyards rarely occurs in supervised dog parks. GEPermit utilized measurement data taken at the Redhawk Dog Park in the City of Temecula (Kunzman Associates 2013) to represent noise associated with the proposed dog park in the SoundPLAN noise model. During measurements at Redhawk dog park, there were between 5 and 11 dogs present in each of the small and large dog areas. The measurement was 30-minutes in

Page 34 Beyer Community Park Project –Noise Technical Report_GR_Final_03312019
duration. The measurement recorded a Leq of 58.4 and an Lmax of 84.2 at a distance of 25 feet from the dog park gates where most of the noise occurs. Conclusions – Operational Noise Impacts As shown on Figures 4 and 5, park peak hour operational noise levels will reach up to 51.3 dB Leq at the closest sensitive receptor which is an adjacent single family home located directly north of the proposed park. Park peak hour noise levels at other nearby residences are expected to range between 35.3 to 49.8 dBA Leq; and reach up to 42.7 at the middle school located further to the north; and up to 37.6 at the adult school located northwest of the project site at the northwest corner of the intersection of Beyer Boulevard and Otay Mesa Road. The applicable City noise standards for park generated noise is shown in Table 3. Footnote 1, of Table 3 further clarifies that the sound level limit at a location on a boundary between two zoning districts is the arithmetic mean of the respective limits for the two districts. The arithmetic mean of the daytime standards for single family residential land uses and a park land uses is 58.5 dBA Leq; the evening standard is 56 dBA Leq; and the nighttime standard is 53.5. Project operational noise is not expected to exceed these standards at nearby residential land uses and is not expected to be audible at the existing middle school located to the north and the existing adult school located to the northeast. Project operational noise may reach up to 55.8 dBA Leq at adjacent residential land uses and will not exceed the daytime and evening standards. Although peak hour operations are unlikely to occur between the hours of 10:00 PM and 7:00 AM, a mitigation measure has been added to Section 6.0 of this report restricting the park hours of operation to between the hours of 7:00 AM and 10:00 PM to avoid violation of the City’s applicable nighttime noise standard. As shown in Figures 4 and 5, project operational noise is not expected to exceed 60 dBA Leq at the MSCP MHPA boundary. Project operational noise impacts associated with MHPA criteria would be less than significant. No mitigation related to project operational noise is required.

251.3
3
49.8
4
49.7
644.3
7
42.9
9
35.3
159.8
12 37.6
5
43.8
8
42.5
10
38.4
11
39.3
13 42.7
Figure 4
Beyer Community ParkPeak Operational Noise Levels(Leq)
Signs and symbolsProject SiteMHPAReceiverSkate Park, Play Areas, Sports Fields, Basketball Court and Dog ParkParking lot
1 57.3 49.82 58.3 50.83 59.3 51.8 Noise Levels
1 : 3000 100 200 400 600 8

Figure 5Beyer Community ParkPeak Operational Noise Contours(Leq)
Signs and symbolsProject SiteMHPASkate Park, Play Areas, Sports Fields, Basketball Court and Dog ParkParking lot
Levels in dB(A)<= 50
50 - 5252 - 5454 - 5656 - 5858 - 60
> 60
1 : 2000 50 100 200 300 400feet
Beyer Community Park Project –Noise Technical Report_GR_Final_07012018 Page 37
6.0 MITIGATION MEASURES
6.1 Operation The following mitigation measure shall be implemented to avoid violation of the City’s Noise Ordinance. 1. The hours of operation of Beyer Community Park shall be limited to between the hours
of 7:00 AM and 10:00 PM.
6.2 Construction Noise Reduction Measures In addition to adherence to the City of San Diego Municipal Code limiting the construction hours of operation, the following measures are recommended to reduce construction noise and vibrations, emanating from the proposed project: 1. During all project site excavation and grading on-site, construction contractors shall
equip all construction equipment, fixed or mobile, with properly operating and maintained mufflers, consistent with manufacturer standards.
2. The contractor shall place all stationary construction equipment so that emitted noise is
directed away from the noise sensitive receptors nearest the project site. 3. Equipment shall be shut off and not left to idle when not in use. 4. The contractor shall locate equipment staging in areas that will create the greatest
distance between construction-related noise/vibration sources and sensitive receptors nearest the project site during all project construction.
5. The project proponent shall mandate that the construction contractor prohibit the use
of music or sound amplification on the project site during construction. 6. The construction contractor shall limit haul truck deliveries to the same hours specified
for construction equipment. 7. Prior to the issuance of any construction permits for construction anticipated to occur
within 1,200 of occupied MHPA habitat, the City Manager (or appointed designee) shall verify that the MHPA boundaries and the following project requirements regarding the sensitive wildlife species are shown on the construction plans:
A qualified biologist (possessing a valid Endangered Species Act Section 10(a)(1)(A) recovery permit) shall survey those habitat areas within the MHPA that would be subject to construction noise levels exceeding 60 dB(A) hourly average for the presence of the sensitive wildlife species. Surveys shall be conducted pursuant to the protocol survey guidelines established by the U.S. Fish and Wildlife Service within the breeding season
Page 38 Beyer Community Park Project –Noise Technical Report_GR_Final_03312019
prior to the commencement of any construction. If noise sensitive species are present, then the following conditions must be met:
Between March 1 and August 15, no clearing, grubbing, or grading of sensitive habitat shall be permitted. Areas restricted from such activities shall be staked or fenced under the supervision of a qualified biologist; and
Between March 1 and August 15, no construction activities shall occur within any portion of the site where construction activities would result in noise levels exceeding a hourly equivalent noise level (Leq) of 60 dB(A) at the edge of occupied sensitive habitat. An analysis showing that noise generated by construction activities would not exceed 60 dBA Leq at the edge of occupied habitat must be completed by a qualified acoustician and approved by the City Manager at least two weeks prior to the commencement of construction activities. Prior to the commencement of construction activities during the breeding season, areas restricted from such activities shall be staked or fenced under the supervision of a qualified biologist; or
At least two weeks prior to the commencement of construction activities, noise attenuation measures (e.g., berms, walls) shall be implemented to ensure that noise levels resulting from construction activities will not exceed 60 dB(A) Leq at the edge of habitat occupied by the sensitive wildlife species. Concurrent with the commencement of construction activities and the construction of necessary noise attenuation facilities, noise monitoring shall be conducted, under the direction of a qualified acoustician, at the edge of the occupied habitat area to ensure that noise levels do not exceed 60 dBA Leq. If the noise attenuation techniques implemented are determined to be inadequate by measurement, then the associated construction activities shall cease until such time that adequate noise attenuation can be demonstrated, or until the end of the breeding season (August 16).

Beyer Community Park Project –Noise Technical Report_GR_Final_07012018 Page 39
If sensitive wildlife species are not detected during the protocol survey, the qualified biologist shall submit substantial evidence to the mayor and applicable resource agencies which demonstrates whether or not mitigation measures such as noise walls are necessary between March 1 and August 15 as follows:
If this evidence indicates the potential is high for sensitive wildlife species to be present based on historical records or site conditions, then condition shall be adhered to as specified above. If this evidence concludes that no impacts to this species are anticipated, no mitigation measures would be necessary.

Page 40 Beyer Community Park Project –Noise Technical Report_GR_Final_03312019
7.0 REFERENCES Bolt, Beranek & Newman 1987 Noise Control for Buildings and Manufacturing Plants. California Department of Transportation 2013 Transportation and Construction Vibration Guidance Manual. September. 2013 Technical Noise Supplement to the Traffic Noise Analysis Protocol. September. City of San Diego 1997 City of San Diego MSCP Subarea Plan. March. 2008 General Plan 2018 Municipal Code. Accessed on April 27. 2016a California Environmental Quality Act Significance Determination Thresholds. July 2016b San Ysidro Community Plan Update Acoustic Analysis Technical Report. Federal Transit Administration 2006 Transit Noise and Vibration Impact Assessment. May. Illingworth & Rodkin, Inc. 2015 Monterey Avenue Skatepark Project Noise and Vibration Assessment Capitola, California.
September 2. Kunzman Associates 2013 Noise Measurements at Temecula Redhawk Dog Park. August 24. RECON 2013 Noise Study for the Otay Mesa Community Plan Update San Diego Association of Governments (SANDAG) 2014 Noise and Vibration Impacts Technical Report for the Mid-Coast Corridor Transit Project. U.S. Department of Transportation. 2006 FHWA Roadway Construction Noise Model User’s Guide. January.

Beyer Community Park Project –Noise Technical Report_GR_Final_07012018
APPENDIX A

Noise Measurement Field Data
Beyer Park Noise Measurements Date: 4/18/18
NM1 3099 LxT_Data010.xlsx Technician: Roma Stromberg
Beyer Boulevard & Enright Drive
Residential to the west; vacant land to the north, east and west.
Weather: Clear blue sunny skies Settings: SLOW FAST (Circle one)
Temperature: 65 deg F Wind: 10 mph Humidity: 53% Terrain: Hilly
Start Time: 12:03 PM End Time: 12:13 PM Run Time: 10 minutes
Leq: 53.3 dB Interstate 805 and Interstate 5 Freeway traffic ambiance.
Lmax 64.3 dB
L2 58.7 dB Wind blowing through leaves in bushes, trash blowing in wind.
L8 55.5 dB Overhead propeller and higher altitude jet aircraft.
L25 53.2 dB Bird song and day crickets.
L50 52.2 dB 12:11 PM car drove by along dirt road, closest approach about 200 yards.
NOISE METER: SoundTrack LxT Class 1 CALIBRATOR: Larson Davis CAL250 Acoustic Calibrator
MAKE: Larson Davis MAKE: Larson Davis
MODEL: LxT1 MODEL: Cal250
SERIAL NUMBER: 3099 SERIAL NUMBER: 2723
6/23/17 FACTORY CALIBRATION DATE: 6/9/17
FIELD CALIBRATION DATE: 4/18/18
make rows 15‐20 height of
Primary Noise Source:
Secondary Noise Sources:
FACTORY CALIBRATION DATE:
Project Name:
Project #:
Noise Measurement #:
Nearest Address or Cross Street:Site Description (Type of Existing Land Use and any other notable features)
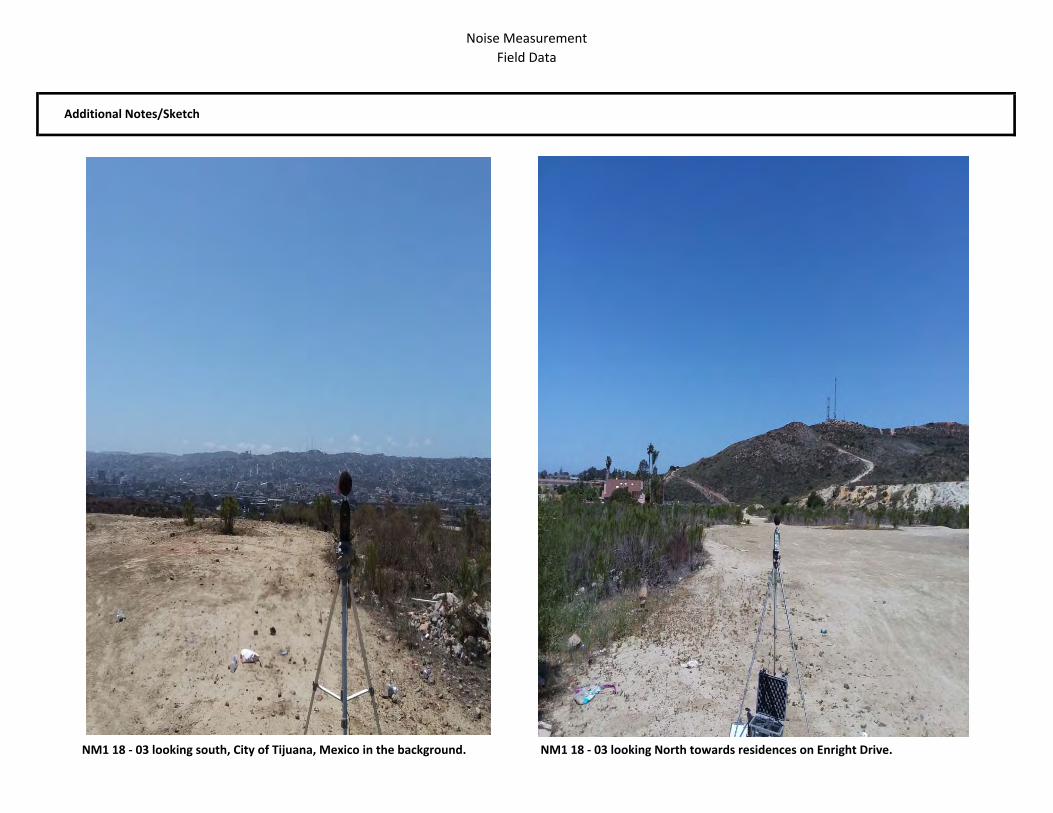
Noise Measurement Field Data
NM1 18 ‐ 03 looking south, City of Tijuana, Mexico in the background. NM1 18 ‐ 03 looking North towards residences on Enright Drive.
Additional Notes/Sketch

SummaryFile Name on Meter LxT_Data.010Serial Number 0003099Model SoundTrack LxT®Firmware Version 2.301User Roma StrombergLocation NM1 Note ( 1 x 10 minutes )MeasurementStart 2018‐04‐18 12:03:37Stop 2018‐04‐18 12:13:37Duration 00:10:00.0Run Time 00:10:00.0Pause 00:00:00.0Pre Calibration 2018‐04‐18 12:03:14Calibration Deviation ‐‐‐Overall SettingsRMS Weight A WeightingDetector SlowPreamp PRMLxT1LMicrophone Correction OffIntegration Method LinearOverload 122.4 dBResultsLAeq 53.3 dBLZpeak (max) 2018‐04‐18 12:11:08 111.0 dBLASmax 2018‐04‐18 12:05:50 64.3 dBLASmin 2018‐04‐18 12:09:17 49.5 dBLeq 53.3 dBLPeak(max) 2018/04/18 12:11:08 111.0 dB# Overloads 0StatisticsLAS2.00 58.7 dBLAS8.00 55.5 dBLAS25.00 53.2 dBLAS50.00 52.2 dBLAS66.60 51.6 dBLAS90.00 50.7 dB

Noise Measurement Field Data
Beyer Park Date: 18‐Apr‐18
NM2 3099 LxT_Data011.xlsx Technician: Roma Stromberg
2260 Enright Drive, San Diego CA
Vacant land to Southeast, residential to the Northwest
Weather: Clear blue sunny skies Settings: SLOW FAST (Circle one)
Temperature: 65 deg F Wind: 10 to 15mph Humidity: 53% Terrain: Hilly
Start Time: 12:31 PM End Time: 12:41 PM Run Time: 10 minutes
Leq: 50.2 dB Interstate 805 and Interstate 5 freeway traffic ambiance and other distant vehicular traffic.
Lmax 59.5 dB
L2 55.6 dB Wind blowing through leaves in bushes.
L8 53.3 dB Overhead propeller and higher altitude jet aircraft.
L25 50.6 dB Bird song
L50 49.0 dB 12:33 to 12:34PM distant ( >500 yards ) emergency vehicle siren
NOISE METER: SoundTrack LxT Class 1 CALIBRATOR: Larson Davis CAL250 Acoustic Calibrator
MAKE: Larson Davis MAKE: Larson Davis
MODEL: LxT1 MODEL: Cal250
SERIAL NUMBER: 3099 SERIAL NUMBER: 2723
6/23/2017 FACTORY CALIBRATION DATE: 6/9/2017
FIELD CALIBRATION DATE: 4/18/2018
Primary Noise Source:
Secondary Noise Sources:
FACTORY CALIBRATION DATE:
Project Name:
Project #:
Noise Measurement #:
Nearest Address or Cross Street:Site Description (Type of Existing Land Use and any other notable features)

Noise Measurement Field Data
NM2 18 ‐ 03 looking West across Enright Drive past 2260 Enright Drive. NM2 18 ‐ 03 looking South towards end of Enright Drive.
Additional Notes/Sketch

SummaryFile Name on Meter LxT_Data.011Serial Number 0003099Model SoundTrack LxT®Firmware Version 2.301User Roma StrombergLocation NM2 NoteMeasurementStart 2018‐04‐18 12:31:38Stop 2018‐04‐18 12:41:38Duration 00:10:00.0Run Time 00:10:00.0Pause 00:00:00.0Pre Calibration 2018‐04‐18 12:31:24Calibration Deviation ‐‐‐Overall SettingsRMS Weight A WeightingDetector SlowPreamp PRMLxT1LMicrophone Correction OffIntegration Method LinearOverload 122.5 dBResultsLAeq 50.2 dBLZpeak (max) 2018‐04‐18 12:32:16 104.0 dBLASmax 2018‐04‐18 12:41:25 59.5 dBLASmin 2018‐04‐18 12:39:02 45.2 dBLeq 50.2 dBLPeak(max) 2018/04/18 12:32:16 104.0 dB# Overloads 0StatisticsLAS2.00 55.6 dBLAS8.00 53.3 dBLAS25.00 50.6 dBLAS50.00 49.0 dBLAS66.60 48.2 dBLAS90.00 47.1 dB
( 1 x 10 minutes )
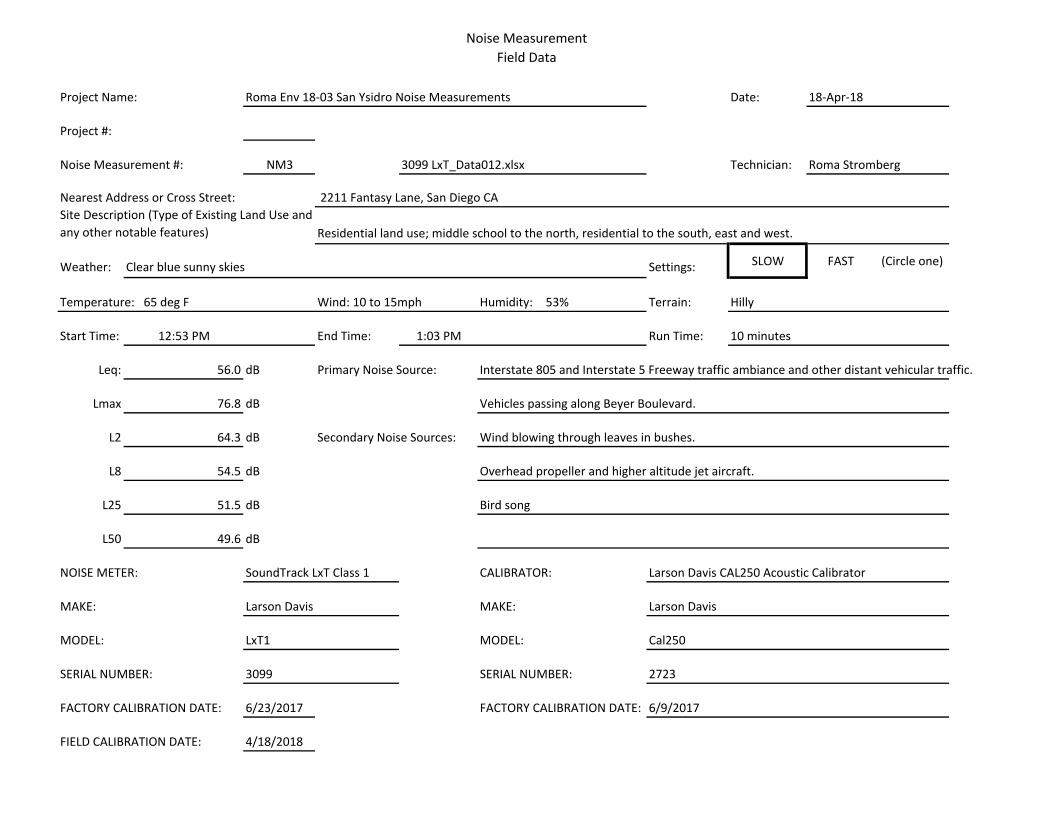
Noise Measurement Field Data
Roma Env 18‐03 San Ysidro Noise Measurements Date: 18‐Apr‐18
NM3 3099 LxT_Data012.xlsx Technician: Roma Stromberg
2211 Fantasy Lane, San Diego CA
Residential land use; middle school to the north, residential to the south, east and west.
Weather: Clear blue sunny skies Settings: SLOW FAST (Circle one)
Temperature: 65 deg F Wind: 10 to 15mph Humidity: 53% Terrain: Hilly
Start Time: 12:53 PM End Time: 1:03 PM Run Time: 10 minutes
Leq: 56.0 dB Interstate 805 and Interstate 5 Freeway traffic ambiance and other distant vehicular traffic.
Lmax 76.8 dB Vehicles passing along Beyer Boulevard.
L2 64.3 dB Wind blowing through leaves in bushes.
L8 54.5 dB Overhead propeller and higher altitude jet aircraft.
L25 51.5 dB Bird song
L50 49.6 dB
NOISE METER: SoundTrack LxT Class 1 CALIBRATOR: Larson Davis CAL250 Acoustic Calibrator
MAKE: Larson Davis MAKE: Larson Davis
MODEL: LxT1 MODEL: Cal250
SERIAL NUMBER: 3099 SERIAL NUMBER: 2723
6/23/2017 FACTORY CALIBRATION DATE: 6/9/2017
FIELD CALIBRATION DATE: 4/18/2018
Primary Noise Source:
Secondary Noise Sources:
FACTORY CALIBRATION DATE:
Project Name:
Project #:
Noise Measurement #:
Nearest Address or Cross Street:Site Description (Type of Existing Land Use and any other notable features)

Noise Measurement Field Data
NM3 18 ‐ 03 looking West down Beyer Blvd towards Otay Mesa Rd. NM3 18 ‐ 03 looking South ftom Beyer Blvd to 2211 Fantasy Lane residence.
Additional Notes/Sketch

SummaryFile Name on Meter LxT_Data.012Serial Number 0003099Model SoundTrack LxT®Firmware Version 2.301User Roma StrombergLocation NM3 NoteMeasurementStart 2018‐04‐18 12:53:51Stop 2018‐04‐18 13:03:51Duration 00:10:00.0Run Time 00:10:00.0Pause 00:00:00.0Pre Calibration 2018‐04‐18 12:53:37Calibration Deviation ‐‐‐Overall SettingsRMS Weight A WeightingDetector SlowPreamp PRMLxT1LMicrophone Correction OffIntegration Method LinearOverload 122.6 dBResultsLAeq 56.0 dBLZpeak (max) 2018‐04‐18 12:55:54 105.5 dBLASmax 2018‐04‐18 12:55:55 76.8 dBLASmin 2018‐04‐18 13:03:51 45.0 dBLeq 56.0 dBLPeak(max) 2018/04/18 12:55:54 105.5 dB# Overloads 0StatisticsLAS2.00 64.3 dBLAS8.00 54.5 dBLAS25.00 51.5 dBLAS50.00 49.6 dBLAS66.60 48.6 dBLAS90.00 46.6 dB
( 1 x 10 minutes )

Noise Measurement Field Data
Beyer Park Date: 18‐Apr‐18
NM4 3099 LxT_Data013.xlsx Technician: Roma Stromberg
Otay Mesa Road & Beyer Boulevard
Adult School; Residential to North and South, Interstate 805 to the West
Weather: Clear blue sunny skies Settings: SLOW FAST (Circle one)
Temperature: 65 deg F Wind: 10 to 15mph Humidity: 53% Terrain: Hilly
Start Time: 1:17 PM End Time: 1:27 PM Run Time: 10 minutes
Leq: 61.8 dB Interstate 805 and Interstate 5 Freeway traffic ambiance and other distant vehicular traffic.
Lmax 77.7 dB Vehicles passing along Beyer Boulevard & Otay Mesa Road.
L2 70.3 dB Wind blowing through leaves in bushes and trees.
L8 62.5 dB Overhead propeller and higher altitude jet aircraft.
L25 59.8 dB Bird song.
L50 58.3 dB Distant sound of San Diego Trolley and crossing warning bell.
NOISE METER: SoundTrack LxT Class 1 CALIBRATOR: Larson Davis CAL250 Acoustic Calibrator
MAKE: Larson Davis MAKE: Larson Davis
MODEL: LxT1 MODEL: Cal250
SERIAL NUMBER: 3099 SERIAL NUMBER: 2723
6/23/2017 FACTORY CALIBRATION DATE: 6/9/2017
FIELD CALIBRATION DATE: 4/18/2018
Primary Noise Source:
Secondary Noise Sources:
FACTORY CALIBRATION DATE:
Project Name:
Project #:
Noise Measurement #:
Nearest Address or Cross Street:Site Description (Type of Existing Land Use and any other notable features)

Noise Measurement Field Data
NM4 18 ‐ 03 looking East along Beyer Blvd towards Otay Mesa Rd. NM4 18 ‐ 03 looking West down Beyer Blvd.
Additional Notes/Sketch
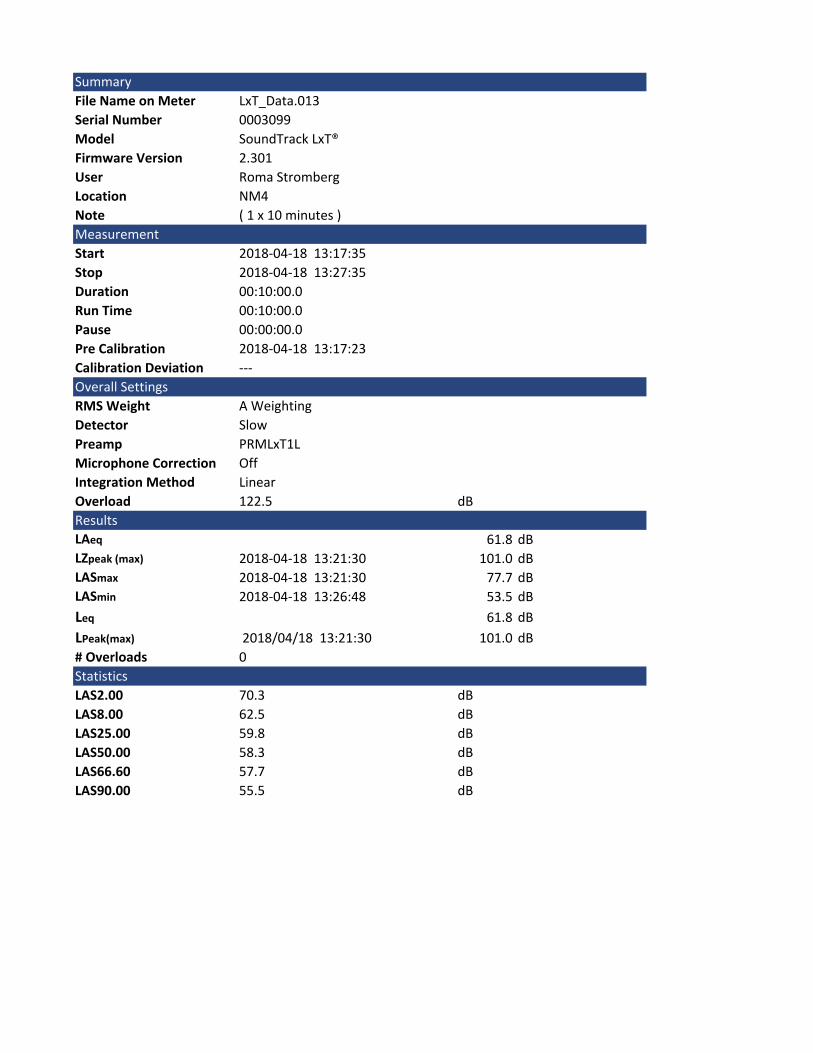
SummaryFile Name on Meter LxT_Data.013Serial Number 0003099Model SoundTrack LxT®Firmware Version 2.301User Roma StrombergLocation NM4 NoteMeasurementStart 2018‐04‐18 13:17:35Stop 2018‐04‐18 13:27:35Duration 00:10:00.0Run Time 00:10:00.0Pause 00:00:00.0Pre Calibration 2018‐04‐18 13:17:23Calibration Deviation ‐‐‐Overall SettingsRMS Weight A WeightingDetector SlowPreamp PRMLxT1LMicrophone Correction OffIntegration Method LinearOverload 122.5 dBResultsLAeq 61.8 dBLZpeak (max) 2018‐04‐18 13:21:30 101.0 dBLASmax 2018‐04‐18 13:21:30 77.7 dBLASmin 2018‐04‐18 13:26:48 53.5 dBLeq 61.8 dBLPeak(max) 2018/04/18 13:21:30 101.0 dB# Overloads 0StatisticsLAS2.00 70.3 dBLAS8.00 62.5 dBLAS25.00 59.8 dBLAS50.00 58.3 dBLAS66.60 57.7 dBLAS90.00 55.5 dB
( 1 x 10 minutes )

Noise Measurement Field Data
Beyer Park Date: 18‐Apr‐18
NM5 3099 LxT_Data014.xlsx Technician: Roma Stromberg
Otay Mesa Road & Beyer Boulevard
Adult School; vacant lot to the North, middle school to the east.
Weather: Clear blue sunny skies Settings: SLOW FAST (Circle one)
Temperature: 65 deg F Wind: 10 to 15mph Humidity: 53% Terrain: Hilly
Start Time: 1:43 PM End Time: 1:53 PM Run Time: 10 minutes
Leq: 61.6 dB Interstate 805 and Interstate 5 traffic ambiance and other distant vehicular traffic.
Lmax 78.1 dB Vehicles passing along Otay Mesa Road.
L2 71.3 dB Wind blowing through leaves in bushes and trees.
L8 64.8 dB Overhead propeller and higher altitude jet aircraft.
L25 60.5 dB Bird song.
L50 56.5 dB Distant sound of San Diego Trolley and crossing warning bell.
NOISE METER: SoundTrack LxT Class 1 CALIBRATOR: Larson Davis CAL250 Acoustic Calibrator
MAKE: Larson Davis MAKE: Larson Davis
MODEL: LxT1 MODEL: Cal250
SERIAL NUMBER: 3099 SERIAL NUMBER: 2723
6/23/2017 FACTORY CALIBRATION DATE: 6/9/2017
FIELD CALIBRATION DATE: 4/18/2018
Primary Noise Source:
Secondary Noise Sources:
FACTORY CALIBRATION DATE:
Project Name:
Project #:
Noise Measurement #:
Nearest Address or Cross Street:Site Description (Type of Existing Land Use and any other notable features)

Noise Measurement Field Data
NM5 18 ‐ 03 looking North up Otay Mesa Road. San Ysidro Adult School on left. NM5 18 ‐ 03 looking toward Otay Mesa Road. San Ysidro Adult School on right.
Additional Notes/Sketch

SummaryFile Name on Meter LxT_Data.014Serial Number 0003099Model SoundTrack LxT®Firmware Version 2.301User Roma StrombergLocation NM5 NoteMeasurementStart 2018‐04‐18 13:43:43Stop 2018‐04‐18 13:53:43Duration 00:10:00.0Run Time 00:10:00.0Pause 00:00:00.0Pre Calibration 2018‐04‐18 13:43:27Calibration Deviation ‐‐‐Overall SettingsRMS Weight A WeightingDetector SlowPreamp PRMLxT1LMicrophone Correction OffIntegration Method LinearOverload 122.6 dBResultsLAeq 61.6 dBLZpeak (max) 2018‐04‐18 13:48:30 99.6 dBLASmax 2018‐04‐18 13:48:29 78.1 dBLASmin 2018‐04‐18 13:46:51 49.8 dBLeq 61.6 dBLPeak(max) 2018/04/18 13:48:30 99.6 dB# Overloads 0StatisticsLAS2.00 71.3 dBLAS8.00 64.8 dBLAS25.00 60.5 dBLAS50.00 56.5 dBLAS66.60 54.6 dBLAS90.00 52.7 dB
( 1 x 10 minutes )

Noise Measurement Field Data
Beyer Park Date: 18‐Apr‐18
NM6 3099 LxT_Data015.xlsx Technician: Roma Stromberg
Otay Mesa Road & Otay Mesa Place
School district office parking lot; vacant land to Northeast, middle school to the South, Interstate 805 to the West
Weather: Clear blue sunny skies Settings: SLOW FAST (Circle one)
Temperature: 65 deg F Wind: 10 to 15mph Humidity: 53% Terrain: Hilly
Start Time: 2:18 PM End Time: 2:28 PM Run Time: 10 minutes
Leq: 60.4 dB Interstate 805 Freeway traffic ambiance and other distant vehicular traffic.
Lmax 75.2 dB Vehicles passing along Otay Mesa Road.
L2 68.7 dB Wind blowing through leaves in bushes and trees.
L8 64.3 dB Overhead propeller and higher altitude jet aircraft.
L25 59.5 dB Bird song. San Ysidro Middle School on East side of Otay Mesa Road, end of school
L50 56.5 dB day 2PM, some students still around at school during time of noise sample.
NOISE METER: SoundTrack LxT Class 1 CALIBRATOR: Larson Davis CAL250 Acoustic Calibrator
MAKE: Larson Davis MAKE: Larson Davis
MODEL: LxT1 MODEL: Cal250
SERIAL NUMBER: 3099 SERIAL NUMBER: 2723
6/23/2017 FACTORY CALIBRATION DATE: 6/9/2017
FIELD CALIBRATION DATE: 4/18/2018
Primary Noise Source:
Secondary Noise Sources:
FACTORY CALIBRATION DATE:
Project Name:
Project #:
Noise Measurement #:
Nearest Address or Cross Street:Site Description (Type of Existing Land Use and any other notable features)
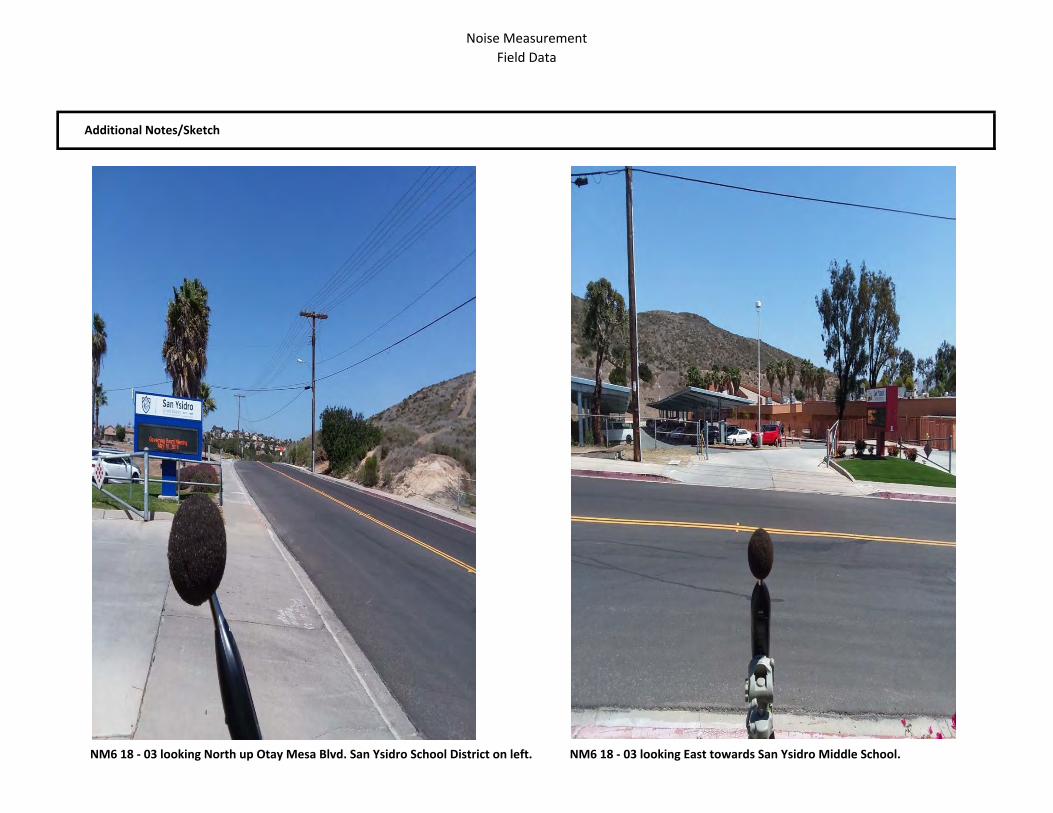
Noise Measurement Field Data
NM6 18 ‐ 03 looking North up Otay Mesa Blvd. San Ysidro School District on left. NM6 18 ‐ 03 looking East towards San Ysidro Middle School.
Additional Notes/Sketch

SummaryFile Name on Meter LxT_Data.015Serial Number 0003099Model SoundTrack LxT®Firmware Version 2.301User Roma StrombergLocation NM6 NoteMeasurementStart 2018‐04‐18 14:18:47Stop 2018‐04‐18 14:28:47Duration 00:10:00.0Run Time 00:10:00.0Pause 00:00:00.0Pre Calibration 2018‐04‐18 14:14:40Calibration Deviation ‐‐‐Overall SettingsRMS Weight A WeightingPeak Weight Z WeightingDetector SlowPreamp PRMLxT1LMicrophone Correction OffIntegration Method LinearOverload 122.5 dBResultsLAeq 60.4 dBLZpeak (max) 2018‐04‐18 14:19:14 100.8 dBLASmax 2018‐04‐18 14:28:03 75.2 dBLASmin 2018‐04‐18 14:21:40 50.9 dBLeq 60.4 60.4 dBLPeak(max) 2018/04/18 14:19:14 100.8 dB# Overloads 0StatisticsLAS2.00 68.7 dBLAS8.00 64.3 dBLAS25.00 59.5 dBLAS50.00 56.5 dBLAS66.60 55.1 dBLAS90.00 52.9 dB
( 1 x 10 miniutes )

Noise Measurement Field Data
Beyer Park Date: 18‐Apr‐18
NM7 3099 LxT_Data016.xlsx Technician: Roma Stromberg
Enright Drive & Beyer Boulevard, South East corner of San Ysidro Middle School.
Middle School Ballfield; Residential to the South, vacant land to the east
Weather: Mostly clear blue sunny skies, a little cloud. Settings: SLOW FAST (Circle one)
Temperature: 65 deg F Wind: 10 to 15mph Humidity: 53% Terrain: Hilly
Start Time: 3:01 PM End Time: 3:11 PM Run Time: 10 minutes
Leq: 53.9 dB Interstate 805 and Interstate 5 traffic ambiance and other distant vehicular traffic.
Lmax 61.0 dB
L2 56.7 dB Wind blowing through leaves in bushes and trees.
L8 55.4 dB Overhead propeller and higher altitude jet aircraft.
L25 54.5 dB Bird song.
L50 53.7 dB After school activities (football practice) occuring at San Ysidro Middle School.
NOISE METER: SoundTrack LxT Class 1 CALIBRATOR: Larson Davis CAL250 Acoustic Calibrator
MAKE: Larson Davis MAKE: Larson Davis
MODEL: LxT1 MODEL: Cal250
SERIAL NUMBER: 3099 SERIAL NUMBER: 2723
6/23/2017 FACTORY CALIBRATION DATE: 6/9/2017
FIELD CALIBRATION DATE: 4/18/2018
Primary Noise Source:
Secondary Noise Sources:
FACTORY CALIBRATION DATE:
Project Name:
Project #:
Noise Measurement #:
Nearest Address or Cross Street:Site Description (Type of Existing Land Use and any other notable features)

Noise Measurement Field Data
NM7 18 ‐ 03 looking West towards San Ysidro Middle School playing field. NM7 18 ‐ 03 looking Northwest across San Ysidro Middle School playing field.
Additional Notes/Sketch
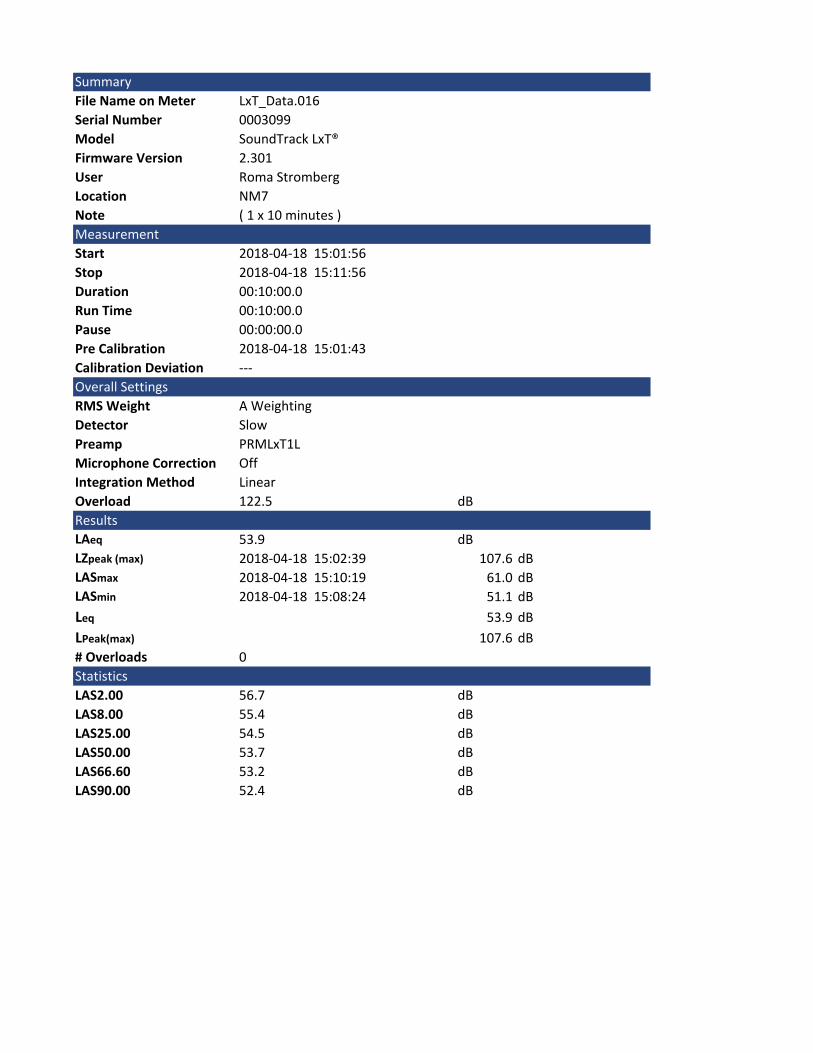
SummaryFile Name on Meter LxT_Data.016Serial Number 0003099Model SoundTrack LxT®Firmware Version 2.301User Roma StrombergLocation NM7 NoteMeasurementStart 2018‐04‐18 15:01:56Stop 2018‐04‐18 15:11:56Duration 00:10:00.0Run Time 00:10:00.0Pause 00:00:00.0Pre Calibration 2018‐04‐18 15:01:43Calibration Deviation ‐‐‐Overall SettingsRMS Weight A WeightingDetector SlowPreamp PRMLxT1LMicrophone Correction OffIntegration Method LinearOverload 122.5 dBResultsLAeq 53.9 dBLZpeak (max) 2018‐04‐18 15:02:39 107.6 dBLASmax 2018‐04‐18 15:10:19 61.0 dBLASmin 2018‐04‐18 15:08:24 51.1 dBLeq 53.9 dBLPeak(max) 107.6 dB# Overloads 0StatisticsLAS2.00 56.7 dBLAS8.00 55.4 dBLAS25.00 54.5 dBLAS50.00 53.7 dBLAS66.60 53.2 dBLAS90.00 52.4 dB
( 1 x 10 minutes )

Noise Measurement Field Data
Beyer Park Date: 18‐Apr‐18
NM8 3099 LxT_Data017.xlsx Technician: Roma Stromberg
Hawken Drive & Carbine Way
Residential to the Northwest, vacant land to the Southeast
Weather: Mostly clear blue sunny skies, a little cloud. Settings: SLOW FAST (Circle one)
Temperature: 65 deg F Wind: 10 to 15mph Humidity: 52% Terrain: Hilly
Start Time: 3:31 PM End Time: 3:41 PM Run Time: 10 minutes
Leq: 55.2 dB Vehicles travelling along Hawken Drive and Carbine Way
Lmax 72.0 dB Interstate 805, Intersate 905 traffic and other distant vehicular traffic ambiance.
L2 63.9 dB Wind blowing through leaves in bushes and trees.
L8 59.0 dB Overhead propeller and higher altitude jet aircraft.
L25 52.4 dB Bird song.
L50 49.2 dB Sounds like an avery ( cockatiels, parakeets ) within nearby residence.
NOISE METER: SoundTrack LxT Class 1 CALIBRATOR: Larson Davis CAL250 Acoustic Calibrator
MAKE: Larson Davis MAKE: Larson Davis
MODEL: LxT1 MODEL: Cal250
SERIAL NUMBER: 3099 SERIAL NUMBER: 2723
6/23/2017 FACTORY CALIBRATION DATE: 6/9/2017
FIELD CALIBRATION DATE: 4/18/2018
Primary Noise Source:
Secondary Noise Sources:
FACTORY CALIBRATION DATE:
Project Name:
Project #:
Noise Measurement #:
Nearest Address or Cross Street:Site Description (Type of Existing Land Use and any other notable features)

Noise Measurement Field Data
NM8 18 ‐ 03 looking North up Hawken Drive NM8 18 ‐ 03 looking South towards Otay Mesa Road.
Additional Notes/Sketch

SummaryFile Name on Meter LxT_Data.017Serial Number 0003099Model SoundTrack LxT®Firmware Version 2.301User Roma StrombergLocation NM8 NoteMeasurementStart 2018‐04‐18 15:31:20Stop 2018‐04‐18 15:41:20Duration 00:10:00.0Run Time 00:10:00.0Pause 00:00:00.0Pre Calibration 2018‐04‐18 15:31:09Calibration Deviation ‐‐‐Overall SettingsRMS Weight A WeightingDetector SlowPreamp PRMLxT1LMicrophone Correction OffIntegration Method LinearOverload 122.5 dBResultsLAeq 55.2 dBLZpeak (max) 2018‐04‐18 15:38:06 108.9 dBLASmax 2018‐04‐18 15:40:18 72.0 dBLASmin 2018‐04‐18 15:32:51 43.4 dBLeq 55.2 55.2 dBLPeak(max) 2018/04/18 15:38:06 108.9 dB# Overloads 0StatisticsLAS2.00 63.9 dBLAS8.00 59.0 dBLAS25.00 52.4 dBLAS50.00 49.2 dBLAS66.60 47.9 dBLAS90.00 46.2 dB
( 1 x 10 minutes )

Noise Measurement Field Data
Beyer Park Date: 18‐Apr‐18
NM9 3099 LxT_Data018.xlsx Technician: Roma Stromberg
Caliente Avenue & Airway Road, back of San Ysidro High School
Residential to the North and East, vacant land to the Southwest
Weather: Mostly clear blue sunny skies, a little cloud. Settings: SLOW FAST (Circle one)
Temperature: 65 deg F Wind: 5 to 10mph Humidity: 52% Terrain: Hilly
Start Time: 4:41 PM End Time: 4:51 PM Run Time: 10 minutes
Leq: 52.0 dB After school activities occuring on high school playing fields ( football, baseball )
Lmax 71.9 dB
L2 59.6 dB Wind blowing through leaves in bushes and trees.
L8 52.4 dB Overhead propeller and higher altitude jet aircraft.
L25 48.6 dB 4:49PM, High school athletes go jogging by chain link fence in front of
L50 46.7 dB microphone. Bird song.
NOISE METER: SoundTrack LxT Class 1 CALIBRATOR: Larson Davis CAL250 Acoustic Calibrator
MAKE: Larson Davis MAKE: Larson Davis
MODEL: LxT1 MODEL: Cal250
SERIAL NUMBER: 3099 SERIAL NUMBER: 2723
6/23/2017 FACTORY CALIBRATION DATE: 6/9/2017
FIELD CALIBRATION DATE: 4/18/2018
Primary Noise Source:
Secondary Noise Sources:
FACTORY CALIBRATION DATE:
Project Name:
Project #:
Noise Measurement #:
Nearest Address or Cross Street:Site Description (Type of Existing Land Use and any other notable features)

Noise Measurement Field Data
NM9 18 ‐ 03 looking North East across San Ysidro High School baseba NM9 18 ‐ 03 looking Southwest across parkland towards Airway Road.
Additional Notes/Sketch
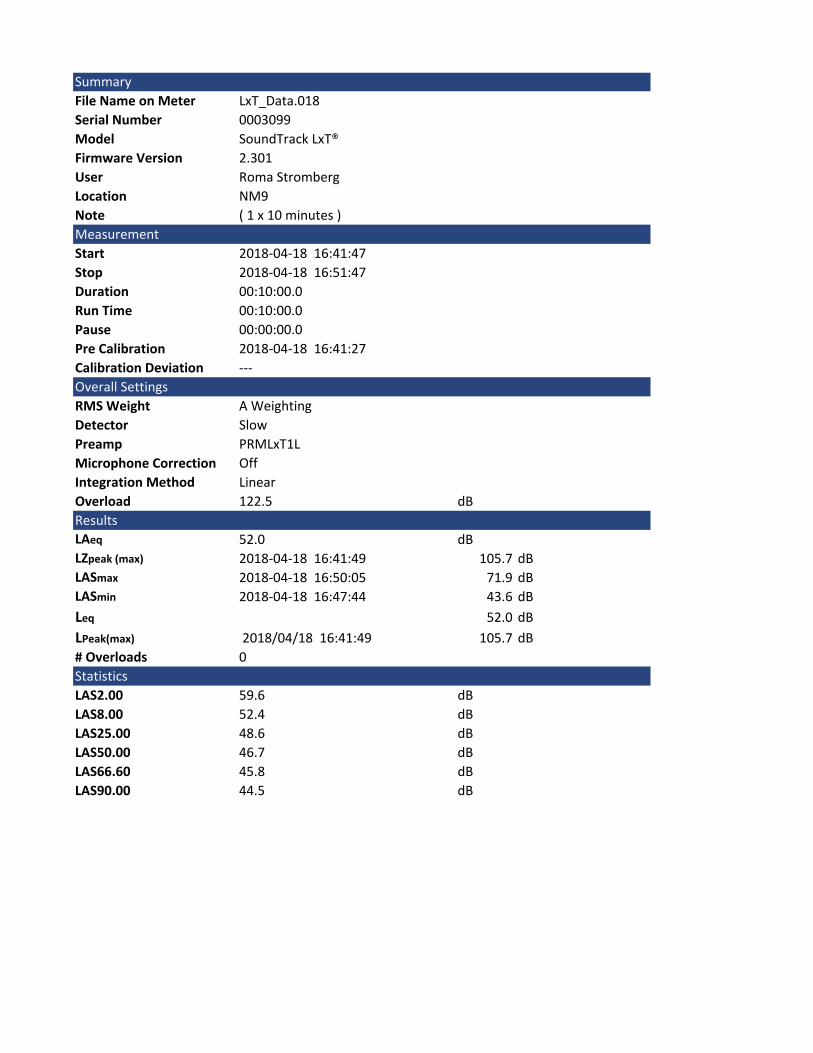
SummaryFile Name on Meter LxT_Data.018Serial Number 0003099Model SoundTrack LxT®Firmware Version 2.301User Roma StrombergLocation NM9 NoteMeasurementStart 2018‐04‐18 16:41:47Stop 2018‐04‐18 16:51:47Duration 00:10:00.0Run Time 00:10:00.0Pause 00:00:00.0Pre Calibration 2018‐04‐18 16:41:27Calibration Deviation ‐‐‐Overall SettingsRMS Weight A WeightingDetector SlowPreamp PRMLxT1LMicrophone Correction OffIntegration Method LinearOverload 122.5 dBResultsLAeq 52.0 dBLZpeak (max) 2018‐04‐18 16:41:49 105.7 dBLASmax 2018‐04‐18 16:50:05 71.9 dBLASmin 2018‐04‐18 16:47:44 43.6 dBLeq 52.0 dBLPeak(max) 2018/04/18 16:41:49 105.7 dB# Overloads 0StatisticsLAS2.00 59.6 dBLAS8.00 52.4 dBLAS25.00 48.6 dBLAS50.00 46.7 dBLAS66.60 45.8 dBLAS90.00 44.5 dB
( 1 x 10 minutes )

Noise Measurement Field Data
Beyer Park Date: 18‐Apr‐18
NM10 3099 LxT_Data019.xlsx Technician: Roma Stromberg
Mesa Avenue & East Beyer Boulevard
Surrounded by residential and vacant land uses.
Weather: Mostly clear blue sunny skies, a little cloud, sun starting to set, sunset at 7:20PM Settings: SLOW FAST (Circle one)
Temperature: 63 deg F Wind: Calm to 5mph Humidity: 55% Terrain: Hilly
Start Time: 5:57 PM End Time: 6:07 PM Run Time: 10 minutes
Leq: 62.6 dB Traffic travelling along East Beyer Boulevard.
Lmax 74.4 dB
L2 70.5 dB Wind gently rustling leaves in bushes and trees.
L8 67.5 dB Overhead propeller and higher altitude jet aircraft.
L25 63.4 dB San Diego Trolley bridge down Beyer Boulevard, 400 yards South of NM10.
L50 57.5 dB Bird song.
NOISE METER: SoundTrack LxT Class 1 CALIBRATOR: Larson Davis CAL250 Acoustic Calibrator
MAKE: Larson Davis MAKE: Larson Davis
MODEL: LxT1 MODEL: Cal250
SERIAL NUMBER: 3099 SERIAL NUMBER: 2723
6/23/2017 FACTORY CALIBRATION DATE: 6/9/2017
FIELD CALIBRATION DATE: 4/18/2018
Primary Noise Source:
Secondary Noise Sources:
FACTORY CALIBRATION DATE:
Project Name:
Project #:
Noise Measurement #:
Nearest Address or Cross Street:Site Description (Type of Existing Land Use and any other notable features)

Noise Measurement Field Data
NM10 18 ‐ 03 looking South down East Beyer Boulevard. NM10 18 ‐ 03 looking Northwest towards E. Beyer Blvd. & Mesa Avenue.
Additional Notes/Sketch

SummaryFile Name on Meter LxT_Data.019Serial Number 0003099Model SoundTrack LxT®Firmware Version 2.301User ROma StrombergLocation NM10 NoteMeasurementStart 2018‐04‐18 17:57:04Stop 2018‐04‐18 18:07:04Duration 00:10:00.0Run Time 00:10:00.0Pause 00:00:00.0Pre Calibration 2018‐04‐18 17:56:50Calibration Deviation ‐‐‐Overall SettingsRMS Weight A WeightingDetector SlowPreamp PRMLxT1LMicrophone Correction OffIntegration Method LinearOverload 122.5 dBResultsLAeq 62.6 dBLZpeak (max) 2018‐04‐18 17:59:56 98.6 dBLASmax 2018‐04‐18 17:59:59 74.4 dBLASmin 2018‐04‐18 17:59:13 51.4 dBLeq 62.6 dBLPeak(max) 2018/04/18 17:59:56 98.6 dB# Overloads 0StatisticsLAS2.00 70.5 dBLAS8.00 67.5 dBLAS25.00 63.4 dBLAS50.00 57.5 dBLAS66.60 54.9 dBLAS90.00 53.3 dB
( 1 x 10 minutes )
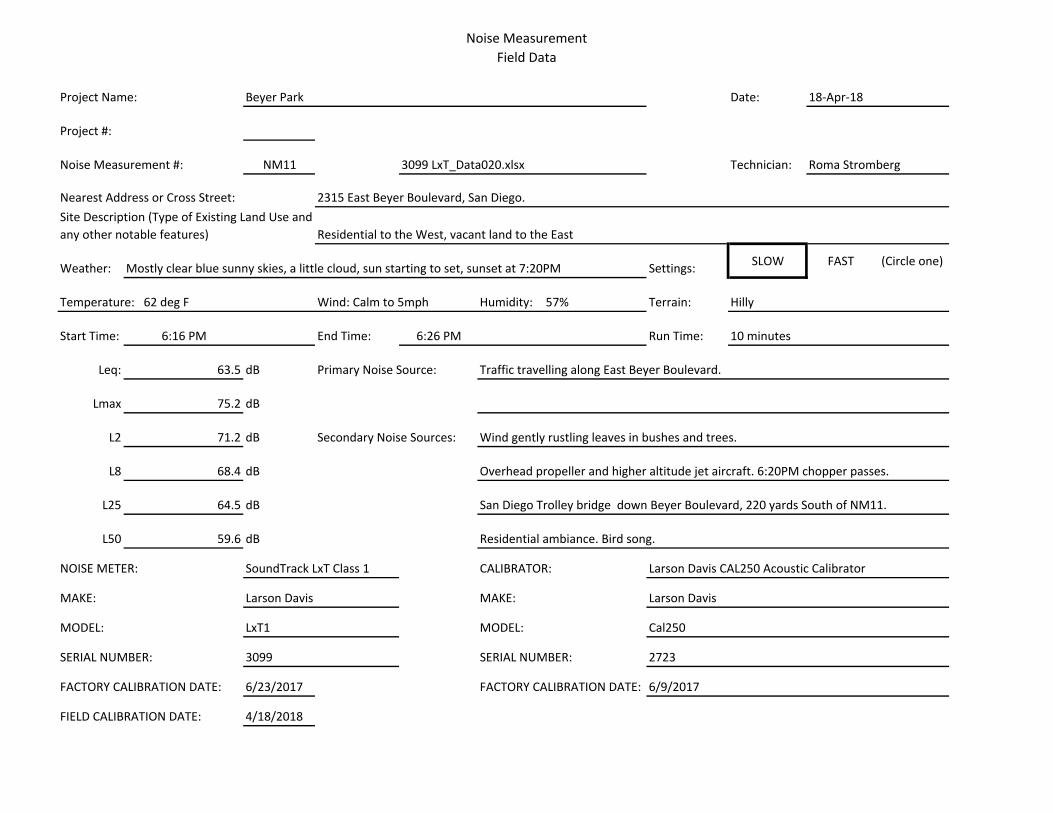
Noise Measurement Field Data
Beyer Park Date: 18‐Apr‐18
NM11 3099 LxT_Data020.xlsx Technician: Roma Stromberg
2315 East Beyer Boulevard, San Diego.
Residential to the West, vacant land to the East
Weather: Mostly clear blue sunny skies, a little cloud, sun starting to set, sunset at 7:20PM Settings: SLOW FAST (Circle one)
Temperature: 62 deg F Wind: Calm to 5mph Humidity: 57% Terrain: Hilly
Start Time: 6:16 PM End Time: 6:26 PM Run Time: 10 minutes
Leq: 63.5 dB Traffic travelling along East Beyer Boulevard.
Lmax 75.2 dB
L2 71.2 dB Wind gently rustling leaves in bushes and trees.
L8 68.4 dB Overhead propeller and higher altitude jet aircraft. 6:20PM chopper passes.
L25 64.5 dB San Diego Trolley bridge down Beyer Boulevard, 220 yards South of NM11.
L50 59.6 dB Residential ambiance. Bird song.
NOISE METER: SoundTrack LxT Class 1 CALIBRATOR: Larson Davis CAL250 Acoustic Calibrator
MAKE: Larson Davis MAKE: Larson Davis
MODEL: LxT1 MODEL: Cal250
SERIAL NUMBER: 3099 SERIAL NUMBER: 2723
6/23/2017 FACTORY CALIBRATION DATE: 6/9/2017
FIELD CALIBRATION DATE: 4/18/2018
Primary Noise Source:
Secondary Noise Sources:
FACTORY CALIBRATION DATE:
Project Name:
Project #:
Noise Measurement #:
Nearest Address or Cross Street:Site Description (Type of Existing Land Use and any other notable features)

Noise Measurement Field Data
NM11 18 ‐ 03 looking West towards residence. NM11 18 ‐ 03 looking South down East Beyer Boulevard.
Additional Notes/Sketch

SummaryFile Name on Meter LxT_Data.020Serial Number 0003099Model SoundTrack LxT®Firmware Version 2.301User Roma StrombergLocation NM11NoteMeasurementStart 2018‐04‐18 18:16:22Stop 2018‐04‐18 18:26:22Duration 00:10:00.0Run Time 00:10:00.0Pause 00:00:00.0Pre Calibration 2018‐04‐18 18:16:08Calibration Deviation ‐‐‐Overall SettingsRMS Weight A WeightingDetector SlowPreamp PRMLxT1LMicrophone Correction OffIntegration Method LinearOverload 122.5 dBResultsLAeq 63.5 dBLZpeak (max) 2018‐04‐18 18:25:57 97.3 dBLASmax 2018‐04‐18 18:25:57 75.2 dBLASmin 2018‐04‐18 18:16:44 46.8 dBLeq 63.5 dBLPeak(max) 2018/04/18 18:25:57 97.3 dB# Overloads 0StatisticsLAS2.00 71.2 dBLAS8.00 68.4 dBLAS25.00 64.5 dBLAS50.00 59.6 dBLAS66.60 54.7 dBLAS90.00 49.2 dB
( 1 x 10 minutes )

Noise Measurement Field Data
Beyer Park Date: 18‐Apr‐18
NM12 3099 LxT_Data021.xlsx Technician: Roma Stromberg
Hill Street & East Beyer Boulevard
Residential area; vacant land and Interstate 805 to the Northeast
Weather: Mostly clear blue sunny skies, a little cloud, sun starting to set, sunset at 7:20PM Settings: SLOW FAST (Circle one)
Temperature: 62 deg F Wind: Calm to 3mph Humidity: 60% Terrain: Hilly
Start Time: 6:51 PM End Time: 7:01 PM Run Time: 10 minutes
Leq: 60.9 dB Traffic travelling along East Beyer Boulevard.
Lmax 74.0 dB
L2 68.8 dB Backyard residence with at least four terrier dogs.
L8 64.9 dB Overhead propeller and higher altitude jet aircraft.
L25 60.1 dB San Diego Trolley line runs North East side behind houses on Hill Street.
L50 58.1 dB Residential ambiance. Bird song.
NOISE METER: SoundTrack LxT Class 1 CALIBRATOR: Larson Davis CAL250 Acoustic Calibrator
MAKE: Larson Davis MAKE: Larson Davis
MODEL: LxT1 MODEL: Cal250
SERIAL NUMBER: 3099 SERIAL NUMBER: 2723
6/23/2017 FACTORY CALIBRATION DATE: 6/9/2017
FIELD CALIBRATION DATE: 4/18/2018
Primary Noise Source:
Secondary Noise Sources:
FACTORY CALIBRATION DATE:
Project Name:
Project #:
Noise Measurement #:
Nearest Address or Cross Street:Site Description (Type of Existing Land Use and any other notable features)

Noise Measurement Field Data
NM12 18 ‐ 03 looking South East down Hill Street NM12 18 ‐ 03 looking Northeast up slope towards San Diego Trolley tracks.
Additional Notes/Sketch

SummaryFile Name on Meter LxT_Data.021Serial Number 0003099Model SoundTrack LxT®Firmware Version 2.301User Roma StrombergLocation NM12NoteMeasurementStart 2018‐04‐18 18:51:41Stop 2018‐04‐18 19:01:41Duration 00:10:00.0Run Time 00:10:00.0Pause 00:00:00.0Pre Calibration 2018‐04‐18 18:50:43Calibration Deviation ‐‐‐Overall SettingsRMS Weight A WeightingDetector SlowPreamp PRMLxT1LMicrophone Correction OffIntegration Method LinearOverload 122.5 dBResultsLAeq 60.9 dBLZpeak (max) 2018‐04‐18 18:53:53 92.2 dBLASmax 2018‐04‐18 18:53:53 74.0 dBLASmin 2018‐04‐18 18:54:09 51.5 dBLeq 60.9 dBLPeak(max) 2018/04/18 18:53:53 92.2 dB# Overloads 0StatisticsLAS2.00 68.8 dBLAS8.00 64.9 dBLAS25.00 60.1 dBLAS50.00 58.1 dBLAS66.60 57.3 dBLAS90.00 55.1 dB
( 1 x 10 minutes )

Noise Measurement Field Data
Beyer Park Date: 18‐Apr‐18
NM13 3099 LxT_Data022.xlsx Technician: Roma Stromberg
2641 East Beyer Boulevard, San Diego
Residential to the north, south, east and west.
Weather: Mostly clear blue sunny skies, a little cloud, sun starting to set, sunset at 7:20PM Settings: SLOW FAST (Circle one)
Temperature: 62 deg F Wind: Calm to 3mph Humidity: 60% Terrain: Hilly
Start Time: 7:16 PM End Time: 7:26 PM Run Time: 10 minutes
Leq: 59.0 dB Traffic travelling along East Beyer Boulevard.
Lmax 68.4 dB
L2 65.8 dB Overhead propeller and higher altitude jet aircraft.
L8 64.0 dB San Diego Trolley line runs North East side behind houses on East Beyer Boulevard.
L25 59.6 dB Residential ambiance.
L50 55.6 dB
NOISE METER: SoundTrack LxT Class 1 CALIBRATOR: Larson Davis CAL250 Acoustic Calibrator
MAKE: Larson Davis MAKE: Larson Davis
MODEL: LxT1 MODEL: Cal250
SERIAL NUMBER: 3099 SERIAL NUMBER: 2723
6/23/2017 FACTORY CALIBRATION DATE: 6/9/2017
FIELD CALIBRATION DATE: 4/18/2018
Primary Noise Source:
Secondary Noise Sources:
FACTORY CALIBRATION DATE:
Project Name:
Project #:
Noise Measurement #:
Nearest Address or Cross Street:Site Description (Type of Existing Land Use and any other notable features)
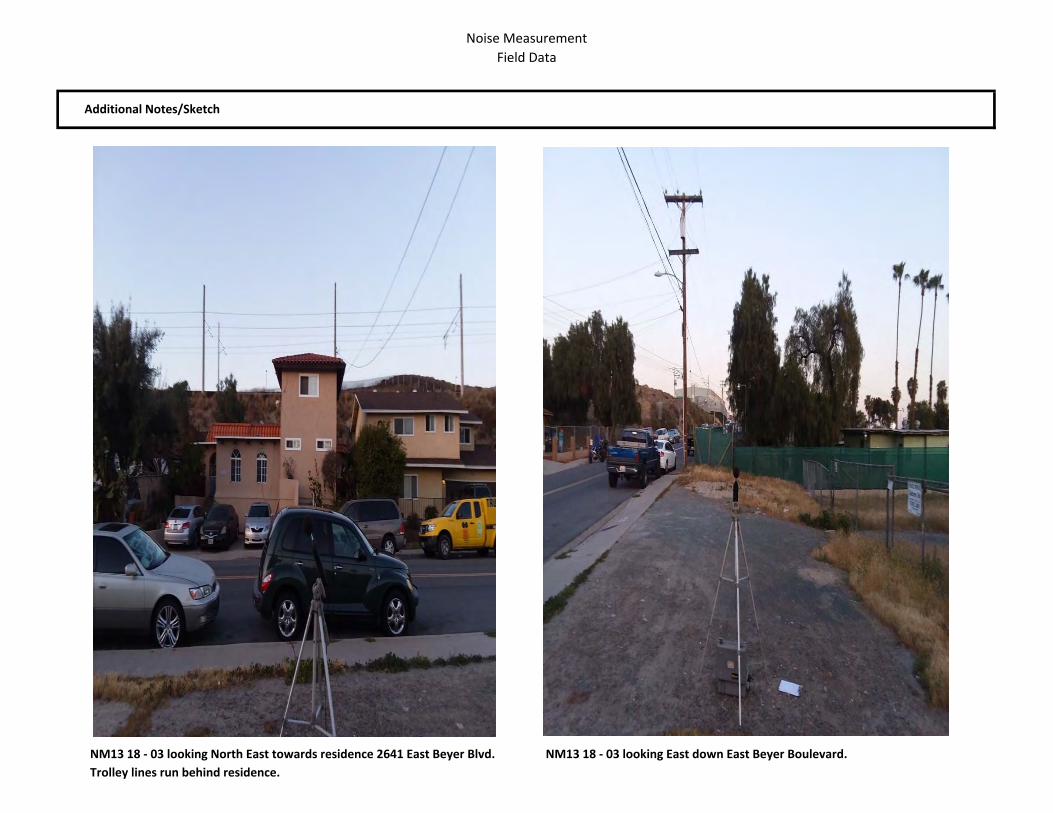
Noise Measurement Field Data
NM13 18 ‐ 03 looking North East towards residence 2641 East Beyer Blvd. NM13 18 ‐ 03 looking East down East Beyer Boulevard. Trolley lines run behind residence.
Additional Notes/Sketch

SummaryFile Name on Meter LxT_Data.022Serial Number 0003099Model SoundTrack LxT®Firmware Version 2.301User Roma StrombergLocation NM13 NoteMeasurementStart 2018‐04‐18 19:16:09Stop 2018‐04‐18 19:26:09Duration 00:10:00.0Run Time 00:10:00.0Pause 00:00:00.0Pre Calibration 2018‐04‐18 19:15:54Calibration Deviation ‐‐‐Overall SettingsRMS Weight A WeightingDetector SlowPreamp PRMLxT1LMicrophone Correction OffIntegration Method LinearOverload 122.4 dBResultsLAeq 59.0 dBLZpeak (max) 2018‐04‐18 19:19:16 90.3 dBLASmax 2018‐04‐18 19:22:08 68.4 dBLASmin 2018‐04‐18 19:19:27 51.1 dBLeq 59.0 dBLPeak(max) 2018/04/18 19:19:16 90.3 dB# Overloads 0StatisticsLAS2.00 65.8 dBLAS8.00 64.0 dBLAS25.00 59.6 dBLAS50.00 55.6 dBLAS66.60 54.4 dBLAS90.00 52.9 dB
( 1 x 10 minutes )

Beyer Community Park Project –Noise Technical Report_GR_Final_07012018
APPENDIX B
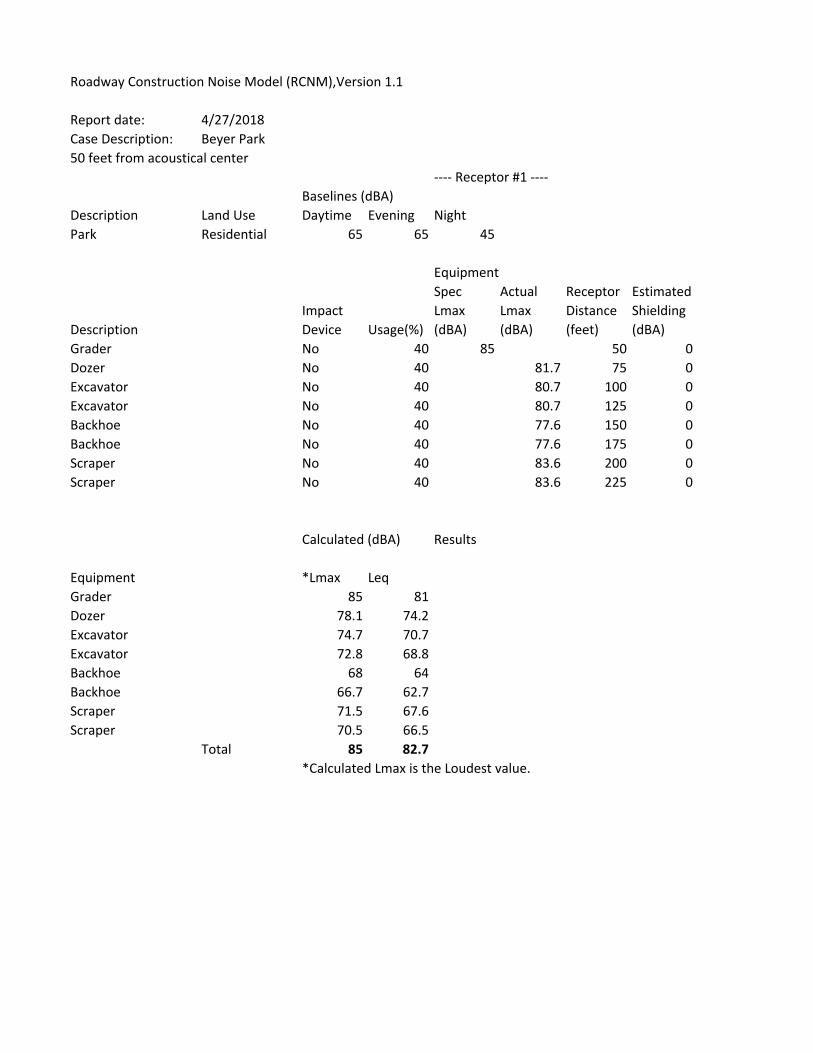
Report date: 4/27/2018Case Description: Beyer Park50 feet from acoustical center
‐‐‐‐ Receptor #1 ‐‐‐‐Baselines (dBA)
Description Land Use Daytime Evening NightPark Residential 65 65 45
EquipmentSpec Actual Receptor Estimated
Impact Lmax Lmax Distance ShieldingDescription Device Usage(%) (dBA) (dBA) (feet) (dBA)Grader No 40 85 50 0Dozer No 40 81.7 75 0Excavator No 40 80.7 100 0Excavator No 40 80.7 125 0Backhoe No 40 77.6 150 0Backhoe No 40 77.6 175 0Scraper No 40 83.6 200 0Scraper No 40 83.6 225 0
Calculated (dBA) Results
Equipment *Lmax LeqGrader 85 81Dozer 78.1 74.2Excavator 74.7 70.7Excavator 72.8 68.8Backhoe 68 64Backhoe 66.7 62.7Scraper 71.5 67.6Scraper 70.5 66.5
Total 85 82.7*Calculated Lmax is the Loudest value.
Roadway Construction Noise Model (RCNM),Version 1.1

Roadway Construction Noise Model (RCNM),Version 1.1
Report date: 7/2/2018Case Description: Beyer Park
‐‐‐‐ Receptor #1 ‐‐‐‐Baselines (dBA)
Description Land Use Daytime Evening NightResidential Residential 65 65 45
EquipmentSpec Actual Receptor Estimated
Impact Lmax Lmax Distance ShieldingDescription Device Usage(%) (dBA) (dBA) (feet) (dBA)Grader No 40 85 1200 0Dozer No 40 81.7 1200 0Excavator No 40 80.7 1200 0Excavator No 40 80.7 1200 0Backhoe No 40 77.6 1200 0Backhoe No 40 77.6 1200 0Scraper No 40 83.6 1200 0Scraper No 40 83.6 1200 0
ResultsCalculated (dBA)
Equipment *Lmax LeqGrader 57.4 53.4Dozer 54.1 50.1Excavator 53.1 49.1Excavator 53.1 49.1Backhoe 50 46Backhoe 50 46Scraper 56 52Scraper 56 52
Total 57.4 59.5*Calculated Lmax is the Loudest value.

Roadway Construction Noise Model (RCNM),Version 1.1
Report date: 7/2/2018Case Description: Beyer Park
‐‐‐‐ Receptor #1 ‐‐‐‐Baselines (dBA)
Description Land Use Daytime Evening NightResidential Residentia 65 65 45
EquipmentSpec Actual Receptor Estimated
Impact Lmax Lmax Distance ShieldingDescription Device Usage(%) (dBA) (dBA) (feet) (dBA)Grader No 40 85 1200 0Dozer No 40 81.7 1200 0Excavator No 40 80.7 1200 0Excavator No 40 80.7 1200 0Backhoe No 40 77.6 1200 0Backhoe No 40 77.6 1200 0Scraper No 40 83.6 1200 0Scraper No 40 83.6 1200 0
Calculated (dBA) Results
Equipment *Lmax LeqGrader 57.4 53.4Dozer 54.1 50.1Excavator 53.1 49.1Excavator 53.1 49.1Backhoe 50 46Backhoe 50 46Scraper 56 52Scraper 56 52
Total 57.4 59.5*Calculated Lmax is the Loudest value.

Beyer Community Park Project –Noise Technical Report_GR_Final_07012018
APPENDIX C

Project: Beyer Park Date: 4/27/18
Source: Vibratory Roller
Scenario: Unmitigated
Location:
Address:PPV = PPVref(25/D)^n (in/sec)
Equipment = INPUT SECTION IN BLUE
Type
PPVref = 0.21 Reference PPV (in/sec) at 25 ft.
D = 50.00 Distance from Equipment to Receiver (ft)n = 1.10 Vibration attenuation rate through the ground
PPV = 0.098 IN/SEC OUTPUT IN RED
DATA OUT RESULTS
1 Vibratory Roller
Note: Based on reference equations from Vibration Guidance Manual, California Department of Transportation, 2006, pgs 38‐43.
VIBRATION LEVEL IMPACT
Project Site
DATA INPUT

Beyer Community Park Project –Noise Technical Report_GR_Final_07012018
APPENDIX D

Level w/o NP Level w. NPSource name Leq1 Leq1
dB(A) dB(A)1 Fl 55.2 0.0
1 52.9 0.02 44.6 0.0Children's Play Area 39.0 0.0Dog Park 35.9 0.0Skate Park 44.9 0.0Sports Fields 48.3 0.02 Fl 55.8 0.0
1 53.3 0.02 41.6 0.0Children's Play Area 39.3 0.0Dog Park 36.2 0.0Skate Park 45.2 0.0Sports Fields 50.4 0.03 Fl 49.9 0.0
1 44.0 0.02 34.8 0.0Children's Play Area 35.4 0.0Dog Park 34.5 0.0Skate Park 41.7 0.0Sports Fields 46.9 0.04 Fl 47.6 0.0
1 40.1 0.02 32.6 0.0Children's Play Area 33.8 0.0Dog Park 33.7 0.0Skate Park 40.4 0.0Sports Fields 44.8 0.05 Fl 44.5 0.0
1 35.1 0.02 29.0 0.0Children's Play Area 31.3 0.0Dog Park 31.8 0.0Skate Park 38.3 0.0Sports Fields 41.6 0.06 Fl 45.5 0.0
1 37.2 0.02 29.6 0.0Children's Play Area 32.3 0.0Dog Park 30.3 0.0Skate Park 39.0 0.0Sports Fields 42.8 0.07 Fl 44.9 0.0
1 37.6 0.02 35.1 0.0Children's Play Area 31.8 0.0Dog Park 31.2 0.0Skate Park 40.0 0.0Sports Fields 39.7 0.08 Fl 38.4 0.0
1 27.0 0.02 22.8 0.0Children's Play Area 26.0 0.0Dog Park 26.3 0.0Skate Park 33.8 0.0Sports Fields 34.8 0.09 Fl 39.5 0.0
1 27.8 0.02 21.8 0.0
Contribution Levels of the Receivers

Level w/o NP Level w. NPSource name Leq1 Leq1
dB(A) dB(A)Children's Play Area 25.5 0.0Dog Park 27.1 0.0Skate Park 34.6 0.0Sports Fields 36.4 0.010 Fl 39.2 0.0
1 22.6 0.02 19.8 0.0Children's Play Area 26.1 0.0Dog Park 32.2 0.0Skate Park 33.5 0.0Sports Fields 35.7 0.0
Contribution Levels of the Receivers
Kunzman Associates Inc. 1111 Town & Country Rd, Ste 34 Orange, CA 92868 USA

Level Frequency sp CorrectionsSource name Reference Leq1 500 Kwall CI CT
dB(A) Hz dB(A) dB(A) dB(A)Skate Park Meter - 68.5 - - -Children's Play Area Meter - 60.0 - - -Dog Park Meter - 62.0 - - -Sports Fields Meter - 60.0 - - -
Noise Emissions of Industry Sources

Low Moveme Separated LevelName Parking lot type noise Size per hour Road surface method
trolleys Leq1 dB(A)2 Visitors and staff - 24 car places 16.000 Asphaltic lanes no 79.71 Visitors and staff - 33 car places 21.000 Asphaltic lanes no 81.6
Noise Emissions of Parking Lot Traffic

Limit Level w/o NP Level w. NP Difference ConflictNo. Receiver name Building Floor Leq1 Leq1 Leq1 Leq1 Leq1 Leq2 Leq3 Lmax
side dB(A) dB(A) dB(A) dB(A) dB(A)1 1 Fl - 55.2 0.0 -55.2 - - - -2 2 Fl - 55.8 0.0 -55.8 - - - -3 3 Fl - 49.9 0.0 -49.9 - - - -4 4 Fl - 47.6 0.0 -47.6 - - - -5 5 Fl - 44.5 0.0 -44.5 - - - -6 6 Fl - 45.5 0.0 -45.5 - - - -7 7 Fl - 44.9 0.0 -44.9 - - - -8 8 Fl - 38.4 0.0 -38.4 - - - -9 9 Fl - 39.5 0.0 -39.5 - - - -
10 10 Fl - 39.2 0.0 -39.2 - - - -
Receiver List

Beyer Community Park Project –Noise Technical Report_GR_Final_07012018
APPENDIX E

FHWA Sound32 Spreadsheet
Existing Traffic Noise
Project: Beyer Community Park
Road: Beyer Boulevard
Segment: Interstate 805 to E. Byer Blvd./Otay Mesa Road to Int
DAYTIME EVENING NIGHTTIME ADT 6363.00
AUTOS M.TRUCKS H.TRUCKS AUTOS M.TRUCKS H.TRUCKS AUTOS M.TRUCKS H.TRUCKS SPEED 35.00
‐‐‐‐‐‐‐‐‐‐‐‐‐‐‐‐‐‐‐‐‐‐‐‐‐‐‐‐‐‐‐‐‐‐‐‐‐‐‐‐‐‐‐‐‐‐‐‐ ‐‐‐‐‐‐‐‐‐‐‐‐‐‐‐‐‐‐‐‐‐‐‐‐‐ ‐‐‐‐‐‐‐‐‐‐‐‐‐‐‐‐‐‐‐‐‐‐‐‐‐ ‐‐‐‐‐‐‐‐‐‐‐‐‐‐‐‐‐‐‐‐‐‐‐‐‐ ‐‐‐‐‐‐‐‐‐‐‐‐‐‐‐‐‐‐‐‐‐‐‐‐‐ ‐‐‐‐‐‐‐‐‐‐‐‐‐‐‐‐‐‐‐‐‐‐‐‐‐ ‐‐‐‐‐‐‐‐‐‐‐‐‐‐‐‐‐‐‐‐‐‐‐‐‐ ‐‐‐‐‐‐‐‐‐‐‐‐‐‐‐‐‐‐‐‐‐‐‐‐‐ ‐‐‐‐‐‐‐‐‐‐‐‐‐‐‐‐‐‐‐‐‐‐‐‐‐ ‐‐‐‐‐‐‐‐‐‐‐‐‐‐‐‐‐‐‐‐‐‐‐‐‐ DISTANCE 50.00
INPUT PARAMETERS
Vehicles per hour 390.24 4.77 1.86 288.39 0.85 0.85 72.24 6.36 2.47 % A 97.4
Speed in MPH 35.00 35.00 35.00 35.00 35.00 35.00 35.00 35.00 35.00
Left angle ‐90.00 ‐90.00 ‐90.00 ‐90.00 ‐90.00 ‐90.00 ‐90.00 ‐90.00 ‐90.00
Right angle 90.00 90.00 90.00 90.00 90.00 90.00 90.00 90.00 90.00 % MT 1.84
NOISE CALCULATIONS
Reference levels 65.11 74.83 80.05 65.11 74.83 80.05 65.11 74.83 80.05 % HT 0.74
ADJUSTMENTS
Flow 20.17 1.04 ‐3.06 18.85 ‐6.47 ‐6.46 12.84 2.29 ‐1.81
Distance ‐0.07 ‐0.07 ‐0.07 ‐0.07 ‐0.07 ‐0.07 ‐0.07 ‐0.07 ‐0.07 LEFT ‐90.00
Finite Roadway 0.00 0.00 0.00 0.00 0.00 0.00 0.00 0.00 0.00 RIGHT 90.00
Barrier 0.00 0.00 0.00 0.00 0.00 0.00 0.00 0.00 0.00
Grade 0.00 0.00 0.00 0.00 0.00 0.00 0.00 0.00 0.00 CNEL 64.93
Constant ‐25.00 ‐25.00 ‐25.00 ‐25.00 ‐25.00 ‐25.00 ‐25.00 ‐25.00 ‐25.00 DAY LEQ 61.22
LEQ 60.21 50.80 51.92 58.89 43.29 48.52 52.88 52.05 53.16 Day hour 89.00
Absorbtive? no
DAY LEQ 61.22 EVENING LEQ 59.38 NIGHT LEQ 57.49 Use hour? no
GRADE dB 0.00
CNEL 64.93

FHWA Sound32 Spreadsheet
Existing Plus Project Traffic Noise
Project: Beyer Community Park
Road: Beyer Boulevard
Segment: Interstate 805 to E. Byer Blvd./Otay Mesa Road to Int
DAYTIME EVENING NIGHTTIME ADT 6728.93
AUTOS M.TRUCKS H.TRUCKS AUTOS M.TRUCKS H.TRUCKS AUTOS M.TRUCKS H.TRUCKS SPEED 35.00
‐‐‐‐‐‐‐‐‐‐‐‐‐‐‐‐‐‐‐‐‐‐‐‐‐‐‐‐‐‐‐‐‐‐‐‐‐‐‐‐‐‐‐‐‐‐‐‐ ‐‐‐‐‐‐‐‐‐‐‐‐‐‐‐‐‐‐‐‐‐‐‐‐‐ ‐‐‐‐‐‐‐‐‐‐‐‐‐‐‐‐‐‐‐‐‐‐‐‐‐ ‐‐‐‐‐‐‐‐‐‐‐‐‐‐‐‐‐‐‐‐‐‐‐‐‐ ‐‐‐‐‐‐‐‐‐‐‐‐‐‐‐‐‐‐‐‐‐‐‐‐‐ ‐‐‐‐‐‐‐‐‐‐‐‐‐‐‐‐‐‐‐‐‐‐‐‐‐ ‐‐‐‐‐‐‐‐‐‐‐‐‐‐‐‐‐‐‐‐‐‐‐‐‐ ‐‐‐‐‐‐‐‐‐‐‐‐‐‐‐‐‐‐‐‐‐‐‐‐‐ ‐‐‐‐‐‐‐‐‐‐‐‐‐‐‐‐‐‐‐‐‐‐‐‐‐ ‐‐‐‐‐‐‐‐‐‐‐‐‐‐‐‐‐‐‐‐‐‐‐‐‐ DISTANCE 50.00
INPUT PARAMETERS
Vehicles per hour 412.69 5.05 1.96 304.98 0.90 0.90 76.39 6.73 2.62 % A 97.40
Speed in MPH 35.00 35.00 35.00 35.00 35.00 35.00 35.00 35.00 35.00
Left angle ‐90.00 ‐90.00 ‐90.00 ‐90.00 ‐90.00 ‐90.00 ‐90.00 ‐90.00 ‐90.00
Right angle 90.00 90.00 90.00 90.00 90.00 90.00 90.00 90.00 90.00 % MT 1.84
NOISE CALCULATIONS
Reference levels 65.11 74.83 80.05 65.11 74.83 80.05 65.11 74.83 80.05 % HT 0.74
ADJUSTMENTS
Flow 20.41 1.28 ‐2.82 19.10 ‐6.23 ‐6.21 13.08 2.53 ‐1.57
Distance ‐0.07 ‐0.07 ‐0.07 ‐0.07 ‐0.07 ‐0.07 ‐0.07 ‐0.07 ‐0.07 LEFT ‐90.00
Finite Roadway 0.00 0.00 0.00 0.00 0.00 0.00 0.00 0.00 0.00 RIGHT 90.00
Barrier 0.00 0.00 0.00 0.00 0.00 0.00 0.00 0.00 0.00
Grade 0.00 0.00 0.00 0.00 0.00 0.00 0.00 0.00 0.00 CNEL 65.17
Constant ‐25.00 ‐25.00 ‐25.00 ‐25.00 ‐25.00 ‐25.00 ‐25.00 ‐25.00 ‐25.00 DAY LEQ 61.46
LEQ 60.45 51.04 52.16 59.14 43.53 48.76 53.12 52.29 53.41 Day hour 89.00
Absorbtive? no
DAY LEQ 61.46 EVENING LEQ 59.63 NIGHT LEQ 57.74 Use hour? no
GRADE dB 0.00
CNEL 65.17

FHWA Sound32 Spreadsheet
Existing Traffic Noise
Project: Beyer Community Park
Road: Beyer Boulevard
Segment: East of E. Byer Blvd./Otay Mesa Road to Int
DAYTIME EVENING NIGHTTIME ADT 813.00
AUTOS M.TRUCKS H.TRUCKS AUTOS M.TRUCKS H.TRUCKS AUTOS M.TRUCKS H.TRUCKS SPEED 35.00
‐‐‐‐‐‐‐‐‐‐‐‐‐‐‐‐‐‐‐‐‐‐‐‐‐‐‐‐‐‐‐‐‐‐‐‐‐‐‐‐‐‐‐‐‐‐‐‐ ‐‐‐‐‐‐‐‐‐‐‐‐‐‐‐‐‐‐‐‐‐‐‐‐‐ ‐‐‐‐‐‐‐‐‐‐‐‐‐‐‐‐‐‐‐‐‐‐‐‐‐ ‐‐‐‐‐‐‐‐‐‐‐‐‐‐‐‐‐‐‐‐‐‐‐‐‐ ‐‐‐‐‐‐‐‐‐‐‐‐‐‐‐‐‐‐‐‐‐‐‐‐‐ ‐‐‐‐‐‐‐‐‐‐‐‐‐‐‐‐‐‐‐‐‐‐‐‐‐ ‐‐‐‐‐‐‐‐‐‐‐‐‐‐‐‐‐‐‐‐‐‐‐‐‐ ‐‐‐‐‐‐‐‐‐‐‐‐‐‐‐‐‐‐‐‐‐‐‐‐‐ ‐‐‐‐‐‐‐‐‐‐‐‐‐‐‐‐‐‐‐‐‐‐‐‐‐ ‐‐‐‐‐‐‐‐‐‐‐‐‐‐‐‐‐‐‐‐‐‐‐‐‐ DISTANCE 50.00
INPUT PARAMETERS
Vehicles per hour 49.86 0.61 0.24 36.85 0.11 0.11 9.23 0.81 0.32 % A 97.4
Speed in MPH 35.00 35.00 35.00 35.00 35.00 35.00 35.00 35.00 35.00
Left angle ‐90.00 ‐90.00 ‐90.00 ‐90.00 ‐90.00 ‐90.00 ‐90.00 ‐90.00 ‐90.00
Right angle 90.00 90.00 90.00 90.00 90.00 90.00 90.00 90.00 90.00 % MT 1.84
NOISE CALCULATIONS
Reference levels 65.11 74.83 80.05 65.11 74.83 80.05 65.11 74.83 80.05 % HT 0.74
ADJUSTMENTS
Flow 11.23 ‐7.90 ‐12.00 9.92 ‐15.40 ‐15.39 3.91 ‐6.65 ‐10.75
Distance ‐0.07 ‐0.07 ‐0.07 ‐0.07 ‐0.07 ‐0.07 ‐0.07 ‐0.07 ‐0.07 LEFT ‐90.00
Finite Roadway 0.00 0.00 0.00 0.00 0.00 0.00 0.00 0.00 0.00 RIGHT 90.00
Barrier 0.00 0.00 0.00 0.00 0.00 0.00 0.00 0.00 0.00
Grade 0.00 0.00 0.00 0.00 0.00 0.00 0.00 0.00 0.00 CNEL 55.99
Constant ‐25.00 ‐25.00 ‐25.00 ‐25.00 ‐25.00 ‐25.00 ‐25.00 ‐25.00 ‐25.00 DAY LEQ 52.28
LEQ 51.27 41.86 42.98 49.96 34.35 39.58 43.95 43.11 44.23 Day hour 89.00
Absorbtive? no
DAY LEQ 52.28 EVENING LEQ 50.45 NIGHT LEQ 48.56 Use hour? no
GRADE dB 0.00
CNEL 55.99

FHWA Sound32 Spreadsheet
Existing Plus Project Traffic Noise
Project: Beyer Community Park
Road: Beyer Boulevard
Segment: East of E. Byer Blvd./Otay Mesa Road to Int
DAYTIME EVENING NIGHTTIME ADT 1270.91
AUTOS M.TRUCKS H.TRUCKS AUTOS M.TRUCKS H.TRUCKS AUTOS M.TRUCKS H.TRUCKS SPEED 35.00
‐‐‐‐‐‐‐‐‐‐‐‐‐‐‐‐‐‐‐‐‐‐‐‐‐‐‐‐‐‐‐‐‐‐‐‐‐‐‐‐‐‐‐‐‐‐‐‐ ‐‐‐‐‐‐‐‐‐‐‐‐‐‐‐‐‐‐‐‐‐‐‐‐‐ ‐‐‐‐‐‐‐‐‐‐‐‐‐‐‐‐‐‐‐‐‐‐‐‐‐ ‐‐‐‐‐‐‐‐‐‐‐‐‐‐‐‐‐‐‐‐‐‐‐‐‐ ‐‐‐‐‐‐‐‐‐‐‐‐‐‐‐‐‐‐‐‐‐‐‐‐‐ ‐‐‐‐‐‐‐‐‐‐‐‐‐‐‐‐‐‐‐‐‐‐‐‐‐ ‐‐‐‐‐‐‐‐‐‐‐‐‐‐‐‐‐‐‐‐‐‐‐‐‐ ‐‐‐‐‐‐‐‐‐‐‐‐‐‐‐‐‐‐‐‐‐‐‐‐‐ ‐‐‐‐‐‐‐‐‐‐‐‐‐‐‐‐‐‐‐‐‐‐‐‐‐ ‐‐‐‐‐‐‐‐‐‐‐‐‐‐‐‐‐‐‐‐‐‐‐‐‐ DISTANCE 50.00
INPUT PARAMETERS
Vehicles per hour 77.95 0.95 0.37 57.61 0.17 0.17 14.43 1.27 0.49 % A 97.41
Speed in MPH 35.00 35.00 35.00 35.00 35.00 35.00 35.00 35.00 35.00
Left angle ‐90.00 ‐90.00 ‐90.00 ‐90.00 ‐90.00 ‐90.00 ‐90.00 ‐90.00 ‐90.00
Right angle 90.00 90.00 90.00 90.00 90.00 90.00 90.00 90.00 90.00 % MT 1.84
NOISE CALCULATIONS
Reference levels 65.11 74.83 80.05 65.11 74.83 80.05 65.11 74.83 80.05 % HT 0.74
ADJUSTMENTS
Flow 13.17 ‐5.95 ‐10.06 11.86 ‐13.46 ‐13.45 5.85 ‐4.71 ‐8.81
Distance ‐0.07 ‐0.07 ‐0.07 ‐0.07 ‐0.07 ‐0.07 ‐0.07 ‐0.07 ‐0.07 LEFT ‐90.00
Finite Roadway 0.00 0.00 0.00 0.00 0.00 0.00 0.00 0.00 0.00 RIGHT 90.00
Barrier 0.00 0.00 0.00 0.00 0.00 0.00 0.00 0.00 0.00
Grade 0.00 0.00 0.00 0.00 0.00 0.00 0.00 0.00 0.00 CNEL 57.93
Constant ‐25.00 ‐25.00 ‐25.00 ‐25.00 ‐25.00 ‐25.00 ‐25.00 ‐25.00 ‐25.00 DAY LEQ 54.22
LEQ 53.21 43.80 44.92 51.90 36.29 41.52 45.89 45.05 46.17 Day hour 89.00
Absorbtive? no
DAY LEQ 54.22 EVENING LEQ 52.39 NIGHT LEQ 50.50 Use hour? no
GRADE dB 0.00
CNEL 57.93

FHWA Sound32 Spreadsheet
Existing Traffic Noise
Project: Beyer Community Park
Road: Enright Drive
Segment: South of Beyer Boulevard
DAYTIME EVENING NIGHTTIME ADT 136.00
AUTOS M.TRUCKS H.TRUCKS AUTOS M.TRUCKS H.TRUCKS AUTOS M.TRUCKS H.TRUCKS SPEED 25.00
‐‐‐‐‐‐‐‐‐‐‐‐‐‐‐‐‐‐‐‐‐‐‐‐‐‐‐‐‐‐‐‐‐‐‐‐‐‐‐‐‐‐‐‐‐‐‐‐ ‐‐‐‐‐‐‐‐‐‐‐‐‐‐‐‐‐‐‐‐‐‐‐‐‐ ‐‐‐‐‐‐‐‐‐‐‐‐‐‐‐‐‐‐‐‐‐‐‐‐‐ ‐‐‐‐‐‐‐‐‐‐‐‐‐‐‐‐‐‐‐‐‐‐‐‐‐ ‐‐‐‐‐‐‐‐‐‐‐‐‐‐‐‐‐‐‐‐‐‐‐‐‐ ‐‐‐‐‐‐‐‐‐‐‐‐‐‐‐‐‐‐‐‐‐‐‐‐‐ ‐‐‐‐‐‐‐‐‐‐‐‐‐‐‐‐‐‐‐‐‐‐‐‐‐ ‐‐‐‐‐‐‐‐‐‐‐‐‐‐‐‐‐‐‐‐‐‐‐‐‐ ‐‐‐‐‐‐‐‐‐‐‐‐‐‐‐‐‐‐‐‐‐‐‐‐‐ ‐‐‐‐‐‐‐‐‐‐‐‐‐‐‐‐‐‐‐‐‐‐‐‐‐ DISTANCE 50.00
INPUT PARAMETERS
Vehicles per hour 8.34 0.10 0.04 6.16 0.02 0.02 1.54 0.14 0.05 % A 97.4
Speed in MPH 25.00 25.00 25.00 25.00 25.00 25.00 25.00 25.00 25.00
Left angle ‐90.00 ‐90.00 ‐90.00 ‐90.00 ‐90.00 ‐90.00 ‐90.00 ‐90.00 ‐90.00
Right angle 90.00 90.00 90.00 90.00 90.00 90.00 90.00 90.00 90.00 % MT 1.84
NOISE CALCULATIONS
Reference levels 59.44 71.09 77.24 59.44 71.09 77.24 59.44 71.09 77.24 % HT 0.74
ADJUSTMENTS
Flow 4.93 ‐14.20 ‐18.30 3.61 ‐21.71 ‐21.70 ‐2.40 ‐12.95 ‐17.05
Distance ‐0.07 ‐0.07 ‐0.07 ‐0.07 ‐0.07 ‐0.07 ‐0.07 ‐0.07 ‐0.07 LEFT ‐90.00
Finite Roadway 0.00 0.00 0.00 0.00 0.00 0.00 0.00 0.00 0.00 RIGHT 90.00
Barrier 0.00 0.00 0.00 0.00 0.00 0.00 0.00 0.00 0.00
Grade 0.00 0.00 0.00 0.00 0.00 0.00 0.00 0.00 0.00 CNEL 45.43
Constant ‐25.00 ‐25.00 ‐25.00 ‐25.00 ‐25.00 ‐25.00 ‐25.00 ‐25.00 ‐25.00 DAY LEQ 40.96
LEQ 39.30 31.82 33.87 37.98 24.31 30.47 31.97 33.07 35.12 Day hour 89.00
Absorbtive? no
DAY LEQ 40.96 EVENING LEQ 38.85 NIGHT LEQ 38.36 Use hour? no
GRADE dB 0.00
CNEL 45.43
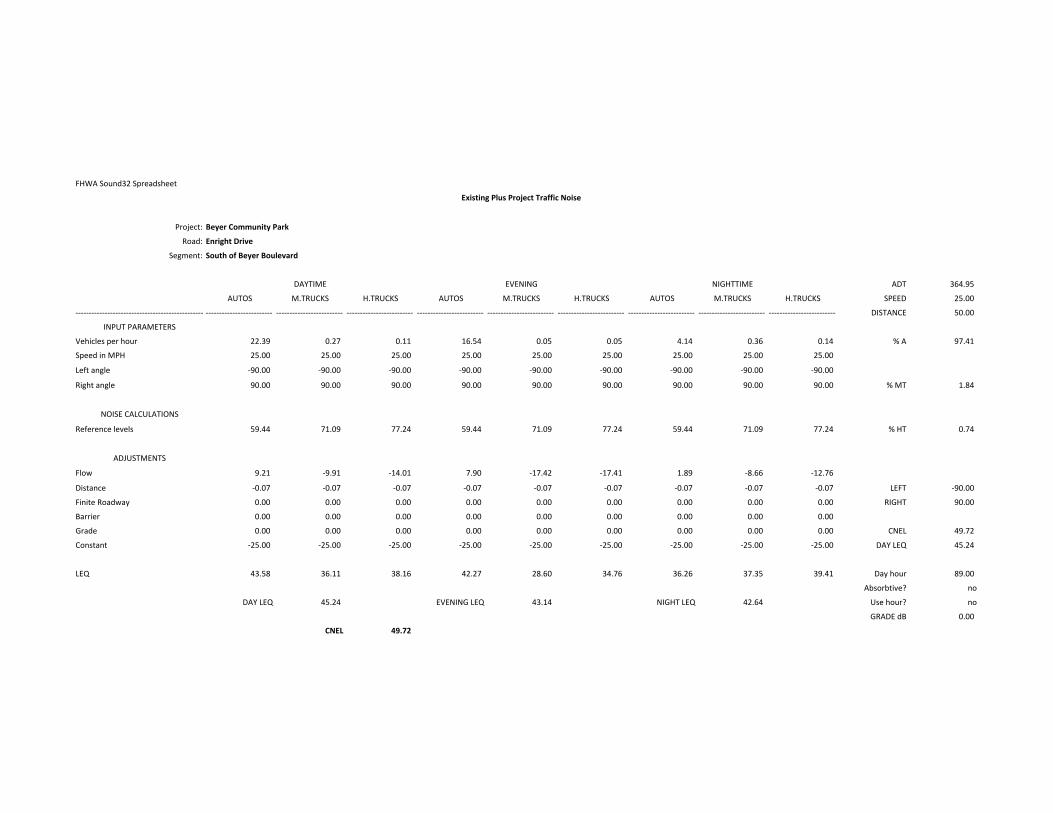
FHWA Sound32 Spreadsheet
Existing Plus Project Traffic Noise
Project: Beyer Community Park
Road: Enright Drive
Segment: South of Beyer Boulevard
DAYTIME EVENING NIGHTTIME ADT 364.95
AUTOS M.TRUCKS H.TRUCKS AUTOS M.TRUCKS H.TRUCKS AUTOS M.TRUCKS H.TRUCKS SPEED 25.00
‐‐‐‐‐‐‐‐‐‐‐‐‐‐‐‐‐‐‐‐‐‐‐‐‐‐‐‐‐‐‐‐‐‐‐‐‐‐‐‐‐‐‐‐‐‐‐‐ ‐‐‐‐‐‐‐‐‐‐‐‐‐‐‐‐‐‐‐‐‐‐‐‐‐ ‐‐‐‐‐‐‐‐‐‐‐‐‐‐‐‐‐‐‐‐‐‐‐‐‐ ‐‐‐‐‐‐‐‐‐‐‐‐‐‐‐‐‐‐‐‐‐‐‐‐‐ ‐‐‐‐‐‐‐‐‐‐‐‐‐‐‐‐‐‐‐‐‐‐‐‐‐ ‐‐‐‐‐‐‐‐‐‐‐‐‐‐‐‐‐‐‐‐‐‐‐‐‐ ‐‐‐‐‐‐‐‐‐‐‐‐‐‐‐‐‐‐‐‐‐‐‐‐‐ ‐‐‐‐‐‐‐‐‐‐‐‐‐‐‐‐‐‐‐‐‐‐‐‐‐ ‐‐‐‐‐‐‐‐‐‐‐‐‐‐‐‐‐‐‐‐‐‐‐‐‐ ‐‐‐‐‐‐‐‐‐‐‐‐‐‐‐‐‐‐‐‐‐‐‐‐‐ DISTANCE 50.00
INPUT PARAMETERS
Vehicles per hour 22.39 0.27 0.11 16.54 0.05 0.05 4.14 0.36 0.14 % A 97.41
Speed in MPH 25.00 25.00 25.00 25.00 25.00 25.00 25.00 25.00 25.00
Left angle ‐90.00 ‐90.00 ‐90.00 ‐90.00 ‐90.00 ‐90.00 ‐90.00 ‐90.00 ‐90.00
Right angle 90.00 90.00 90.00 90.00 90.00 90.00 90.00 90.00 90.00 % MT 1.84
NOISE CALCULATIONS
Reference levels 59.44 71.09 77.24 59.44 71.09 77.24 59.44 71.09 77.24 % HT 0.74
ADJUSTMENTS
Flow 9.21 ‐9.91 ‐14.01 7.90 ‐17.42 ‐17.41 1.89 ‐8.66 ‐12.76
Distance ‐0.07 ‐0.07 ‐0.07 ‐0.07 ‐0.07 ‐0.07 ‐0.07 ‐0.07 ‐0.07 LEFT ‐90.00
Finite Roadway 0.00 0.00 0.00 0.00 0.00 0.00 0.00 0.00 0.00 RIGHT 90.00
Barrier 0.00 0.00 0.00 0.00 0.00 0.00 0.00 0.00 0.00
Grade 0.00 0.00 0.00 0.00 0.00 0.00 0.00 0.00 0.00 CNEL 49.72
Constant ‐25.00 ‐25.00 ‐25.00 ‐25.00 ‐25.00 ‐25.00 ‐25.00 ‐25.00 ‐25.00 DAY LEQ 45.24
LEQ 43.58 36.11 38.16 42.27 28.60 34.76 36.26 37.35 39.41 Day hour 89.00
Absorbtive? no
DAY LEQ 45.24 EVENING LEQ 43.14 NIGHT LEQ 42.64 Use hour? no
GRADE dB 0.00
CNEL 49.72

FHWA Sound32 Spreadsheet
Existing Traffic Noise
Project: Beyer Community Park
Road: Delaney Drive
Segment: South of Beyer Boulevard
DAYTIME EVENING NIGHTTIME ADT 362.00
AUTOS M.TRUCKS H.TRUCKS AUTOS M.TRUCKS H.TRUCKS AUTOS M.TRUCKS H.TRUCKS SPEED 25.00
‐‐‐‐‐‐‐‐‐‐‐‐‐‐‐‐‐‐‐‐‐‐‐‐‐‐‐‐‐‐‐‐‐‐‐‐‐‐‐‐‐‐‐‐‐‐‐‐ ‐‐‐‐‐‐‐‐‐‐‐‐‐‐‐‐‐‐‐‐‐‐‐‐‐ ‐‐‐‐‐‐‐‐‐‐‐‐‐‐‐‐‐‐‐‐‐‐‐‐‐ ‐‐‐‐‐‐‐‐‐‐‐‐‐‐‐‐‐‐‐‐‐‐‐‐‐ ‐‐‐‐‐‐‐‐‐‐‐‐‐‐‐‐‐‐‐‐‐‐‐‐‐ ‐‐‐‐‐‐‐‐‐‐‐‐‐‐‐‐‐‐‐‐‐‐‐‐‐ ‐‐‐‐‐‐‐‐‐‐‐‐‐‐‐‐‐‐‐‐‐‐‐‐‐ ‐‐‐‐‐‐‐‐‐‐‐‐‐‐‐‐‐‐‐‐‐‐‐‐‐ ‐‐‐‐‐‐‐‐‐‐‐‐‐‐‐‐‐‐‐‐‐‐‐‐‐ ‐‐‐‐‐‐‐‐‐‐‐‐‐‐‐‐‐‐‐‐‐‐‐‐‐ DISTANCE 50.00
INPUT PARAMETERS
Vehicles per hour 22.20 0.27 0.11 16.41 0.05 0.05 4.11 0.36 0.14 % A 97.4
Speed in MPH 25.00 25.00 25.00 25.00 25.00 25.00 25.00 25.00 25.00
Left angle ‐90.00 ‐90.00 ‐90.00 ‐90.00 ‐90.00 ‐90.00 ‐90.00 ‐90.00 ‐90.00
Right angle 90.00 90.00 90.00 90.00 90.00 90.00 90.00 90.00 90.00 % MT 1.84
NOISE CALCULATIONS
Reference levels 59.44 71.09 77.24 59.44 71.09 77.24 59.44 71.09 77.24 % HT 0.74
ADJUSTMENTS
Flow 9.18 ‐9.95 ‐14.05 7.87 ‐17.46 ‐17.45 1.85 ‐8.70 ‐12.80
Distance ‐0.07 ‐0.07 ‐0.07 ‐0.07 ‐0.07 ‐0.07 ‐0.07 ‐0.07 ‐0.07 LEFT ‐90.00
Finite Roadway 0.00 0.00 0.00 0.00 0.00 0.00 0.00 0.00 0.00 RIGHT 90.00
Barrier 0.00 0.00 0.00 0.00 0.00 0.00 0.00 0.00 0.00
Grade 0.00 0.00 0.00 0.00 0.00 0.00 0.00 0.00 0.00 CNEL 49.69
Constant ‐25.00 ‐25.00 ‐25.00 ‐25.00 ‐25.00 ‐25.00 ‐25.00 ‐25.00 ‐25.00 DAY LEQ 45.21
LEQ 43.55 36.07 38.12 42.24 28.56 34.73 36.22 37.32 39.37 Day hour 89.00
Absorbtive? no
DAY LEQ 45.21 EVENING LEQ 43.10 NIGHT LEQ 42.61 Use hour? no
GRADE dB 0.00
CNEL 49.69

FHWA Sound32 Spreadsheet
Existing Plus Project Traffic Noise
Project: Beyer Community Park
Road: Delaney Drive
Segment: South of Beyer Boulevard
DAYTIME EVENING NIGHTTIME ADT 590.95
AUTOS M.TRUCKS H.TRUCKS AUTOS M.TRUCKS H.TRUCKS AUTOS M.TRUCKS H.TRUCKS SPEED 25.00
‐‐‐‐‐‐‐‐‐‐‐‐‐‐‐‐‐‐‐‐‐‐‐‐‐‐‐‐‐‐‐‐‐‐‐‐‐‐‐‐‐‐‐‐‐‐‐‐ ‐‐‐‐‐‐‐‐‐‐‐‐‐‐‐‐‐‐‐‐‐‐‐‐‐ ‐‐‐‐‐‐‐‐‐‐‐‐‐‐‐‐‐‐‐‐‐‐‐‐‐ ‐‐‐‐‐‐‐‐‐‐‐‐‐‐‐‐‐‐‐‐‐‐‐‐‐ ‐‐‐‐‐‐‐‐‐‐‐‐‐‐‐‐‐‐‐‐‐‐‐‐‐ ‐‐‐‐‐‐‐‐‐‐‐‐‐‐‐‐‐‐‐‐‐‐‐‐‐ ‐‐‐‐‐‐‐‐‐‐‐‐‐‐‐‐‐‐‐‐‐‐‐‐‐ ‐‐‐‐‐‐‐‐‐‐‐‐‐‐‐‐‐‐‐‐‐‐‐‐‐ ‐‐‐‐‐‐‐‐‐‐‐‐‐‐‐‐‐‐‐‐‐‐‐‐‐ ‐‐‐‐‐‐‐‐‐‐‐‐‐‐‐‐‐‐‐‐‐‐‐‐‐ DISTANCE 50.00
INPUT PARAMETERS
Vehicles per hour 36.25 0.44 0.17 26.79 0.08 0.08 6.71 0.59 0.23 % A 97.41
Speed in MPH 25.00 25.00 25.00 25.00 25.00 25.00 25.00 25.00 25.00
Left angle ‐90.00 ‐90.00 ‐90.00 ‐90.00 ‐90.00 ‐90.00 ‐90.00 ‐90.00 ‐90.00
Right angle 90.00 90.00 90.00 90.00 90.00 90.00 90.00 90.00 90.00 % MT 1.84
NOISE CALCULATIONS
Reference levels 59.44 71.09 77.24 59.44 71.09 77.24 59.44 71.09 77.24 % HT 0.74
ADJUSTMENTS
Flow 11.31 ‐7.82 ‐11.92 9.99 ‐15.33 ‐15.32 3.98 ‐6.57 ‐10.67
Distance ‐0.07 ‐0.07 ‐0.07 ‐0.07 ‐0.07 ‐0.07 ‐0.07 ‐0.07 ‐0.07 LEFT ‐90.00
Finite Roadway 0.00 0.00 0.00 0.00 0.00 0.00 0.00 0.00 0.00 RIGHT 90.00
Barrier 0.00 0.00 0.00 0.00 0.00 0.00 0.00 0.00 0.00
Grade 0.00 0.00 0.00 0.00 0.00 0.00 0.00 0.00 0.00 CNEL 51.82
Constant ‐25.00 ‐25.00 ‐25.00 ‐25.00 ‐25.00 ‐25.00 ‐25.00 ‐25.00 ‐25.00 DAY LEQ 47.34
LEQ 45.68 38.20 40.25 44.36 30.69 36.85 38.35 39.45 41.50 Day hour 89.00
Absorbtive? no
DAY LEQ 47.34 EVENING LEQ 45.23 NIGHT LEQ 44.74 Use hour? no
GRADE dB 0.00
CNEL 51.82

FHWA Sound32 Spreadsheet
Existing Traffic Noise
Project: Beyer Community Park
Road: E. Beyer Boulevard
Segment: South of Beyer Boulevard
DAYTIME EVENING NIGHTTIME ADT 5537.00
AUTOS M.TRUCKS H.TRUCKS AUTOS M.TRUCKS H.TRUCKS AUTOS M.TRUCKS H.TRUCKS SPEED 35.00
‐‐‐‐‐‐‐‐‐‐‐‐‐‐‐‐‐‐‐‐‐‐‐‐‐‐‐‐‐‐‐‐‐‐‐‐‐‐‐‐‐‐‐‐‐‐‐‐ ‐‐‐‐‐‐‐‐‐‐‐‐‐‐‐‐‐‐‐‐‐‐‐‐‐ ‐‐‐‐‐‐‐‐‐‐‐‐‐‐‐‐‐‐‐‐‐‐‐‐‐ ‐‐‐‐‐‐‐‐‐‐‐‐‐‐‐‐‐‐‐‐‐‐‐‐‐ ‐‐‐‐‐‐‐‐‐‐‐‐‐‐‐‐‐‐‐‐‐‐‐‐‐ ‐‐‐‐‐‐‐‐‐‐‐‐‐‐‐‐‐‐‐‐‐‐‐‐‐ ‐‐‐‐‐‐‐‐‐‐‐‐‐‐‐‐‐‐‐‐‐‐‐‐‐ ‐‐‐‐‐‐‐‐‐‐‐‐‐‐‐‐‐‐‐‐‐‐‐‐‐ ‐‐‐‐‐‐‐‐‐‐‐‐‐‐‐‐‐‐‐‐‐‐‐‐‐ ‐‐‐‐‐‐‐‐‐‐‐‐‐‐‐‐‐‐‐‐‐‐‐‐‐ DISTANCE 50.00
INPUT PARAMETERS
Vehicles per hour 339.58 4.15 1.62 250.96 0.74 0.74 62.86 5.54 2.15 % A 97.4
Speed in MPH 35.00 35.00 35.00 35.00 35.00 35.00 35.00 35.00 35.00
Left angle ‐90.00 ‐90.00 ‐90.00 ‐90.00 ‐90.00 ‐90.00 ‐90.00 ‐90.00 ‐90.00
Right angle 90.00 90.00 90.00 90.00 90.00 90.00 90.00 90.00 90.00 % MT 1.84
NOISE CALCULATIONS
Reference levels 65.11 74.83 80.05 65.11 74.83 80.05 65.11 74.83 80.05 % HT 0.74
ADJUSTMENTS
Flow 19.56 0.44 ‐3.66 18.25 ‐7.07 ‐7.06 12.24 1.69 ‐2.42
Distance ‐0.07 ‐0.07 ‐0.07 ‐0.07 ‐0.07 ‐0.07 ‐0.07 ‐0.07 ‐0.07 LEFT ‐90.00
Finite Roadway 0.00 0.00 0.00 0.00 0.00 0.00 0.00 0.00 0.00 RIGHT 90.00
Barrier 0.00 0.00 0.00 0.00 0.00 0.00 0.00 0.00 0.00
Grade 0.00 0.00 0.00 0.00 0.00 0.00 0.00 0.00 0.00 CNEL 64.33
Constant ‐25.00 ‐25.00 ‐25.00 ‐25.00 ‐25.00 ‐25.00 ‐25.00 ‐25.00 ‐25.00 DAY LEQ 60.62
LEQ 59.60 50.19 51.31 58.29 42.69 47.92 52.28 51.44 52.56 Day hour 89.00
Absorbtive? no
DAY LEQ 60.62 EVENING LEQ 58.78 NIGHT LEQ 56.89 Use hour? no
GRADE dB 0.00
CNEL 64.33

FHWA Sound32 Spreadsheet
Existing Plus Project Traffic Noise
Project: Beyer Community Park
Road: E. Beyer Boulevard
Segment: South of Beyer Boulevard
DAYTIME EVENING NIGHTTIME ADT 5560.00
AUTOS M.TRUCKS H.TRUCKS AUTOS M.TRUCKS H.TRUCKS AUTOS M.TRUCKS H.TRUCKS SPEED 35.00
‐‐‐‐‐‐‐‐‐‐‐‐‐‐‐‐‐‐‐‐‐‐‐‐‐‐‐‐‐‐‐‐‐‐‐‐‐‐‐‐‐‐‐‐‐‐‐‐ ‐‐‐‐‐‐‐‐‐‐‐‐‐‐‐‐‐‐‐‐‐‐‐‐‐ ‐‐‐‐‐‐‐‐‐‐‐‐‐‐‐‐‐‐‐‐‐‐‐‐‐ ‐‐‐‐‐‐‐‐‐‐‐‐‐‐‐‐‐‐‐‐‐‐‐‐‐ ‐‐‐‐‐‐‐‐‐‐‐‐‐‐‐‐‐‐‐‐‐‐‐‐‐ ‐‐‐‐‐‐‐‐‐‐‐‐‐‐‐‐‐‐‐‐‐‐‐‐‐ ‐‐‐‐‐‐‐‐‐‐‐‐‐‐‐‐‐‐‐‐‐‐‐‐‐ ‐‐‐‐‐‐‐‐‐‐‐‐‐‐‐‐‐‐‐‐‐‐‐‐‐ ‐‐‐‐‐‐‐‐‐‐‐‐‐‐‐‐‐‐‐‐‐‐‐‐‐ ‐‐‐‐‐‐‐‐‐‐‐‐‐‐‐‐‐‐‐‐‐‐‐‐‐ DISTANCE 50.00
INPUT PARAMETERS
Vehicles per hour 340.99 4.17 1.62 252.00 0.74 0.74 63.12 5.56 2.16 % A 97.40
Speed in MPH 35.00 35.00 35.00 35.00 35.00 35.00 35.00 35.00 35.00
Left angle ‐90.00 ‐90.00 ‐90.00 ‐90.00 ‐90.00 ‐90.00 ‐90.00 ‐90.00 ‐90.00
Right angle 90.00 90.00 90.00 90.00 90.00 90.00 90.00 90.00 90.00 % MT 1.84
NOISE CALCULATIONS
Reference levels 65.11 74.83 80.05 65.11 74.83 80.05 65.11 74.83 80.05 % HT 0.74
ADJUSTMENTS
Flow 19.58 0.45 ‐3.65 18.27 ‐7.05 ‐7.04 12.26 1.70 ‐2.40
Distance ‐0.07 ‐0.07 ‐0.07 ‐0.07 ‐0.07 ‐0.07 ‐0.07 ‐0.07 ‐0.07 LEFT ‐90.00
Finite Roadway 0.00 0.00 0.00 0.00 0.00 0.00 0.00 0.00 0.00 RIGHT 90.00
Barrier 0.00 0.00 0.00 0.00 0.00 0.00 0.00 0.00 0.00
Grade 0.00 0.00 0.00 0.00 0.00 0.00 0.00 0.00 0.00 CNEL 64.34
Constant ‐25.00 ‐25.00 ‐25.00 ‐25.00 ‐25.00 ‐25.00 ‐25.00 ‐25.00 ‐25.00 DAY LEQ 60.63
LEQ 59.62 50.21 51.33 58.31 42.70 47.93 52.29 51.46 52.58 Day hour 89.00
Absorbtive? no
DAY LEQ 60.63 EVENING LEQ 58.80 NIGHT LEQ 56.91 Use hour? no
GRADE dB 0.00
CNEL 64.34