nokia's annual accounts 2002 oyj...the four fundamentals of the proposition are ... nokia...
TRANSCRIPT


A N N U A L A C C O U N T S 2 0 0 2
Key data 2002 4
Review by the Board of Directors 5
Consolidated profit and loss accounts, IAS 8
Consolidated balance sheets, IAS 9
Consolidated cash flow statements, IAS 10
Statements of changes in shareholders’ equity, IAS 12
Notes to the consolidated financial statements 13
Profit and loss accounts, parent company, FAS 32
Cash flow statements, parent company, FAS 32
Balance sheets, parent company, FAS 33
Notes to the financial statements of the parent company 34
Nokia shares and shareholders 38
Nokia 1998–2002, IAS 45
Calculation of key ratios 48
Proposal by the Board of Directors
to the Annual General Meeting 49
Auditor’s report 50
A D D I T I O N A L I N F O R M A T I O N
U.S. GAAP 52
Critical accounting policies 55
Risk factors 57
Group Executive Board 58
Board of Directors 60
Corporate Governance 62
Investor information 65
General contact information 66

4 | Nokia in 2002
Key data 2002
The key data is based on financial statements according to International Accounting
Standards, IAS.
2002 2001 Change 2000
Nokia EURm EURm % EURm
Net sales 30 016 31 191 -4 30 376
Operating profit 4 780 3 362 42 5 776
Profit before taxes 4 917 3 475 41 5 862
Net profit 3 381 2 200 54 3 938
Research and development 3 052 2 985 2 2 584
2002,% 2001,% 2000,%
Return on capital employed 35.3 27.9 58.0
Net dept to equity (gearing) –61 –41 –26
2002 2001 Change 2000
EUR EUR % EUR
Earnings per share, basic 0.71 0.47 51 0.84
Dividend per share 0.28 * 0.27 4 0.28
Average number
of shares (1 000 shares) 4 751 110 4 702 852 4 673 162
* Board’s proposal
2002 2001 Change 2000
Business Groups EURm EURm % EURm
Nokia Mobile Phones
Net sales 23 211 23 158 0 21 887
Operating profit 5 201 4 521 15 4 879
Research and development 1 884 1 599 18 1 306
Nokia Networks
Net sales 6 539 7 534 –13 7 714
Operating profit –49 –73 33 1 358
Research and development 995 1 135 –12 1 013
Nokia Ventures Organization
Net sales 459 585 –22 854
Operating profit –141 –855 84 –387
Research and development 136 221 –38 235
Personnel, Dec. 31 2002 2001 Change,% 2000
Nokia Mobile Phones 26 090 26 453 –1 28 047
Nokia Networks 17 361 19 392 –10 23 965
Nokia Ventures Organization 1 506 1 886 –20 2 570
Common Group Functions 6 791 6 118 11 5 707
Nokia Group 51 748 53 849 –4 60 289
10 major markets,net sales
2002 2001 2000
EURm EURm EURm
USA 4 665 5 614 5 312
UK 3 111 2 808 2 828
China 2 802 3 418 3 065
Germany 1 849 2 003 2 579
Italy 1 342 1 168 1 243
France 1 273 1 260 1 085
United Arab Emirates 925 619 316
Thailand 827 908 445
Brazil 773 892 1 056
Poland 582 590 478
10 major countries,personnel, Dec. 31
2002 2001 2000
Finland 22 535 22 246 24 379
USA 6 661 7 298 8 765
China 4 778 5 202 5 675
Germany 3 620 3 892 4 747
UK 2 139 2 286 2 777
Hungary 1 975 1 937 1 972
Brazil 1 466 1 413 1 260
Denmark 1 176 1 166 1 266
Mexico 1 158 1 198 1 122
South-Korea 821 864 937
Main currencies,1 EUR rates at the year-end 2002
USD 1.0247
GBP 0.6439
SEK 9.1144
JPY 124.17

Nokia in 2002 | 5
Review by the Board of Directors 2002
Nokia’s net sales in 2002 decreased by 4% compared with 2001 and totaled
EUR 30 016 million (EUR 31 191 million in 2001). Sales in Nokia Mobile
Phones were flat at EUR 23 211 million (EUR 23 158 million) and decreased
in Nokia Networks by 13% to EUR 6 539 million (EUR 7 534 million). Sales
decreased in Nokia Ventures Organization by 22% to EUR 459 million (EUR
585 million).
Operating profit in 2002 increased by 42% and totaled EUR 4 780 million
(EUR 3 362 million in 2001). Operating margin was 15.9% (10.8% in 2001).
Operating profit in Nokia Mobile Phones increased by 15% to EUR 5 201
million (EUR 4 521 million in 2001). Operating loss in Nokia Networks
decreased to EUR 49 million (operating loss of EUR 73 million in 2001).
Operating margin in Nokia Mobile Phones was 22.4% (19.5% in 2001),
while the operating margin in Nokia Networks was –0.7% (–1.0% in
2001). Nokia Ventures Organization showed an operating loss of EUR 141
million (operating loss of EUR 855 million in 2001). Common Group
Expenses totaled EUR 231 million (EUR 231 million in 2001).
During 2002, operating profit was negatively impacted by goodwill
impairments of EUR 182 million and net customer financing impairment
charges related to MobilCom of EUR 265 million.
Financial income totaled EUR 156 million in 2002 (EUR 125 million in
2001). Profit before tax and minority interests was EUR 4 917 million in
2002 (EUR 3 475 million in 2001). Net profit totaled EUR 3 381 million in
2002 (EUR 2 200 million in 2001). Earnings per share increased to EUR 0.71
(basic) and to EUR 0.71 (diluted) in 2002, compared with EUR 0.47 (basic)
and EUR 0.46 (diluted) in 2001.
At December 31, 2002, net-debt-to-equity ratio (gearing) was –61% (–41%
at the end of 2001). Total capital expenditures in 2002 amounted to EUR
432 million (EUR 1 041 million in 2001).
At the end of 2002, outstanding long-term loans to customers totaled
EUR 1 056 million (compared with EUR 1 128 in 2001), while guarantees
given on behalf of customers totaled EUR 91 million (EUR 127 million). In
addition, Nokia had financing commitments totaling EUR 857 million
(EUR 2 955 million) at the end of 2002. Of the total outstanding and com-
mitted customer financing of EUR 2 004 million (EUR 4 210 million), EUR
1 573 million (EUR 3 607 million) related to 3G networks.
Global reachIn 2002, Europe accounted for 54% of Nokia’s net sales (49% in 2001), the
Americas 22% (25%) and Asia-Pacific 24% (26%). The 10 largest markets
were US, UK, China, Germany, Italy, France, UAE, Thailand, Brazil and Poland,
together representing 60% of total sales.
Research and developmentIn 2002, Nokia continued to invest in its worldwide research and develop-
ment network and co-operation. At year-end, Nokia had 19 579 R&D
employees, approximately 38% of Nokia’s total personnel. Nokia has R&D
centers in 14 countries. Investments in R&D increased by 2% (16% in 2001)
and totalled EUR 3 052 million (EUR 2 985 million in 2001), representing
10.2% of net sales (9.6% of net sales in 2001).
Joint initiativesOpen Mobile AllianceAs the mobile industry evolves into new applications and services, co-
operation among industry players has intensified, facilitating the faster
adoption of mobile services as well as market growth for the entire mobile
industry. Nokia, an active promoter of the Open Mobile Architecture
initiative, launched in November 2001, was a founding member of the
Open Mobile Alliance, which naturally evolved from this. Since its inception
in June 2002, the Open Mobile Alliance has rapidly expanded from
around 180 members to include more than 300 companies, representing
leading mobile operators, device and network suppliers, IT companies
and content providers.
PeopleThe average number of personnel for 2002 was 52 714 (57 716 for 2001).
At the end of 2002, Nokia employed 51 748 people worldwide (53 849 at
year-end 2001). In 2002, Nokia’s personnel decreased by a total of 2 101
employees (decrease of 6 440 in 2001).
Employee Value PropositionIn a move to further attract, engage and retain a skilled workforce, Nokia
this year developed an employee value proposition framework. The
adaptation and implementation of this has already started at country
levels to reflect and respond to local employee needs and expectations.
The four fundamentals of the proposition are (1) the Nokia Way and
Values, (2) performance-based rewarding, (3) professional and personal
growth, and (4) work-life balance.
Corporate responsibilityDuring 2002, Nokia made clear progress in the area of corporate respon-
sibility. Developments included the expansion of our global community
involvement program (Make a Connection) to 12 countries, reaching over
one million people; the introduction of a company-wide diversity program
Review by the Board of Directors

6 | Nokia in 2002
Review by the Board of Directors
aimed at preventing discrimination and increasing the productivity and
innovation of teams; and further development and increased transparency
in our product life-cycle management (related to our work in design for
environment, supplier network management, manufacturing and end-
of-life practices).
Nokia is actively participating in a number of international initiatives,
such as those of Global Compact, UN ICT Task Force, International Youth
Foundation, World Business Council for Sustainable Development and
WWF. As a result of our performance in economic, environmental and
social issues, and increased transparency in reporting, Nokia was again
included in Socially Responsible Investment (SRI) benchmarks, such as
Dow Jones Sustainability Indexes and the FTSE4Good.
In 2002, Nokia was named as the top stock held by SRI funds in Europe,
according to an analysis of European SRI funds by the Sustainable Invest-
ment Research International Group (SiRi), a coalition of 12 national SRI
research bodies.
Nokia Mobile Phones in 2002Nokia Mobile Phones continued to renew its industry-leading product
line-up, launching a record 34 new products during 2002, incorporating
color, imaging, multimedia, mobile games and polyphonic ring tones. Of
the total new phones launched, 14 had color screens and multimedia
capability. This attests to the growing share of feature-rich phones offering
advanced mobile services in the company’s product portfolio.
During the year, Nokia launched its first WCDMA mobile phone, the
Nokia 6650, which began deliveries to operators for testing in October
2002. The company also commenced shipments of its first CDMA2000 1X
mobile phones in the Americas. These included the Nokia 6370, the Nokia
6385, the Nokia 3585, and the Nokia 8280.
In imaging, Nokia began shipping its iconic camera phone, the Nokia
7650, expanding the scope of the mobile market from voice to visual com-
munications. Feedback from customers and users across the board has
been extremely positive.
In the enterprise segment, the company expanded its product offering
from the Nokia Communicator 9200 series to include the Nokia 6800
messaging device, with full QWERTY keypad optimized for personal and
enterprise mobile e-mail.
In entertainment, Nokia announced it would bring mobility to gaming
by offering console quality games for its new mobile game deck device
category. Under a collaboration agreement with world leading games
publisher, Sega, the two companies will develop games for the new
Nokia N-Gage™ mobile game deck, which will run on the Nokia Series 60
platform and the Symbian operating system.
For the full year 2002, Nokia volumes reached a record level of 152
million units, representing faster than market growth of 9%, compared
with 2001. Backed by Nokia’s ongoing product leadership and user brand
preference, Nokia has again increased its market share for the fifth
consecutive year reaching about 38% for the full year 2002, bringing the
company closer to its target of 40%.
During the year, Nokia Mobile Phones took steps to accelerate growth
and enhance both agility and scale benefits with the introduction of a
new operational structure. From May 1, nine new business units were
each made responsible for product and business development within a
defined market segment. This allowed Nokia to optimize its activities in
these vertically-focused areas, while continuing to achieve broad economies
of scale from horizontal functions such as application software develop-
ment and the company’s market-leading demand-supply network.
Nokia Networks in 2002During the year, Nokia Networks signed 20 GSM network deals in Asia,
China, Europe and the US, including three new customers.
Mobile Multimedia Messaging Services (MMS) became a reality in 2002,
with its rapid implementation into most GSM operator networks. By year-
end, Nokia Networks had delivered MMS solutions to well over 40 operators.
WCDMA 3G technology implementation moved to pre-commercial and
commercial phase towards the end of 2002. Nokia signed 10 new 3G deals
in Austria, Belgium, Germany, Ireland, Japan, the UK and Taiwan. In Sep-
tember, Nokia became the first vendor to commence volume deliveries of
EDGE hardware across all major GSM bands and in all continents.
In broadband access, Nokia signed nine new contracts in 2002, and
launched the Nokia D500 next generation multiservice broadband access
platform for the US and ETSI markets.
Net sales bybusiness group 2002 % 2001 % ChangeJan. 1 – Dec. 31 EURm EURm %
Nokia Mobile Phones 23 211 77 23 158 74
Nokia Networks 6 539 22 7 534 24 –13
Nokia Ventures Organization 459 1 585 2 –22
Inter-business
group eliminations –193 –86
Nokia Group 30 016 100 31 191 100 –4
Operating profit bybusiness group, IAS 2002 % of 2001 % ofJan. 1 – Dec. 31 EURm net sales EURm net sales
Nokia Mobile Phones 5 201 22.4 4 521 19.5
Nokia Networks –49 –0.7 –73 –1.0
Nokia Ventures Organization –141 –30.7 –855 –146.2
Common Group Expenses –231 –231
Nokia Group 4 780 15.9 3 362 10.8

Nokia in 2002 | 7
Review by the Board of Directors
The company also further strengthened its GSM/EDGE/WCDMA product
family with several new products and solutions. Key launches included a
high-availability server platform for use in All-IP mobility networks, and
the Nokia LTX, a linear transceiver product family of base station modules
that support the definition of Open IP Base Station Architecture.
During the year, Nokia took measures to align its operations to better
reflect current market capacity and conditions, reducing the number of
employees in its delivery and maintenance services as well as in production.
Nokia also streamlined its professional mobile radio unit to reflect the
slower than expected take-off of this market.
Nokia Ventures Organization in 2002Despite overall flat IT spending and slow growth in the corporate network
security market throughout 2002, Nokia Internet Communications main-
tained the same level of sales and market share in the enterprise
firewall/VPN appliance segment as the previous year, as well as signifi-
cantly improving its operational efficiency.
Highlights for the year include the introduction of a record number of
new products and solutions that both expand Nokia’s network security
appliance portfolio and respond to emerging market opportunities.
Extending mobility to enterprise workforces, protecting corporate e-mail
content and providing firewall/VPN benefits to remote offices were
promising growth areas addressed with new product offerings from
Nokia. To help foster the creation of new security applications to comple-
ment Nokia’s own solutions, the Nokia Security Developers Alliance was
launched in July. Looking forward to 2003, Nokia Internet Communications
remains committed to building a leading position in the corporate
network security market and extending mobility to enterprises.
For Nokia Home Communications, sales in 2002 clearly declined as
the unit began a migration towards emerging horizontal markets with
the launch of new types of terminals focused on horizontal terrestrial
and satellite markets, providing digital viewers access to a broad range
of digital services. Products, such as the Nokia Mediamaster 230 S, intro-
duced Bluetooth-enabled interoperability to the home environment in
the second half of the year.
Changes in share capitalIn 2002, Nokia’s share capital increased by EUR 3 022 621.20 as a result of
the issue of 50 377 020 new shares upon exercise of warrants and stock
options issued to key personnel in 1997 and 1999.
On December 31, 2002, Nokia Group companies owned 1 145 621
Nokia shares. The shares had an aggregate nominal value of EUR
68 737.26 representing 0.02% of the share capital of the company and the
total voting rights.
The total number of shares at December 31, 2002 was 4 787 907 141.
As a result of the new share issues, Nokia received a total of EUR
162 827 165.74 in additional shareholders’ equity in 2002. At December 31,
2002, Nokia’s share capital was EUR 287 274 428.46.
Parent companyEffective July 1, Nextrom Holding S.A., a publicly listed corporation orga-
nized under the laws of Switzerland, became a subsidiary of Nokia Cor-
poration.
OutlookNokia’s objective is to take and maintain a leading role in creating
communications products and services that enrich the daily lives of
people and enable enterprises to prosper. The company strives to keep a
clear focus on human needs, managing risks and building reputation,
integrating all stakeholder expectations into its business decision making.
In 2002, Nokia confirmed its ability to perform well in a challenging
environment, translating core strengths of leading brand, excellence in
execution and continuous product renewal into strong profitability. Going
into 2003, the company expects market conditions to remain challenging,
but will continue to build on Nokia’s industry-leading position, seeking
to achieve high profitability as well as to grow market share in its two
main businesses.
As market leader and a global company, Nokia takes its responsibilities
seriously. Sound company ethics makes business sense by helping mini-
mize risk, ensuring legal compliance, and building reputation amongst
stakeholders. By conducting business in a responsible way, Nokia can
make a significant contribution to sustainable development, at the same
time building a strong foundation for economic growth.
DividendNokia’s Board of Directors will propose a dividend of EUR 0.28 per share
in respect of 2002.

8 | Nokia in 2002
Consolidated profit and loss accounts, IAS
Consolidated financial statements according to International Accounting Standards (IAS)
2002 2001 2000Financial year ended Dec. 31 Notes EURm EURm EURm
Net sales 30 016 31 191 30 376
Cost of sales –18 278 –19 787 –19 072
Research and development expenses –3 052 –2 985 –2 584Selling, general and administrative
expenses 6,7 –3 239 –3 523 –2 804Customer finance impairment charges, net 7 –279 –714 –Impairment of goodwill 7 –182 –518 –
Amortization of goodwill 9 –206 –302 –140
Operating profit 2, 3, 4, 5, 6, 7, 9 4 780 3 362 5 776
Share of results of associated companies 32 –19 –12 –16
Financial income and expenses 10 156 125 102
Profit before tax and minority interests 4 917 3 475 5 862
Tax 11 –1 484 –1 192 –1 784
Minority interests –52 –83 –140
Net profit 3 381 2 200 3 938
2002 2001 2000
Earnings per share 28 EUR EUR EUR
Basic 0.71 0.47 0.84Diluted 0.71 0.46 0.82
Average number of shares(1 000 shares) 28 2002 2001 2000
Basic 4 751 110 4 702 852 4 673 162
Diluted 4 788 042 4 787 219 4 792 980
See Notes to consolidated financial statements.

Nokia in 2002 | 9
Consolidated balance sheets, IAS
Consolidated financial statements according to International Accounting Standards (IAS)
2002 2001Dec. 31 Notes EURm EURm
ASSETS
Fixed assets and other non-current assetsCapitalized development costs 12 1 072 893Goodwill 12 476 854Other intangible assets 12 192 237Property, plant and equipment 13 1 874 2 514Investments in associated companies 14 49 49Available-for-sale investments 15 238 399Deferred tax assets 24 731 832Long-term loans receivable 16 1 056 1 128
Other non-current assets 54 6
5 742 6 912
Current assetsInventories 17, 19 1 277 1 788Accounts receivable 18, 19 5 385 5 719Prepaid expenses and accrued income 18 1 156 1 480Other financial assets 416 403Available-for-sale investments 15, 34 7 855 4 271
Bank and cash 34 1 496 1 854
17 585 15 515
Total assets 23 327 22 427
2002 2001
Dec. 31 Notes EURm EURm
SHAREHOLDERS’ EQUITY AND LIABILITIES
Shareholders’ equityShare capital 21 287 284Share issue premium 2 225 2 060Treasury shares, at cost –20 –21Translation differences 135 326Fair value and other reserves 20 –7 20Retained earnings 22 11 661 9 536
14 281 12 205
Minority interest 173 196
Long-term liabilities 23Long-term interest-bearing liabilities 187 207Deferred tax liabilities 24 207 177Other long-term liabilities 67 76
461 460
Current liabilitiesShort-term borrowings 25 377 831Accounts payable 2 954 3 074Accrued expenses 26 2 611 3 477Provisions 27 2 470 2 184
8 412 9 566
Total shareholders’ equity and liabilities 23 327 22 427
See Notes to consolidated financial statements.

10 | Nokia in 2002
Consolidated financial statements according to International Accounting Standards (IAS)
Consolidated cash flow statements, IAS
2002 2001 2000Financial year ended Dec. 31 Notes EURm EURm EURm
Cash flow from operating activitiesNet profit 3 381 2 200 3 938
Adjustments, total 33 3 151 4 132 2 805
Net profit before change in net working capital 6 532 6 332 6 743
Change in net working capital 33 955 978 –1 377
Cash generated from operations 7 487 7 310 5 366
Interest received 229 226 255
Interest paid –94 –155 –115
Other financial income and expenses 139 99 –454
Income taxes paid –1 947 –933 –1 543
Net cash from operating activities 5 814 6 547 3 509
Cash flow from investing activitiesAcquisition of Group companies, net of acquired cash(2002: EUR 6 million, 2001: EUR 12 million, 2000: EUR 2 million) –10 –131 –400Purchase of non-current available-for-sale investments –99 –323 –111Additions to capitalized development costs –418 –431 –393Long-term loans made to customers –563 –1 129 –776Proceeds from repayment and transfers of long-term
loans receivable 314 – –Proceeds from (+) / payment of (–)
other long-term receivables –32 84 –Proceeds from (+) / payment of (–)
short-term loans receivable –85 –114 378
Capital expenditures –432 –1 041 –1 580
Proceeds from disposal of shares in Group companies,
net of disposed cash 93 – 4
Proceeds from sale of non-current available-for-sale
investments 162 204 75
Proceeds from sale of fixed assets 177 175 221
Dividends received 25 27 51
Net cash used in investing activities –868 –2 679 –2 531
Cash flow from financing activitiesProceeds from stock option exercises 163 77 72Purchase of treasury shares –17 –21 –160Capital investment by minority shareholders 26 4 7Proceeds from long-term borrowings 100 102 –
Repayment of long-term borrowings –98 –59 –82
Proceeds from (+) / repayment of
(–) short-term borrowings –406 –602 133
Dividends paid –1 348 –1 396 –1 004
Net cash used in financing activities –1 580 –1 895 –1 034
Foreign exchange adjustment –163 –43 80
Net increase in cash and cash equivalents 3 203 1 930 24
Cash and cash equivalents at beginning of
period 6 125 4 183 4 159
Cash and cash equivalents at end of period 9 328 6 113 4 183

Nokia in 2002 | 11
Consolidated financial statements according to International Accounting Standards (IAS)
2002 2001 2000EURm EURm EURm
Change in net fair value of current
available-for-sale investments 23 12 –
As reported on balance sheet 9 351 6 125 4 183
Movement in cash and cash equivalents:
At beginning of year, as previously reported 6 125 4 183 4 159
On adoption of IAS 39, remeasurement of current
available-for-sale investments to fair value – 42 –
At beginning of year, as restated 6 125 4 225 4 159
Net fair value gains (+) / losses (–)
on current available-for-sale investments 23 –30 –
Net increase in cash and cash equivalents 3 203 1 930 24
As reported on balance sheet 9 351 6 125 4 183
At end of year, comprising:Bank and cash 1 496 1 854 1 409
Current available-for-sale investments 7 855 4 271 2 774
9 351 6 125 4 183
See Notes to consolidated financial statements.
The figures in the consolidated cash flow statement cannot be directlytraced from the balance sheet without additional information as a resultof acquisitions and disposals of subsidiaries and net foreign exchangedifferences arising on consolidation.

12 | Nokia in 2002
Consolidated statements of changes in shareholders’ equity , IAS
Consolidated financial statements according to International Accounting Standards (IAS)
Fair valueNumber of shares Share Share issue Treasury Translation and other Retained
Group, EURm (1 000) capital premium shares differences reserves earnings Total
Balance at Dec. 31, 1999 4 652 679 279 1 079 –24 243 – 5 801 7 378
Share issue related to acquisitions 10 021 1 484 485Stock options exercised 32 128 2 70 72Stock options issued on
acquisitions 75 75Stock options exercised
related to acquisitions –13 –13Acquisition of treasury shares –3 252 –160 –160Reissuance of treasury shares 557 27 27Dividend –931 –931Translation differences 104 104Change in accounting policy –206 –206Other increase, net 39 39Net profit 3 938 3 938
Balance at Dec. 31, 2000 4 692 133 282 1 695 –157 347 – 8 641 10 808
Effect of adopting IAS 39 –56 –56
Balance at Jan. 1, 2001, restated 4 692 133 282 1 695 –157 347 –56 8 641 10 752
Share issue related to acquisitions 18 329 1 331 332Stock options exercised 23 057 1 76 77Stock options issued on acquisition 20 20Stock options exercised
related to acquisitions –10 –10Acquisition of treasury shares –995 –21 –21Reissuance of treasury shares 3 778 –52 157 105Dividend –1 314 –1 314Translation differences 65 65Net investment hedge losses –86 –86Cash flow hedges, net 76 76Available-for-sale investments, net 0 0Other increase, net 9 9Net profit 2 200 2 200
Balance at Dec. 31, 2001 4 736 302 284 2 060 –21 326 20 9 536 12 205
Stock options exercised 50 377 3 160 163Stock options exercised
related to acquisitions –17 –17Tax benefit on stock options
exercised 22 22Acquisition of treasury shares –900 –17 –17Reissuance of treasury shares 983 18 18Dividend –1 279 –1 279Translation differences –285 –285Net investment hedge gains 94 94Cash flow hedges, net of tax 60 60Available-for-sale investments,
net of tax –87 –87Other increase, net 23 23Net profit 3 381 3 381
Balance at Dec. 31, 2002 4 786 762 287 2 225 –20 135 –7 11 661 14 281
Dividends declared per share were EUR 0.28 for 2002 (EUR 0.27 for 2001 and EUR 0.28 for 2000), subject to shareholders’ approval.
See Notes to consolidated financial statements.

Nokia in 2002 | 13
Notes to the consolidated financial statements
1. Accounting principles
Basis of presentationThe consolidated financial statements of Nokia Corporation (“Nokia” or
“the Group”), a Finnish limited liability company with domicile in Helsin-
ki, are prepared in accordance with International Accounting Standards
(IAS). The consolidated financial statements are presented in millions of
euros (EURm) and are prepared under the historical cost convention
except as disclosed in the accounting policies below. The notes to the con-
solidated financial statements also conform with Finnish Accounting
legislation.
In 2001 the Group adopted IAS 39, Financial Instruments: Recognition
and Measurement (IAS 39). The effects of adopting the standard are sum-
marized in the consolidated statement of changes in shareholders’ equity,
and further information is disclosed in the accounting policies, Fair
Valuing Principles and Hedge Accounting and in Notes 15, 20 and 34. In
accordance with IAS 39, the comparative financial statements for the
year ended December 31, 2000 have not been restated.
Use of estimatesThe preparation of financial statements in conformity with generally
accepted accounting principles requires management to make estimates
and assumptions that affect the reported amounts of assets and liabilities
and disclosure of contingent assets and liabilities at the date of the
financial statements and the reported amounts of revenues and expenses
during the reporting period. Actual results could differ from those estimates.
Principles of consolidationThe consolidated financial statements include the accounts of Nokia’s
parent company (“Parent Company”), and each of those companies in
which it either owns, directly or indirectly through subsidiaries, over
50% of the voting rights, or over which it has control of their operating
and financial policies. The Group’s share of profits and losses of associated
companies (generally 20% to 50% voting rights or over which the Group
has significant influence) is included in the consolidated profit and loss
account in accordance with the equity method of accounting.
All inter-company transactions are eliminated as part of the consoli-
dation process. Minority interests are presented separately in arriving at
the net profit. They are also shown separately from shareholders’ equity
and liabilities in the consolidated balance sheet.
Profits realized in connection with the sale of fixed assets between
the Group and associated companies are eliminated in proportion to
share ownership. Such profits are deducted from the Group’s equity and
fixed assets and released in the Group accounts over the same period as
depreciation is charged.
The companies acquired during the financial periods presented have
been consolidated from the date on which control of the net assets and
operations was transferred to the Group. Similarly the result of a Group
company divested during an accounting period is included in the Group
accounts only to the date of disposal.
GoodwillAcquisitions of companies are accounted for using the purchase method
of accounting. Goodwill represents the excess of the purchase cost over
the fair value of assets less liabilities of acquired companies. Goodwill is
amortized on a straight-line basis over its expected useful life. Useful
lives vary between two and five years depending upon the nature of the
acquisition. Expected useful lives are reviewed at each balance sheet
date and, where these differ significantly from previous estimates,
amortization periods are changed accordingly.
The Group assesses the carrying value of goodwill annually or, more
frequently, if events or changes in circumstances indicate that such car-
rying value may not be recoverable. If such indication exists the recover-
able amount is determined for the cash-generating unit, to which goodwill
belongs. This amount is then compared to the carrying amount of the
cash-generating unit and any impairment loss is recognized if the
recoverable amount is less than the carrying amount. Impairment losses
are recognized immediately in the profit and loss account.
Transactions in foreign currenciesTransactions in foreign currencies are recorded at the rates of exchange
prevailing at the dates of the individual transactions. For practical reasons,
a rate that approximates the actual rate at the date of the transaction is
often used. At the end of the accounting period the unsettled balances on
foreign currency receivables and liabilities are valued at the rates of
exchange prevailing at the year-end. Foreign exchange gains and losses
related to normal business operations are treated as adjustments to
sales or to cost of sales. Foreign exchange gains and losses associated
with financing are included as a net amount under financial income and
expenses.
Foreign Group companiesIn the consolidated accounts all items in the profit and loss accounts of
foreign subsidiaries are translated into euro at the average exchange
rates for the accounting period. The balance sheets of foreign Group com-
panies are translated into euro at the rates of exchange ruling at the
year-end with the exception of goodwill arising on the acquisition of a
foreign company which is translated to euro at historical rates. Differences
resulting from the translation of profit and loss account items at the
average rate and the balance sheet items at the closing rate are also
treated as an adjustment affecting consolidated shareholders’ equity. On
the disposal of all or part of a foreign Group company by sale, liquidation,
repayment of share capital or abandonment, the cumulative amount or
proportionate share of the translation difference is recognized as income
or as expense in the same period in which the gain or loss on disposal is
recognized.
Fair valuing principlesAt January 1, 2001 the Group adopted IAS 39. The impact of adopting the
standard on shareholders’ equity is quantified in note 20. Under IAS 39,
the Group classifies its investments in marketable debt and equity secu-
rities and investments in unlisted equity securities into the following
categories: held-to-maturity, trading, or available-for-sale depending on
the purpose for acquiring the investments. All investments of the Group
are currently classified as available-for-sale. Available-for-sale invest-
ments are fair valued by using quoted market rates, discounted cash
flow analyses and other appropriate valuation models at the balance
sheet date. Certain unlisted equities for which fair values cannot be mea-
sured reliably are reported at cost less impairment. All purchases and
sales of investments are recorded on the trade date, which is the date

14 | Nokia in 2002
Notes to the consolidated financial statements
that the Group commits to purchase or sell the asset.
The fair value changes of available-for-sale investments are recognized
in shareholders’ equity. When the investment is disposed of, the related
accumulated fair value changes are recycled from shareholders’ equity
into the profit and loss account. An impairment is recorded when the
carrying amount of an available for sale investment is greater than the
estimated fair value and there is objective evidence that the asset is
impaired. The cumulative net loss relating to that investment is removed
from equity and recognized in the profit and loss account for the period.
If, in a subsequent period, the fair value of the investment increases and
the increase can be objectively related to an event occurring after the loss
was recognized, the loss is reversed, with the amount of the reversal in-
cluded in the profit and loss account.
Fair values of forward rate agreements, interest rate options and
futures contracts are calculated based on quoted market rates at the bal-
ance sheet date. Interest rate and currency swaps are valued by using
discounted cash flow analyses. The changes in the fair values of these
contracts are reported in the profit and loss account.
Fair values of cash settled equity derivatives are calculated by revaluing
the contract at year-end quoted market rates. Changes in the fair value
are reported in the profit and loss account.
Forward foreign exchange contracts are valued with the forward ex-
change rate. Changes in fair value are calculated by comparing this with
the original amount calculated by using the contract forward rate pre-
vailing at the beginning of the contract. Currency options are valued at
the balance sheet date by using the Garman & Kohlhagen option valuation
model. Changes in the fair value on these instruments are reported in the
profit and loss account except to the extent they qualify for hedge
accounting.
Embedded derivatives are identified and monitored in the Group and
fair valued at the balance sheet date. In assessing the fair value of em-
bedded derivatives the Group uses a variety of methods, such as option
pricing models and discounted cash flow analysis, and makes assump-
tions that are based on market conditions existing at each balance sheet
date. The fair value changes are reported in financial income and expenses
in the profit and loss account.
Hedge accountingHedging of anticipated foreign currencydenominated sales and purchasesThe Group is applying hedge accounting for “Qualifying hedges”. Qualifying
hedges are those properly documented cash flow hedges of the foreign
exchange rate risk of future anticipated foreign currency denominated
sales and purchases that meet the requirements set out in IAS 39. The
cash flow being hedged must be “highly probable” and must ultimately
impact the profit and loss account. The hedge must be highly effective
both prospectively and retrospectively.
The Group claims hedge accounting in respect of certain forward foreign
exchange contracts and options, or option strategies, which have zero
net premium or a net premium paid, and where the critical terms of the
bought and sold options within a collar or zero premium structure are
the same and where the nominal amount of the sold option component
is no greater than that of the bought option.
For qualifying foreign exchange forwards the change in fair value is
deferred in shareholders’ equity to the extent that the hedge is effective.
For qualifying foreign exchange options the change in intrinsic value is
deferred in shareholders’ equity to the extent that the hedge is effective.
Changes in the time value are at all times taken directly as adjustments
to sales or to cost of sales in the profit and loss account.
Accumulated fair value changes from qualifying hedges are released
from shareholders’ equity into the profit and loss account as adjust-
ments to sales and cost of sales, in the period when the hedged cash flow
affects the profit and loss account. If the hedged cash flow is no longer
expected to take place, all deferred gains or losses are released into the
profit and loss account as adjustments to sales and cost of sales, imme-
diately. If the hedged cash flow ceases to be highly probable, but is still
expected to take place, accumulated gains and losses remain in equity
until the hedged cash flow affects the profit and loss account.
Changes in the fair value of any derivative instruments that do not
qualify under hedge accounting under IAS 39 are recognized immediately
in the profit and loss account.
Foreign currency hedging of net investmentsThe Group also applies hedge accounting for its foreign currency hedging
on net investments. Qualifying hedges are those properly documented
hedges of the foreign exchange rate risk of foreign currency-denominated
net investments that meet the requirements set out in IAS 39. The hedge
must be effective both prospectively and retrospectively.
The Group claims hedge accounting in respect of forward foreign ex-
change contracts, foreign currency-denominated loans, and options, or
option strategies, which have zero net premium or a net premium paid,
and where the terms of the bought and sold options within a collar or
zero premium structure are the same.
For qualifying foreign exchange forwards the change in fair value
that reflects the change in spot exchange rates is deferred in shareholders’
equity. The change in fair value that reflects the change in forward
exchange rates less the change in spot exchange rates is recognized in the
profit and loss account. For qualifying foreign exchange options the
change in intrinsic value is deferred in shareholders’ equity. Changes in
the time value are at all times taken directly to the profit and loss account.
If a foreign currency-denominated loan is used as a hedge, all foreign
exchange gains and losses arising from the transaction are recognized in
shareholders’ equity.
Accumulated fair value changes from qualifying hedges are released
from shareholders’ equity into the profit and loss account only if the legal
entity in the given country is sold or liquidated.
Revenue recognitionSales from the majority of the Group are recognized when persuasive
evidence of an arrangement exists, delivery has occurred, the fee is fixed
and determinable and collectibility is probable.
Sales and cost of sales from contracts involving solutions achieved
through modification of telecommunications equipment are recognized
on the percentage of completion method when the outcome of the contract
can be estimated reliably. Completion is generally measured by reference
to cost incurred to date as a percentage of estimated total project costs.
The milestone output method is applied when the nature of the individual
projects indicates that a milestone method is the most applicable
measure of progress.
The percentage of completion method relies on estimates of total

Nokia in 2002 | 15
Notes to the consolidated financial statements
expected contract revenue and costs, as well as dependable measure-
ment of the progress made towards completing that project. Recognized
revenues and profits are subject to revisions during the project in the
event that the assumptions regarding the overall project outcome are
revised. The cumulative impact of a revision in estimates is recorded in
the period such revisions become known and estimable. Losses on
projects in progress are recognized immediately when known and
estimable.
Shipping and handling costsThe costs of shipping and distributing products are included in cost of sales.
Research and developmentResearch and development costs are expensed in the financial period
during which they are incurred, except for certain development costs
which are capitalized when it is probable that a development project
will be a success, and certain criteria, including commercial and tech-
nological feasibility, have been met. Capitalized development costs are
amortized on a systematic basis over their expected useful lives between
two and five years.
Other intangible assetsExpenditure on acquired patents, trademarks and licenses is capitalized
and amortized using the straight-line method over their useful lives, but
not exceeding 20 years. Where an indication of impairment exists, the
carrying amount of any intangible asset is assessed and written down to
its recoverable amount. Costs of software licenses associated with internal-
use software are capitalized. These costs are included within other
intangible assets and are amortized over a period not to exceed three years.
PensionsThe Group companies have various pension schemes in accordance with
the local conditions and practices in the countries in which they operate.
The schemes are generally funded through payments to insurance com-
panies or to trustee-administered funds as determined by periodic actu-
arial calculations.
The Group’s contributions to defined contribution plans and to multi-
employer and insured plans are charged to the profit and loss account in
the period to which the contributions relate.
For defined benefit plans, principally the reserved portion of the
Finnish TEL system, pension costs are assessed using the projected unit
credit method: the cost of providing pensions is charged to the profit and
loss account so as to spread the regular cost over the service lives of
employees. The pension obligation is measured as the present value of
the estimated future cash outflows using interest rates on government
securities that have terms to maturity approximating the terms of the
related liabilities. Actuarial gains and losses outside the corridor are
recognized over the average remaining service lives of employees.
Property, plant and equipmentProperty, plant and equipment are stated at cost less accumulated depre-
ciation. Depreciation is recorded on a straight-line basis over the expect-
ed useful lives of the assets as follows:
Buildings and constructions 20-33 years
Machinery and equipment 3-10 years
Land and water areas are not depreciated.
Maintenance, repairs and renewals are generally charged to expense
during the financial period in which they are incurred. However, major
renovations are capitalized and included in the carrying amount of the
asset when it is probable that future economic benefits in excess of the
originally assessed standard of performance of the existing asset will
flow to the Group. Major renovations are depreciated over the remaining
useful life of the related asset.
Gains and losses on the disposal of fixed assets are included in operat-
ing profit/loss.
LeasesThe Group has entered into various operating leases the payments under
which are treated as rentals and charged to the profit and loss account
on a straight-line basis over the lease terms.
InventoriesInventories are stated at the lower of cost or net realizable value. Cost is
determined on a first in first out (FIFO) basis. Net realizable value is the
amount that can be realized from the sale of the inventory in the normal
course of business after allowing for the costs of realization.
In addition to the cost of materials and direct labor, an appropriate
proportion of production overheads is included in the inventory values.
An allowance is recorded for obsolescence.
Cash and cash equivalentsThe Group manages its short-term liquidity through holdings of cash and
highly liquid interest-bearing securities (included as current available-
for-sale investments in the balance sheet). For the purposes of the cash
flow statement, these are shown together as cash and cash equivalents.
Accounts receivableAccounts receivable are carried at the original invoice amount to customers
less an estimate made for doubtful receivables based on a periodic
review of all outstanding amounts. Bad debts are written off when identi-
fied.
BorrowingsBorrowings are classified as originated loans and are recognized initially
at an amount equal to the proceeds received, net of transaction costs
incurred. In subsequent periods, they are stated at amortized cost using
the effective yield method; any difference between proceeds (net of
transaction costs) and the redemption value is recognized in the profit
and loss account over the period of the borrowings.
Loans to customersLoans to customers are recorded at amortized cost. Loans are subject to
regular and thorough review as to their collectibility and as to available
collateral; in the event that any loan is deemed not fully recoverable, pro-
vision is made to reflect the shortfall between the carrying amount and
the present value of the expected cash flows. Interest income on loans to
customers is included within other operating income.

16 | Nokia in 2002
Notes to the consolidated financial statements
Income taxesCurrent taxes are based on the results of the Group companies and are
calculated according to local tax rules.
Deferred tax assets and liabilities are determined, using the liability
method, for all temporary differences arising between the tax basis of
assets and liabilities and their carrying values for financial reporting
purposes. Currently enacted tax rates are used in the determination of
deferred income tax.
Under this method the Group is required, in relation to an acquisi-
tion, to make provision for deferred taxes on the difference between the
fair values of the net assets acquired and their tax bases.
The principal temporary differences arise from intercompany profit
in inventory, depreciation on property, plant and equipment, untaxed
reserves and tax losses carried forward. Deferred tax assets relating to
the carry forward of unused tax losses are recognized to the extent that it
is probable that future taxable profit will be available against which the
unused tax losses can be utilized.
Stock optionsStock options are granted to employees. The options are granted with a
fixed exercise price set on a date outlined in the plan. When the options
are exercised, the proceeds received, net of any transaction costs, are
credited to share capital (nominal value) and share premium. Tax benefits
on options exercised in the United States are credited to share issue
premium. Treasury shares are acquired by the Group to meet its obligations
under employee stock compensation plans. When treasury shares are
issued on exercise of stock options any gain or loss is recognized in share
issue premium.
ProvisionsProvisions are recognized when the Group has a present legal or con-
structive obligation as a result of past events, it is probable that an outflow
of resources will be required to settle the obligation and a reliable
estimate of the amount can be made. Where the Group expects a provision
to be reimbursed, the reimbursement would be recognized as an asset
but only when the reimbursement is virtually certain.
The Group recognizes the estimated liability to repair or replace
products still under warranty at the balance sheet date. The provision is
calculated based on historical experience of the level of repairs and
replacements.
The Group recognizes the estimated liability for non-cancellable pur-
chase commitments for inventory in excess of forecasted requirements
at each balance sheet date.
The Group recognizes a provision for the estimated future settle-
ments related to asserted and unasserted Intellectual Property Rights
(IPR) infringements, based on the probable outcome of each case as of
each balance sheet date.
The Group recognizes a provision for social security costs on unexer-
cised stock options granted to employees at the date options are granted.
The provision is measured based on the fair value of the options, and the
amount of the provision is adjusted to reflect the changes in the Nokia
share price.
DividendsDividends proposed by the Board of Directors are not recorded in the
financial statements until they have been approved by the shareholders
at the Annual General Meeting.
Earnings per shareThe Group calculates both basic and diluted earnings per share in accor-
dance with IAS 33, Earnings per share (IAS 33). Under IAS 33, basic earn-
ings per share is computed using the weighted average number of shares
outstanding during the period. Diluted earnings per share is computed
using the weighted average number of shares outstanding during the
period plus the dilutive effect of stock options outstanding during the
period.
2. Segment information
Nokia is organized on a worldwide basis into three primary business
segments: Nokia Mobile Phones, Nokia Networks, and Nokia Ventures
Organization. Nokia’s reportable segments are strategic business units
that offer different products and services for which monthly financial
information is provided to the Board.
Nokia Mobile Phones develops, manufactures and supplies mobile
phones and wireless data products, including a complete range of mobile
phones for all major digital and analog standards worldwide.
Nokia Networks is a leading provider of mobile and IP network infra-
structure and related services. Nokia Networks aims to be a leader in IP
mobility core, radio and broadband access for network providers and
operators.
Nokia Ventures Organization exists to create new businesses outside
the natural development path of the company’s core activities. The unit
comprises venture capital activities, incubation, and a portfolio of new
ventures, including two more mature businesses: Nokia Internet Com-
munications and Nokia Home Communications.
Common Group Functions consists of common research and general
Group functions.
The accounting policies of the segments are the same as those described
in Note 1. Nokia accounts for intersegment revenues and transfers as if
the revenues or transfers were to third parties, that is, at current market
prices. Nokia evaluates the performance of its segments and allocates
resources to them based on operating profit.
No single customer represents 10% or more of Group revenues.

Nokia in 2002 | 17
Notes to the consolidated financial statements
Nokia Nokia Common TotalMobile Nokia Ventures Group reportable Elimina-
2002, EURm Phones Networks Organization Functions segments tions Group
Profit and loss informationNet sales to external customers 22 997 6 538 441 40 30 016 30 016Net sales to other segments 214 1 18 –40 193 –193 –Depreciation and amortization 546 542 33 190 1 311 1 311Impairment and customer finance charges – 400 83 55 538 538Operating profit 5 201 –49 –141 –231 4 780 4 780Share of results of associated companies – – – –19 –19 –19
Balance sheet informationCapital expenditures 1 224 93 8 107 432 432Segment assets 2 4 888 6 163 114 965 12 130 –26 12 104of which: Investments in
associated companies – – – 49 49 49 Unallocated assets 3 11 223
Total assets 23 327
Segment liabilities 4 5 080 1 861 188 225 7 354 –24 7 330Unallocated liabilities 5 1 543
Total liabilities 8 873
2001, EURm
Profit and loss informationNet sales to external customers 23 107 7 521 563 – 31 191 31 191Net sales to other segments 51 13 22 – 86 –86 –Depreciation and amortization 642 511 115 162 1 430 1 430Impairment and customer finance charges – 925 307 80 1 312 1 312Operating profit 4 521 –73 –855 –231 3 362 3 362Share of results of associated companies – – – –12 –12 –12
Balance sheet informationCapital expenditures 1 377 288 23 353 1 041 1 041Segment assets 2 6 087 6 597 260 1 104 14 048 –160 13 888of which: Investments in associated companies – – – 49 49 49Unallocated assets 3 8 539
Total assets 22 427
Segment liabilities 4 4 867 2 084 283 258 7 492 –132 7 360Unallocated liabilities 5 2 666
Total liabilities 10 026
2000, EURm
Profit and loss informationNet sales to external customers 21 844 7 708 824 – 30 376 30 376Net sales to other segments 43 6 30 – 79 –79 –Depreciation and amortization 467 354 102 86 1 009 1 009Operating profit 4 879 1 358 –387 –74 5 776 5 776Share of results of associated companies – – – –16 –16 –16
1 Including goodwill and capitalized development costs, capital expenditures amountto EUR 860 million in 2002 (EUR 2 064 million in 2001). The goodwill and capitalizeddevelopment costs consist of EUR 41 million in 2002 (EUR 59 million in 2001) for NokiaMobile Phones, EUR 377 million in 2002 (EUR 801 million in 2001) for Nokia Networks,EUR 1 million in 2002 (EUR 163 million in 2001) for Nokia Ventures Organization andEUR 9 million in 2002 (EUR 0 million in 2001) for Common Group Functions.
2 Comprises intangible assets, property, plant and equipment, investments, inventoriesand accounts receivable as well as prepaid expenses and accrued income except those
related to interest and taxes.3 Unallocated assets including prepaid expenses and accrued income related to taxes
and deferred tax assets (EUR 853 million in 2002 and EUR 1 106 million in 2001).4 Comprises accounts payable, deferred income, accrued expenses and provisions except
those related to interest and taxes.5 Unallocated liabilities including prepaid income and accrued expenses related to taxes
and deferred tax liabilities (EUR 248 million in 2002 and EUR 1 077 million in 2001).

18 | Nokia in 2002
Notes to the consolidated financial statements
Net sales to external customers 2002 2001 2000
by geographic area EURm EURm EURm
Finland 353 453 494
USA 4 665 5 614 5 312
Great Britain 3 111 2 808 2 828
China 2 802 3 418 3 065
Germany 1 849 2 003 2 579
Other 17 236 16 895 16 098
Total 30 016 31 191 30 376
Segment assets 2002 2001
by geographic area EURm EURm
Finland 4 913 5 087
USA 1 777 2 279
Great Britain 627 519
China 1 107 1 668
Germany 431 611
Other 3 249 3 724
Total 12 104 13 888
Capital expenditures 2002 2001 2000
by market area EURm EURm EURm
Finland 188 477 587
USA 1 71 151 279
Great Britain 27 34 75
China 47 131 157
Germany 21 37 133
Other 1 78 211 349
Total 432 1 041 1 580
1 Including goodwill and capitalized development costs, capital expenditures amountto EUR 860 million in 2002 (EUR 2 064 million in 2001 and EUR 2 990 million in 2000).The goodwill and capitalized development costs consist of EUR 1 million in USA in 2002(EUR 582 million in 2001 and EUR 567 in 2000) and EUR 427 million in other areas in 2002(EUR 441 million in 2001 and EUR 843 in 2000).
3. Percentage of completionContract sales recognized under the percentage of completion method
were approximately EUR 5.9 billion in 2002 (EUR 6.7 billion in both 2001
and 2000). Billings in advance of contract revenues, included in advance
payments, were EUR 108 million at December 31, 2002 (EUR 146 million in
2001 and EUR 97 million in 2000). Contract revenues recorded prior to
billings were EUR 573 million at December 31, 2002 (EUR 319 million in
2001 and EUR 418 million in 2000).
Revenue recognition on initial 3G network contracts started in 2002
when Nokia Networks reached the relevant milestones for its single-
mode and dual-mode WCDMA 3G systems.
4. Personnel expenses2002 2001 2000
EURm EURm EURm
Wages and salaries 2 531 2 388 2 378
Pension expenses, net 224 193 54
Other social expenses 385 524 456
Personnel expenses as per
profit and loss account 3 140 3 105 2 888
Pension expenses comprise EUR 167 million in 2002 (EUR 196 million in
2001 and EUR 93 million in 2000) in respect of multi-employer, insured
and defined contribution plans.
Remuneration of the Chairman and the
other members of the Board of Directors,
Group Executive Board and Presidents
and Managing Directors * 19 16 17
* Incentives included in remuneration 4 2 4
Pension commitments for the management:
The retirement age of the management of the Group companies is
between 60–65 years. For the Chief Executive Officer and the President of
the Parent Company the retirement age is 60 years.
5. PensionsThe most significant pension plans are in Finland and are comprised of
the Finnish state TEL system with benefits directly linked to employee
earnings. These benefits are financed in two distinct portions. The
majority of benefits are financed by contributions to a central pool with
the majority of the contributions being used to pay current benefits. The
other part comprises reserved benefits which are pre-funded through
the trustee-administered Nokia Pension Foundation. The pooled portion
of the TEL system is accounted for as a defined contribution plan and the
reserved portion as a defined benefit plan. The foreign plans include
both defined contribution and defined benefit plans.

Nokia in 2002 | 19
Notes to the consolidated financial statements
The amounts recognized in the balance sheet relating to single employer
defined benefit schemes are as follows:
2002 2001
Domestic Foreign Domestic Foreign
Plans Plans Plans Plans
EURm EURm EURm EURm
Fair value of plan assets 636 126 664 123
Present value of funded
obligations –539 –261 –530 –236
Surplus/(Deficit) 97 –135 134 –113
Unrecognized net actuarial
(gains)/losses 45 63 4 48
Prepaid/(Accrued) pension
cost in balance sheet 142 –72 138 –65
The amounts recognized in the profit and loss account are as follows:
2002 2001 2000
EURm EURm EURm
Current service cost 58 49 40
Interest cost 47 40 36
Expected return on plan assets –61 –75 –78
Net actuarial losses (gains)
recognized in year 2 –16 –24
Past service cost 11 – –
Curtailment – –1 –
Total, included in personnel expenses 57 –3 –26
Movements in prepaid pension costs recognized in the balance sheet are
as follows: 2002 2001
EURm EURm
Prepaid pension costs at beginning of year 73 55
Net income (expense) recognized in
the profit and loss account –57 3
Contributions paid 54 15
Prepaid pension costs at end of year 70 * 73 *
* Included within prepaid expenses and accrued income.
The principal actuarial weighted average assumptions used were as
follows:2002 2001
Domestic Foreign Domestic Foreign% % % %
Discount rate for determining
present values 5.50 5.58 5.80 5.85
Expected long term rate of
return on plan assets 7.25 6.56 7.50 6.49
Annual rate of increase in future
compensation levels 3.50 3.09 4.00 3.05
Pension increases 2.30 2.29 2.80 2.87
The prepaid pension cost above is made up of a prepayment of EUR 150
million (EUR 146 million in 2001) and an accrual of EUR 80 million (EUR 73
million in 2001).
The domestic pension plan assets include Nokia securities with fair values
of EUR 125 million in 2002 (EUR 332 million in 2001).
The foreign pension plans’ assets include a loan provided to Nokia by the
Group’s German pension fund of EUR 66 million (EUR 66 million in 2001).
See Note 31.
The actual return on plan assets was EUR –66 million in 2002 EUR –253
million in 2001).
6. Selling and marketing expenses, administrationexpenses and other operating income and expenses
2002 2001 2000
EURm EURm EURm
Selling and marketing expenses –2 579 –2 363 –2 103
Administration expenses –701 –737 –754
Other operating expenses –292 –605 –225
Other operating income 333 182 278
Total –3 239 –3 523 –2 804
Other operating income for 2002 includes a gain of EUR 106 million relat-
ing to the sale of Nokia Venture Partners’ investment in PayPal within
Nokia Ventures Organization. Other operating expenses for 2002 are com-
posed of various items which are individually insignificant.
Other operating expenses for 2001 include restructuring charges of
EUR 166 million.
Other operating income for 2000 includes a pension credit of EUR 55
million relating to the change in accounting method for the Finnish pen-
sion plans. Other operating expenses for 2000 are composed of various
items which are individually insignificant.
The Group expenses advertising and promotion costs as incurred.
Advertising and promotional expenses were EUR 1 174 million in 2002
(EUR 849 million in 2001 and EUR 853 million in 2000).

20 | Nokia in 2002
Notes to the consolidated financial statements
During 2002, Nokia recorded net customer financing impairment charges
of EUR 279 million. Of this amount, EUR 292 million was an impairment
of loans receivable with a carrying value of approximately EUR 0.8 billion
from MobilCom, a customer of Nokia Networks, as a result of financial
difficulties of MobilCom. Such loans have been reduced to their estimated
recoverable amounts, based on the estimated fair value of the subordi-
nated convertible perpetual bonds of France Telecom S.A., a shareholder
of MobilCom, that Nokia expects to receive as repayment for the loans to
MobilCom pursuant to an agreement with France Telecom. The estimated
fair value will be reassessed upon approval from the respective boards
and shareholders of MobilCom and France Telecom. Also in 2002, Nokia
received EUR 13 million as partial recovery of amounts written off in
2001 related to Dolphin.
During 2001, Nokia recorded an impairment charge of EUR 714 million
to cover Nokia Networks’ customer loans by EUR 669 million related to a
defaulted financing to Telsim, a GSM operator in Turkey, and EUR 45 million
relating to the insolvency of Dolphin in the UK. These charges resulted in
a write-down of the company’s total customer financing exposure to
Telsim and Dolphin.
In 2002, Nokia has evaluated the carrying value of goodwill arising
from certain acquisitions by determining if the carrying values of the net
assets of the cash generating unit to which the goodwill belongs exceeds
the recoverable amounts of that unit. In the Nokia Networks business,
Nokia recorded an impairment charge of EUR 104 million on goodwill
related to the acquisition of Amber Networks. The recoverable amount
for Amber Networks has been derived from the value in use discounted
cash flow projections which cover the estimated life of the Amber platform
technology, using a discount rate of 15%. The remaining goodwill of EUR
207 million is being amortized over the expected useful life. The impairment
is a result of significant declines in the market outlook for products
under development. In the Nokia Networks business in 2001, Nokia rec-
ognized a goodwill impairment charge of EUR 170 million related to the
acquisition of Nokia DiscoveryCom, as a result of a decision to discontinue
the related product development.
In 2002 and 2001, Nokia recognized impairment losses of EUR 36 million
and EUR 88 million, respectively, on goodwill related to the acquisition of
Ramp Networks. In 2002 and 2001, Nokia recognized impairment losses
of EUR 25 and EUR 181 million, respectively, on goodwill related to the
acquisition of Network Alchemy. Both of these entities are part of the
Nokia Internet Communications business unit of Nokia Ventures Organiza-
tion. For the impairments in 2001 the recoverable amounts were calcu-
lated based on value in use discounted cash flow projections using a dis-
count rate of 13%. The impairments in 2001 resulted from the restructuring
of these businesses. In 2002, the remaining goodwill balances were written
off as a result of decisions to discontinue the related product develop-
ment.
Nokia recognized other minor goodwill impairment charges totaling
EUR 17 million in 2002 (EUR 78 million in 2001).
During 2002 the company’s investments in certain equity securities
suffered a permanent decline in fair value resulting in impairment
charges of EUR 77 million relating to non-current available-for-sale
investments (EUR 80 million in 2001).
8. AcquisitionsIn 2002, Nokia increased its voting percentage of 39.97% and holding per-
centage of 59.97% in Nextrom Holding S.A. to a voting percentage of
86.21% and a holding percentage of 79.33%. These increases resulted
from a rights offering by Nextrom in June 2002 and by acquiring new
registered and bearer shares in an offering by Nextrom in December 2002
both totaling EUR 13 million. The fair value of net assets acquired was
EUR 4 million giving rise to goodwill of EUR 9 million.
In August 2001 Nokia acquired Amber Networks, a networking infra-
structure company, for EUR 408 million, which was paid in Nokia stock
and Nokia stock options. The fair value of net assets acquired was EUR
–13 million giving rise to goodwill of EUR 421 million.
In January 2001 Nokia acquired in a cash tender offer Ramp Networks,
a provider of purpose built Internet security appliances, for EUR 147
million. The fair value of net assets acquired was EUR –16 million giving
rise to goodwill of EUR 163 million.
In October 2000 Nokia increased its ownership of the Brazilian handset
manufacturing joint venture NG Industrial (NGI) from 51% to 100% by
acquiring all the shares of NGI held by Gradiente Telecom S.A. for EUR 492
7. ImpairmentCommon
Nokia Nokia Nokia Ventures Group2002, EURm Mobile Phones Networks Organization Functions Group
Customer finance impairment charges, net – 279 – – 279
Impairment of goodwill – 121 61 – 182
Impairment of available-for-sale investments – – 22 55 77
Total, net – 400 83 55 538
2001, EURm
Customer finance impairment charges – 714 – – 714
Impairment of goodwill – 211 307 – 518
Impairment of available-for-sale investments – – 6 74 80
Total – 925 313 74 1 312

Nokia in 2002 | 21
Notes to the consolidated financial statements
million in cash. The fair value of net assets acquired was EUR 43 million
giving rise to goodwill of EUR 449 million.
In August 2000 Nokia acquired DiscoveryCom, a company which
provides solutions that enable communications service providers to rapidly
install and maintain Broadband Digital Subscriber Line (DSL) services for
fast Internet access. The acquisition price was EUR 223 million, which
was paid in Nokia stock and Nokia stock options. The fair value of net
assets acquired was EUR –4 million giving rise to goodwill of EUR 227
million.
In March 2000 Nokia acquired Network Alchemy, a provider of IP Clus-
tering solutions for EUR 336 million, which was paid in Nokia stock and
Nokia stock options. The fair value of net assets acquired was EUR –2
million giving rise to goodwill of EUR 338 million.
9. Depreciation and amortization
Depreciation and 2002 2001 2000
amortization by asset category EURm EURm EURm
Intangible assets
Capitalized development costs 233 169 118
Intangible rights 65 65 50
Goodwill 206 302 140
Other intangible assets 28 34 29
Property, plant and equipment
Buildings and constructions 37 31 27
Machinery and equipment 737 811 615
Other tangible assets 5 18 30
Total 1 311 1 430 1 009
Depreciation and amortization by function
Cost of sales 314 367 298
R&D 473 427 244
Selling, marketing and administration 211 264 230
Other operating expenses 107 70 97
Goodwill 206 302 140
Total 1 311 1 430 1 009
10. Financial income and expenses2002 2001 2000
EURm EURm EURm
Income from available-for-sale investments
Dividend income 25 27 70
Interest income 230 215 212
Other financial income 27 24 17
Exchange gains and losses –29 –25 –1
Interest expense –43 –82 –115
Other financial expenses –54 –34 –81
Total 156 125 102
11. Income taxes2002 2001 2000
EURm EURm EURm
Current tax –1 423 –1 542 –1 852
Deferred tax –61 350 68
Total –1 484 –1 192 –1 784
Finland –1 102 –877 –1 173
Other countries –382 –315 –611
Total –1 484 –1 192 –1 784
The differences between income tax expense computed at statutory rates
(29% in Finland in 2002, 2001 and 2000) and income tax expense provided
on earnings are as follows at December 31:
2002 2001 2000
EURm EURm EURm
Income tax expense at statutory rate 1 431 1 011 1 689
Deduction for write-down of
investments in subsidiaries – –37 –28
Amortization of goodwill 59 87 40
Impairment of goodwill 70 197 –
Provisions without income
tax benefit/expense –10 5 53
Taxes for prior years 8 23 53
Taxes on foreign subsidiaries’ net income in
excess of income taxes at statutory rates –59 –106 –29
Operating losses with no current tax benefit 6 16 25
Other –21 –4 –19
Income tax expense 1 484 1 192 1 784
At December 31, 2002 the Group had loss carryforwards, primarily attrib-
utable to foreign subsidiaries of EUR 425 million (EUR 75 million in 2001
and EUR 109 million in 2000), most of which will expire between 2006
and 2022.
Certain of the Group companies’ income tax returns for periods rang-
ing from 1998 through 2001 are under examination by tax authorities.
The Group does not believe that any significant additional taxes in excess
of those already provided for will arise as a result of the examinations.

22 | Nokia in 2002
Notes to the consolidated financial statements
12. Intangible assets2002 2001EURm EURm
Capitalized development costs
Acquisition cost Jan. 1 1 314 1 097
Additions 418 431
Write-downs –25 –214
Accumulated amortization Dec. 31 –635 –421
Net carrying amount Dec. 31 1 072 893
Goodwill
Acquisition cost Jan. 1 1 601 1 570
Additions 10 592
Disposals – –43
Impairment charges (Note 7) –182 –518
Accumulated amortization Dec. 31 –953 –747
Net carrying amount Dec. 31 476 854
Other intangible assets
Acquisition cost Jan. 1 533 459
Additions 75 111
Disposals –72 –33
Translation differences –12 –4
Accumulated amortization Dec. 31 –332 –296
Net carrying amount Dec. 31 192 237
13. Property, plant and equipment2002 2001EURm EURm
Land and water areas
Acquisition cost Jan. 1 145 143
Additions 1 14
Disposals –31 –11
Translation differences –3 –1
Net carrying amount Dec. 31 112 145
Buildings and constructions
Acquisition cost Jan. 1 918 739
Additions 9 190
Disposals –7 –6
Translation differences –9 –5
Accumulated depreciation Dec. 31 –171 –147
Net carrying amount Dec. 31 740 771
2002 2001EURm EURm
Machinery and equipment
Acquisition cost Jan. 1 3 626 3 343
Additions 346 780
Disposals –637 –470
Translation differences –86 –27
Accumulated depreciation Dec. 31 –2 303 –2 194
Net carrying amount Dec. 31 946 1 432
Other tangible assets
Acquisition cost Jan. 1 79 74
Additions 7 45
Disposals –58 –37
Translation differences –6 –3
Accumulated depreciation Dec. 31 –6 –50
Net carrying amount Dec. 31 16 29
Advance payments and fixed assets under construction
Acquisition cost Jan. 1 137 314
Additions 35 152
Disposals –68 –73
Transfers to:
Other intangible assets –7 –3
Land and water areas – –4
Buildings and constructions – –84
Machinery and equipment –34 –160
Translation differences –3 –5
Net carrying amount Dec. 31 60 137
Total property, plant and equipment 1 874 2 514
14. Investments in associated companies
2002 2001EURm EURm
Net carrying amount Jan. 1 49 61
Additions 24 7
Write-downs – –6
Share of results –19 –12
Translation differences 1 –1
Other movements –6 –
Net carrying amount Dec. 31 49 49
In 2001, Nextrom Holding S.A. was accounted for under the equity method.
Due to the increase of Nokia’s ownership in 2002 Nextrom Holding S.A.
has been fully consolidated for accounting purposes from the date of
increased ownership which is reflected in other movements. Sharehold-
ings in associated companies include no listed investments in 2002 (EUR 6
million in 2001 with fair value, based on quoted market prices, of EUR 19
million in 2001). See note 8.

Nokia in 2002 | 23
Notes to the consolidated financial statements
15. Available-for-sale investments2002 2001EURm EURm
At Jan. 1 as originally stated (cost) 3 111
On adoption of IAS 39 at January 1,
2001 remeasurement to fair value 58
Fair value at Jan. 1 4 670 3 169
Additions, net 3 587 1 581
Decrease in fair value –87 –
Impairment charges (Note 7) –77 –80
Fair value at Dec. 31 8 093 4 670
Non-current 238 399
Current 7 855 4 271
On the adoption of IAS 39 at January 1, 2001, all investment securities
classified as available-for-sale were remeasured to fair value. The differ-
ence between their original carrying amount and their fair value at
January 1, 2001 was credited to fair value and other reserves (See Consol-
idated Statement of Changes in Shareholders’ Equity). Gains and losses
arising from the change in the fair value of available-for-sale invest-
ments since that date are recognized directly in this reserve.
Available-for-sale investments, comprising marketable debt and eq-
uity securities and investments in unlisted equity shares, are fair valued,
except in the case of certain unlisted equities, where the fair value can-
not be measured reliably. Such unlisted equities are carried at cost, less
impairment (EUR 48 million in 2002 and EUR 153 million in 2001). Fair
value for equity investments traded in active markets and for unlisted
equities, where the fair value can be measured reliably, is EUR 190 mil-
lion in 2002 and EUR 169 million in 2001. Fair value for equity invest-
ments traded in active markets is determined by using exchange quoted
bid prices. For other investments, fair value is estimated by using the
current market value of similar instruments or by reference to the dis-
counted cash flows of the underlying net assets.
Available-for-sale investments are classified as non-current, except
for highly liquid, interest-bearing investments held as part of the Group’s
on-going cash management activities and which are regarded as cash
equivalents. See Note 34 for details of these investments.
16. Long-term loans receivableLong-term loans receivable consists of loans made to customers princi-
pally to support their financing of network infrastructure purchased
from Nokia Networks, net of allowances and write-offs (see Note 7), are
repayable as follows:
2002 2001EURm EURm
Under 1 year – –
Between 1 and 2 years 494 643
Between 2 and 5 years – 341
Over 5 years 562 144
1 056 1 128
17. Inventories2002 2001EURm EURm
Raw materials, supplies and other 534 741
Work in progress 432 582
Finished goods 311 465
Total 1 277 1 788
18. ReceivablesPrepaid expenses and accrued income mainly consist of VAT and tax
receivables, prepaid pension costs, accrued interest income and other
accruals.
Accounts receivable include EUR 21 million (EUR 25 million in 2001)
due more than 12 months after the balance sheet date.
19. Valuation and qualifying accountsBalance at Charged to cost Charged to Balance at
Allowances on beginning of year and expenses other accounts Deductions 1 end of yearassets to which they apply: EURm EURm EURm EURm EURm
2002
Doubtful accounts receivable 217 186 – –103 300
Long-term loans receivable 13 – – –13 –
Inventory obsolescence 314 318 – –342 290
2001
Doubtful accounts receivable 236 108 – –127 217
Long-term loans receivable 59 – – –46 13
Inventory obsolescence 263 334 – –283 314
2000
Doubtful accounts receivable 87 203 – –54 236
Long-term loans receivable – 59 – – 59
Inventory obsolescence 168 457 – –362 263
1 Deductions include utilization and releases of the allowances.

24 | Nokia in 2002
Notes to the consolidated financial statements
20. Fair value and other reserves
Hedging reserve Available-for-sale TotalBalance at Jan. 1, 2001 EURm investments, EURm EURm
Effect of adopting IAS 39;
Fair valuation of current available-for-sale securities 43 43
Fair valuation of non-current available-for-sale securities 15 15
Transfer of gains and losses on qualifying cash flow hedging derivatives –114 –114
Balance at Jan. 1, 2001, restated –114 58 –56
Cash flow hedges:
Fair value gains/(losses) in period 76 76
Available-for-sale investments:
Net fair value gains/(losses) –67 –67
Transfer to profit and loss account on impairment 74 74
Transfer to profit and loss account on disposal –7 –7
Balance at Dec. 31, 2001 –38 58 20
Cash flow hedges:
Fair value gains/(losses) in period 60 60
Available-for-sale investments:
Net fair value gains/(losses) –155 –155
Transfer to profit and loss account on impairment 67 67
Transfer to profit and loss account on disposal 1 1
Balance at Dec. 31, 2002 1, 2 22 –29 –7
1 The tax on the balance of the cash flow hedges was EUR –9 million.2 The tax on the balance of the available-for-sale investments was EUR –16 million.
The Group adopted IAS 39 at January 1, 2001; the impact on shareholders’
equity and on various balance sheet captions at January 1, 2001 is shown
above. In accordance with IAS 39, the comparative financial statements
for the year ended December 31, 2000 are not restated.
In accordance with the transitional requirements of IAS 39, the Group
transferred a net loss of EUR 114 million to the hedging reserve in respect
of outstanding foreign exchange forward contracts that were properly
designated and highly effective as cash flow hedges of highly probable
forecast foreign currency cash flows. Previously such gains and losses
were reported as deferred income or expenses in the balance sheet.
In order to ensure that amounts deferred in the cash flow hedging
reserve represent only the effective portion of gains and losses on prop-
erly designated hedges of future transactions that remain highly proba-
ble at the balance sheet date, Nokia has adopted a process under which
all derivative gains and losses are initially recognized in the profit and
loss account. The appropriate reserve balance is calculated at the end of
each period and posted to equity.
Nokia continuously reviews the underlying cash flows and the hedges
allocated thereto, to ensure that the amounts transferred to the Hedging
Reserve during the year ended December 31, 2002 and 2001 do not in-
clude gains/losses on forward exchange contracts that have been desig-
nated to hedge forecasted sales or purchases that are no longer expected
to occur. Because of the number of transactions undertaken during each
period and the process used to calculate the reserve balance, separate
disclosure of the transfers of gains and losses to and from the reserve
would be impractical.
All of the net fair value gains or losses recorded in the Fair value and
other reserve at December 31, 2002 on open forward foreign exchange
contracts which hedge anticipated future foreign currency sales or pur-
chases are transferred from the Hedging Reserve to the profit and loss
account when the forecasted foreign currency cash flows occur, at vari-
ous dates up to 1 year from the balance sheet date.
See note 15 for impact of adopting IAS 39 on available-for-sale invest-
ments at January 1, 2001.
21. The shares of the Parent CompanySee note 18 to Notes to the financial statements of the Parent company.

Nokia in 2002 | 25
Notes to the consolidated financial statements
22. Distributable earnings2002, EURm
Retained earnings 11 661
Translation differences (distributable earnings) –178
Treasury shares –20
Other non-distributable items
Portion of untaxed reserves 2
Distributable earnings Dec. 31 11 465
Retained earnings under IAS and Finnish Accounting Standards (FAS) are
substantially the same. Distributable earnings are calculated based on Fin-
nish legislation.
The long-term loan portfolio includes a fixed-rate loan with a face
amount of GBP 40 million that matures in 2004. The loan has been callable
by the creditor on a three-month notice basis since 1994, although the
Group does not anticipate that the creditor will request repayment prior to
the final maturity. Accordingly the loan has not been classified as a
current liability at December 31, 2002.
The Group has committed credit facilities totaling USD 2.6 billion.
Committed credit facilities are intended to be used for U.S. and Euro Commer-
cial Paper Programs back up purposes. Commitment fees on the facilities
vary from 0.06% to 0.10% per annum.
At December 31, 2002 and 2001 the weighted average interest rate on
loans from financial institutions was 8.44% and 6.0%, respectively.
2002 2001Bonds: Million Interest EURm EURm
1989 – 2004 40.0 GBP 11.375% 62 65
1993 – 2003 150.0 FIM Floating – 25
62 90
The long-term liabilities excluding deferred tax liabilities as of
December 31, 2002 mature as follows:
Per cent
EURm of total
2003 – –
2004 161 63.40%
2005 26 10.20%
2006 – –
2007 – –
Thereafter 67 26.40%
254 100.00%
The currency mix of the Group long-term liabilities as at December 31,
2002 was as follows:
EUR CNY GBP Others
30.39% 26.22% 24.43% 18.96%
23. Long-term liabilities Outstanding Repayment date OutstandingDec. 31, 2002 beyond 5 years Dec. 31, 2001
EURm EURm EURm
Long-term loans are repayable as follows:
Bonds 62 – 90
Loans from financial institutions 98 – 76
Loans from pension insurance companies 15 – 25
Other long-term finance loans 12 – 16
Other long-term liabilities 67 67 76
254 67 283
Deferred tax liabilities 207 177
Total long-term liabilities 461 460

26 | Nokia in 2002
Notes to the consolidated financial statements
24. Deferred taxes2002 2001EURm EURm
Deferred tax assets:
Intercompany profit in inventory 48 114
Tax losses carried forward 109 42
Warranty provision 118 214
Other provisions 183 327
Other temporary differences 168 135
Untaxed reserves 105 –
Total deferred tax assets 731 832
Deferred tax liabilities:
Untaxed reserves –33 –21
Fair value gains/losses –25 –11
Other –149 –145
Total deferred tax liabilities –207 –177
Net deferred tax asset 524 655
The tax (charged)/credited to 2002 2001
shareholders’ equity is as follows: EURm EURm
Fair value and other reserves,
fair value gains/losses –25 –11
Deferred income tax liabilities have not been established for withholding
tax and other taxes that would be payable on the unremitted earnings of
certain subsidiaries, as such earnings are permanently reinvested. At
December 31, 2002 the Group had loss carryforwards of EUR 91 million
(EUR 8 million in 2001) for which no deferred tax asset was recognized
due to uncertainty of utilization of these loss carryforwards. These loss
carryforwards will expire in years 2006 through 2010.
25. Short-term borrowingsShort-term borrowings consist primarily of borrowings from banks
denominated in different foreign currencies. The weighted average
interest rate at December 31, 2002 and 2001 is 6.01% and 4.9%, respec-
tively.
26. Accrued expenses2002 2001EURm EURm
Social security, VAT and other taxes 385 1 339
Wages and salaries 212 217
Prepaid income 196 294
Other * 1 818 1 627
Total 2 611 3 477
* Other includes various amounts which are individually insignificant.
27. ProvisionsIPR infrin-
Warranty gements Other Total
EURm EURm EURm EURm
At Jan. 1, 2002 1 207 201 776 2 184
Exchange differences –27 – – –27
Additional provisions 1 389 93 27 1 509
Change in fair value – – –58 –58
Unused amounts reversed –7 – –18 –25
Charged to profit and
loss account 1 382 93 –49 1 426
Utilized during year –959 –21 –133 –1 113
At Dec. 31, 2002 1 603 273 594 2 470
2002 2001
EURm EURm
Analysis of total provisions at December 31:
Non-current 460 465
Current 2 010 1 719
The IPR provision is based on estimated future settlements for asserted
and unasserted past IPR infringements. Final resolution of IPR claims
generally occurs over several periods. This results in varying usage of the
provision year to year.
Other provisions mainly include provisions for non-cancellable
purchase commitments, tax provisions and a provision for social
security costs on stock options.
28. Earnings per share2002 2001 2000
Numerator/EURm
Basic/Diluted:
Net profit 3 381 2 200 3 938
Denominator/1 000 shares
Basic:
Weighted average shares 4 751 110 4 702 852 4 673 162
Effect of dilutive securities:
stock options 36 932 84 367 119 818
Diluted:
Adjusted weighted average shares
and assumed conversions 4 788 042 4 787 219 4 792 980
Under IAS 33, basic earnings per share is computed using the weighted
average number of shares outstanding during the period. Diluted earn-
ings per share is computed using the weighted average number of shares
outstanding during the period plus the dilutive effect of stock options
outstanding during the period.

Nokia in 2002 | 27
Notes to the consolidated financial statements
29. Commitments and contingencies2002 2001EURm EURm
Collateral for our own commitments
Property under mortgages 18 18
Assets pledged 13 4
Contingent liabilities on behalf of Group companies
Other guarantees 339 505
Collateral given on behalf of other companies
Securities pledged 1 34 33
Contingent liabilities on behalf of other companies
Guarantees for loans 1 57 95
Financing commitments
Customer financing 1 857 2 995
1 See also Note 34(b).
The amounts above represent the maximum principal amount of com-
mitments and contingencies.
Property under mortgages given as collateral for our own commit-
ments include mortgages given to the Finnish National Board of Customs
as a general indemnity of EUR 18 million in 2002 (EUR 18 million in 2001).
Assets pledged for the Group’s own commitments include inventories
and available-for-sale investments of EUR 3 million and EUR 10 million,
respectively, in 2002 (EUR 4 million of inventories in 2001).
Other guarantees include guarantees of Nokia’s performance of EUR
332 million in 2002 (EUR 505 million in 2001). These guarantees are provided
to certain Nokia Networks’ customers in the form of bank guarantees,
standby letters of credit and other similar instruments. These instruments
entitle the customer to claim payment as compensation for non-
performance by Nokia of its obligations under network infrastructure
supply agreements. Depending on the nature of the instrument, compensa-
tion is payable either immediately upon request, or subject to
independent verification of nonperformance by Nokia.
Securities pledged and guarantees for loans on behalf of other com-
panies of EUR 91 million in 2002 (EUR 127 million in 2001) represent guaran-
tees relating to payment by certain Nokia Networks’ customers under
specified loan facilities between such customers and their creditors.
Nokia’s obligations under such guarantees are released upon the earlier
of expiration of the guarantee or early payment by the customer. The
majority of the financial guarantees is expected to expire by 2004.
Financing commitments of EUR 857 million in 2002 (EUR 2 955 million
in 2001) are available under loan facilities negotiated with customers of
Nokia Networks. Availability of the amounts is dependent upon the bor-
rower’s continuing compliance with stated financial and operational
covenants and compliance with other administrative terms of the facility.
The loans are primarily available to fund capital expenditure
relating to purchases of network infrastructure equipment and services
from Nokia Networks, though some portion of certain loans could be
used to fund interest on the same facility, or working capital require-
ments. Certain loans are partially secured through either guarantees by
the borrower’s direct or indirect parent or other group companies, or
shares and/or other assets of the borrower, its parent or other entities
under common ownership.
There is no market for the guarantees listed above and they were issued
without explicit cost; therefore, it is not practicable to establish the fair
value of such instruments.
The Group is party to routine litigation incidental to the normal conduct
of business. In the opinion of management, the outcome of and liabilities
in excess of what has been provided for related to these proceedings, in
the aggregate, are not likely to be material to the financial condition or
results of operations.
As of December 31, 2002, the Group had purchase commitments of
EUR 949 million relating to inventory purchase obligations, primarily for
purchases in 2003.
30. Leasing contractsThe Group leases office, manufacturing and warehouse space under var-
ious non-cancellable operating leases. Certain contracts contain renewal
options for various periods of time.
The future costs for non-cancellable leasing contracts are as follows:
Operating2002 lease
Leasing payments, EURm 2003 189
2004 125
2005 88
2006 75
2007 72
Thereafter 155
Total 704
Rental expense amounted to EUR 384 million in 2002 (EUR 393 million in
2001 and EUR 370 million in 2000).
31. Related party transactionsNokia Pension Foundation is a separate legal entity that manages and
holds in trust the assets for the Group’s Finnish employee benefit plans;
these assets include 0.2% of Nokia’s shares. Nokia Pension Foundation is
also the counterparty to equity swap agreements with the Group. The
equity swaps are entered into to hedge part of the company’s liability
relating to future social security cost on stock options. During the year
new transactions are entered into and old ones terminated based on the
hedging need. The transactions and terminations are executed on standard
commercial terms and conditions. The notional amount of the equity
swaps outstanding at December 31, 2002 is EUR 12 million (EUR 182
million in 2001). The fair value of the equity swaps at December 31, 2002
is EUR 0 million (EUR 10 million in 2001).
At December 31, 2002 the Group has a contribution payment liability
to Nokia Pension Foundation amounting to EUR 14 million (EUR 21 million
in 2001) included in accrued expenses.
At December 31, 2002 the Group had borrowings amounting to EUR 66
million (EUR 66 million in 2001) from Nokia Unterstützungskasse mbH,
the Group’s German pension fund, which is a separate legal entity.

28 | Nokia in 2002
Notes to the consolidated financial statements
The Group recorded net rental expense of EUR 2 million in 2002 (EUR 4
million in 2001 and EUR 3 million in 2000) pertaining to a sale-leaseback
transaction with the Nokia Pension Foundation involving certain build-
ings and a lease of the underlying land.
There were no loans granted to top management at December 31,
2002 or 2001. See Note 4, Personnel expenses, for officers and directors
remunerations.
32. Associated companies2002 2001 2000
EURm EURm EURm
Share of results of associated companies –19 –12 –16
Dividend income 1 – 1
Share of shareholders’ equity of
associated companies 30 41 45
Receivables from associated companies
Accounts receivable – – 4
Short-term loans receivable – 2 1
Long-term loans receivable – – 31
Liabilities to associated companies 7 – –
33. Notes to cash flow statement2002 2001 2000
EURm EURm EURm
Adjustments for:
Depreciation and amortization (Note 9) 1 311 1 430 1 009
(Profit)/loss on sale of property,
plant and equipment and
available-for-sale investments –92 148 –42
Income taxes (Note 11) 1 484 1 192 1 784
Share of results of associated
companies (Note 32) 19 12 16
Minority interest 52 83 140
Financial income and expenses (Note 10) –156 –125 –102
Impairment charges 524 1 312 –
Other 9 80 –
Adjustments, total 3 151 4 132 2 805
Change in net working capital
Decrease (increase) in
short-term receivables 25 –286 –2 304
Decrease (increase) in inventories 243 434 –422
Increase in interest-free
short-term liabilities 687 830 1 349
Change in net working capital 955 978 –1 377
Non-cash investing activities
Acquisition of:
Amber Networks – 408 –
Network Alchemy – – 336
DiscoveryCom – – 223
Total – 408 559
34. Risk management
General risk management principlesNokia’s overall risk management philosophy is based on having a corporate-
wide view on key risks including strategic, operational, financial and
hazard risks. Risk management in Nokia means a systematic and pro-
active way to analyse, review and manage all opportunities, threats and
risks related to the Group’s activities.
The principles documented in the Group’s risk policy and accepted by
the Nokia Board require that risk management is integrated into each
business process. Business or function owners always have risk owner-
ship. Key risks are reported to the Group level to enable group-wide risk
management. There are specific risk management policies covering, for
example, treasury and customer finance risks.
Financial risksThe key financial targets for Nokia are growth, profitability, operational
efficiency and a strong balance sheet. The objective for the Treasury
function is twofold: to guarantee cost-efficient funding for the Group at
all times, and to identify, evaluate and hedge financial risks in close
co-operation with the business groups. There is a strong focus in Nokia
on creating shareholder value. The Treasury function supports this aim
by minimizing the adverse effects caused by fluctuations in the financial
markets on the profitability of the underlying businesses and by managing
the balance sheet structure of the Group.
Nokia has Treasury Centers in Geneva, Singapore/Beijing and Dallas
/Sao Paolo, and a Corporate Treasury unit in Espoo. This international
organization enables Nokia to provide the Group companies with financial
services according to local needs and requirements.
The Treasury function is governed by policies approved by top manage-
ment. Treasury Policy provides principles for overall financial risk
management and determines the allocation of responsibilities for financial
risk management in Nokia. Operating Policies cover specific areas such
as foreign exchange risk, interest rate risk, use of derivative financial
instruments, as well as liquidity and credit risk. The Treasury operating
policy in Nokia is risk averse. Business Groups have detailed Standard
Operating Procedures supplementing the Treasury policy in financial
risk management related issues.
Market risk
Foreign exchange risk
Nokia operates globally and is thus exposed to foreign exchange risk arising
from various currency combinations. Foreign currency denominated
assets and liabilities together with expected cash flows from highly probable
purchases and sales give rise to foreign exchange exposures. These trans-
action exposures are managed against various local currencies
because of Nokia’s substantial production and sales outside the Eurozone.
Due to the changes in the business environment, currency combinations
may also change within the financial year. The most significant non-
euro sales currencies during the year were U.S. dollar (USD), British
pound Sterling (GBP) and Australian dollar (AUD). In general, the apprecia-
tion of the euro to other currencies has an adverse effect on Nokia’s sales
and operating profit in the medium to long term, while depreciation of
the euro has a positive effect. The only significant non-euro purchasing
currencies are Japanese yen (JPY) and U.S. dollar.

Nokia in 2002 | 29
Notes to the consolidated financial statements
Break-down by currency of the underlying foreign exchangetransaction exposure December 31, 2002
According to the foreign exchange policy guidelines of the Group, material
transaction foreign exchange exposures are hedged. Exposures are
mainly hedged with derivative financial instruments such as forward
foreign exchange contracts and foreign exchange options. The majority
of financial instruments hedging foreign exchange risk have a duration
of less than a year. The Group does not hedge forecasted foreign currency
cash flows beyond two years.
Nokia uses the Value-at-Risk (“VaR”) methodology to assess the foreign
exchange risk related to the Treasury management of the Group expo-
sures. The VaR figure represents the potential losses for a portfolio
resulting from adverse changes in market factors using a specified time
period and confidence level based on historical data. To correctly take
into account the non-linear price function of certain derivative instru-
ments, Nokia uses Monte Carlo simulation. Volatilities and correlations
are calculated from a one-year set of daily data. The VaR figures assume
that the forecasted cash flows materialize as expected. The VaR figures
for the Group transaction foreign exchange exposure, including hedging
transactions and Treasury exposures for netting and risk management
purposes, with a one-week horizon and 95% confidencial level, are shown
below.
Transaction foreign exchange position Value-at-Risk (EURm)
VaR 2002 2001
31.12. 5.9 16.0
Average 14.3 20.2
Range 4.9–27.6 16.0–32.7
Since Nokia has subsidiaries outside the Eurozone, the euro-denominated
value of the shareholder’s equity of Nokia is also exposed to fluctuations
in exchange rates. Equity changes caused by movements in foreign
exchange rates are shown as a translation difference in the Group
consolidation. Nokia uses, from time to time, foreign exchange contracts
and foreign currency denominated loans to hedge its equity exposure
arising from foreign net investments.
Interest rate risk
The Group is exposed to interest rate risk either through market value
fluctuations of balance sheet items (i.e. price risk) or changes in interest
income or expenses (i.e. re-investment risk). Interest rate risk mainly
arises through interest-bearing liabilities and assets. Estimated future
changes in cash flows and balance sheet structure also expose the Group
to interest rate risk.
Group companies are responsible for managing their short-term
liquidity position, whereas the interest rate exposure of the Group is
monitored and managed in the Treasury. Due to the current balance
sheet structure of Nokia, emphasis is placed on managing the interest
rate risk of investments.
Nokia uses the VaR methdology to assess and measure the interest
rate risk in investment portfolio, which is benchmarked against a one-
year investment horizon. The VaR figure represents the potential losses
for a portfolio resulting from adverse changes in market factors using a
specified time period and confidence level based on historical data. For
interest rate risk VaR, Nokia uses variance-covariance methodology.
Volatilities and correlations are calculated from a one-year set of daily data.
The VaR-based interest rate risk figures for an investement portfolio
with a one-week horizon and 95% confidence level are shown below.
Treasury investment portfolio Value-at-Risk (EURm)
VaR 2002 2001
31.12. 5.4 6.4
Average 5.1 4.2
Range 3.1–8.7 1.8–8.1
Equity price risk
Nokia has certain strategic minority investments in publicly traded com-
panies. These investments are classified as available-for-sale. The fair
value of the equity investments at December 31, 2002 was EUR 137 million
(EUR 169 million in 2001).
There are currently no outstanding derivative financial instruments
designated as hedges of these equity investments. The VaR figures for
equity investments shown below, have been calculated using the same
principles as for interest rate risk.
Equity investments Value-at-Risk (EURm)
VaR 2001 2000
31.12. 6.5 8.6
Average 8.8 6.4
Range 5.5–19.0 3.0–11.8
In addition to the listed equity holdings, Nokia invests in private equity
through Nokia Venture Funds. The fair value of these available-for-sale
equity investments at December 31, 2002 was 54 million U.S. dollars (130
million U.S. dollars in 2001). Nokia is exposed to equity price risk on
social security costs relating to stock option plans. Nokia hedges this risk
by entering into cash settled equity swap and option contracts.
Credit risk
Customer Finance Credit Risk
Network operators sometimes require their suppliers to arrange or
provide term financing in relation to infrastructure projects. Nokia has
maintained a financing policy aimed at close cooperation with banks,
financial institutions and Export Credit Agencies to support selected cus-
tomers in their financing of infrastructure investments. Nokia actively
mitigates, market conditions permitting, this exposure by arrangements
USD25%
Other17%
AUD7%
JPY24%
GBP27%

30 | Nokia in 2002
Notes to the consolidated financial statements
with these institutions and investors.
Credit risks related to customer financing are systematically
analyzed, monitored and managed by Nokia’s Customer Finance organi-
zation, reporting to the Chief Financial Officer. Credit risks are approved
and monitored by Nokia’s Credit Committee along principles defined in
the Company’s credit policy and according to the credit approval process.
The Credit Committee consists of the CFO, Group Controller, Head of Group
Treasury and Head of Nokia Customer Finance.
Nokia’s infrastructure business is concentrated amongst mobile,
wireless operators. The Customer Finance portfolio is substantially all in
this group. In keeping with the Group’s financing approach, the majority
of the credit risk is to i) established mobile network operators (“incum-
bents”) with an investment grade credit rating as determined by a major
credit rating agency or equivalent as determined by Nokia (“investment
grade”) or ii) operators supported by other investment grade telecom
operators through ownership stakes and various operational and technical
support (“sponsor”). However, there is no certainty that the current
sponsors will continue their involvement with the operators, and the
sponsors generally do not provide guarantees of the loan balances.
Nokia’s credit risk to start-up operators (“greenfield operators”) is substan-
tially all to operators with investment grade sponsors.
At the end of December 31, 2002 our long-term loans to customers, net
of allowances and write-offs, totaled EUR 1 056 million (EUR 1 128 million
in 2001), while financial guarantees given on behalf of third parties to-
taled EUR 91 million (EUR 127 million in 2001). In addition, we had financing
commitments totaling EUR 857 million (EUR 2 955 million in 2001). Total
customer financing (outstanding and committed) stood at EUR 2 004
million (EUR 4 210 million in 2001).
Nokia sees that the current industry environment does not require
material increases in customer financing. Our view is based on our
experiences in customer interface in 2002 and current competitive
environment in telecommunications industry in general. Customer
financing continues to be requested by operators, but to a lesser extent
and with lower importance than during the past years. In 2002 Nokia
reduced substantially its customer financing exposure.
The term customer financing portfolio at December 31, 2002 was:
FinancingCommit-
EURm Outstanding ments Total %
Total Portfolio 1 147 857 2 004 100
Incumbent, Investment
Grade/I.G. Sponsor 199 211 410 20
Incumbent, non-I.G. Sponsor 168 229 397 20
Total Incumbent 367 441 807 40
Greenfield, I.G. Sponsor 746 417 1 163 58
Greenfield, non-I.G. Sponsor 34 0 34 2
Total Greenfield 780 417 1 197 60
Financial credit riskFinancial instruments contain an element of risk of the counterparties
being unable to meet their obligations. This risk is measured and monitored
by the Treasury function. The Group minimizes financial credit risk by
limiting its counterparties to a sufficient number of major banks and
financial institutions.
Direct credit risk represents the risk of loss resulting from counter-
party default in relation to on-balance sheet products. The fixed income
and money market investment decisions are based on strict creditworthi-
ness criteria. The outstanding investments are also constantly moni-
tored by the Treasury. Nokia does not expect the counterparties to de-
fault given their high credit quality.
Investments2002 2001
Current Available-for-sale investments 1, 2, 3 EURm EURm
Government, long-term (bonds) 1 244 789
Government, short-term (bills) 124 –
Corporate, long-term (bonds) 3 708 1 475
Corporate, short-term (CP) 2 779 2 007
Total 7 855 4 271
2002 2001
EURm EURm
Fixed rate investments 7 433 4 143
Floating rate investments 422 128
Total 7 855 4 271
1 Available-for-sale investments are carried at fair value in 2002 and 2001.2 Weighted average interest rate for Current available-for-sale investments was 3.54%
in 2002 and 3.97% in 2001.3 Included within current Available-for-sale investments is EUR 44 million and EUR 43
million of restricted cash at December 31, 2002 and 2001, respectively.
Liquidity riskNokia guarantees a sufficient liquidity at all times by efficient cash man-
agement and by investing in liquid interest bearing securities. Due to the
dynamic nature of the underlying business Treasury also aims at main-
taining flexibility in funding by keeping committed and uncommitted
credit lines available. During the year Nokia renewed the maturing USD
750 million Revolving Credit Facility. The committed facilities at year end
totalled USD 2.6 billion.
The most significant existing funding programs include:
Revolving Credit Facility of USD 750 million, matures in 2003
Revolving Credit Facility of USD 500 million, matures in 2003
Revolving Credit Facility of USD 350 million, matures in 2004
Revolving Credit Facility of USD 1 000 million, matures in 2006
Local commercial paper program in Finland, totalling EUR 750 million
Euro Commercial Paper (ECP) program, totalling USD 500 million
US Commercial Paper (USCP) program, totalling USD 500 million
None of the above programs have been used to a significant degree in
2002.

Nokia in 2002 | 31
Notes to the consolidated financial statements
Nokia’s international creditworthiness facilitates the efficient use of
international capital and loan markets. The ratings of Nokia from credit
rating agencies as at December 31, 2002 were:
Short-term Standard & Poor’s A-1
Moody’s P-1
Long-term Standard & Poor’s A
Moody’s A1
Hazard riskNokia strives to ensure that all financial, reputation and other losses to
the Group and our customers are minimized through preventive risk
management measures or purchase of insurance. Insurance is pur-
chased for risks which cannot be internally managed. Nokia’s Insurance
& Risk Finance function’s objective is to ensure that Group’s hazard risks,
whether related to physical assets (e.g. buildings) or intellectual assets
(e.g. Nokia brand) or potential liabilities (e.g. product liability) are opti-
mally insured.
Nokia purchases both annual insurance policies for specific risks and
multi-line multi-year insurance policies, where available. Nokia has con-
cluded a Multi-Line Multi-Year Insurance covering a variety of the above
mentioned risks in order to decrease the likelihood of non-anticipated
sudden losses.
Notional amounts of derivative financial instruments 1
2002 2001
EURm EURm
Foreign exchange forward contracts 2, 3 11 118 20 978
Currency options bought 3 1 408 1 328
Currency options sold 3 1 206 1 209
Cash settled equity options 4 209 –
Cash settled equity swaps 4 12 182
1 The notional amounts of derivatives summarized here do not represent amountsexchanged by the parties and thus are not a measure of the exposure of Nokia causedby its use of derivatives.
2 Notional amounts outstanding include positions which have been closed off.3 As at December 31, 2002 notional amounts include contracts amounting to EUR 2
billion used to hedge the shareholders’ equity of foreign subsidiaries (December 31,2001 EUR 1.1 billion).
4 Cash settled equity swaps and options can be used to hedge risk relating to incentiveprograms and investment activities.
Fair values of derivativesThe net fair values of derivative financial instruments at the balance sheet
date were: 2002 2001EURm EURm
Derivatives with positive fair value 1:
Forward foreign exchange contracts 2 235 186
Currency options bought 21 11
Cash settled equity options 28 –
Cash settled equity swaps – 10
Embedded derivatives 3 14 6
Derivatives with negative fair value 1:
Forward foreign exchange contracts 2 –98 –214
Currency options written –7 –7
35. Principal Nokia Group companiesat December 31, 2002
Parent holding Group majority% %
US Nokia Inc. 100.0
DE Nokia GmbH 100.0 100.0
GB Nokia UK Limited 100.0
KR Nokia TMC Limited 100.0 100.0
CN Beijing Capitel Nokia
Mobile Telecommunications Ltd 50.0
NL Nokia Finance International B.V. 100.0 100.0
HU Nokia Komárom Kft 100.0 100.0
BR Nokia do Brazil Technologia Ltda 100.0 100.0
IT Nokia Italia Spa 100.0
FR Nokia France S.A. 100.0 100.0
CN Dongguan Nokia Mobile
Phones Company Ltd 70.0
CN Beijing Nokia Hang Xing
Telecommunications System Co. Ltd 69.0
Shares in listed companies
Group GroupGroup holding more than 5% holding % voting %
Nextrom Holding S.A. 79.33 86.21
Nokian Renkaat Oyj/Nokian Tyres plc 18.9 18.9
As of December 31, 2001, Group holding percentage and Group voting
percentage of Nextrom Holding S.A. were 59.97% and 39.97% (Nokia had
agreed to abstain from exercising the voting rights relating to certain
shares), respectively. In 2002, due to an increase of Nokia’s ownership in
Nextrom Holding S.A. the Group’s holding percentage and Group’s voting
percentage became 79.33% and 86.21% respectively. Accordingly, Nextrom
Holding S.A. has been fully consolidated for accounting purposes from
the date of increased ownership. (See note 8)
A complete list of subsidiaries and associated companies is included
in Nokia’s Statutory Accounts.
1 Out of the forward foreign exchange contracts and currency options, fair value EUR 36million was designated for hedges of net investment in foreign subsidiaries as atDecember 31, 2002 (EUR 3 million at December 31, 2001) and reported in translationdifference.
2 Out of the foreign exchange forward contracts, fair value EUR 31 million wasdesignated for cash flow hedges as at December 31, 2002 (EUR –38 million at December31, 2001) and reported in fair value and other reserves.
3 Embedded derivatives are components of contracts having the characteristics ofderivatives, and thus requiring fair valuing of such components. The change in the fairvalue is reported in other financial income and expenses.

32 | Nokia in 2002
Parent company
2002 2001
Financial year ended Dec. 31 Notes EURm EURm
Net sales 21 488 6 047
Cost of sales –13 323 –3 661
Gross margin 8 165 2 386
Marketing expenses –1 038 –298
Research and development expenses –2 693 –777
Administrative expenses –857 –520
Other operating expenses –370 –326
Other operating income 2 166 3 395
Operating profit 3, 4 3 373 3 860
Financial income and expenses
Income from long-term investments
Dividend income from Group companies 363 512
Dividend income from other companies 25 28
Interest income from Group companies 25 61
Interest income from other companies 1 3
Other interest and financial income
Interest income from Group companies 122 81
Interest income from other companies 3 5
Other financial income from other companies 1 10
Exchange gains and losses 121 –7
Interest expenses and other financial expenses
Interest expenses to Group companies –25 –18
Interest expenses to other companies –10 –17
Other financial expenses –29 –24
Financial income and expenses, total 597 634
Profit before extraordinary items,
appropriations and taxes 3 970 4 494
Extraordinary items
Group contributions 119 –214
Extraordinary items, total 119 –214
Profit before appropriations and taxes 4 089 4 280
Appropriations
Difference between actual and planned depreciation,
increase (–)/decrease (+) – –98
Income taxes
for the year –1 098 –90
from previous years –44 –27
Net profit 2 947 4 065
1 Nokia Mobile Phones Ltd., Nokia Networks Oy, Nokia Multimedia Terminals Oy, Nokia DisplayProducts Oy, and Oy Marineland Ab were merged to Nokia Corporation on October 1, 2001.See Notes to the financial statements of the parent company.
Cash flow statements, FASProfit and loss accounts, FAS
2002 2001
Financial year ended Dec. 31 Notes EURm EURm
Cash flow from operating activities
Net profit 2 947 4 065
Adjustments, total 16 999 –3 395
Net profit before change in net working capital 3 946 670
Change in net working capital 16 1 088 82
Cash generated from operations 5 034 752
Interest received 166 143
Interest paid –34 –36
Other financial income and expenses 169 20
Income taxes paid –1 659 –197
Cash flow before extraordinary items 3 676 682
Extraordinary income and expenses –214 3 560
Net cash from operating activities 3 462 4 242
Cash flow from investing activities
Investments in shares –58 –284
Additions to capitalized development costs –418 –
Capital expenditures –29 –374
Proceeds from sale of shares 32 90
Proceeds from sale of fixed assets – 172
Long-term loans made to customers –563 –676
Proceeds from prepayment and transfers
of long-term loans receivable 314 –
Long-term loans repaid by customers 74 31
Proceeds from (+), payments of (–) short-term receivables –4 051 –2 816
Dividends received 381 531
Net cash used in investing activities –4 318 –3 326
Cash flow from financing activities
Proceeds from share issue 163 77
Proceeds from borrowings 1 941 385
Repayment of borrowings 188 –1
Dividends paid –1 279 –1 314
Net cash from (+), used in (–) financing activities 1 013 –853
Net decrease in cash and cash equivalents 157 63
Cash and cash equivalents at beginning of period 80 17
Cash and cash equivalents at end of period 237 80
See Notes to the financial statements of the parent company.

Nokia in 2002 | 33
Parent company
Balance sheets, FAS
2002 2001
Dec. 31 Notes EURm EURm
ASSETS
Fixed assets and other non-current assets
Intangible assets 5
Capitalized development costs 1 071 893
Intangible rights 59 82
Other intangible assets – 3
1 130 978
Tangible assets 6
Land and water areas – –
Buildings and constructions – –
Machinery and equipment – –
Other tangible assets – –
Advance payments and fixed assets under construction – –
– –
Investments
Investments in subsidiaries 7 3 519 3 448
Investments in associated companies 7 5 25
Long-term loan receivables from Group companies 353 222
Long-term loan receivables from other companies 1 088 1 143
Other non-current assets 8 22 70
4 987 4 908
Current assets
Inventories and work in progress
Raw materials and supplies 162 228
Work in progress 115 61
Finished goods 307 209
Prepaid inventories 1 –
585 498
Receivables
Trade debtors from Group companies 1 204 2 094
Trade debtors from other companies 1 098 789
Short-term loan receivables from Group companies 8 466 4 593
Short-term loan receivables from other companies 28 39
Prepaid expenses and accrued income from Group companies 5 17
Prepaid expenses and accrued income from other companies 517 558
11 318 8 090
Short-term investments 47 57
Bank and cash 190 24
18 257 14 555
See Notes to the financial statements of the parent company.
2002 2001
Dec. 31 Notes EURm EURm
SHAREHOLDERS’ EQUITY AND LIABILITIES
Shareholders’ equity 9
Share capital 287 284
Share issue premium 2 182 2 022
Retained earnings 10 6 454 3 669
Net profit for the year 10 2 947 4 065
11 870 10 040
Liabilities
Long-term liabilities 11
Bonds 12 62 90
Long-term liabilities from Group companies 2 –
64 90
Short-term liabilities
Current finance liabilities from Group companies 2 902 1 019
Current finance liabilities from other companies – 2
Advance payments from other companies 6 –
Trade creditors to Group companies 828 765
Trade creditors to other companies 928 916
Accrued expenses and prepaid income to Group companies 6 1
Accrued expenses and prepaid income to other companies 1 653 1 722
6 323 4 425
Total liabilities 6 387 4 515
18 257 14 555

34 | Nokia in 2002
Notes to the financial statements of the parent company
1. Accounting principlesThe Parent company Financial Statements are prepared according to
Finnish Accounting Standards (FAS).See Note 1 to Notes to the consolidated financial statements.
ComparabilityThe following Finnish subsidiaries of Nokia Corporation have merged into
Nokia Corporation: Nokia Mobile Phones Ltd., Nokia Networks Oy, Nokia
Multimedia Terminals Oy, Nokia Display Products Oy, and Oy Marineland Ab.
The merger came into effect on October 1, 2001.
AppropriationsIn Finland companies are permitted to reduce or increase taxable income
by net charges or by income representing adjustments to untaxed
reserve accounts, provided that such amounts are reflected in the Group
companies’ financial statements.
2. Other operating incomeOther operating income in 2001 include merger profit of EUR 3 300 million.
3. Personnel expenses2002 2001
EURm EURm
Wages and salaries 948 314
Pension expenses 169 27
Other social expenses 110 63
Personnel expenses as per profit and loss account 1 227 404
Remuneration of the members of the Board of Directors,
the Chief Executive Officer and the President * 4 3
* Salaries include incentives 1 1
Pension commitments for the management:
For the Chief Executive Officer and the President of the Parent Company
the retirement age is 60 years.
Personnel average 2002 2001
Production 5 370 1 444
Marketing 1 786 500
R&D 11 890 3 700
Administration 3 399 1 301
22 445 6 945
Personnel, Dec. 31 2002 2001
22 261 22 220
4. Depreciation and amortization2002 2001
EURm EURm
Depreciation and amortization by asset class category
Intangible assets
Capitalized development costs 233 44
Intangible rights 50 15
Other intangible assets 1 2
Tangible assets
Buildings and constructions – 5
Machinery and equipment – 59
Total 284 125
Depreciation and amortization by function
R&D 239 71
Production – 17
Selling, marketing and administration 45 37
Total 284 125
5. Intangible assets2002 2001
EURm EURm
Capitalized development costs
Acquisition cost Jan. 1 1 315 –
Additions 418 105
Disposals –27 –4
Merger – 1 214
Accumulated amortization Dec. 31 –635 –422
Net carrying amount Dec. 31 1 071 893
Intangible rights
Acquisition cost Jan. 1 214 6
Additions 32 14
Disposals –21 –3
Merger – 197
Accumulated amortization Dec. 31 –166 –132
Net carrying amount Dec. 31 59 82
Other intangible assets
Acquisition cost Jan. 1 52 5
Additions – 4
Disposals –2 –32
Merger – 75
Accumulated amortization Dec. 31 –50 –49
Net carrying amount Dec. 31 – 3

Nokia in 2002 | 35
Notes to the financial statements of the parent company
6. Tangible assets2002 2001EURm EURm
Land and water areas
Acquisition cost Jan. 1 – 25
Additions – 6
Disposals – –37
Merger – 6
Net carrying amount Dec. 31 – –
Buildings and constructions
Acquisition cost Jan. 1 – 94
Additions – 28
Disposals – –314
Merger – 192
Accumulated depreciation Dec. 31 – –
Net carrying amount Dec. 31 – –
Machinery and equipment
Acquisition cost Jan. 1 – 48
Additions – 58
Disposals – –1 362
Merger – 1 256
Accumulated depreciation Dec. 31 – –
Net carrying amount Dec. 31 – –
Other tangible assets
Acquisition cost Jan. 1 – 2
Disposals – –2
Accumulated depreciation Dec. 31 – –
Net carrying amount Dec. 31 – –
Advance payments and fixed assets under construction
Acquisition cost Jan. 1 – 28
Additions – 19
Disposals – –110
Merger – 63
Net carrying amount Dec. 31 – –
At the end of 2002 the parent company had no tangible assets. These
assets were leased from Nokia Asset Management Oy, a company wholly
owned by Nokia Oyj.
7. Investments2002 2001EURm EURm
Investments in subsidiaries
Acquisition cost Jan. 1 3 448 1 902
Additions 104 2 479
Disposals –33 –933
Net carrying amount Dec. 31 3 519 3 448
Investments in associated companies
Acquisition cost Jan. 1 25 25
Additions 1 2
Disposals –21 –2
Net carrying amount Dec. 31 5 25
8. Other non-current assets
2002 2001
EURm EURm
Investments in other shares
Acquisition cost Jan. 1 36 103
Additions 301 99
Disposals –319 –166
Net carrying amount Dec. 31 18 36
Other investments 4 34
22 70
Shareholdings in other companies include listed investments of EUR 7
million (EUR 28 million in 2001). At the balance sheet date, the fair value
of these investments was EUR 71 million (EUR 88 million in 2001),

36 | Nokia in 2002
Notes to the financial statements of the parent company
9. Shareholders’ equityShare
Share issue Treasury RetainedParent Company, EURm capital premium shares earnings Total
Balance at Dec. 31, 2000 282 1 619 –127 4 983 6 757
Share issue 2 456 458
Reissuance of treasury shares –53 127 74
Dividend –1 314 –1 314
Net profit 4 065 4 065
Balance at Dec. 31, 2001 284 2 022 – 7 734 10 040
Share issue 3 160 163
Reissuance of treasury shares
Dividend –1 280 –1 280
Net profit 2 947 2 947
Balance at Dec. 31, 2002 287 2 182 – 9 401 11 870
12. Bonds2002 2001
Million Interest EURm EURm
1989–2004 40.0 GBP 11.375% 62 65
1993–2003 150.0 FIM Floating – 25
62 90
13. Commitments and contingencies2002 2001EURm EURm
Collateral for own commitments
Property under mortgages – 18
Collateral given on behalf of other companies
Securities pledged 34 33
Contingent liabilities on behalf of Group companies
Guarantees for loans 4 62
Leasing guarantees 479 518
Other guarantees 301 505
Contingent liabilities on behalf of other companies
Guarantees for loans 56 95
14. Leasing contractsAt December 31, 2002 the leasing contracts of the Parent Company amounted
to EUR 1 458 million (EUR 1 781 million in 2001), of which EUR 476 million in
2002 relate to Group internal agreements. EUR 495 million will expire in 2003
(EUR 433 million in 2002).
15. Loans granted to top managementThere were no loans granted to top management at December 31, 2002.
10. Distributable earnings2002 2001EURm EURm
Retained earnings from previous years 6 454 3 669
Net profit for the year 2 947 4 065
Retained earnings, total 9 401 7 734
11. Long-term liabilitiesRepayment
Outstanding date beyondDec. 31, 2002 5 years
EURm EURm
Long-term loans are repayable as follows:
Bonds 62 –
Long-term liabilities from Group companies 2 –
64 –
The long-term liabilities as of December 31, 2002
mature as follows:EURm %
2003 – –
2004 64 100.0
2005 – –
2006 – –
2007 – –
Thereafter – –
64 100.0

Nokia in 2002 | 37
16. Notes to cash flow statements2002 2001EURm EURm
Adjustments for:
Depreciation 284 125
Income taxes 1 143 117
Financial income and expenses –597 –634
Impairment charge 289 204
Other operating income and expenses –120 –3 207
Adjustments, total 999 –3 395
Change in net working capital
Short-term trade receivables,
increase (–), decrease (+) 613 –145
Inventories, increase (-), decrease (+) –209 95
Interest-free short-term liabilities,
increase (+), decrease (–) 684 132
Change in net working capital 1 088 82
17. Principal Nokia Group companieson December 31, 2002
See note 35 to Notes to the consolidated financial statements.
18. Nokia Shares and ShareholdersSee Nokia Shares and Shareholders p. 38-44.
Notes to the financial statements of the parent company

38 | Nokia in 2002
Nokia shares and shareholders
Shares and share capitalNokia has one class of shares. Each Nokia share entitles the holder to one
(1) vote at General Meetings of Nokia.1 With effect from April 10, 2000,
the par value of the share is EUR 0.06.
The minimum share capital stipulated in the Articles of Association is
EUR 170 million and the maximum share capital EUR 680 million. The
share capital may be increased or reduced within these limits without
amending the Articles of Association. On December 31, 2002 the share
capital of Nokia Corporation was EUR 287 274 428.46 and the total num-
ber of shares and votes was 4 787 907 141.
On December 31, 2002 the total number of shares included 1 145 621
shares owned by the Group companies with an aggregate par value of
EUR 68 737.26 representing approximately 0.02 per cent of the total
number of shares and votes.
Share capital and shares, Dec. 312 2002 2001 2000 1999 1998
Share capital, EURm
K (common) * * * * 54
A (preferred) 201
Total (EURm) 287 284 282 279 255
Shares (1 000, par value EUR 0.06)
K (common) * * * * 1 016 246
A (preferred) 328 527
Total (1 000) 4 787 907 4 737 530 4 696 213 4 654 064 4 844 773
Shares owned by the Group at year-end (1 000) 1 145 1 228 4 080 1 385 257 288
Number of shares excluding shares owned
by the Group at year-end (1 000) 4 786 762 4 736 302 4 692 133 4 652 679 4 587 485
Average number of shares excluding shares owned
by the Group during the year (1 000), basic 4 751 110 4 702 852 4 673 162 4 593 761 4 553 364
Average number of shares excluding shares
owned by the Group during the year (1 000), diluted 4 788 042 4 787 219 4 792 980 4 743 184 4 693 204
Number of registered shareholders 3 129 508 116 352 94 500 48 771 30 339
* Since April 9, 1999 one class of shares only.
Key Ratios Dec. 31, IAS (calculation see page 48) 2002 2001 2000 1999 1998
Earnings per share from continuing operations, EUR
Earnings per share, basic 0.71 0.47 0.84 0.56 0.37
Earnings per share, diluted 0.71 0.46 0.82 0.54 0.36
P/E Ratio
K (common) * * * * 35.3
A (preferred) 21.34 61.6 56.5 80.4 35.3
(Nominal) dividend per share, EUR 0.28 ** 0.27 0.28 0.20 0.12
Total dividends paid, EURm 1 341 ** 1 279 1 315 931 586
Payout ratio 0.39 0.57 0.33 0.36 0.33
Dividend yield, %
K (common) * * * 0.9 0.9
A (preferred) 1.8 0.9 0.6 0.4 0.9
Shareholders’ equity per share, EUR 2.98 2.58 2.30 1.59 1.11
Market capitalization, EURm 4 72 537 137 163 222 876 209 371 59 796
* Since April 9, 1999 one class of shares only.
** Board’s proposal.1 Nokia used to have two classes of shares, A shares and K shares, until the two classes
of shares were consolidated with effect since April 9, 1999. The Annual General Meetingheld on March 21, 2001 resolved to remove the provision regarding the right to a fixedannual dividend attached to the shares. The resolution is effective since April 17, 2001.The previous class K shares were entitled to ten (10) votes at General Meetings, but tono fixed annual dividend.
2 Figures have been recalculated to reflect the par value of EUR 0.06 of the share.3 Each account operator is included in the figure as only one registered shareholder.4 Shares owned by the Group companies are not included.
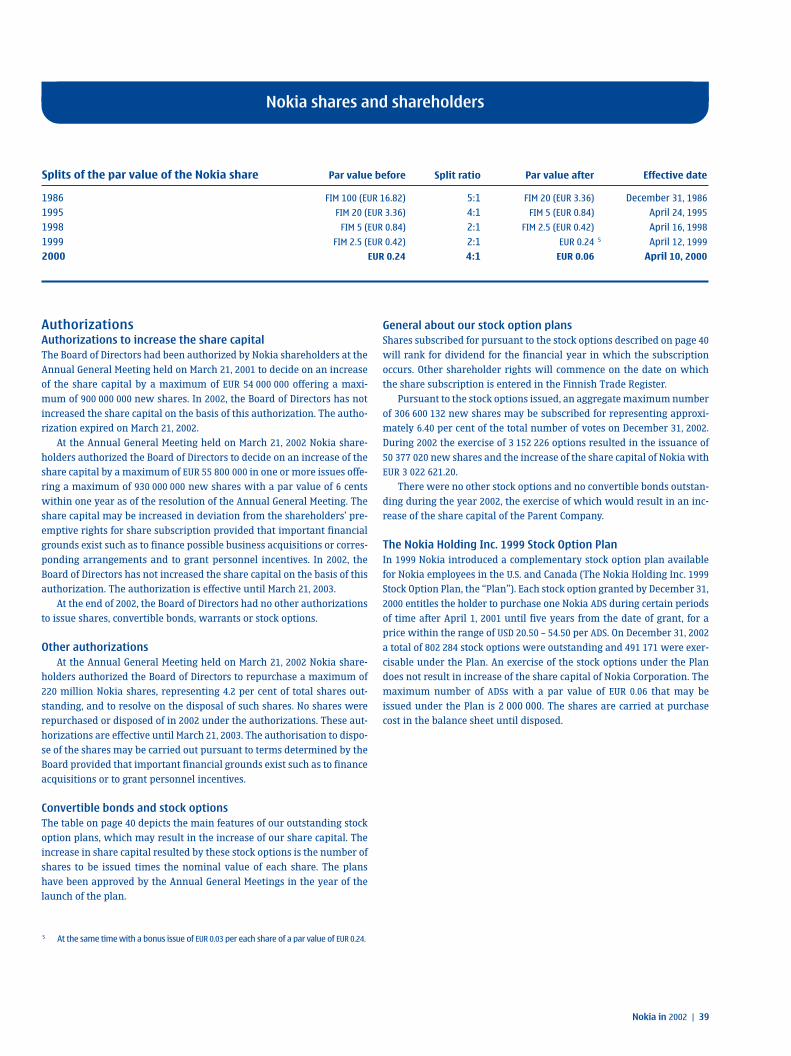
Nokia in 2002 | 39
AuthorizationsAuthorizations to increase the share capitalThe Board of Directors had been authorized by Nokia shareholders at the
Annual General Meeting held on March 21, 2001 to decide on an increase
of the share capital by a maximum of EUR 54 000 000 offering a maxi-
mum of 900 000 000 new shares. In 2002, the Board of Directors has not
increased the share capital on the basis of this authorization. The autho-
rization expired on March 21, 2002.
At the Annual General Meeting held on March 21, 2002 Nokia share-
holders authorized the Board of Directors to decide on an increase of the
share capital by a maximum of EUR 55 800 000 in one or more issues offe-
ring a maximum of 930 000 000 new shares with a par value of 6 cents
within one year as of the resolution of the Annual General Meeting. The
share capital may be increased in deviation from the shareholders’ pre-
emptive rights for share subscription provided that important financial
grounds exist such as to finance possible business acquisitions or corres-
ponding arrangements and to grant personnel incentives. In 2002, the
Board of Directors has not increased the share capital on the basis of this
authorization. The authorization is effective until March 21, 2003.
At the end of 2002, the Board of Directors had no other authorizations
to issue shares, convertible bonds, warrants or stock options.
Other authorizationsAt the Annual General Meeting held on March 21, 2002 Nokia share-
holders authorized the Board of Directors to repurchase a maximum of
220 million Nokia shares, representing 4.2 per cent of total shares out-
standing, and to resolve on the disposal of such shares. No shares were
repurchased or disposed of in 2002 under the authorizations. These aut-
horizations are effective until March 21, 2003. The authorisation to dispo-
se of the shares may be carried out pursuant to terms determined by the
Board provided that important financial grounds exist such as to finance
acquisitions or to grant personnel incentives.
Convertible bonds and stock optionsThe table on page 40 depicts the main features of our outstanding stock
option plans, which may result in the increase of our share capital. The
increase in share capital resulted by these stock options is the number of
shares to be issued times the nominal value of each share. The plans
have been approved by the Annual General Meetings in the year of the
launch of the plan.
General about our stock option plansShares subscribed for pursuant to the stock options described on page 40
will rank for dividend for the financial year in which the subscription
occurs. Other shareholder rights will commence on the date on which
the share subscription is entered in the Finnish Trade Register.
Pursuant to the stock options issued, an aggregate maximum number
of 306 600 132 new shares may be subscribed for representing approxi-
mately 6.40 per cent of the total number of votes on December 31, 2002.
During 2002 the exercise of 3 152 226 options resulted in the issuance of
50 377 020 new shares and the increase of the share capital of Nokia with
EUR 3 022 621.20.
There were no other stock options and no convertible bonds outstan-
ding during the year 2002, the exercise of which would result in an inc-
rease of the share capital of the Parent Company.
The Nokia Holding Inc. 1999 Stock Option PlanIn 1999 Nokia introduced a complementary stock option plan available
for Nokia employees in the U.S. and Canada (The Nokia Holding Inc. 1999
Stock Option Plan, the “Plan”). Each stock option granted by December 31,
2000 entitles the holder to purchase one Nokia ADS during certain periods
of time after April 1, 2001 until five years from the date of grant, for a
price within the range of USD 20.50 – 54.50 per ADS. On December 31, 2002
a total of 802 284 stock options were outstanding and 491 171 were exer-
cisable under the Plan. An exercise of the stock options under the Plan
does not result in increase of the share capital of Nokia Corporation. The
maximum number of ADSs with a par value of EUR 0.06 that may be
issued under the Plan is 2 000 000. The shares are carried at purchase
cost in the balance sheet until disposed.
Nokia shares and shareholders
Splits of the par value of the Nokia share Par value before Split ratio Par value after Effective date
1986 FIM 100 (EUR 16.82) 5:1 FIM 20 (EUR 3.36) December 31, 1986
1995 FIM 20 (EUR 3.36) 4:1 FIM 5 (EUR 0.84) April 24, 1995
1998 FIM 5 (EUR 0.84) 2:1 FIM 2.5 (EUR 0.42) April 16, 1998
1999 FIM 2.5 (EUR 0.42) 2:1 EUR 0.24 5 April 12, 1999
2000 EUR 0.24 4:1 EUR 0.06 April 10, 2000
5 At the same time with a bonus issue of EUR 0.03 per each share of a par value of EUR 0.24.

40 | Nokia in 2002
Nokia shares and shareholders
Outstanding stock option plans, Dec. 31, 2002 1
Plan Total Number of Exercise Exercise(Year of plan participants Vesting price price Splitlaunch) size (Approximately) (Sub)category schedule /option /share ratio
Maximum number of shares Starting Ending
1997 1997A 2 Vested December 1, 1997 January 31, 2003 51.63 EUR 3.23 EUR 16:1
1997B 2 Vested November 1, 1999 January 31, 2003 51.63 EUR 3.23 EUR 16:1
1997C 2 Vested November 1, 2001 January 31, 2003 51.63 EUR 3.23 EUR 16:1
152 000 000 2 000
1999 1999A 2 Vested April 1, 2001 December 31, 2004 67.55 EUR 16.89 EUR 4:1
1999B Vested April 1, 2002 December 31, 2004 225.12 EUR 56.28 EUR 4:1
1999C Vests April 1, 2003 December 31, 2004 116.48 EUR 29.12 EUR 4:1
144 000 000 16 000
2001 2001A+B 25% vest 1 year after grant; 6.25% in12 subsequent quarterly blocks July 1, 2002 December 31, 2006 36.75 EUR 36.75 EUR 1:1
2001C3Q/01 25% vest 1 year after grant; 6.25% in12 subsequent quarterly blocks October 1, 2002 December 31, 2006 20.61 EUR 20.61 EUR 1:1
2001C4Q/01 25% vest 1 year after grant; 6.25% in12 subsequent quarterly blocks January 1, 2003 December 31, 2006 26.67 EUR 26.67 EUR 1:1
2001C1Q/02 25% vest 1 year after grant; 6.25% in12 subsequent quarterly blocks April 1, 2003 December 31, 2007 26.06 EUR 26.06 EUR 1:1
2001C3Q/02 25% vest 1 year after grant; 6.25% in12 subsequent quarterly blocks October 1, 2003 December 31, 2007 12.99 EUR 12.99 EUR 1:1
2001C4Q/02 25% vest 1 year after grant; 6.25% in12 subsequent quarterly blocks January 1, 2004 December 31, 2007 16.86 EUR 16.86 EUR 1:1
2002A+B 25% vest 1 year after grant; 6.25% in
12 subsequent quarterly blocks July 1, 2003 December 31, 2007 17.89 EUR 17.89 EUR 1:1
145 000 000 25 000
1 Figures have been recalculated to reflect the par value of EUR 0.O6 of the shares.2 Listing on the Helsinki Exchanges (HEX)
Subscriptionperiods

Nokia in 2002 | 41
Nokia shares and shareholders
The options outstanding by range of exercise price at Dec. 31, 2002 are as follows:
Options outstanding Vested options outstanding
Weighted Weighted Weightedaverage average average
Exercise remaining exercise exerciseprices Number of contractual price Number of priceEUR shares life in years EUR of shares EUR
0.36 – 3.04 503 670 6.22 1.06 464 165 1.06
3.23 7 185 264 0.08 3.23 7 178 704 3.23
3.44 – 16.68 2 523 261 7.41 11.51 1 521 241 10.88
16.89 46 424 432 1.06 16.89 45 893 040 16.89
17.89 – 22.97 50 566 202 3.20 17.93 562 020 20.20
26.06 – 34.59 34 266 321 2.25 27.72 712 425 31.32
36.75 40 920 212 2.63 36.75 12 983 930 36,75
38.91 – 55.82 380 573 5.33 48.38 268 909 43.49
56.28 38 673 300 1.31 56.28 38 137 408 56.28
221 443 235 107 721 842
Weightedaverageexercise
Number price 1
of shares EUR
Shares under option at Dec. 31, 1999 204 620 102 6.91
Granted 2 18 339 647 44.86
Exercised 33 490 088 2.22
Forfeited 4 937 904 33.24
Shares under option at Dec. 31, 2000 184 531 757 19.71
Granted 2 72 644 065 31.78
Exercised 24 790 689 3.54
Forfeited 4 385 380 31.09
Shares under option at Dec. 31, 2001 227 999 753 25.71
Granted 51 127 314 17.96
Exercised 51 586 807 3.61
Forfeited 6 097 025 33.51
Shares under option at Dec. 31, 2002 221 443 235 28.81
Options exercisable at Dec. 31, 2000 (shares) 12 199 932 3.83
Options exercisable at Dec. 31, 2001 (shares) 106 300 988 9.53
Options exercisable at Dec. 31, 2002 (shares) 107 721 842 27.92
1 Weighted average exercise price, calculated for options where exercise price is known.2 Includes options converted in acquisitions.
Information relating to stock options during 2002, 2001 and2000 is as follows:

42 | Nokia in 2002
Nokia shares and shareholders
Share issues and bonus issues 1998–2002Subscription Number of Net New share
price or amount new shares Date of proceeds capital
Year Type of Issue of bonus issue EUR (1 000) payment EURm EURm
1998 Nokia Stock Option Plan 1994 0.98 268 1998 0.26 0.01
Nokia Stock Option Plan 1995 1.77 30 304 1998 53.52 1.59
Nokia Stock Option Plan 1997 3.23 16 566 1998 53.46 0.87
Total 47 138 107.24 2.47
1999 Nokia Stock Option Plan 1994 0.98 12 238 1999 12.03 0.73
Nokia Stock Option Plan 1995 1.77 18 602 1999 32.85 1.12
Nokia Stock Option Plan 1997 3.23 33 456 1999 107.97 2.01
Bonus Issue 0.01 1999 36.05
Share issue to
stockholders of Rooftop
Communications Corporation 20.04 2 118 1999 42.45 0.13
Total 66 414 195.30 40.04
2000 Nokia Stock Option Plan 1995 1.77 22 011 2000 38.87 1.32
Nokia Stock Option Plan 1997 3.23 10 117 2000 32.65 0.61
Share issue to
stockholders of Network Alchemy, Inc. 49.91 6 112 2000 305.06 0.37
Share issue to
stockholders of DiscoveryCom, Inc. 45.98 3 909 2000 179.75 0.23
Total 42 149 556.33 2.53
2001 Nokia Stock Option Plan 1995 1.77 1 682 2001 2.97 0.10
Nokia Stock Option Plan 1997 3.23 20 993 2001 67.81 1.26
Nokia Stock Option Plan 1999 (A) 16.89 382 2001 6.46 0.02
Share issue to
stockholders of Amber Networks, Inc. 20.77 18 329 2001 380.72 1.10
Total 41 386 457.96 2.48
2002 Nokia Stock Option Plan 1997 3.23 50 357 2002 162.50 3.02
Nokia Stock Option Plan 1999 (A) 16.89 20 2002 0.33 0.00
Total 50 377 162.83 3.02
Reductions of share capital Number Amount of Amount of Amount ofof affected reduction of the reduction of the reduction of the
(1 000, par value share capital restricted capital retained earningsType of reduction Year EUR 0.06) EURm EURm EURm
Cancellation of shares 1999 257 123 15.43 – 3 435.27
Cancellation of shares 2001 69 0.004 – –
Cancellation of shares 2002 – – – –

Nokia in 2002 | 43
Largest registered shareholders, December 31, 2002(excluding nominee registered shares) Total number of shares Per cent of all the shares
(1 000) and voting rights
Svenska Litteratursällskapet i Finland r f 20 610 0.43
Juselius Sigrid stiftelse 16 800 0.35
UPM-Kymmene Corporation 11 298 0.24
The Local Government Pensions Institution 9 429 0.20
Ilmarinen Mutual Pension Insurance Company 9 027 0.19
The Pension Foundation of Nokia Corporation 8 229 0.17
The Finnish Cultural Foundation 7 549 0.16
Finnish National Fund for Research an developement (SITRA) 7 085 0.15
Suomi Mutual Life Assurance Company 7 020 0.15
Varma-Sampo Mutual Pension Insurance Company 5 804 0.12
Nokia shares and shareholders
Largest registered shareholders, December 31, 2002Registered shareholders represent 9.10 per cent and shareholders regis-
tered in the name of a nominee represent 90.90 per cent of the total number
of shares of Nokia. The number of registered shareholders was 129 508
on December 31, 2002. Each account operator (26) is included in this
figure as only one registered shareholder.
Share prices, EUR (Helsinki Exchanges) 8
2002 2001 2000 1999 * 1998
K share
Low/high 3.87/13.41
Average 8 10.28
Year-end 13.04
A share
Low/high 11.10/29.45 14.35/46.50 35.81/64.88 13.74/45.00 3.89/13.41
Average 8 18.13 24.57 51.09 21.67 7.95
Year-end 15.15 28.96 47.50 45.00 13.04
Share prices, USD (New York Stock Exchange) 9
2002 2001 2000 1999 1998
ADS
Low/high 10.76/26.90 12.95/44.69 29.44/61.88 15.05/47.77 4.25/15.75
Average 9 16.88 24.84 47.36 23.16 8.50
Year-end 15.50 24.53 43.50 47.77 15.00
Share turnover (all stock exchanges) 7
2002 2001 2000 1999 * 1998
K share turnover (1 000) 255 108
Total number of K shares (1 000) 508 124
% of total number of K shares 50
A share turnover (1 000) 12 926 683 11 457 748 7 827 428 7 930 612 5 128 156
Total number of A shares (1 000) 4 787 907 4 737 530 4 696 213 4 654 064 1 914 264
% of total number of A shares 270 242 167 170 268
* Since April 9, 1999 one class of shares. Consequently, the figures represent the total number of all the shares.
* Since April 9, 1999 one class of shares. Consequently, the figures represent the total number of all the shares.
7 Figures have been recalculated to reflect the par value of EUR 0.06 of the share.8 Figures have been recalculated to reflect the par value of EUR 0.06 of the share.9 Calculated by weighing average price with daily volumes.

44 | Nokia in 2002
Nominee registered shareholders include holders of American Depositary
Receipts (ADR) and Svenska Depåbevis (SDB). As of December 31, 2002 ADR’s
represented 25.3 per cent and SDB’s 3.79 per cent of the total number of
shares in Nokia.
Shares and stock options owned by the members ofthe Board of Directors and the Group Executive BoardMembers of the Board of Directors and the Group Executive Board owned
on December 31, 2002 an aggregate of 1 004 179 shares representing
approximately 0.02 per cent of the aggregate number of shares and
voting rights, as well as a total of 5 096 000 stock options representing
approximately 1.66 per cent of the total number of stock options issued. If
exercised in full the said 5 096 000 stock options would be exercisable for
14 529 000 shares representing approximately 0.30 per cent of the total
number of shares and voting rights on December 31, 2002.
10 The account operators (26) are included.
Breakdown of share ownership, Dec. 31, 2002 (Registered shareholders only)
Number of Per cent of Total number Per cent of Average
By number of shares owned shareholders 10 shareholders shares share capital holding
1–100 48 892 37.75 2 950 408 0.06 0.06
101–1 000 56 607 43.71 21 550 024 0.45 0.45
1 001–10 000 19 430 15.00 62 894 601 1.31 1.31
10 001–100 000 4 168 3.22 110 735 586 2.31 2.31
100 001–500 000 322 0.25 62 719 741 1.31 1.31
500 001–1 000 000 39 0.03 27 301 022 0.57 0.57
1 000 001–5 000 000 32 0.02 66 709 324 1.39 1.39
Over 5 000 000 18 0.01 4 433 046 435 92.59 92.59
Total 129 508 100.00 4 787 907 141 100.00 100.00
Nokia shares and shareholders
By nationality, per cent Shares
Non-Finnish shareholders 90.90
Finnish shareholders 9.10
Total 100.00
By shareholder category (Finnish shareholders) Shares
Corporations 0.93
Households 4.09
Financial and insurance institutions 0.73
Non-profit organizations 2.18
General government 1.17
Total 9.10

Nokia in 2002 | 45
Nokia 1998–2002, IAS
2002 2001 2000 1999 1998
Profit and loss account, EURm
Net sales 30 016 31 191 30 376 19 772 13 326
Cost and expenses –25 236 –27 829 –24 600 –15 864 –10 837
Operating profit 4 780 3 362 5 776 3 908 2 489
Share of results of associated companies –19 –12 –16 –5 6
Financial income and expenses 156 125 102 –58 –39
Profit before tax and minority interests 4 917 3 475 5 862 3 845 2 456
Tax –1 484 –1 192 –1 784 –1 189 –737
Minority interests –52 –83 –140 –79 –39
Profit from ordinary activities before
cumulative effect of change in accounting policies 3 381 2 200 3 938 2 577 1 680
Cumulative prior year effect (after tax)
of change in accounting policies – – – – 70
Net profit 3 381 2 200 3 938 2 577 1 750
Balance sheet items, EURm
Fixed assets and other non-current assets 5 742 6 912 6 388 3 487 2 220
Current assets 17 585 15 515 13 502 10 792 7 814
Inventories 1 277 1 788 2 263 1 772 1 292
Accounts receivable and prepaid expenses 6 957 7 602 7 056 4 861 3 631
Cash and cash equivalents 9 351 6 125 4 183 4 159 2 891
Shareholders’ equity 14 281 12 205 10 808 7 378 5 109
Minority shareholders’ interests 173 196 177 122 63
Long-term liabilities 461 460 311 407 40
Long-term interest-bearing liabilities 187 207 173 269 257
Deferred tax liabilities 207 177 69 80 88
Other long-term liabilities 67 76 69 58 64
Current liabilities 8 412 9 566 8 594 6 372 4 453
Short-term borrowings 377 831 1 069 792 699
Current portion of long-term loans – – 47 1 61
Accounts payable 2 954 3 074 2 814 2 202 1 357
Accrued expenses and provisions 5 081 5 661 4 664 3 377 2 336
Total assets 23 327 22 427 19 890 14 279 10 034

46 | Nokia in 2002
Nokia 1998–2002, IAS
2002 2001 2000 1999 1998
Net sales by business group, EURm
Nokia Mobile Phones 23 211 23 158 21 887 13 182 8 070
Nokia Networks 6 539 7 534 7 714 5 673 4 390
Nokia Ventures Organization 459 585 854 415 –
Discontinued Operations 1 – – – 580 1 014
Inter-business group eliminations –193 –86 –79 –78 –148
Nokia Group 30 016 31 191 30 376 19 772 13 326
Net sales by market area, EURm
Europe 16 111 15 330 15 554 10 614 7 673
of which Finland 353 453 494 479 465
Americas 6 541 7 891 7 708 4 909 2 815
Asia-Pacific 7 364 7 970 7 114 4 249 2 838
Nokia Group 30 016 31 191 30 376 19 772 13 326
Operating profit/loss, EURm
Nokia Mobile Phones 5 201 4 521 4 879 3 099 1 540
Nokia Networks –49 –73 1 358 1 082 960
Nokia Ventures Organization –141 –855 –387 –175 –
Common Group Expenses 2 –231 –231 –74 –98 –11
Nokia Group 4 780 3 362 5 776 3 908 2 489
Average personnel
Nokia Mobile Phones 26 090 27 320 27 353 20 975 16 064
Nokia Networks 18 463 22 040 23 508 22 804 19 280
Nokia Ventures Organization 1 566 2 155 2 222 1 256 –
Common Group Functions 3 6 595 6 201 5 625 6 142 5 747
Nokia Group 52 714 57 716 58 708 51 177 41 091
In Finland 22 615 23 653 24 495 23 155 20 978
Other European countries 12 057 14 045 14 365 12 997 9 398
Americas 10 093 11 215 11 491 8 818 5 924
Asia-Pacific 7 949 8 803 8 357 6 207 4 791
Nokia Group 52 714 57 716 58 708 51 177 41 091
Research and development, EURm
Nokia Mobile Phones 1 884 1 599 1 306 835 522
Nokia Networks 995 1 135 1 013 777 564
Nokia Ventures Organization 136 221 235 110 –
Common Group Expenses 2 37 30 30 33 64
Nokia Group 3 052 2 985 2 584 1 755 1 150
1 Discontinued Operations include discontinued and divested operations as follows: Display Products 1998-1999.2 Common Group Expenses include the operating profit/loss of Common Group Functions and discontinued and divested operations.3 Common Group Functions also include discontinued and divested operations.

Nokia in 2002 | 47
Nokia 1998–2002, IAS
Key ratios and economic indicators 2002 2001 2000 1999 1998
Net sales, EURm 30 016 31 191 30 376 19 772 13 326
Change, % –3.8 2.7 53.6 48.4 50.6
Exports and foreign subsidiaries, EURm 29 663 30 738 29 882 19 293 12 861
Salaries and social expenses, EURm 3 140 3 235 2 888 2 383 1 958
Operating profit, EURm 4 780 3 362 5 776 3 908 2 489
% of net sales 15.9 10.8 19.0 19.8 18.7
Financial income and expenses, EURm 156 125 102 –58 –39
% of net sales 0.5 0.4 0.3 –0.3 –0.3
Profit before tax and minority interests, EURm 4 917 3 475 5 862 3 845 2 456
% of net sales 16.4 11.1 19.3 19.4 18.4
Profit from continuing operations, EURm 3 381 2 200 3 938 2 577 1 680
% of net sales 11.3 7.1 13.0 13.0 12.6
Taxes, EURm 1 484 1 192 1 784 1 189 737
Dividends, EURm 1 341 * 1 279 1 315 931 586
Capital expenditure, EURm 432 1 041 1 580 1 358 761
% of net sales 1.4 3.3 5.2 6.9 5.7
Gross investments **, EURm 966 2 149 3 095 1 889 1 072
% of net sales 3.2 6.9 10.2 9.6 8.0
R&D expenditure, EURm 3 052 2 985 2 584 1 755 1 150
% of net sales 10.2 9.6 8.5 8.9 8.6
Average personnel 52 714 57 716 58 708 51 177 41 091
Non-interest bearing liabilities, EURm 8 309 8 988 7 616 5 717 3 844
Interest-bearing liabilities, EURm 564 1 038 1 289 1 062 1 017
Return on capital employed, % 35.3 27.9 58.0 55.7 50.2
Return on equity, % 25.5 19.1 43.3 41.3 38.5
Equity ratio, % 62.5 56.0 55.7 53.3 52.0
Net debt to equity, % –61 –41 –26 –41 –36
* Board’s proposal
** Includes acquisitions, investments in shares and capitalized development costs.
Calculation of Key Ratios, see page 48.

48 | Nokia in 2002
Calculation of key ratios
Return on capital employed, %
Profit before taxes and minority interests
+ interest and other financial expenses
Average shareholders’ equity + short-term borrowings
+ long-term interest-bearing liabilities (including the current portion thereof)
+ minority shareholders’ interests
Return on shareholders’ equity, %
Net profit (years 1999 – 2002)/
profit from continuing operations (year 1998)
Average shareholders’ equity during the year
Equity ratio, %
Shareholders’ equity + minority shareholders’ interests
Total assets – advance payments received
Net debt to equity (gearing), %
Long-term interest-bearing liabilities (including the current portion thereof)
+ short-term borrowings – cash and cash equivalents
Shareholders’ equity + minority shareholders’ interests
Year-end currency rates 2002
1 EUR =
USD 1.0247
GBP 0.6439
SEK 9.1144
JPY 124.17
Operating profit
Profit after depreciation
Shareholders’ equity
Share capital + reserves
Earnings per share
Net profit (years 1999 – 2002)/
profit from continuing operations (year 1998)
Average of adjusted number of shares during the year
P/E ratio
Adjusted share price, December 31
Earnings per share
Dividend per share
Nominal dividend per share
The adjustment coefficients of the share issues that have
taken place during or after the year in question
Payout ratio
Dividend per share
Earnings per share
Dividend yield, %
Nominal dividend per share
Share price
Shareholders’ equity per share
Shareholders’ equity
Adjusted number of shares at year end
Market capitalization
Number of shares x share price per share class
Adjusted average share price
Amount traded, in EUR, during the period
Adjusted number of shares traded during the period
Share turnover, %
Number of shares traded during the period
Average number of shares during the period
Key ratios under IAS

Nokia in 2002 | 49
Proposal by the Board of Directors to the Annual General Meeting
The distributable earnings in the balance sheet of the Group amount to
EUR 11 464 million and those of the Company to EUR 9 401 million.
The Board proposes that from the funds at the disposal of the Annual
General Meeting, a dividend of EUR 0.28 per share is to be paid out on a
total of 4 787 907 141 shares, amounting to EUR 1 341 million.
Espoo, January 23, 2003
Jorma Ollila Paul J. Collins
Chairman and CEO
Georg Ehrnrooth Bengt Holmström Per Karlsson
Robert F.W. van Oordt Marjorie Scardino Vesa Vainio
Arne Wessberg
Pekka Ala-Pietilä
President
Proposal by the Board of Directors to the Annual General Meeting

50 | Nokia in 2002
Auditor’s report
To the shareholders of Nokia CorporationWe have audited the accounting records, the financial statements and
the administration of Nokia Corporation for the year ended December 31,
2002. The financial statements prepared by the Board of Directors and the
President include the report of the Board of Directors, consolidated
financial statements prepared in accordance with International Account-
ing Standards (IAS), and parent company financial statements prepared
in accordance with prevailing regulations in Finland (FAS). Based on our
audit we express an opinion on the consolidated financial statements
and on the parent company’s financial statements and administration.
We conducted our audit in accordance with Finnish Generally Accepted
Auditing Standards. Those standards require that we plan and perform
the audit in order to obtain reasonable assurance about whether the
financial statements are free of material misstatement. An audit includes
examining, on a test basis, evidence supporting the amounts and disclo-
sures in the financial statements, assessing the accounting principles
used and significant estimates made by the management, as well as eval-
uating the overall financial statement presentation. The purpose of our
audit of the administration has been to examine that the Chairman and
the other members of the Board of Directors and the President have
complied with the rules of the Finnish Companies’ Act.
Consolidated financial statementsIn our opinion, the consolidated financial statements prepared in accor-
dance with International Accounting Standards (IAS) give a true and fair
view of the consolidated results of operations as well as of the financial
position. The financial statements are in accordance with prevailing reg-
ulations in Finland and can be adopted.
Parent company’s financial statements and administrationThe financial statements have been prepared in accordance with the
Finnish Accounting Act and other rules and regulations governing the
preparation of financial statements in Finland. The financial statements
give a true and fair view, as defined in the Finnish Accounting Act, of the
parent company’s result of operations, as well as the financial position.
The financial statements can be adopted and the Chairman and the other
members of the Board of Directors and the President of the parent com-
pany can be discharged from liability for the period audited by us. The
proposal by the Board of Directors concerning the disposition of the profit
for the year is in compliance with the Finnish Companies’ Act.
Espoo, January 23, 2003
PricewaterhouseCoopers Oy
Authorized Public Accountants
Lars Blomquist
Authorized Public Accountant

Nokia in 2002 | 51
A D D I T I O N A L I N F O R M A T I O N
U.S. GAAP 52
Critical accounting policies 55
Risk factors 57
Group Executive Board 58
Board of Directors 60
Corporate Governance 62
Investor information 65
General contact information 66

52 | Nokia in 2002
U.S. GAAP
The Group’s consolidated financial statements are prepared in accor-
dance with International Accounting Standards, which differ in certain
respects from accounting principles generally accepted in the United
States (U.S. GAAP). The principal differences between IAS and U.S. GAAP are
presented below together with explanations of certain adjustments that
affect consolidated net income and total shareholders’ equity as of and
for the years ended December 31:
2002 2001 2000
EURm EURm EURm
Reconciliation of net income
Net income reported under IAS 3 381 2 200 3 938
U.S. GAAP adjustments:
Pension expense –5 –22 –13
Development costs –66 –104 –65
Marketable securities – – –10
Provision for social security
cost on stock options –90 –132 34
Stock compensation expense –35 –85 –46
Cash flow hedges 6 –22 –
Net investment in foreign companies 48 – –
Amortization of identifiable
intangible assets acquired –22 –7 –
Amortization of goodwill 206 28 –
Impairment of goodwill 104 – –
Deferred tax effect of
U.S. GAAP adjustments 76 47 9
Net income under U.S. GAAP 3 603 1 903 3 847
Reconciliation of shareholders’ equity
Total shareholders’ equity
reported under IAS 14 281 12 205
U.S. GAAP adjustments:
Pension expense –37 –32
Additional minimum liability –5 –
Development costs –421 –355
Marketable securities and
unlisted investments 77 –
Provision for social security
cost on stock options 35 125
Deferred compensation –13 –47
Share issue premium 179 178
Stock compensation –166 –131
Acquisition purchase price 4 4
Amortization of identifiable
intangible assets acquired –29 –7
Amortization of goodwill 234 28
Impairment of goodwill 104 –
Translation of goodwill –240 –
Deferred tax effect of
U.S. GAAP adjustments 147 53
Total shareholders’ equity under U.S. GAAP 14 150 12 021
Pension expense and additional minimum liabilityUnder IAS, pension assets, defined benefit pension liabilities and expense
are actuarially determined in a similar manner to U.S. GAAP. However,
under IAS the prior service cost, transition adjustments and expense
resulting from plan amendments are generally recognized immediately.
Under U.S. GAAP, these expenses are generally recognized over a longer
period. Also, under U.S. GAAP the employer should recognize an additional
minimum pension liability charged to other comprehensive income
when the accumulated benefit obligation (ABO) exceeds the fair value of
the plan assets and this amount is not covered by the liability recognized
in the balance sheet. The calculation of the ABO is based on approach two
as described in EITF 88-1, Determination of Vested Benefit Obligation for a
Defined Benefit Pension Plan, under which the actuarial present value is
based on the date of separation from service.
The U.S. GAAP pension adjustment reflects the difference between the
prepaid pension asset and related pension expense as determined by
applying IAS 19, Employee Benefits, and the pension asset and pension
expense determined by applying FAS 87, Employers’ Accounting for
Pensions.
Development costsDevelopment costs have been capitalized under IAS after the product
involved has reached a certain degree of technical feasibility. Capitaliza-
tion ceases and depreciation begins when the product becomes available
to customers. The depreciation period of these capitalized assets is
between two and five years.
Under U.S. GAAP, software development costs would similarly be
capitalized after the product has reached a certain degree of technical
feasibility. However, certain non-software related development costs
capitalized under IAS would not be capitalizable under U.S. GAAP and
therefore have been expensed under U.S. GAAP.
Marketable securities and unlisted investmentsUnder IAS, prior to the adoption of IAS 39 on January 1, 2001, investments
in marketable securities were carried at cost. Upon adoption of IAS 39, all
available-for-sale investments, which includes all publicly listed and
non-listed marketable securities, are measured at fair value and gains
and losses are recognized within shareholders’ equity until realized in
the profit and loss account upon sale or disposal.
Under U.S. GAAP, the Group’s listed marketable securities would be
classified as available-for-sale and carried at aggregate fair value with
gross unrealized holding gains and losses reported as a separate compo-
nent of shareholders’ equity. Investments in equity securities that are
not traded on a public market are carried at historical cost, giving rise to
an adjustment between IAS and U.S. GAAP. Total proceeds from the sale of
available-for-sale securities were EUR 94 million in 2000.
Provision for social security cost on stock optionsUnder IAS, the Group provides for social security costs on stock options
on the date of grant, based on the fair value of the option. The provision
is adjusted for movements in the fair value of the options. Under U.S.
GAAP, no expense is recorded until the options are exercised.

Nokia in 2002 | 53
Stock compensationUnder IAS, no compensation expense is recorded on stock options granted.
Under U.S. GAAP, the Group follows the methodology in APB Opinion 25,
Accounting for Stock Issued to Employees (APB 25), to measure employee
stock compensation.
Certain employees have been granted stock options with an exercise
price less than the quoted market value of the underlying stock on the
date of grant. This intrinsic value is recorded as deferred compensation
within shareholders’ equity and recognized in the profit and loss
account over the vesting period of the stock options. The stock options
issued are recorded as share issue premium.
Cash flow hedgesAs a result of a specific difference in the rules under IAS 39 and FAS 133,
Accounting for Derivative Instruments and Hedging Activities, relating to
hedge accounting, certain foreign exchange gains and losses classified
within equity under IAS would be included in the income statement
under U.S. GAAP.
Net investment in foreign companiesUnder IAS, on the disposal of a foreign entity, the cumulative amount of
the exchange differences which have been deferred and which relate to
that foreign entity should be recognized as income or as expenses in the
same period in which the gain or loss on disposal is recognized. An enter-
prise may dispose of its interest in a foreign entity through sale, liquida-
tion, repayment of share capital and permanent loans, or abandonment
of all, or part of, that entity.
Under U.S. GAAP, the cumulative translation differences are reported
in the profit and loss account only upon the sale or upon complete or
substantially complete liquidation of the investment in a foreign entity.
Acquisition purchase priceUnder IAS, when the consideration paid in a business combination
includes shares of the acquirer, the purchase price of the acquired busi-
ness is determined at the date on which the shares are exchanged.
Under U.S. GAAP, the measurement date for shares of the acquirer is
the first day on which both the number of acquirer shares and the
amount of other considerations become fixed. The average share price
for a few days before and a few days after the measurement date is then
used to value the shares.
Amortization of identifiable intangible assets acquiredUnder IAS, acquired unpatented technology is not separately recognized
on acquisition but is included within goodwill.
Under U.S. GAAP, any unpatented technology acquired in a business
combination is recorded as an identifiable intangible asset with a rela-
ted deferred tax liability. The intangible asset is amortized over its esti-
mated useful life. The adjustment to U.S. GAAP net income and sharehol-
ders’ equity relates to the amortization and accumulated amortization,
respectively, of Amber Networks’ intangible.
The gross carrying amount of intangible assets, under U.S. GAAP, is
EUR 109 million as of December 31, 2002 (EUR 109 million as of December
31, 2001), which is being amortized over an estimated useful life of five
years. Accumulated amortization as of December 31, 2002 was EUR 29
million (EUR 7 million at December 31, 2001). The amortization expense
for the year ended December 31, 2002 is EUR 22 million (EUR 7 million in
2001). Amortization expense on intangible assets is expected to be EUR 22
million in 2003, 2004 and 2005 and EUR 14 million in 2006.
Amortization of goodwillUnder IAS, goodwill is amortized over its estimated useful life. Under U.S.
GAAP, prior to July 1, 2001, goodwill was amortized over its estimated
useful life consistent with IAS. The Group adopted the transition provi-
sions of FAS 141, Business Combinations (FAS 141), with effect from July 1,
2001. The Group also adopted the provisions of FAS 142, Goodwill and
Other Intangible Assets (FAS 142), on January 1, 2002. As a result, goodwill
is no longer subject to amortization subsequent to the date of adoption.
As the non-amortization of goodwill provisions of FAS 142 were effective
immediately for all acquisitions after June 30, 2001, goodwill arising from
the Amber Networks acquisition was also not amortized during 2001.
The U.S. GAAP adjustment reverses the amortization expense recorded
under IAS and also reverses the movement in accumulated amortization
under IAS during the period subsequent to the adoption of FAS 141 and
FAS 142.
The following table shows the results of operations as if FAS 142 were
applied to prior periods:
2001 2000
EURm EURm
Net income as reported under U.S. GAAP 1 903 3 847
Add back: Goodwill amortization 274 140
Adjusted net income 2 177 3 987
2001 2000
EUR EUR
Income per share—Basic
Net income as reported under U.S. GAAP 0.40 0.82
Goodwill amortization 0.06 0.03
Adjusted net income 0.46 0.85
Income per share—Diluted
Net income as reported under U.S. GAAP 0.40 0.80
Goodwill amortization 0.06 0.03
Adjusted net income 0.45 0.83
Impairment of goodwillThe Company has evaluated its existing goodwill relating to prior busi-
ness combinations and has determined that an adjustment or reclassifi-
cation to intangible assets as of January 1, 2002 was not required in order
to conform to the new criteria in FAS 141. The Company has also reas-
sessed the useful lives and carrying values of other intangible assets, and
will continue to amortize these assets over their remaining useful lives.
As of January 1, 2002, the Company performed the transitional
impairment test under FAS 142 and compared the carrying value for each
reporting unit to its fair value, which was determined based on discounted
cash flows. Upon completion of the transitional impairment test, the
Company determined that there was no impairment as of January 1,
2002, as the carrying value of each reporting unit did not exceed its fair
U.S. GAAP

54 | Nokia in 2002
value. The Company also completed the annual impairment test requi-
red by FAS 142 during the fourth quarter of 2002, which was also perfor-
med by comparing the carrying value of each reporting unit to its fair
value based on discounted cash flows.
Under IAS, goodwill is allocated to “cash generating units”, which are
the smallest group of identifiable assets which includes the goodwill
under review for impairment, and that generates cash inflows from
continuing use that are largely independent of the cash inflows from
other assets. Under IAS, the Company recorded an impairment of good-
will of EUR 104 million related to Amber Networks as the carrying
amount of the cash generating unit exceeded the recoverable amount of
the unit. Upon completion of the annual impairment test, the Company
determined that the impairment recorded for Amber Networks should
be reversed for U.S. GAAP purposes because, at the IP Mobility Network
reporting unit level where Amber Networks resides, the fair value of the
reporting unit exceeded the book value of the reporting unit.
U.S. GAAP
Common
Nokia Mobile Nokia Nokia Ventures Group
Phones Networks Organization Functions Group
EURm EURm EURm EURm EURm
Balance as of January 1, 2002 351 382 80 – 813
Goodwill acquired – – – 9 9
Impairment losses – –17 –61 – –78
Translation adjustment –202 –42 4 – –240
Balance as of December 31, 2002 149 323 23 9 504
Below is a roll forward of U.S. GAAP goodwill during 2002:
Of the amount of goodwill under U.S. GAAP, EUR 352 million relates to
the acquisition of Amber Networks in 2001. Goodwill is not deductible for
tax purposes.
Translation of goodwillUnder IAS, the company translates goodwill arising on the acquisition of
foreign subsidiaries at historical rates.
Under U.S. GAAP, goodwill is translated at the closing rate on the
balance sheet date with gains and losses recorded as a component of
shareholders’ equity.

Nokia in 2002 | 55
Our accounting policies affecting our financial condition and results of
operations are more fully described in note 1 to our consolidated financial
statements. Certain of Nokia’s accounting policies require the application
of judgment by management in selecting appropriate assumptions for
calculating financial estimates, which inherently contain some degree of
uncertainty. Management bases its estimates on historical experience
and various other assumptions that are believed to be reasonable under
the circumstances, the results of which form the basis for making
judgments about the reported carrying values of assets and liabilities
and the reported amounts of revenues and expenses that may not be
readily apparent from other sources. Actual results may differ from
these estimates under different assumptions or conditions.
Nokia believes the following are the critical accounting policies and
related judgments and estimates used in the preparation of its consoli-
dated financial statements.
Revenue recognitionThe majority of Nokia Networks’ revenue is derived from projects pro-
viding a customer specific solution consisting of complex telecommuni-
cation equipment and services modified to customer needs.
Revenue is recognized from these projects on the percentage of
completion basis. Completion is generally measured by reference to costs
incurred to date as a percentage of estimated total project costs. The
milestone output method is applied when the nature of the individual
project indicates that a milestone method is the most applicable measure
of progress.
The percentage of completion method relies on estimates of total
expected contract revenue and costs, as well as the dependable measure-
ment of the progress made towards completing the particular project.
Recognized revenues and profit are subject to revisions during the
project in the event that the assumptions regarding the overall project
outcome are revised. The cumulative impact of a revision in estimates is
recorded in the period such revisions become known and estimable.
Losses on projects in progress are recognized immediately when known
and estimable.
Revenue recognition on initial 3G network contracts started in 2002
when Nokia Networks reached the relevant milestones for its single-
mode and dual-mode WCDMA 3G systems.
Nokia’s current sales and profit estimates for projects may change
due to the early stage of a long-term project, new technology, changes in
the project scope, changes in costs, changes in timing, changes in cus-
tomers’ plans, realization of penalties, and other corresponding factors.
Nokia Mobile Phones’ and Nokia Ventures Organization’s, as well as
certain of Nokia Networks’, revenue is recognized when persuasive evi-
dence of an arrangement exists, delivery has occurred, the fee is fixed
and determinable and collectibility is probable. This requires us to as-
sess at the point of delivery whether these criteria have been met. Upon
making such assessment, revenue is recognized. In particular, Nokia
records estimated reductions to revenue for customer programs and in-
centive offerings, including special pricing agreements, price protection
and other volume based discounts, mainly in the mobile phone business.
Sales adjustments for volume based discount programs are estimated
based largely on historical activity under similar programs. Price protec-
tion adjustments are based on estimates of future price reductions and
certain agreed customer inventories at the date of the price adjustment.
Customer financingWe have extended a significant amount of customer financing to selected
customers in our Nokia Networks business. In establishing the arrange-
ments, management must assess the creditworthiness of the customer
and the timing of cash flows expected to be received under the arrange-
ment. However, should the actual financial position of our customers or
general economic conditions differ from our assumptions, we may be re-
quired to re-assess the ultimate collectibility of such financings, which
could result in a write-off of these balances in future periods and thus
negatively impact our profits in future periods. Our assessment of the net
recoverable value considers the collateral and security arrangements of
the receivable as well as the likelihood and timing of estimated collections.
See note 34(b) to our consolidated financial statements for a further discus-
sion of long-term customer loans.
The carrying value of the customer financing extended to MobilCom
was written down in 2002 to the estimated fair value of the subordinated
convertible perpetual bonds of France Telecom that Nokia expects to receive
as repayment for the loans to MobilCom. The most significant assump-
tions used in determining the estimated fair value of the bonds were the
likelihood of approval of the transaction by the respective boards and
shareholders of MobilCom and France Telecom, discount rates, credit-
worthiness of France Telecom, volatility of France Telecom’s share price
and expected interest rates to be received. Should the ultimate
collectibility of the amounts due from MobilCom differ from the current
carrying value, an additional adjustment to this balance could be re-
quired in future periods, potentially negatively impacting our future
profits.
Allowances for doubtful accountsWe maintain allowances for doubtful accounts for estimated losses
resulting from the subsequent inability of our customers to make
required payments. If the financial conditions of our customers were to
deteriorate, resulting in an impairment of their ability to make
payments, additional allowances may be required in future periods.
Management specifically analyzes accounts receivables and analyzes
historical bad debt, customer concentrations, customer creditworthiness,
current economic trends and changes in our customer payment terms
when evaluating the adequacy of the allowance for doubtful accounts.
Inventory-related allowancesWe periodically review our inventory for obsolescence and declines in
market value below cost and record an allowance against the inventory
balance for any such declines. These reviews require management to
estimate future demand for our products. Possible changes in these esti-
mates could result in revisions to the valuation of inventory.
Warranty provisionsWe provide for the estimated cost of product warranties at the time revenue
is recognized. Nokia’s products are covered by product warranty plans of
varying periods, depending on local practices and regulations. While we
engage in extensive product quality programs and processes, including
actively monitoring and evaluating the quality of our component
suppliers, our warranty obligations are affected by actual product failure
rates (field failure rates) and by material usage and service delivery costs
incurred in correcting a product failure. Our warranty provision is
Critical accounting policies
56 | Nokia in 2002
established on our best estimates of the amounts necessary to settle future
and existing claims on products sold as of the balance sheet date. While
we believe that our warranty provisions are adequate and that the
judgment applied is appropriate, such amounts estimated to be due and
payable could differ materially from what will actually transpire in the
future. As our new advanced products incorporate complex, evolving
technologies including next generation technologies, as we continue to
introduce new products frequently, and as local practices and regula-
tions may change, it will be increasingly difficult to anticipate our failure
rates and length of warranty periods. Should actual product failure rates,
material usage or service delivery costs differ from our estimates, revi-
sions to the estimated warranty liability would be required.
Provision for intellectual property rights,or IPR, infringementsWe provide for the estimated future settlements related to asserted and
unasserted IPR infringements based on the probable outcome of each
infringement. The ultimate outcome or actual cost of settling an individual
infringement may vary from our estimates.
Capitalized development costsWe capitalize certain development costs when it is probable that a develop-
ment project will be a success and certain criteria, including commercial
and technological feasibility, have been met. These costs are then
amortized on a systematic basis over their expected useful lives, which
due to the constant development of new technologies is between two to
five years. During the development stage, management must estimate
the commercial and technological feasibility of these projects as well as
their expected useful lives. Should a product fail to substantiate its esti-
mated feasibility or life cycle, we may be required to write off excess
development costs in future periods.
Valuation of long-lived and intangible assets and goodwillWe assess the carrying value of identifiable intangible assets, long-lived
assets and goodwill annually, or more frequently if events or changes in
circumstances indicate that such carrying value may not be recoverable.
Factors we consider important, which could trigger an impairment
review, include the following:
• significant underperformance relative to expected historical
or projected future results;
• significant changes in the manner of our use of the acquired assets
or the strategy for our overall business; and
• significant negative industry or economic trends.
When we determine that the carrying value of intangible assets,
long-lived assets or goodwill may not be recoverable based upon the
existence of one or more of the above indicators of impairment, we
measure any impairment based on a projected discounted cash flow.
This review is based upon our projections of anticipated future cash
flows. The most significant variables in determining cash flows are
discount rates, terminal values and the number of years on which to
base the cash flow projections. Management determines discount rates
to be used based on the risk inherent in the related activity’s current
business model compared to Nokia’s internal rate of return and industry
comparisons. Terminal values are based on the expected life of products
and forecasted life cycle and forecasted cash flows over that period.
While we believe that our assumptions are appropriate, such amounts
estimated could differ materially from what will actually occur in the
future. For IAS these discounted cash flows are prepared at a cash generating
unit level, and for U.S. GAAP these cash flows are prepared at a
reporting unit level. Consequently, an impairment could be required under
IAS and not U.S. GAAP or vice versa.
Deferred taxesManagement judgment is required in determining our provision for
income taxes, deferred tax assets and liabilities and the extent to which
deferred tax assets can be recognized. We recognize deferred tax assets if
it is probable that sufficient taxable income will be available in the
future against which the temporary differences and unused tax losses
can be utilized. We have considered future taxable income and tax planning
strategies in assessing whether deferred tax assets should be recognized.
PensionsThe determination of our pension benefit obligation and expense for
defined benefit pension plans is dependent on our selection of certain
assumptions used by actuaries in calculating such amounts. Those
assumptions are described in note 5 to our consolidated financial state-
ments and include, among others, the discount rate, expected long-term
rate of return on plan assets and annual rate of increase in future com-
pensation levels. A portion of our plan assets is invested in equity securities.
The equity markets have experienced volatility, which has affected the
value of our pension plan assets. This volatility may make it difficult to
estimate the long-term rate of return on plan assets. Actual results that
differ from our assumptions are accumulated and amortized over future
periods and therefore generally affect our recognized expense and
recorded obligation in such future periods. Our assumptions are based
on actual historical experience and external data regarding compensation
and discount rate trends. While we believe that our assumptions are
appropriate, significant differences in our actual experience or significant
changes in our assumptions may materially affect our pension obliga-
tion and our future expense.
Critical accounting policies
Nokia in 2002 | 57
Set forth below is a description of factors that may affect our business,
results of operations and share price from time to time.
• The new advanced products and solutions that we are and will be de-
veloping incorporate complex, evolving technologies, including 3G and
subsequent new technologies. This exposes us to certain risks that, if
they were to occur, could have a material adverse impact on us and our
ability to grow our business.
• Changes in the communications industry are expected to increase com-
petition and change the competitive landscape and may affect our sales
and operating profit negatively.
• We may not reach our targets, and may experience greater variability in
our sales and operating profit than in the past, particularly depending
on the general economic conditions and the pace of development and
acceptance of new technologies.
• If we fail to manage the prices and costs of our portfolio of mobile
phones, our sales and operating profit may be negatively affected.
• The global networks business relies on a limited number of customers
and large multi-year contracts. Unfavorable developments under a major
contract or in relation to a major customer may affect our sales, operating
profit and cash flow adversely.
• Customer financing to network operators can be a competitive require-
ment and could affect our net sales, operating profit, balance sheet and
cash flow adversely.
• Our sales and operating profit could be adversely affected if we fail to
efficiently manage our manufacturing and logistics, or fail to ensure that
our products meet our quality standards.
• We depend on our suppliers for the timely delivery of components and
for their compliance with our supplier requirements, such as, most notably,
our product quality standards. Their failure to do so could adversely
affect our ability to deliver our products successfully and on time.
• We are developing a number of our new products and solutions in part-
nership with other companies. If any of these companies were to fail to
perform, we may not be able to bring our products and solutions to
market successfully or on a timely basis.
• Our operations rely on complex information technology systems and
networks. If any system or network disruption occurs, this reliance could
have a material adverse impact on our operations, sales and operating
profit.
• If we are unable to recruit, retain and develop appropriately skilled em-
ployees, we may not be able to implement our strategies and, conse-
quently, our results of operations may suffer.
Risk factors
• As our products and solutions include complex technology involving
patented and other proprietary technologies, we face a risk of claims
that we have infringed third parties’ intellectual property rights. These
may result in costly and time-consuming litigation, the invalidation of
intellectual property rights on which we depend or increased licensing
costs for us to be able to utilize these rights.
• Allegations of health risks from the electromagnetic fields generated by
base stations and mobile handsets, and the lawsuits and publicity relating
to them, regardless of merit, could affect our operations negatively by
leading consumers to reduce their use of mobile phones or by causing us
to allocate monetary and personnel resources to these issues.
• Our net sales and costs are affected by fluctuations in the rate of exchange
particularly between the euro, which is our reporting currency, and the
US dollar and the Japanese yen as well as certain other currencies.
• Our net sales derived from, and assets located in, emerging market
countries may be adversely affected by economic, regulatory and political
developments in those countries.
• Changes in various types of regulation in countries around the world
could affect our business adversely.
• Our share price has been and may continue to be volatile in response to
conditions in the global securities markets generally and in the commu-
nications and technology sectors in particular.
We file an annual report on Form 20-F with the US Securities and Exchange
Commission, which report also includes a description of risk factors that
may affect us. Nokia filed its Form 20-F annual report for the year ended Decem-
ber 31, 2002 on February 7, 2003. For further information you should refer to
our Form 20-F annual report.
January 23, 2003

58 | Nokia in 2002
Group Executive Board
January 23, 2003
Our articles of association provide for a Group Executive Board, which is responsible for managing the operations of Nokia. The Chairman and the
members of the Group Executive Board are elected by the Board of Directors. Only the Chairman of the Group Executive Board can be a member of
both the Board of Directors and the Group Executive Board. The current members of our Group Executive Board are set forth below.
Chairman Jorma Ollila, b. 1950Chairman and CEO of Nokia Corporation.
Group Executive Board member since 1986.
Chairman since 1992.
Joined Nokia 1985.
Master of Science (Eng.) (Helsinki University of
Technology). Master of Political Science (University
of Helsinki), Master of Science (Econ.) (London
School of Economics),
President and CEO, and Chairman of the Group
Executive Board of Nokia Corporation 1992–1999,
President of Nokia Mobile Phones 1990–1992,
Senior Vice President, Finance of Nokia 1986–1989.
Member of the Board of Directors of Ford Motor
Company, Otava Books and Magazines Group Ltd
and UPM-Kymmene Corporation. Member of The
European Round Table of Industrialists.
Pekka Ala-Pietilä, b. 1957President of Nokia Corporation.
Group Executive Board member since 1992.
Joined Nokia 1984.
Master of Science (Econ.) (Helsinki School of
Economics and Business Administration).
Executive Vice President and Deputy to the CEO of
Nokia Corporation and President of Nokia Commu-
nications Products 1998-1999, President of Nokia
Mobile Phones 1992-1998, Vice President, Product
Marketing of Nokia Mobile Phones 1991–1992,
Vice President, Strategic Planning of Nokia Mobile
Phones 1990–1991.
Member of the Supervisory Board of SAP AG,
member of the Science and Technology Policy
Council of Finland, member of the Board of the
Finnish-American Chamber of Commerce, member
of the Board of the Economic Information Bureau.
Dr. Matti Alahuhta, b. 1952President of Nokia Mobile Phones.
Group Executive Board member since 1993.
With Nokia 1975–1982, rejoined 1984.
Doctor of Science (Technology) (Helsinki University
of Technology).
President of Nokia Telecommunications 1993–1998,
Executive Vice President of Nokia Telecommunica-
tions 1992, Senior Vice President, Public Networks
of Nokia Telecommunications 1990–1992.
Member of the Board of Directors of Finnair Oyj
(until December 31, 2002), Chairman of the Board
of The Federation of Finnish Metal, Engineering and
Electrotechnical Industries, Vice Chairman of the
Board of the Confederation of Finnish Industry and
Employers, member of the Executive Committee of
The International Institute for Management
Development (IMD).
Sari Baldauf, b. 1955President of Nokia Networks.
Group Executive Board member since 1994.
Joined Nokia 1983.
Master of Science (Business Administration)
(Helsinki School of Economics and Business
Administration).
Executive Vice President of Nokia APAC 1997–1998,
President, Cellular Systems of Nokia Telecommuni-
cations 1988–1996, Vice President, Business Devel-
opment of Nokia Telecommunications 1987–1988.
Member of the Board of International Youth Foun-
dation and member of The National Committee for
the Information Society Issues and member of the
Board of Foundation for Economic Education.
Dr. J. T. Bergqvist, b. 1957Executive Vice President and General Manager,
IP Mobility Nokia Networks.
Group Executive Board Member since July 1, 2002.
Joined Nokia 1983.
Doctor of Science (Technology) (Helsinki University
of Technology).
Senior Vice President, Radio Access Systems of Nokia
Telecommunications 1997–2000, Vice President,
Cellular Transmission Business, Network and Access
Systems of Nokia Telecommunications 1995–1996,
Area General Manager, Area Management of Nokia
Telecommunications 1993–1994, Area General
Manager, Marketing of Nokia Cellular Systems
1990–1992.
Olli-Pekka Kallasvuo, b. 1953Executive Vice President, Chief Financial Officer
of Nokia Corporation.
Group Executive Board member since 1990.
With Nokia 1980–81, rejoined 1982.
LL.M. (University of Helsinki).
Executive Vice President of Nokia Americas and
President of Nokia Inc. 1997–1998, Executive Vice
President, CFO of Nokia 1992–1996, Senior Vice
President, Finance of Nokia 1990–1991.
Chairman of the Board of Directors of F-Secure
Corporation, Nextrom Holding S.A., Nokian Tyres plc
and Sampo plc.

Nokia in 2002 | 59
Group Executive Board
Pertti Korhonen, b. 1961Executive Vice President, Nokia Mobile Software.
Group Executive Board member since
July 1, 2002.
Joined Nokia 1986.
Master of Science (Electronics Eng.)
(University of Oulu).
Senior Vice President, Global Operations,
Logistics and Sourcing of Nokia Mobile Phones
1999–2001, Senior Vice President, Global Operations
and Logistics of Nokia Mobile Phones 1998–1999,
Vice President, Logistics of Nokia Mobile Phones
1996-1998, Vice President, Manufacturing Europe of
Nokia Mobile Phones 1993–1996, Project Executive
of Nokia Mobile Phones UK Ltd, 1991–1993,
Vice President, R&D of Nokia Mobile Phones,
Oulu 1990–1991.
Member of the Board of Directors, QPR Software Oyj.
Dr. Yrjö Neuvo, b. 1943Executive Vice President, CTO of Nokia Mobile
Phones.
Group Executive Board member since 1993.
Joined Nokia 1993.
Master of Science (Eng.), Licentiate of Science
(Technology) (Helsinki University of Technology),
Ph.D. (EE) (Cornell University).
Senior Vice President, Product Creation of Nokia
Mobile Phones 1994–1999, Senior Vice President,
Technology of Nokia 1993–1994, National Research
Professor of The Academy of Finland 1984–1992,
Professor of Tampere University of Technology
1976–1992, Visiting Professor of University of
California, Santa Barbara 1981–1982.
Vice Chairman of the Board of Directors of Vaisala
Corporation.
Member of Finnish Academy of Technical Sciences,
The Finnish Academy of Science and Letters, and
Academiae Europae, Foreign member of Royal
Swedish Academy of Engineering Sciences, and
Fellow of the Institute of Electrical and Electronics
Engineers.
Veli Sundbäck, b. 1946Executive Vice President, Corporate Relations
and Trade Policy of Nokia Corporation.
Group Executive Board member since 1996.
Joined Nokia 1996.
LL.M. (University of Helsinki).
Secretary of State at the Ministry for Foreign Affairs
1993–1995, Under-Secretary of State for External
Economic Relations at the Ministry for Foreign
Affairs 1990–1993.
Chairman of the Board of Directors of Huhtamäki Oyj.
Vice Chairman of the Board of the International
Chamber of Commerce, Finnish Section, Chairman
of the Trade Policy Committee of The Confederation
of Finnish Industry and Employers and Chairman of
the Board of the Finland-China Trade Association.
Anssi Vanjoki, b. 1956Executive Vice President, Nokia Mobile Phones.
Group Executive Board member since 1998.
Joined Nokia 1991.
Master of Science (Econ.) (Helsinki School of
Economics and Business Administration).
Senior Vice President, Europe & Africa of Nokia
Mobile Phones 1994–1999, Vice President,
Sales of Nokia Mobile Phones 1991–1994,
3M Corporation 1980–1990.
Governor of European Foundation of Quality
Management.
Of Nokia’s strategic countries, Matti Alahuhta is
responsible for Nokia’s operations in Japan, Sari
Baldauf for China and Olli-Pekka Kallasvuo for
the United States.

60 | Nokia in 2002
January 23, 2003
Board of Directors
Chairman Jorma Ollila, b. 1950Chairman and CEO.
Chairman of the Group Executive Board of Nokia Corporation.
Board member since 1995. Chairman since 1999.
Master of Science (Eng.) (Helsinki University of Technology),
Master of Political Science (University of Helsinki),
Master of Science (Econ.) (London School of Economics),
President and CEO, and Chairman of the Group Executive Board of Nokia
Corporation 1992–1999, President of Nokia Mobile Phones 1990–1992,
Senior Vice President, Finance of Nokia 1986–1989.
Holder of various managerial positions at Citibank within corporate
banking 1978–1985.
Vice Chairman of Otava Books and Magazines Group Ltd and member of the
Board of Directors of Ford Motor Company and UPM-Kymmene Corporation.
Member of The European Round Table of Industrialists.
Vice Chairman Paul J. Collins, b. 1936Board member since 1998. Vice Chairman since 2000.
BBA (University of Wisconsin), MBA (Harvard Business School).
Vice Chairman of Citigroup Inc. 1998–2000, Vice Chairman and member of
the Board of Directors of Citicorp and Citibank N.A. 1988–2000.
Holder of various executive positions at Citibank within investment
management, corporate banking, corporate planning as well as finance
and administration 1961–1988.
Member of the Board of Directors of BG Group, Genuity Corporation and
Kimberly-Clark Corporation.
Georg Ehrnrooth, b. 1940Board member since 2000.
Master of Science (Eng.) (Helsinki University of Technology).
President and CEO of Metra Corporation 1991–2000, President and CEO
of Lohja Corporation 1979–1991.
Holder of various executive positions at Wärtsilä Corporation within production
and management 1965–1979.
Chairman of the Board of Directors of Assa Abloy AB (publ) and Varma-Sampo
Mutual Pension Insurance Company, Vice Chairman of the Board of Directors of
Rautaruukki Corporation, member of the Board of Directors of Oy Karl Fazer Ab,
Sandvik AB (publ), Sampo plc and Wärtsilä Corporation.
Chairman of The Center for Finnish Business and Policy Studies (EVA).
Dr. Bengt Holmström, b. 1949Paul A. Samuelson Professor of Economics at MIT, joint appointment
at the MIT Sloan School of Management.
Board member since 1999.
Bachelor of Science (Helsinki University), Master of Science (Stanford University),
Doctor of Philosophy (Stanford University).
Edwin J. Beinecke Professor of Management Studies at Yale University 1985–1994.
Member of the Board of Directors of Kuusakoski Oy.
Member of the American Academy of Arts and Sciences and Foreign Member
of The Royal Swedish Academy of Sciences.
Per Karlsson, b. 1955Independent Corporate Advisor.
Board member since 2002.
Degree in Economics and Business Administration (Stockholm School
of Economics).
Independent corporate advisor 1992–present.
Executive Director, with mergers and acquisitions advisory responsibilities,
at Enskilda M&A, Enskilda Securities (London) 1986–1992.
Corporate strategy consultant at the Boston Consulting Group (London)
1979–1986.
Board member of IKANO Holdings S.A.
Robert F. W. van Oordt, b. 1936Chairman of Rodamco Europe N.V.
Board member since 1998.
Drs of Economics (University of Amsterdam).
CEO of Rodamco Europe N.V. 2000–2001, Chairman of the Executive Board of
NV Koninklijke KNP BT 1993–1996, Chairman of the Executive Board of
Bührmann-Tetterode N.V. 1990–1993, Executive Vice President and COO and
member of the Board of Directors of Hunter Douglas Group N.V. 1979–1989.
Consultant and partner with McKinsey & Company Inc. 1967–1979.
Chairman of Rodamco Europe N.V., member of the Supervisory Board of
Draka Holding N.V., member of the Board of Directors of Fortis Bank N.V.,
Schering-Plough Corporation and Umicore S.A.
Pursuant to the provisions of the Finnish Companies Act and our articles of association, the control and management of Nokia is divided among the
shareholders in a general meeting, the Board of Directors and the Group Executive Board. The current members of the Board of Directors were elected at
the Annual General Meeting on March 21, 2002, in accordance with the proposal of the Nomination Committee. On the same date, the Chairman and Vice
Chairman were elected by the Board members. Certain information with respect to these individuals is set forth below.

Nokia in 2002 | 61
Dame Marjorie Scardino, b. 1947Chief Executive and member of the Board of Directors of Pearson plc.
Board member since 2001.
BA (Baylor), JD (University of San Francisco).
Chief Executive of The Economist Group 1993–1997, President of the North
American Operations of The Economist Group 1985–1993.
Lawyer 1976–1985 and publisher of the Georgia Gazette newspaper 1978–1985.
Vesa Vainio, b. 1942Board member since 1993.
LL.M. (University of Helsinki).
Chairman (1998–1999 and 2000–2002) and Vice Chairman (1999–2000) of the
Board of Directors of Nordea AB (publ), Chairman of the Executive Board and
CEO of Merita Bank Ltd and CEO of Merita Ltd 1992–1997.
President and CEO of Kymmene Corporation 1991–1992.
Holder of various other executive positions in Finnish industry 1972–1991.
Chairman of the Board of Directors of UPM-Kymmene Corporation and Vice
Chairman of the Board of Directors of Wärtsilä Corporation.
Chairman of the Board of The Central Chamber of Commerce of Finland.
Arne Wessberg, b. 1943Chairman of the Board of Directors and President of Yleisradio Oy
(Finnish Broadcasting Company).
Board member since 2001.
Studies in economics in the University of Tampere (1963–1966).
Member of the Board of Trustees of IIC 1996–1998 and 1993–1995.
Holder of various positions at Yleisradio Oy (Finnish Broadcasting Company)
as a reporter and editor (1971–1976), in different executive roles (1979–1994),
and as President (1994–present).
Chairman of the Board of Directors of Digita Oy.
President of the European Broadcasting Union (EBU) and member of the Board
of Directors of the International Council of NATAS.
Board of Directors
On January 23, 2003, we announced the proposal of the Nomination
Committee to the Annual General Meeting convening on March 27, 2003
regarding the election of the members of the Board of Directors.
The Nomination Committee will propose that all of the present members
be re-elected for terms ending at the close of the Annual General Meeting
in 2004.

62 | Nokia in 2002
Corporate Governance
Corporate GovernancePursuant to the provisions of the Finnish Companies Act and our articles
of association, the control and management of Nokia is divided among
the shareholders in a general meeting, the Board of Directors and the
Group Executive Board. Our articles of association provide for a Group
Executive Board, which is responsible for managing the operations of
Nokia. The Chairman and the members of the Group Executive Board are
elected by the Board of Directors. Only the Chairman of the Group Executive
Board can be a member of both the Board of Directors and the Group
Executive Board.
The duties of the Board of DirectorsThe Board decides on matters that, in relation to the Group’s activities,
are significant in nature. Such matters include confirmation of the stra-
tegic guidelines, approval of the periodic plans and decisions on major
investments and divestments. The Board appoints the CEO, the President,
the Chairman and the members of Nokia’s Group Executive Board. The
Board also determines the remuneration of the CEO and the President.
The roles and responsibilities of the Board, its Chairman and its com-
mittees are defined in the Board’s Rules of Procedure. The Board’s com-
mittees consist of the Audit Committee, the Personnel Committee and the
Nomination Committee. The Board regularly reviews the Board’s Rules
of Procedure in order to ensure that they appropriately address the work
of the Board and comply with what the Board believes to be best practices
of corporate governance.
Election and composition of the Board of DirectorsPursuant to the articles of association, Nokia Corporation has a Board of
Directors composed of a minimum of seven and a maximum of ten mem-
bers. The members of the Board are elected for a term of one year at each
Annual General Meeting, which convenes each March or April. Since the
Annual General Meeting held on March 21, 2002, the Board has consisted
of nine members. Nokia’s CEO, Mr. Jorma Ollila, also serves as the Chair-
man of the Board. The other members of the Board are all non-executive
and independent. “Independent” means that the members of the Board
have no material relationships with Nokia apart from Board member-
ship. The Board convened nine times during 2002.
The Board elects a Chairman and a Vice Chairman from among its
members for one term at a time. On March 21, 2002 the Board resolved
that Jorma Ollila should continue to act as Chairman and that Paul J.
Collins should continue to act as Vice Chairman. The Board also appoints
the members and the chairmen for its committees from among its non-
executive members for one term at a time.
The Committees of the Board of DirectorsThe Audit Committee must consist of a minimum of three independent
and qualified non-executive members of the Board. Since March 21, 2002,
the Committee has consisted of the following four members of the Board,
each of whom is independent and qualified: Robert F.W. van Oordt
(Chairman), Georg Ehrnrooth, Per Karlsson and Arne Wessberg.
The purpose of the Audit Committee is to assist the Board in fulfilling
its responsibilities to oversee the accounting and financial reporting pro-
cesses of Nokia. These include the oversight of the quality and integrity
of Nokia’s consolidated financial statements and related disclosure, the
performance of its internal control and risk management and audit func-
tions. The Committee further oversees the performance, qualifications
and independence of the external auditor. Under Finnish law, our external
auditor is elected by our shareholders at the Annual General Meeting.
The Audit Committee holds meetings at least four times per year accor-
ding to the schedule approved by it at the first meeting following the
Committee’s nomination. The Committee also meets with representatives
of management and the external auditor at least twice annually. The Audit
Committee held four meetings in 2002.
The Personnel Committee must consist of a minimum of three
members of the Board. Since March 21, 2002, the Personnel Committee
has consisted of the following four members of the Board, each of whom
is independent: Paul J. Collins (Chairman), Bengt Holmström, Marjorie
Scardino and Vesa Vainio.
The Personnel Committee’s purpose is to oversee the personnel policies
and practices of Nokia. It also assists the Board in discharging its responsi-
bilities relating to the compensation of Nokia’s executives. It has overall
responsibility for evaluating, resolving and making recommendations to
the Board regarding the compensation of top executives, incentive com-
pensation plans and policies affecting executives, as well as all equity-
based plans and other significant incentive plans at Nokia. The Committee
is also responsible for ensuring that the compensation programs are per-
formance-based, properly motivate management and support Nokia’s
overall corporate strategies. In addition, the Committee is responsible for
the review of senior management’s development and succession plans.
The Personnel Committee convened three times in 2002.
The Nomination Committee must consist of three to five members
of the Board. Since March 21, 2002, the Nomination Committee has consisted
of the following three members of the Board, each of whom is indepen-
dent: Paul J. Collins (Chairman), Bengt Holmström and Vesa Vainio.
The Nomination Committee prepares proposals for the general mee-
tings in respect of the composition, remuneration principles, and remu-
neration of the Board to be approved by the shareholders. It also moni-
tors significant developments in the law and practice of corporate gover-
nance and proposes necessary actions in respect thereof. The Nomination
Committee held two meetings in 2002.
Proposal of the Nomination Committee of the BoardOn January 23, 2003 the Nomination Committee of the Board announced
that it will propose to the Annual General Meeting that all the present
Board members be re-elected until the close of the following Annual
General Meeting in 2004.
CompensationBoard of DirectorsFor the year ended December 31, 2002, the aggregate compensation of
the eight non-executive members of the Board of Directors was approxi-
mately EUR 0.6 million. Non-executive members of the Board of Directors
do not receive bonuses. The remuneration for members of our Board of
Directors for each term expiring at the close of the next Annual General
Meeting is resolved annually by our Annual General Meeting, after being
proposed by the Nomination Committee of our Board.
The table on page 63 depicts the total annual remuneration paid to
the members of our Board of Directors, as resolved by the Annual General
Meetings in the respective years. Since the fiscal period 1999, approxima-
tely 60% of each Board member’s annual retainer has been paid in cash,
with the balance in shares of our stock, acquired from the market.

Nokia in 2002 | 63
Group Executive BoardFor the year ended December 31, 2002, the aggregate compensation of
the 10 members of the Group Executive Board, including Mr. Ollila, was
approximately EUR 7.9 million. Of this amount, approximately EUR 2.7
million was paid pursuant to bonus arrangements for the 2002 calendar
year. The bonuses of the members of the Group Executive Board are paid
as a percentage of annual base salary based on Nokia’s Short Term
Incentive Plan. The Short Term Incentive Payments are paid twice each
year based on performance for each of Nokia’s short term plans which
end on June 30, and December 31 of each year.
Short Term Incentive Payments are primarily determined based on a
formula that considers the company’s performance to pre-established
targets for Net Sales, Operating Profit and Net Working Capital efficiency
measures. Certain executives may have objectives related to quality,
technology innovation, new product revenue, or other objectives of key
strategic importance, which may require a discretionary assessment of
performance by the Committee.
Our executives participate in the Finnish TEL pension system, which
provides for a retirement benefit based on years of service and earnings
according to the prescribed statutory system. Under the Finnish TEL pension
system, base pay, incentives and other taxable fringe benefits are included
in the definition of earnings, although gains realized from stock options
are not. The Finnish TEL pension scheme provides for early retirement
benefits at age 60 and full retirement benefits at age 65. The current TEL
provisions cap the total pension benefit at 60% of the pensionable ear-
nings amount.
For Mr. Ollila, Mr. Ala-Pietilä, Dr. Alahuhta, Mr. Kallasvuo and Ms. Baldauf,
Nokia offers a full retirement benefit at age 60. The full retirement bene-
fit is based on the executive's pensionable earnings at age 60, and assu-
ming that the executive continues service with Nokia through age 65.
Nokia does not offer any such benefit to any other members of the Group
Executive Board.
Recommendations for the compensation of Messrs. Ollila and Ala-Pietilä
are presented by the Personnel Committee to the Board of Directors for
final approval. Compensation for other members of the Group Executive
Board is approved by the Personnel Committee.
Service contracts of the Chairman and CEO and of the PresidentWe have a service contract with each of Jorma Ollila and Pekka Ala-Pietilä,
each of an indefinite duration. The Board has also agreed with Mr. Ollila
on the continuation of his services as CEO of Nokia through 2006.
Mr. Ollila’s contract has provisions for severance payments for up to
Corporate Governance
Year Gross annual Shares received 1 Gross annual Shares received 1 Gross annual Shares received 1
retainer retainer retainer
(EUR 1 000) (EUR 1 000) (EUR 1 000)
2000 109 840 85 640 61 460
2001 130 1 530 100 1 178 75 882
2002 130 2 650 100 2 038 75 1 529
Other MembersChairman Vice Chairman
Compensation of the Members of the Board of Directorsand the Group Executive Board 2000–2002
1 As part of the Gross Annual Retainer for that year.
Board of DirectorsShares 1 ADSs
Jorma Ollila 2 67 656 –
Paul J. Collins – 105 344
Georg Ehrnrooth 3 302 871 –
Bengt Holmström 4 999 –
Per Karlsson 3 5 829 –
Robert F.W. van Oordt 4 359 –
Marjorie Scardino – 2 411
Vesa Vainio 15 659 –
Arne Wessberg 2 411 –
Total 403 784 107 755
1 The number of shares includes not only shares acquired as compensation for servicesrendered as a member of the Board of Directors, but also shares acquired by any othermeans.
2 For Mr. Ollila’s holdings of stock options, see the table under Stock Option Ownershipbelow.
3 Mr. Ehrnrooth’s and Mr. Karlsson’s holdings include both shares held personally andshares held through a company.
24 months of compensation (both base compensation and bonus) in the
event of his termination of employment for reasons other than cause,
including a change of control. Mr. Ollila will also be allowed to retain a
portion of his unvested 1999C options proportionate to the length of his
service, in the event his employment is terminated prior to the April 1,
2003 vesting date for the 1999C stock options. As previously mentioned,
Mr. Ollila is further entitled to a full statutory pension from the date he
turns 60 years of age, instead of the statutory age of 65.
Mr. Ala-Pietilä’s contract has provisions for severance payments for
up to 18 months of compensation (both base compensation and bonus)
in the event of his termination of employment for reasons other than
cause, including a change of control. Mr. Ala-Pietilä will also be allowed
to retain a portion of his unvested 1999C options proportionate to the
length of his service, in the event his employment is terminated prior to
the April 1, 2003 vesting date for the 1999C stock options. As previously
mentioned, Mr. Ala-Pietilä is entitled to a full statutory pension from the
date he turns 60 years of age, instead of the statutory age of 65.
Management share ownershipThe following tables set forth the number of shares and ADSs beneficially
held by members of the Board of Directors and the Group Executive
Board as of December, 31, 2002.

64 | Nokia in 2002
Corporate Governance
Management Stock Option OwnershipThe following table provides certain information relating to stock options
held by members of the Group Executive Board as of December 31, 2002.
These stock options were issued pursuant to the Nokia Stock Option
Exercise price 1997C 1 1999A 2 1999B 2 2001A and B 3 1999C 4 2001B 3 2001C 5 2002A and Bper share 6 EUR 3.23 EUR 16.89 EUR 56.28 EUR 36.75 EUR 29.12 EUR 36.75 EUR 26.67 EUR 17.89
Jorma Ollila 0 1 200 000 1 056 000 312 500 544 000 687 500 500 000 1 000 000Pekka Ala-Pietilä 0 720 000 475 200 78 125 244 800 171 875 125 000 250 000Matti Alahuhta 80 000 340 000 369 600 31 250 190 400 68 750 50 000 175 000Sari Baldauf 80 000 420 000 369 600 31 250 190 400 68 750 50 000 175 000J.T. Bergqvist 0 100 000 92 400 12 500 47 600 27 500 20 000 70 000Olli-Pekka Kallasvuo 0 300 000 369 600 31 250 190 400 68 750 50 000 175 000Pertti Korhonen 0 42 000 94 120 9 375 27 880 20 625 15 000 70 000Yrjö Neuvo 0 280 000 264 000 21 875 136 000 48 125 35 000 70 000Veli Sundbäck 0 400 000 264 000 12 500 136 000 27 500 20 000 40 000Anssi Vanjoki 0 280 000 264 000 21 875 136 000 48 125 35 000 100 000
1 Each 1997C option originally granted entitles the holder to subscribe for 16 shares of Nokia stock. These options expired on January 31, 2003.2 Each 1999 A and B option originally granted entitles the holder to subscribe for four shares of Nokia stock.3 Each 2001 A and B option originally granted entitles the holder to subscribe for one share of Nokia stock. The 2001 A and B options were 25% exercisable on July 1, 2002.
An additional 6.25% of the original grant amount becomes exercisable each calendar quarter thereafter, so that the options will be fully exercisable on July 1, 2005.As of December 31, 2002, of the original grant of 2001 A and B options, 31.25% was vested and exercisable.
4 Each 1999C option originally granted entitles the holder to subscribe for four shares of Nokia stock. The 1999C options will be fully exercisable on April 1, 2003.5 Each 2001C option originally granted entitles the holder to subscribe for one share of Nokia stock. The 2001C options were 25% exercisable on January 1, 2003
and an additional 6.25% will be exercisable each calendar quarter thereafter, so that the options will be fully exercisable on January 2, 2006.6 The exercise price per share for the 1997C options has been adjusted for share splits that took place in 1998, 1999 and April 2000.
The exercise price per share for the 1999 A, B and C options has been adjusted for the share split that took place in April 2000.
Number of shares represented by exercisableoptions as of December 31, 2002
Number of shares represented by unexercisableoptions as of December 31, 2002
Stock Ownership Guidelines for Executive ManagementThe goal of our long-term, equity-based incentive awards is to recognize
progress towards the achievement of our strategic objectives, and to focus
executives on building value for shareholders. In addition to stock option
grants, we encourage stock ownership by our top executives. In January
2001, we introduced a stock ownership commitment guideline with
minimum recommendations tied to annual fixed salaries. For the
members of the Group Executive Board, the recommended minimum
Group Executive BoardShares
Pekka Ala-Pietilä 9 600
Matti Alahuhta 49 200
Sari Baldauf 103 200
J.T. Bergqvist 12 800
Olli-Pekka Kallasvuo 25 000
Pertti Korhonen 2 300
Yrjö Neuvo 74 540
Veli Sundbäck 110 000
Anssi Vanjoki 106 000
Total 492 640
investment in our shares corresponds to two times the member’s annual
base salary, to be fulfilled within five years of the introduction of the
guideline.
Insiders’ Trading in SecuritiesThe Board has established a policy in respect of trading in securities. The
policy is in line with the Guidelines for Insiders issued by the Helsinki
Exchanges.
Plans 1997, 1999 and 2001. For a description of our stock option plans,
including information regarding the expiration date of the options under
these plans, please see www.nokia.com/investors/stockinformation.

Nokia in 2002 | 65
It should be noted that certain statements here in which are not historical facts, including, without limitation, those regarding: • the timing of product deliveries; • our ability to develop and implement new products and
technologies; • expectations regarding market growth and developments; • expectations for growth and profitability; and • statements preceded by “believe,” “expect,” “anticipate,” “foresee” or similar expressions are forward-
looking statements. Because these statements involve risks and uncertainties, actual results may differ materially from the results that we currently expect. Factors that could cause these differences include, but are not limited
to: • developments in the mobile communications market including the development of the mobile phone replacement market and the timing and success of the roll-out of new products and solutions based on 3G and
subsequent new technologies; • demand for our products and solutions; • the development of the mobile software and services market in general; • the availability of new products and services by network operators;
• market acceptance of new products and service introductions; • the intensity of competition in the mobile communications market and changes in the competitive landscape; • the impact of changes in technology; • general
economic conditions globally and in our most important markets; • pricing pressures; • consolidation or other structural changes in the mobile communications market; • the success and financial condition of our partners,
suppliers and customers; • the management of our customer financing exposure; • the success of our product development; • our success in maintaining efficient manufacturing and logistics as well as high product quality;
• our ability to source quality components and research and development without interruption and at acceptable prices; • our ability to have access to the complex technology involving patents and other intellectual property
rights included in our products and solutions; • inventory management risks resulting from shifts in market demand; • fluctuations in exchange rates, including, in particular, fluctuations between the euro, which is our
reporting currency, and the US dollar and the Japanese yen; and • the impact of changes in government policies, laws or regulations • as well as the risk factors specified Nokia’s Form 20-F for the fiscal period ended December
31, 2002 under “Item 3.D Risk Factors.”
Investor information
Annual General MeetingDate: Thursday, March 27, 2003 at 3 p.m.
Address: Hartwall Areena, Veturitie 13, Helsinki, Finland.
DividendDividend proposed by the Board of Directors for 2002 is EUR 0.28.
The dividend record date is April 1, 2003 and the dividend will be paid
April 16, 2003.
Financial reportingNokia’s quarterly reports in 2003 are due on April 17, July 17
and October 16. The 2003 results will be published in January 2004 and the
financial statements in February 2004.
Stock exchangesThe shares of Nokia Corporation are quoted on the following stock exchanges:
Symbol Trading
currency
HEX, Helsinki (quoted since 1915) NOK1V EUR
Stockholmsbörsen (1983) NOKI SEK
London Stock Exchange (1987) NOKA EUR
Frankfurter Wertpapierbörse (1988) NOA3 EUR
Bourse de Paris (1988) NOK EUR
New York Stock Exchange (1994) NOK USD
List of indices
NOK1V NOKI NOK
HEX HEX General Index OMX Stockholm NYA NYSE Composite
HEXTELE HEX Telecommunications GENX Swedish General NNA NYSE Utilities
Index GENX04 Swedish Engineer NN NYSE Utilities
HEX 20 HEX 20 Index GENX16 Swedish SX 16 Index CTN GSFO Technology
BE500 Bloomberg Europe MLO Merrill Lynch 10
BETECH BBG Europe Technology
SX5E DJ Euro STOCXX 50
SX5P DJ Europe STOXX
SX__ Various other Dj Indices
E300 FTSE Eurotop 300
Information on the Internetwww.nokia.com/investor
Investor relations [email protected]
Nokia Investor Relations Nokia Investor Relations
6000 Connection Drive P.O. Box 226
IRVING, Texas 75039 FIN-00045 NOKIA GROUP
USA tel. + 358 7180 34289
tel. +1 972 894 4880 fax +358 7180 38787
fax +1 972 894 4381
Available on the Internet: financial reports, Nokia management’s presentations,
conference call and other investor related material, press releases as well as
environmental and social information.
© Nokia 2003. Nokia and Nokia Connecting People are registered trademarks of Nokia Corporation.
Paper: Galerie Art Silk 115 g/m2
Cover: Galerie Art Gloss 250 g/m2
Printed matter
Design: Louise Boström Oy. Sävypaino ISO 9001, 2003.

66 | Nokia in 2002
NOKIA
Keilalahdentie 2–4
P.O. BOX 226
FIN-00045 NOKIA GROUP
Tel. +358 7180 08000
Fax: +358 7180 38226
E-mail: [email protected]
Nokia Networks
Keilalahdentie 2–4
P.O. BOX 300
FIN-00045 NOKIA GROUP
Tel. +358 7180 08000
Fax: +358 7180 38200
Nokia Mobile Phones
Keilalahdentie 2–4
P.O. BOX 100
FIN-00045 NOKIA GROUP
Tel. +358 7180 08000
Fax: +358 7180 45782
Nokia Ventures Organization
Itämerenkatu 11–13
P.O. BOX 209
FIN-00045 NOKIA GROUP
Tel. +358 7180 08000
Fax: +358 7180 62590
Nokia Research Center
Itämerenkatu 11–13
P.O. BOX 407
FIN-00045 NOKIA GROUP
Tel. +358 7180 08000
Fax: +358 7180 36227
General contact information

Nokia in 2002 | 67

© N
okia
200
3.N
okia
and
Nok
ia C
onne
ctin
g Pe
ople
are
reg
iste
red
trad
emar
ks o
f Nok
ia C
orpo
ratio
n.